ultrasonic surface sensing application report
TRANSCRIPT

Application ReportUltrasonic Surface Sensing
Leo Estevez MSP430 ApplicationsABSTRACT
This document describes a high-resolution ultrasonic level sensing solution. The 3D test fixture may also beused for volumetric temperature or gas concentration sensing applications.
Demo source code and schematics are provided to accelerate the development of ultrasonic sensingapplications. The files can be downloaded from USSSWLib_Gas 02_30_00_03.
For more information on the example code and GUI used in this application report, see Ultrasonic SensingSubsystem Reference Design for Gas Flow Measurement. This application report uses the standard exampleand GUI without modification.
Table of Contents1 Introduction.............................................................................................................................................................................22 Setup........................................................................................................................................................................................3
2.1 Transducer Placement....................................................................................................................................................... 42.2 EVM430-FR6043 Configuration......................................................................................................................................... 5
3 Test Results.............................................................................................................................................................................64 OpenSCAD 3D Test Fixture....................................................................................................................................................7
List of FiguresFigure 1-1. TI's Ultrasonic Subsystem.........................................................................................................................................2Figure 2-1. 3D Printed Fixture and EVM......................................................................................................................................3Figure 2-2. Jiakang 200-kHz Transducer.....................................................................................................................................3Figure 2-3. First and Second Ultrasonic Reflections................................................................................................................... 4Figure 2-4. Design Center Configuration..................................................................................................................................... 5Figure 3-1. ADC Capture............................................................................................................................................................. 6Figure 3-2. Level-Sensing Test Results....................................................................................................................................... 6
TrademarksAll other trademarks are the property of their respective owners.
www.ti.com Table of Contents
SLAA964 – SEPTEMBER 2020Submit Document Feedback
Ultrasonic Surface Sensing 1
Copyright © 2020 Texas Instruments Incorporated
1 IntroductionCurrent surface sensors often rely on contact with a surface to determine if some condition requiringmaintenance has occurred. Some examples include determining the amount of wear on a brake's surface,structural monitoring, and determining the amount of material in a machine.
Brake monitors commonly use a contacting piece of metal that makes an audible noise when the brake padneeds replacement. Contactless sensing of this wear enables predictive maintenance that can minimize downtime for manufacturing robots, fleet vehicles, and elevators. Structural monitoring of bridges and buildings can becritical to detecting problems that might be aggravated during high winds and earthquakes. Identifying low-frequency oscillations in these structures early on can be critical to avoiding future catastrophic failures. Machinematerial monitoring applications include paper counting for 2D printers, spool sensing for 3D printers, andproduction line profile scanning. Contactless sensing of surfaces in these applications is often preferred toenable maintenance to be conducted to minimize down time.
Ultrasonic technology is well suited for contactless surface and structural sensing because it does not requireembedding a sensor in the material of interest. Bridges and industrial buildings are often exposed to corrosivechemicals that limit the lifetime of embedded sensors. Braking systems often operate at higher temperatures thatcan render embedded sensors useless.
TI's ultrasonic sensing technology comprises an analog-to-digital based cross-correlation approach that usesfrequency information to determine the ultrasonic time of flight with much higher accuracy than existingthreshold-based techniques. More about how this unique algorithm works and TI's ultrasonic sensing subsystem(USS) can be found in TIDM-02005.
TI's ultrasonic sensing subsystem enables a single-chip surface or structural sensing solution that can beconnected directly to an ultrasonic transducer for high-resolution measurements. TI's USS is integrated with alow energy accelerator (LEA) and MSP CPU to enable autonomous low-power operation with an average currentconsumption of less than 20 µA (at one measurement per second).
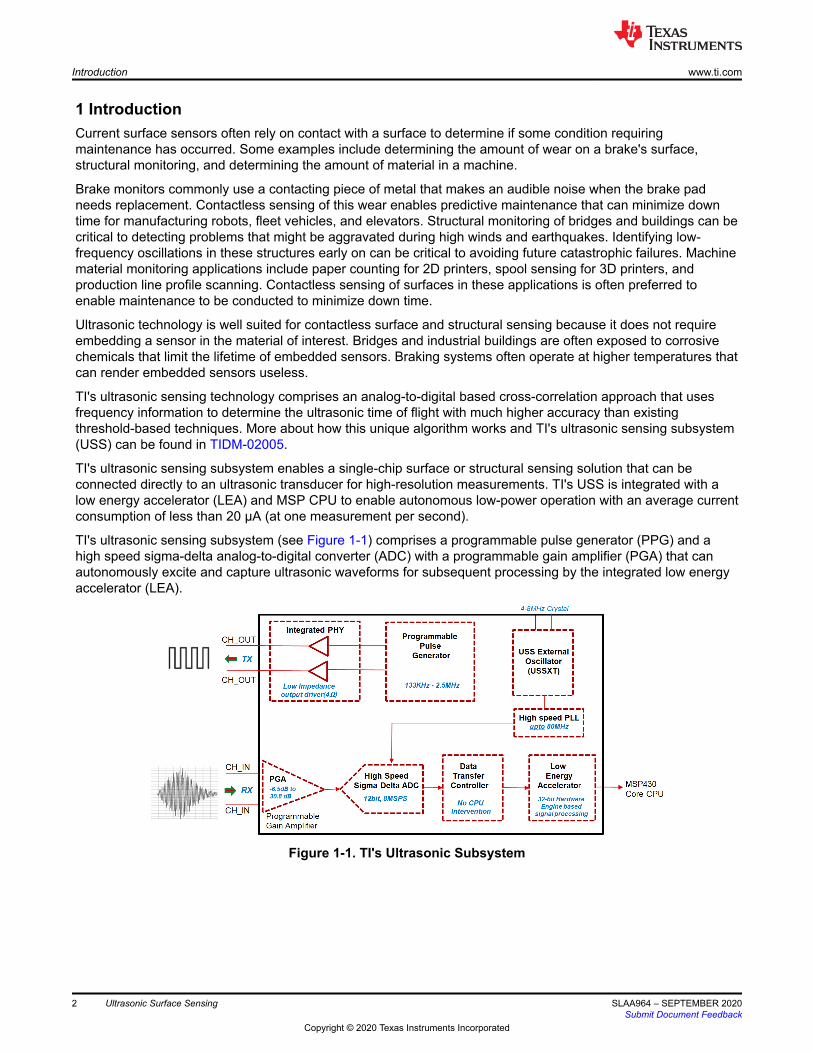
TI's ultrasonic sensing subsystem (see Figure 1-1) comprises a programmable pulse generator (PPG) and ahigh speed sigma-delta analog-to-digital converter (ADC) with a programmable gain amplifier (PGA) that canautonomously excite and capture ultrasonic waveforms for subsequent processing by the integrated low energyaccelerator (LEA).
Figure 1-1. TI's Ultrasonic Subsystem
Introduction www.ti.com
2 Ultrasonic Surface Sensing SLAA964 – SEPTEMBER 2020Submit Document Feedback
Copyright © 2020 Texas Instruments Incorporated

2 SetupThe EVM430-FR6043 is used with a single Jiakang 200-kHz transducer. A 3D printed fixture is used to mountthe transducer for experimentation. A piece of paper is inserted and removed from the fixture to demonstrate thesensitivity of the system.
Figure 2-1. 3D Printed Fixture and EVM
Figure 2-2. Jiakang 200-kHz Transducer
www.ti.com Setup
SLAA964 – SEPTEMBER 2020Submit Document Feedback
Ultrasonic Surface Sensing 3
Copyright © 2020 Texas Instruments Incorporated

2.1 Transducer PlacementTo obtain the proper signal levels, the transducer should be placed close to the surface that is being sensed. Themaximum distance that can be sensed with these transducers was found to be approximately 20 cm. Becausesome applications may be constrained with regards to space and initial excitation noise that can affect the firstreflection, the second (or third) reflection might give better (and more accurate) results. Accuracy in temperatureand gas concentration sensing applications can also be improved by increasing the distance between thetransducer and the reflecting surface.
Figure 2-3. First and Second Ultrasonic Reflections
Setup www.ti.com
4 Ultrasonic Surface Sensing SLAA964 – SEPTEMBER 2020Submit Document Feedback
Copyright © 2020 Texas Instruments Incorporated

2.2 EVM430-FR6043 ConfigurationThe EVM430-FR6043 is used in the standard gas meter configuration with one transducer connected to J8 andboth transducer connections connected together. The Design Center GUI is used to configure theMSP430FR6043 and capture data.
Design Center configuration used for testing can be seen in Figure 2-4.
Figure 2-4. Design Center Configuration
www.ti.com Setup
SLAA964 – SEPTEMBER 2020Submit Document Feedback
Ultrasonic Surface Sensing 5
Copyright © 2020 Texas Instruments Incorporated

3 Test ResultsFigure 3-1 shows the captured ADC signal with the test fixture and configuration shown in Section 2. This testwas performed at room temperature.
Figure 3-1. ADC Capture
Figure 3-2 shows that there was a change of approximately 4 µs in the absolute time of flight after removing thepiece of paper from the 3D test fixture. During the movement of the piece of paper, a transition between theupstream and downstream signals is also shown. The test setup described in this paper can sense changes inthe absolute time of flight of less than 50 ns (0.01%).
Figure 3-2. Level-Sensing Test Results
Test Results www.ti.com
6 Ultrasonic Surface Sensing SLAA964 – SEPTEMBER 2020Submit Document Feedback
Copyright © 2020 Texas Instruments Incorporated

As can be seen through this simple experiment, the MSP430FR6043 enables best-in-class surface sensing at afraction of the cost and hardware required by other solutions.
4 OpenSCAD 3D Test FixtureOpenSCAD (http://www.openscad.org/) is a freely available CAD tool that enables parametric generation of 3Dmodels and can export those models for 3D printing. The 3D test fixture used in this paper follows.
TRANSDUCER_RADIUS=8.25;PIPE_RADIUS=17;PIPE_LENGTH=95;CHANNEL_WIDTH=15;CHANNEL_HEIGHT=24;ULTRASONIC_ANGLE=90;ULTRASONIC_LENGTH=60;
union(){difference(){ union(){ translate ([0, 0, -25]) rotate([0, 0, 0]) cylinder (h = PIPE_LENGTH, r = PIPE_RADIUS); translate ([-(PIPE_RADIUS+9), .1, -13]) rotate([0, ULTRASONIC_ANGLE, 0]) cylinder (h = ULTRASONIC_LENGTH, r = TRANSDUCER_RADIUS+2); } union(){ translate ([-(CHANNEL_HEIGHT/2), -CHANNEL_WIDTH/2, -25]) rotate([0, 0, 0]) cube ([CHANNEL_HEIGHT,CHANNEL_WIDTH,PIPE_LENGTH]); translate ([-(PIPE_RADIUS+9), 0, -13]) rotate([0, ULTRASONIC_ANGLE, 0]) cylinder (h = 150, r = TRANSDUCER_RADIUS); }}union(){ translate ([-(CHANNEL_HEIGHT/2), -CHANNEL_WIDTH, -15]) rotate([0, 0, 0]) cube ([CHANNEL_HEIGHT,CHANNEL_WIDTH/2,PIPE_LENGTH-20]);
translate ([-(CHANNEL_HEIGHT/2), CHANNEL_WIDTH/2, -15]) rotate([0, 0, 0]) cube ([CHANNEL_HEIGHT,CHANNEL_WIDTH/2,PIPE_LENGTH-20]); // Flow plates translate ([-(CHANNEL_HEIGHT/2)-1, -CHANNEL_WIDTH/2, -25]) rotate([0, 0, 0]) cube ([1,CHANNEL_WIDTH,20]); translate ([-(CHANNEL_HEIGHT/2)-1, -CHANNEL_WIDTH/2, 12]) rotate([0, 0, 0]) cube ([1,CHANNEL_WIDTH,20]); translate ([(CHANNEL_HEIGHT/2), -CHANNEL_WIDTH/2, PIPE_LENGTH-45]) rotate([0, 0, 0]) cube ([1,CHANNEL_WIDTH,20]); translate ([(CHANNEL_HEIGHT/2), -CHANNEL_WIDTH/2, PIPE_LENGTH-85]) rotate([0, 0, 0]) cube ([1,CHANNEL_WIDTH,20]);
}}
www.ti.com OpenSCAD 3D Test Fixture
SLAA964 – SEPTEMBER 2020Submit Document Feedback
Ultrasonic Surface Sensing 7
Copyright © 2020 Texas Instruments Incorporated

IMPORTANT NOTICE AND DISCLAIMER
TI PROVIDES TECHNICAL AND RELIABILITY DATA (INCLUDING DATASHEETS), DESIGN RESOURCES (INCLUDING REFERENCE DESIGNS), APPLICATION OR OTHER DESIGN ADVICE, WEB TOOLS, SAFETY INFORMATION, AND OTHER RESOURCES “AS IS” AND WITH ALL FAULTS, AND DISCLAIMS ALL WARRANTIES, EXPRESS AND IMPLIED, INCLUDING WITHOUT LIMITATION ANY IMPLIED WARRANTIES OF MERCHANTABILITY, FITNESS FOR A PARTICULAR PURPOSE OR NON-INFRINGEMENT OF THIRD PARTY INTELLECTUAL PROPERTY RIGHTS.These resources are intended for skilled developers designing with TI products. You are solely responsible for (1) selecting the appropriate TI products for your application, (2) designing, validating and testing your application, and (3) ensuring your application meets applicable standards, and any other safety, security, or other requirements. These resources are subject to change without notice. TI grants you permission to use these resources only for development of an application that uses the TI products described in the resource. Other reproduction and display of these resources is prohibited. No license is granted to any other TI intellectual property right or to any third party intellectual property right. TI disclaims responsibility for, and you will fully indemnify TI and its representatives against, any claims, damages, costs, losses, and liabilities arising out of your use of these resources.TI’s products are provided subject to TI’s Terms of Sale (www.ti.com/legal/termsofsale.html) or other applicable terms available either on ti.com or provided in conjunction with such TI products. TI’s provision of these resources does not expand or otherwise alter TI’s applicable warranties or warranty disclaimers for TI products.
Mailing Address: Texas Instruments, Post Office Box 655303, Dallas, Texas 75265Copyright © 2020, Texas Instruments Incorporated