ultrasonic velocity studies of amino acids in
TRANSCRIPT

www.wjpps.com Vol 5, Issue 1, 2016.
1423
Nagaraj et al. World Journal of Pharmacy and Pharmaceutical Sciences
ULTRASONIC VELOCITY STUDIES OF AMINO ACIDS IN AQUEOUS
TERTIARY BUTYL ALCOHOL AT 303.15K
S. Nagaraj1*
, M.C.S. Subha2, C. Nagamani
3 and K. Chowdoji Rao
4
*1
Department of Chemistry, IIBS, R T Nagar, Bangalore – 560 032 Karantaka, India.
2Department of Chemistry, S.K. University, Anantapur – 515003 A.P., India.
3Department of Chemistry, Vijaya College, Bangalore – 560 004 Karnataka, India.
4Department of Polymer Science and Technology, S.K. University, Anantapur – 515003 A.P.,
India.
ABSTRACT
Ultrasonic velocity and Adiabatic compressibility of Glycine, DL-
Alanine, L-Valine and L-Arginine HCL have been measured in Water
+ Tertiary Butyl Alcohol (TBA) mixtures ranging from pure water to
80% TBA by mass at 303.15K. From the Ultrasonic Velocity, the
adiabatic compressibility of the four amino acids in the mixtures has
been calculated. From the Ultrasonic Velocity and adiabatic
compressibility, apparent molar compressibility, intermolecular free
length and change in free energy were calculated. These values were
interpreted in terms of structure-breaking or structure making effects of
these amino acids in the water + TBA mixtures.
KEYWORDS: Apparent molar volume, Density, Viscosity, Amino acids, Tertiary butyl
alcohol.
1. INTRODUCTION
Proteins are the large, complex molecules composed of smaller structural subunits called
amino acids. Since proteins are large molecules, the direct study of protein-water interactions
is difficult. So it can be studied by the interaction of amino acids in aqueous and mixed
aqueous solutions.[1-4]
The process of hydration plays an important role in the stability,
dynamics, structural characteristics and functional activities of the amino acids. The
physiochemical and thermodynamic properties in aqueous solution provides the information
about solute-solute and solute-solvent interactions. The ultrasonic velocity measurements find
WORLD JOURNAL OF PHARMACY AND PHARMACEUTICAL SCIENCES
SJIF Impact Factor 5.210
Volume 5, Issue 1, 1423-1441 Research Article ISSN 2278 – 4357
Article Received on
19 Oct 2015,
Revised on 10 Dec 2015,
Accepted on 30 Dec 2015
*Correspondence for
Author
S. Nagaraj
Department of Chemistry,
IIBS, R T Nagar,
Bangalore – 560 032
Karantaka, India.

www.wjpps.com Vol 5, Issue 1, 2016.
1424
Nagaraj et al. World Journal of Pharmacy and Pharmaceutical Sciences
wide applications in characterizing the physico-chemical behaviour of liquid mixtures[9-11]
and in the study of molecular interactions. Ultrasonic velocity of a liquid is related to the
binding forces between the atoms or the molecules. Ultrasonic velocities have been
adequately employed in understanding the nature of molecular interaction in pure liquids[12]
,
binary and ternary mixtures.[13-15]
The method of studying the molecular interaction from the
knowledge of variation of thermodynamic parameter values with composition gives an
insight into the molecular process.[16-21]
The attempts made by Ernst and Glinski[22]
and
Kiyohara et al.[23,24]
indicate that ultrasonic velocities evaluated making use of
thermodynamically valid expressions may be utilized to obtain excess Ultrasonic velocities
which are useful in understanding the binary liquid mixtures interactions. It is worthwhile to
note here that Kudriavtsev.[25]
derived expressions for evaluating theoretically the velocity of
sound in pure liquids and liquid mixtures based on thermodynamically valid equations for
internal energy in liquids and liquid mixtures and found that the expressions yield velocity
data in good agreement with the experimental data for binary mixtures. From the Ultrasonic
velocity (µ); adiabatic compressibility (), apparent molar compressibility (φK),
intermolecular free length (Lf) and change in free energy (ΔG) were calculated. These
parameters were used to discuss the solute-solvent/co solvent and solute-solute interactions.
MATERIALS AND METHODS
All the chemicals used are of analytical grade. Commercially obtained chemicals were further
purified wherever necessary. In the present investigation, a single crystal variable path
interferometer was used to measure the ultrasonic velocities of the solutions. From the
knowledge of wavelength (λ), the ultrasonic velocity (µ) can be calculated by the relation .
Velocity = Wavelength x Frequency
µ = λf (1)
Adiabatic compressibility () is an important parameter which throws light on the solute-
solvent interactions in solutions. This parameter is widely used to study the behavior of
amino acids in solutions. The adiabatic compressibility () is expressed as.
= 1/ dµ2
(2)
Where µ is ultrasonic velocity and d is density of the medium.

www.wjpps.com Vol 5, Issue 1, 2016.
1425
Nagaraj et al. World Journal of Pharmacy and Pharmaceutical Sciences
Apparent molar compressibility (Φk) can be defined as a measure of intermolecular
association or dissociation or repulsion. This parameter describes about the interactions
between the molecules. The apparent molar compressibility (ΦK) is expressed as
Φk = 1000/Cd0 (d0β- dβ0) + β0M/ d0 (3)
Where d, β and d0, β0 are the densities and the adiabatic compressibilities of solvent and
solution respectively, C is molar concentration of the solute and M is molar mass of the
solute.
The intermolecular free-length is the distance covered by a sound wave between the surfaces
of the neighboring molecules and is given by Jacobson as
Lf = K(β)1/2
(4)
Where „K‟ is the temperature dependant constant and „β‟ is the adiabatic compressibility.
The change in free energy of activation is calculated by
ΔG = - KB T ln (h/τ KB T) kJmol-1
(5)
Where, KB is Boltzmann‟s constant (1.3806 x 10⁻²³
JK-1
), T is temperature, h is Planck‟s
constant (6.626 x 10⁻³⁴
Js) and τ is the relaxation time.
Table 1: Change in Ultrasonic Velocity, Adiabatic compressibility, Apparent Molar
Compressibility, Intermolecular Free length and Change in Free Energy of Amino acids
in Water at 303.15K.
Conc
(g mol l-1
)
Density (d)
(g cm-3
)
Ultrasonic
Velocity
(ms-1
)
Adiabatic
Compressibility
(β)
(x10-10
m2 N
-1)
Apparent molar
compressibility
(-Φk)
(x10-7
m2 N
-1)
Intermolecular
free-length (Lf)
(10-11
m)
Change in
Free Energy
(-ΔG)
(kJmol-1
)
Glycine + Water
0 0.9953 1501.95 4.45 - 5.13 -
0.001 0.9953 1502.52 4.45 3.08 5.13 5.05
0.005 0.9954 1504.73 4.43 2.96 5.12 5.05
0.01 0.9956 1507.37 4.42 2.86 5.12 5.05
0.05 0.9969 1527.01 4.3 2.84 5.08 5.05
0.07 0.9975 1536.33 4.24 2.76 5.06 5.06
0.1 0.9984 1549.57 4.17 2.64 5.04 5.06
DL-Alanine + Water
0 0.9953 1504.16 4.44 - 5.12 -
0.001 0.9953 1504.63 4.4 3.27 5.11 5.05
0.005 0.9954 1506.52 4.42 3.24 5.1 5.05
0.01 0.9956 1508.78 4.41 3.22 5.09 5.06
www.wjpps.com Vol 5, Issue 1, 2016.
1426
Nagaraj et al. World Journal of Pharmacy and Pharmaceutical Sciences
0.05 0.9967 1527.56 4.29 3.16 5.08 5.06
0.07 0.9973 1536.93 4.24 3.14 5.06 5.07
0.1 0.9981 1551.21 4.16 3.11 5.05 5.07
L-Valine + Water
0 0.9953 1502.76 4.44 - 5.13 -
0.001 0.9953 1503.36 4.44 3.21 5.12 5.05
0.005 0.9954 1505.73 4.43 3.18 5.12 5.05
0.01 0.9955 1508.7 4.41 3.16 5.11 5.06
0.05 0.9966 1532.5 4.27 3.09 5.07 5.06
0.07 0.9971 1544.6 4.2 3.05 5.05 5.07
0.1 0.9979 1562.9 4.1 3.03 5.02 5.07
L-Arginine HCl + Water
0 0.9953 1501.95 4.47 - 5.13 -
0.001 0.9956 1502.19 4.45 2.64 5.13 5.05
0.005 0.9957 1504.84 4.43 2.64 5.12 5.05
0.01 0.9962 1507.48 4.41 2.58 5.11 5.05
0.05 0.999 1530.95 4.27 2.57 5.07 5.06
0.07 1.0003 1542.73 4.2 2.55 5.05 5.06
0.1 1.0024 1560.35 4.09 2.53 5.01 5.06
Table 2: Change in Ultrasonic Velocity, Adiabatic compressibility, Apparent Molar
Compressibility, Intermolecular Free length and Change in Free Energy of Amino acids
in 20% TBA at 303.15K.
Conc Density
(d)
Ultrasonic
Velocity
Adiabatic
Compressibility
(β)
Apparent molar
compressibility
(-Φk)
Intermolecular
free-length
(Lf)
Change in
Free Energy
(-ΔG)
(g mol l-1
) (g cm-3
) (ms-1
) (x10-10
m2 N
-1) (x10
-7 m
2 N
-1) (10
-11m) (kJmol
-1)
Glycine in 20% TBA + 80% Water
0 0.9717 1606.2 3.98 - 5.02
0.001 0.9717 1606.73 3.98 2.6 5.02 5.07
0.005 0.9718 1608.78 3.97 2.51 5.01 5.07
0.01 0.972 1611.22 3.96 2.42 5.01 5.08
0.05 0.9732 1627.1 3.88 2.06 4.98 5.09
0.07 0.9738 1633.75 3.84 1.94 4.97 5.09
0.1 0.9746 1645.34 3.79 1.8 4.95 5.09
DL-Alanine in 20% TBA + 80% Water
0 0.9717 1606.21 3.96 - 5 -
0.001 0.9726 1665.21 3.99 2.52 4.99 5.07
0.005 0.9737 1665.35 3.98 2.46 4.98 5.07
0.01 0.9745 1606.43 3.97 2.33 4.96 5.08
0.05 0.9779 1620.06 3.89 2.27 4.94 5.08
0.07 0.9791 1627.72 3.85 2.15 4.93 5.08
0.1 0.9803 1640.06 3.79 2.02 4.91 5.08
L-Valine in 20% TBA + 80% Water
0 0.9717 1608.35 3.97 - 5.01 -
0.001 0.9717 1608.95 3.97 2.5 5.01 5.07
0.005 0.9718 1611.35 3.96 2.49 5.01 5.07

www.wjpps.com Vol 5, Issue 1, 2016.
1427
Nagaraj et al. World Journal of Pharmacy and Pharmaceutical Sciences
0.01 0.972 1614.31 3.94 2.48 5 5.08
0.05 0.9731 1637.9 3.83 2.4 4.96 5.09
0.07 0.9737 1649.95 3.77 2.39 4.95 5.09
0.1 0.9746 1667.66 3.68 2.34 4.94 5.09
L-Arginine HCl in 20% TBA + 80% Water
0 0.9717 1606.21 3.98 - 5.02 -
0.001 0.9717 1606.72 3.98 2.35 5.02 5.08
0.005 0.972 1608.75 3.97 2.32 5.01 5.08
0.01 0.9724 1611.26 3.96 2.29 5.01 5.08
0.05 0.9751 1631.06 3.85 2.21 4.97 5.08
0.07 0.9765 1640.88 3.8 2.18 4.95 5.08
0.1 0.9785 1655.65 3.72 2.15 4.92 5.08
Table 3: Change in Ultrasonic Velocity, Adiabatic compressibility, Apparent Molar
Compressibility, Intermolecular Free length and Change in Free Energy of Amino acids
in 40% TBA at 303.15K.
Conc Density
(d)
Ultrasonic
Velocity
Adiabatic
Compressibility
(β)
Apparent molar
compressibility
(-Φk)
Intermolecular
free-length
(Lf)
Change in
Free Energy
(-ΔG)
(g mol l-1
) (g cm-3
) (ms-1
) (x10-10
m2
N-1
) (x10-7
m2 N
-1) (10
-11m) (kJmol
-1)
Glycine in 40% TBA + 60% Water
0 0.9382 1674.75 3.79 - 5 -
0.001 0.9383 1675.27 3.79 2.39 5 5.1
0.005 0.9384 1677.23 3.78 2.34 5 5.11
0.01 0.9385 1679.3 3.77 2.16 4.99 5.11
0.05 0.9396 1693.94 3.7 1.75 4.97 5.11
0.07 0.9403 1699.66 3.68 1.64 4.96 5.11
0.1 0.9412 1707.47 3.64 1.49 4.94 5.11
DL-Alanine in 40% TBA + 60% Water
0 0.9382 1676.25 3.79 - 4.95 -
0.001 0.9717 1676.65 3.79 1.9 4.94 5.09
0.005 0.9384 1678.11 3.78 1.88 4.94 5.1
0.01 0.9385 1679.94 3.77 1.76 4.93 5.1
0.05 0.9397 1694.15 3.7 1.69 4.92 5.1
0.07 0.9403 1700.95 3.67 1.55 4.91 5.1
0.1 0.9411 1711.62 3.62 1.44 4.9 5.1
L-Valine in 40% TBA + 60% Water
0 0.9382 1679.16 3.79 - 4.99 -
0.001 0.9383 1679.65 3.77 2.24 4.99 5.1
0.005 0.9384 1681.6 3.76 2.21 4.99 5.11
0.01 0.9385 1684 3.75 2.19 4.99 5.11
0.05 0.9396 1703.03 3.66 2.11 4.95 5.11
0.07 0.9402 1712.14 3.62 2.08 4.95 5.11
0.1 0.941 1725.7 3.56 2.05 4.93 5.11
L-Arginine HCl in 40% TBA + 60% Water
0 0.9382 1674.75 3.79 - 5 -
0.001 0.9383 1675.16 3.79 2.77 5 5.1

www.wjpps.com Vol 5, Issue 1, 2016.
1428
Nagaraj et al. World Journal of Pharmacy and Pharmaceutical Sciences
0.005 0.9386 1675.81 3.79 2.75 5 5.1
0.01 0.9389 1676.83 3.78 2.75 5 5.1
0.05 0.9417 1684.27 3.74 2.65 4.96 5.1
0.07 0.943 1688.18 3.72 2.62 4.95 5.1
0.1 0.9451 1692.45 3.69 2.55 4.91 5.1
Table 4: Change in Ultrasonic Velocity, Adiabatic compressibility, Apparent Molar
Compressibility, Intermolecular Free length and Change in Free Energy of Amino acids
in 60% TBA at 303.15K.
Conc Density
(d)
Ultrasonic
Velocity
Adiabatic
Compressibility
(β)
Apparent molar
compressibility
(-Φk)
Intermolecular
free-length
(Lf)
Change in
Free Energy
(-ΔG)
(g mol l-1
) (g cm-3
) (ms-1
) (x10-10
m2 N
-1) (x10
-7 m
2 N
-1) (10
-11m) (kJmol
-1)
Glycine in 60% TBA + 40% Water
0 0.9081 1739.5 3.63 - 4.99 -
0.001 0.9081 1739.9 3.63 1.82 4.99 5.11
0.005 0.9082 1741.47 3.63 1.77 4.98 5.11
0.01 0.9085 1743.13 3.62 1.81 4.98 5.12
0.05 0.9096 1745.43 3.6 0.69 4.97 5.12
0.07 0.9101 1747.23 3.59 0.57 4.97 5.12
0.1 0.911 1749.33 3.58 0.37 4.96 5.13
DL-Alanine in 60% TBA + 40% Water
0 0.9081 1739.52 3.63 - 4.88 -
0.001 0.9081 1739.63 3.63 1.36 4.88 5.11
0.005 0.9082 1740.07 3.63 1.08 4.88 5.11
0.01 0.9084 1740.47 3.63 0.84 4.87 5.11
0.05 0.9095 1744.15 3.61 0.71 4.87 5.11
0.07 0.9101 1745.21 3.6 0.62 4.86 5.11
0.1 0.9109 1746.93 3.59 0.56 4.86 5.11
L-Valine in 60% TBA + 40% Water
0 0.9081 1750.25 3.59 - 4.97 -
0.001 0.9081 1750.44 3.59 1.96 4.97 5.11
0.005 0.9082 1751.14 3.59 1.86 4.96 5.11
0.01 0.9084 1751.98 3.58 1.84 4.95 5.12
0.05 0.9095 1757.98 3.55 1.7 4.94 5.12
0.07 0.91 1760.6 3.54 1.6 4.93 5.12
0.1 0.9109 1763.97 3.52 1.59 4.91 5.13
L-Arginine HCl in 60% TBA + 40% Water
0 0.9081 1750.25 3.59 - 4.97 -
0.001 0.9082 1750.87 3.59 1.63 4.97 5.1
0.005 0.9084 1751.87 3.58 1.58 4.97 5.11
0.01 0.9088 1756.83 3.56 1.31 4.96 5.11
0.05 0.9116 1760.22 3.54 1.24 4.94 5.11
0.07 0.913 1764.38 3.51 1.15 4.93 5.11
0.1 0.915 1766.25 3.5 1.05 4.91 5.11

www.wjpps.com Vol 5, Issue 1, 2016.
1429
Nagaraj et al. World Journal of Pharmacy and Pharmaceutical Sciences
Table 5: Change in Ultrasonic Velocity, Adiabatic compressibility, Apparent Molar
Compressibility, Intermolecular Free length and Change in Free Energy of Amino acids
in 80% TBA at 303.15K.
Conc Density
(d)
Ultrasonic
Velocity
Adiabatic
Compressibility
(β)
Apparent molar
compressibility
(-Φk)
Intermolecular
free-length
(Lf)
Change in
Free Energy
(-ΔG)
(g mol l-1
) (g cm-3
) (ms-1
) (x10-10
m2 N
-1) (x10
-7 m
2 N
-1) (10
-11m) (kJmol
-1)
Glycine in 80% TBA + 20% Water
0 0.8929 1815.24 3.4 - 4.93 -
0.001 0.8929 1815.23 3.4 1.29 4.93 5.12
0.005 0.893 1815.22 3.39 1.09 4.92 5.12
0.01 0.8931 1815.25 3.39 0.93 4.92 5.13
0.05 0.8942 1816.51 3.38 0.33 4.92 5.12
0.07 0.8947 1817.6 3.38 0.13 4.92 5.12
0.1 0.8955 1820.25 3.4 0.11 4.92 5.13
DL-Alanine in 80% TBA + 20% Water
0 0.8929 1799.51 3.45 - 4.91 -
0.001 0.8929 1799.48 3.45 0.23 4.91 5.11
0.005 0.893 1799.4 3.45 0.19 4.9 5.11
0.01 0.8931 1799.39 3.45 0.12 4.9 5.12
0.05 0.8943 1799.95 3.45 0.09 4.9 5.12
0.07 0.8948 1800.61 3.44 0.06 4.9 5.12
0.1 0.8957 1801.73 3.43 0.05 4.9 5.12
L-Valine in 80% TBA + 20% Water
0 0.8929 1815.24 3.39 - 4.96 -
0.001 0.8929 1815.23 3.39 1.64 4.95 5.11
0.005 0.893 1815.22 3.39 1.53 4.94 5.11
0.01 0.8931 1815.25 3.39 1.48 4.93 5.12
0.05 0.8942 1816.51 3.38 1.47 4.93 5.12
0.07 0.8947 1817.6 3.38 1.46 4.91 5.12
0.1 0.8955 1820.25 3.37 1.45 4.91 5.13
L-Arginine HCl in 80% TBA + 20% Water
0 0.8929 1815.24 3.39 - 4.95 -
0.001 0.8929 1815.96 3.39 0.89 4.94 5.11
0.005 0.8932 1817.08 3.39 0.72 4.93 5.11
0.01 0.8936 1819.66 3.37 0.52 4.92 5.11
0.05 0.8963 1820.93 3.36 0.35 4.91 5.11
0.07 0.8998 1821.46 3.34 0.23 4.9 5.12
0.1 0.8997 1822.74 3.34 0.18 4.89 5.12
RESULTS AND DISCUSSION
Ultrasonic Velocity has been measured for four amino acids in water over the concentration
range from 0.001 to 0.1m solution. Parameters like Adiabatic Compressibility (β), Apparent
Molar Compressibility (ΦK), Intermolecular Free length (Lf) and Change in Free Energy

www.wjpps.com Vol 5, Issue 1, 2016.
1430
Nagaraj et al. World Journal of Pharmacy and Pharmaceutical Sciences
(ΔG) have been calculated from the measured ultrasonic velocities, densities and
viscosities.[26]
Ultrasonic Velocity
In Water
The measured ultrasonic velocities of the four amino acids (Glycine, DL-Alanine, L_Valine
and L-Arginine HCl) in water are included in table 1.
The measured ultrasonic velocity values in the present study increase with the increase in the
concentration of all the four amino acids under study. The increase or decrease in ultrasonic
velocity depends on the structural properties of solute. The rising trend in the ultrasonic
velocity with concentration is due to the cohesion brought about by ionic hydration. The
electrostriction effect which brings about the shrinkage in the volume of solvent caused by
zwitterion portion of amino acid is increased in the solvent. This implies that all the amino
acids in water behave like structure makers.[27]
It is observed that as the chain length of the
four amino acids under study increases, cohesion between them becomes stronger. This
means the structure making ability of these four amino acids in water show the following
trend.
L-Arginine HCl > L-Valine > DL- Alanine > Glycine.
A similar report was reported by Thirumaran et al in their ultrasonic velocity studies on four
amino acids i.e. L-alanine, L-Leucine, L-Valine and L-Proline in water.[28]
In Aqueous TBA mixtures
The measured Ultrasonic Velocities along with densities of Glycine, DL-Alanine, L-Valine,
and L-Arginine HCl in different TBA + Water Mixtures (20% TBA + 80% Water, 40% TBA
+ 60% Water, 60% TBA + 40% Water, 80% TBA + 20% Water) at 303.15K are presented in
Tables 2 to 5 respectively.
In the present study the values of ultrasonic velocity increases with the increase in the
concentration of TBA. These trends clearly suggest the presence of ionic, dipolar and
hydrophilic interactions occurring in the systems under study. Since more number of water
molecules is surrounding the TBA and amino acid molecules, the chances for the penetration
of solute into the solvent are highly favored. Further, the increasing values of ultrasonic
velocity with the increase in the TBA concentration in the concerned systems reveal about the

www.wjpps.com Vol 5, Issue 1, 2016.
1431
Nagaraj et al. World Journal of Pharmacy and Pharmaceutical Sciences
more strengthening in solute-solvent interactions existing in these mixtures. These values also
suggest that TBA has an induced effect on the weakening of solute-solute interactions
between amino acids.
The increasing trend of ultrasonic velocity values is due to disruption of side group hydration
by that of the charged end. The increase in ultrasonic velocity values from Glycine, DL-
Alanine, L-Valine and L-Arginine HCl may be attributed to the increase in hydrophobic-
hydrophobic interactions between R-Group of amino acids and R-group of TBA. It is evident
from the Table 6.5 to 6.8 and figures 6.46 to 6.49 that the positive values of ultrasonic
velocity in all the four amino acid systems clearly indicate the presence of strong solute-
solvent interactions. Further it can be concluded that the amino acid systems under study
possess structure making tendency of the solute molecules in the solvent in the following
order.
L-Arg. HCl >L-Val >DL-Ala>Gly.
Similar observations are reported by Rajinder K Bamezai et al from their studies on L-
Threonine in aqueous THF at 313.15 K.[27]
Adiabatic compressibility
In Water
By using the Eq. (2) the values of adiabatic compressibility (β) of Glycine, DL-Alanine, L-
Valine and L-Arginine HCl in water at 303.15K were calculated from measured density and
Ultrasonic velocity values. These values are included in table 1.
Adiabatic compressibility (β) is found to be decreased with increasing concentration of amino
acids. This kind of trends implies that there is an enhanced molecular association in the
systems under study on increase in the solute content. The decrease in adiabatic
compressibility is attributed to the influence of electrostatic fields of ions on the surrounding
molecules so called electrostriction. The increasing electrostrictive compression of water
around the molecules results in a large decrease in the compressibility of the solution. A
similar observation was made Anjana et al from the compressibility function study threonine
in mixed aqueous THF solutions.[27]
As the chain length increases among amino acids under study the adiabatic compressibility of
these in water are in the following order.

www.wjpps.com Vol 5, Issue 1, 2016.
1432
Nagaraj et al. World Journal of Pharmacy and Pharmaceutical Sciences
Glycine >DL-Alanine>L-Valine>L-Arginine.
This trend is expected one because these values are reciprocal of ultrasonic velocity values.
In Aqueous TBA mixtures
By using the Eq. (2) the values of adiabatic compressibility (β) of Glycine, DL-Alanine, L-
Valine and L-Arginine HCl in different TBA + Water Mixtures (20% TBA + 80% Water,
40% TBA + 60% Water, 60% TBA + 40% Water, 80% TBA + 20% Water) at 303.15K were
calculated from measured density and Ultrasonic velocity values. These values are presented
in Tables 2 to 5 respectively.
The values of adiabatic compressibility decrease with the increase in the concentration of
TBA. This kind of trends generally confirms the strong solute-solvent interactions in the
present amino acid-aqueous TBA systems. It is also noticed that there exists an
intermolecular interaction of electrostriction, hydrophilic-hydrophobic, hydrophobic-
hydrophobic, ionic-dipolar and ion-solvent nature between the amino acids and aqueous TBA
molecules which brings these molecules closer. The existence of ion-solvent/solute-solvent
interactions resulting in attractive forces promotes the structure making tendency of amino
acids. The existence of molecular interactions in the present study is in the order,
L-Arginine HCl >L-Valine >DL-Alanine >Glycine.
The values of adiabatic compressibility shows an inverse behavior compared to the ultrasonic
velocity in the mixtures with increase in concentration. It is primarily the compressibility that
changes with the structure and this lead to the change in ultrasonic velocity. This may be due
to the increase in side chain of the amino acid molecules under study. The increase in the side
chain of the interacting molecules leads to the breaking up of the molecular clustering of the
other, thereby releasing several dipoles for the interactions. In view of greater force of
interaction between the molecules there will be an increase in cohesive energy and the
occurrence of structural changes, take place due to the existence of electrostatic field. Thus
structural arrangement of molecules results in increasing adiabatic compressibility there by
showing progressively intermolecular interactions. A similar report was reported by
Thirumaran et al in their adiabatic compressibility studies on four amino acids i.e. L-alanine,
L-Leucine, L-Valine and L-Proline in water.[28]
www.wjpps.com Vol 5, Issue 1, 2016.
1433
Nagaraj et al. World Journal of Pharmacy and Pharmaceutical Sciences
Apparent Molar Compressibility (φK)
In Water
By using the Eq. (3) the values of apparent molar compressibility (ΦK) of Glycine, DL-
Alanine, L-Valine and L-Arginine HCl in water at 303.15K were calculated from their
measured density and Ultrasonic velocity values. These values are reported in table 1 and the
variations of apparent molar compressibility (ΦK) with concentration of all the four amino
acids are shown in the Graph 1.1.
In the present investigation the values of the apparent molar compressibility increases with
the increase in the concentration of amino acids. The values are found to be negative which
may be due to strong electrostrictive forces in the vicinity of ions, causing electrostrictive
solvation of ions[29]
. This may also be due to the approach of water molecules around the
complex and formation of weak bonding between oxygen atom of water molecule and H-
atom of the amino acid. With increase in chain length of amino acids the values of ΦK are in
the following order from the point of view of –ve ΦK
L-Arginine>L-Valine>DL-Alanine>Glycine.
A similar observations was reported by R Palani et al in their apparent molar compressibility
studies of L-Serine, L-Proline and L-Histidine in aqueous 1,4-dioxane solutions at 298.15
K.[30]
In Aqueous TBA mixtures
By using equation (3), the apparent molar compressibility of Glycine, DL-Alanine, L-Valine
and L-Arginine HCl in aqueous TBA at 303.15K has been calculated using the measured
ultrasonic velocity and density values. These values are presented in tables 2 to 5 and the
variations of apparent molar volume with concentration among the studied amino acids have
been graphically represented in figures 1.2 to 1.5 respectively.
From tables 2 to 5 and figures 1.2 to 1.5 it is evident that Apparent Molar Compressibility
values increase with the increase in the concentration of all amino acids under study. The
values thus obtained are in a negative range.
In the present investigation the following results were obtained
1. The values of φk are all negative over the entire range of molarity of amino acids.

www.wjpps.com Vol 5, Issue 1, 2016.
1434
Nagaraj et al. World Journal of Pharmacy and Pharmaceutical Sciences
2. The φk values are increasing with increasing molarity of the solute in Glycine, DL-
Alanine, L-Valine and L-Arginine HCl amino acid systems.
3. Also φk increase with increase in TBA concentration in all the four amino acid systems.
4. A linear relation between φk and solute has been observed throughout the concentration
range.
The observations clearly suggest that the negative values of φk indicate ionic, dipolar and
hydrophilic interactions occurring in these systems. Further, the increasing values of φk in the
concerned systems reveal the strong strengthening in solute-solvent interactions existing in
these mixtures. There is an increase in the φk values with the increase in the % of TBA. The
increasing trend is also observed from Glycine to L-Arginine HCl with the increase in the
carbon chain length in side chains. These trends can be understood based on the various
interactions occurring between the amino acid-solvent and co-solvent molecules.
FIG 1.1 - ΦK Values in Pure Water.
FIG 1.2 - ΦK Values in 20% TBA.

www.wjpps.com Vol 5, Issue 1, 2016.
1435
Nagaraj et al. World Journal of Pharmacy and Pharmaceutical Sciences
FIG 1.3 - ΦK Values in 40% TBA.
FIG 1.4 - ΦK Values in 60% TBA.
FIG 1.5- ΦK Values in 80% TBA.
X Axis – Concentrations of Amino acids in gmol-1
Y Axis - ΦK Values of Amino Acids in x10-10
m2 N
-1

www.wjpps.com Vol 5, Issue 1, 2016.
1436
Nagaraj et al. World Journal of Pharmacy and Pharmaceutical Sciences
Intermolecular free length (Lf)
In water
By using the Eq. (4) the values of Intermolecular free length (Lf) of Glycine, DL-Alanine, L-
Valine and L-Arginine HCl in water at 303.15K were calculated from measured density and
ultrasonic velocity values. These values are included in table 1 and the variations of
Intermolecular free length (Lf) with concentration of these amino acids are shown in the
figure 2.1.
In the present investigation the values of intermolecular free length decreases with the
increase in the concentration of amino acids. The decrease in free length with increase in
concentration indicates that there are significant interactions between solute and the solvent
molecules, suggesting a structure promoting behavior on addition of solute to solvent. These
results are also supported by the ultrasonic velocity data as explained above. The values of
the free length (Lf) for the four amino acids in water in the current studies follow the order
given below.
Glycine > DL-Alanine > L-Valine > L-Arginine.
This trend indicates the presence of more interactions with the increase in carbon chain
length. A similar observation was reported by Rita Mehra et al from their intermolecular free
length studies of DL-Alanine in aqueous galactose solutions in the presence of NaCl at
different temperatures.[31]
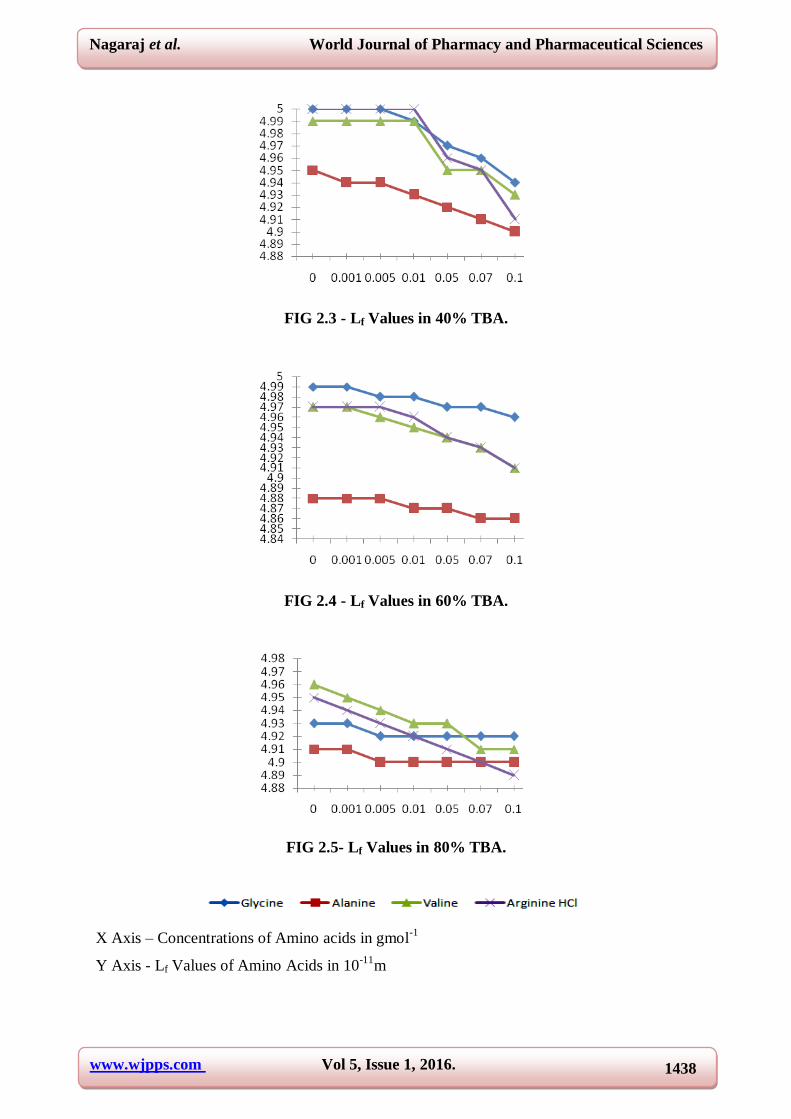
In Aqueous TBA mixtures
The free length of Glycine, DL-Alanine, L-Valine and L-Arginine HCl in aqueous TBA at
303.15K has been calculated using the equation (4) from the measured ultrasonic velocity and
density values. These values are presented in tables 2 to 5 and the variation of Lf Vs
concentration of the studied amino acids have been graphically represented in figures 2.2 to
2.5 respectively.
The value of free length decreases with chain length of amino acids. This suggests that the
increase of chain length offers more sterric hindrance on mutual correlation between different
molecules in the solution. It may there be concluded that the resultant interactions in the
amino acid systems of the present study, is not solely dependent on the molecular structure
of the components, but also, influenced by other factors like dispersion forces, dipole-dipole
interaction, hydrogen bonding, charge transfer interaction and/or complex formation.
www.wjpps.com Vol 5, Issue 1, 2016.
1437
Nagaraj et al. World Journal of Pharmacy and Pharmaceutical Sciences
However it was observed that the polarity and size of the components plays a significant role
in determining the strength of molecular interaction in a mixture. A similar abservation was
reported by Katsutaka sasaki et al from their ultrasonic studies of amino acids in aqueous
solutions.[32]
The values of the free length for the four amino acids under study in aqueous TBA mixtures
in the current studies follow the order as given bellow.
Glycine > DL-Alanine > L-Valine > L-Arginine HCl.
FIG 2.1 - Lf Values in Pure Water.
FIG 2.2- Lf Values in 20% TBA.
www.wjpps.com Vol 5, Issue 1, 2016.
1438
Nagaraj et al. World Journal of Pharmacy and Pharmaceutical Sciences
FIG 2.3 - Lf Values in 40% TBA.
FIG 2.4 - Lf Values in 60% TBA.
FIG 2.5- Lf Values in 80% TBA.
X Axis – Concentrations of Amino acids in gmol-1
Y Axis - Lf Values of Amino Acids in 10-11
m

www.wjpps.com Vol 5, Issue 1, 2016.
1439
Nagaraj et al. World Journal of Pharmacy and Pharmaceutical Sciences
Change in free energy of activation
In Water
By using the Eq. (5) the values of change in free energy (ΔG) of Glycine, DL-Alanine, L-
Valine and L-Arginine HCl in water at 303.15K were calculated from measured density and
Ultrasonic velocity values. These values are included in table 1.
In the present investigation the values of change in free energy decreases with the increase in
the concentration of the amino acids. The decrease in the values indicates that there is a
significant interactions between solute and the solvent molecules, thereby suggests the
presence of structure promoting behavior. Since the values are negative it may be ascribed to
dispersion forces with systems. A similar observation was reported by Rita Mehra et al from
their change in free energy studies of DL-Alanine in aqueous galactose solutions in the
presence of NaCl at different temperatures.[31]
In Aqueous TBA Solutions
The Change in free energy of Glycine, DL-Alanine, L-Valine and L-Arginine HCl in aqueous
TBA at 303.15K has been calculated by using the equation (5) through the measured
ultrasonic velocity, density and viscosity values. These values are presented in tables 2 to 5.
The observed values show that the Gibbs‟s free energy (∆G) decreases with increase in
concentration indicating the need for longer time for the co-operative process or the
rearrangement of molecules in the mixtures. The Gibb‟s Free Energy of activation flow in the
mixtures can be obtained on the basis of Eyring rate process theory.[33]
So the change in free Gibbs energy (which is only of the system and does not mention the
surroundings) is as valid a criterion of spontaneity as the total entropy (of the universe). The
Gibb‟s free energy values confirm the availability of intermolecular interactions. The
reduction of ∆G indicates the need for smaller time for the cooperation process of the
rearrangement of the molecules in the mixtures, decreases in the energy with increase in
temperature leads to dissociation.[34,35]
These studies provide a comprehensive investigation
of molecular association between amino acids and TBA arising from the dipole-dipole and H-
bonding between the solute and solvent molecules. A similar observation was reported by
Rita Mehra et al from their change in free energy studies of DL-Alanine in aqueous galactose
solutions in the presence of NaCl at different temperatures.[31]

www.wjpps.com Vol 5, Issue 1, 2016.
1440
Nagaraj et al. World Journal of Pharmacy and Pharmaceutical Sciences
The values of change in free energy for the four amino acids in aqueous TBA mixtures in the
current studies follow the order.
L-Arginine HCl > L-Valine > DL-Alanine > Glycine.
CONCLUSION
From the variations of ultrasonic Velocity, adiabatic compressibility, apparent molar
compressibility, intermolecular free length and change in free energy parameters suggest the
structure making property of amino acids under study, vary in the following order in aqueous
TBA mixtures at 303.15K.
Glycine<DL-Alanine<L-Valine<L-Argenine HCl.
REFERENCES
1. Jack Blitz,” Fundamentals of Ultrasonics” Butterworth and Co. Publishers, 2nd
Ed,
London, 1967.
2. Karl. F. Graff, “A History of Ultrasonics in Physical Acoustics”, Academic Press, New
York, 1982; 15.
3. Stokes, “Trans”, Cambridge Phil Soc., 1845; 8: 287.
4. Sindhu Sadhu, “Ultrasonic Velocity Studies in Liquids and their Correlation with its
Structural Aspects” Gian publishing House, 1987.
5. Parthasarathy. S, “Proc. Ind. Acad. Sci”, 1935; 2: 497.
6. Kirchhoff and Pogg, “Ann. Phys”, 1952; 20: 927.
7. D.P. Singh and S.C. Kalsh, Acoustic letters, 1991; 14(10): 206.
8. Kinocid, J. Am. Chem. Soc., S1, 1929; 2950.
9. Mehra and Sajnami, Ind. J. Pure and Appl. Phys., 2000; 38: 760.
10. R.J. Fort and Moore, W.R., Trans. Faraday Society, 1965; 61: 2102.
11. S.B. Kasare, Patdai, B.A., Indian J. Pure & Appl. Phys., 1987; 2(3): 25, 180.
12. K. Ramasamy and Ranganathan, V., Indian J. Pure & Appl. Phys., 1983; 27: 579.
13. J.N. Spencer, Jeffery E. and Robert, C., J. of Phys. Chem., 1979; 83: 1249.
14. R.J. Fort and Moore, W.R., Trans. Faraday Society, 1966; 62: 1112.
15. DVS Jain and Dhar, N.S., Ind. J. Tech., 1992; 310: 620.
16. M. Ciler and Kesanovil, D., Hydrogen Bonding editted by Ha, dn, Zi, D Peragamon
Press, London, 1957.
17. Pratt, L. R.; Pohorille, A. Chem. Rev., 2002; 102: 2671.
18. R.J. Large Man and Dundbar, W.S., J. Phys. Chem., 1945; 49: 428.
www.wjpps.com Vol 5, Issue 1, 2016.
1441
Nagaraj et al. World Journal of Pharmacy and Pharmaceutical Sciences
19. Lara, J. and Desnoyers, J.E., J. Sol. Chem., 1981; 10: 465.
20. Kiyohara, O., Halpin, C.J. and Benson, G.C., Can. J. Chem., 1977; 55: 3544.
21. Schaffs, W., Z. Physik., 1937; 105: 658.
22. Ernst, S. and Glinski, J., Can. J. Chem., 1979; 57: 2333.
23. Kiyohara, O., Halpin, C.J. and Benson, G.C., Can. J. Chem., 1979; 57: 233.
24. Benson, G.C. and Kiyohara, O., J. Chem. Thermodyn., 1979; 11: 1061.
25. Kudriavtsev, B.B., Sov. Phys. Acoustics., 1956; 21: 36.
26. S. Nagaraj, M.C.S. Suba, C. Nagaramani and K. Chowdoji Rao, Bulleting of Pure and
Applied Sciences, 2012; 31C: 3.
27. Anjana and Rajinder. K. Bamezai, Archives of applied research, 2011; 3(1): 370-379.
28. S Thirumaran & K Job Sahu Ind. J. Pure & Appl. Phys., 2009; 47: 87-96.
29. P.R. Malasane and A.S. Aswar, Ind. J. Chem. Tech, 2005; 12: 689-694.
30. R. Palani, A. Geetha, S. Saravanan and Vijaya Shanbhag, Rasayan. J. Chem, 2008; 3:
495-502.
31. Rita Mehra & B B Malav Res. J. Pharm., Biol. & Chem., 2011; 2(3): 709.
32. Katsutaka sasaki & K. Arakawa Bull. chem. Soc. of Japan, 1971; 44: 3223-3226.
33. H. Eyring, J.F. Kincaid, J. Chem. Phys, 1938; 6: 620-629.
34. Baluja S and Oza S, Fluid phase Equilibria, 2001; 178: 233-235.
35. Kannapan A N, Thirumaran S and Palani R, J phy Sci, 2009; 20(2): 97-108.