ultrasound research scanner for real-time synthetic …orbit.dtu.dk/files/3978762/jensen.pdf ·...
TRANSCRIPT

General rights Copyright and moral rights for the publications made accessible in the public portal are retained by the authors and/or other copyright owners and it is a condition of accessing publications that users recognise and abide by the legal requirements associated with these rights.
• Users may download and print one copy of any publication from the public portal for the purpose of private study or research. • You may not further distribute the material or use it for any profit-making activity or commercial gain • You may freely distribute the URL identifying the publication in the public portal
If you believe that this document breaches copyright please contact us providing details, and we will remove access to the work immediately and investigate your claim.
Downloaded from orbit.dtu.dk on: Jun 13, 2018
Ultrasound Research Scanner for Real-time Synthetic Aperture Data Acquisition
Jensen, Jørgen Arendt; Holm, Ole; Jensen, Lars Joost; Bendsen, Henrik; Nikolov, Svetoslav; Tomov,Borislav Gueorguiev; Munk, Peter; Hansen, Martin; Salomonsen, Kent; Gormsen, Kim; Hansen, Johnny;Pedersen, Henrik Møller; Gammelmark, KimPublished in:I E E E Transactions on Ultrasonics, Ferroelectrics and Frequency Control
Link to article, DOI:10.1109/TUFFC.2005.1503974
Publication date:2005
Document VersionPublisher's PDF, also known as Version of record
Link back to DTU Orbit
Citation (APA):Jensen, J. A., Holm, O., Jensen, L. J., Bendsen, H., Nikolov, S., Tomov, B. G., ... Gammelmark, K. (2005).Ultrasound Research Scanner for Real-time Synthetic Aperture Data Acquisition. I E E E Transactions onUltrasonics, Ferroelectrics and Frequency Control, 52(5), 881-891. DOI: 10.1109/TUFFC.2005.1503974

ieee transactions on ultrasonics, ferroelectrics, and frequency control, vol. 52, no. 5, may 2005 881
Ultrasound Research Scanner for Real-timeSynthetic Aperture Data Acquisition
Jørgen Arendt Jensen, Senior Member, IEEE, Ole Holm, Lars Joost Jensen, Henrik Bendsen,Svetoslav Ivanov Nikolov, Borislav Gueorguiev Tomov, Peter Munk, Martin Hansen, Kent Salomonsen,
Johnny Hansen, Kim Gormsen, Henrik Møller Pedersen, and Kim L. Gammelmark, Student Member, IEEE
Abstract—Conventional ultrasound systems acquire ul-trasound data sequentially one image line at a time. Thearchitecture of these systems is therefore also sequentialin nature and processes most of the data in a sequentialpipeline. This often makes it difficult to implement radicallydifferent imaging strategies on the platforms and makesthe scanners less accessible for research purposes. A systemdesigned for imaging research flexibility is the prime con-cern. The possibility of sending out arbitrary signals andthe storage of data from all transducer elements for 5 to10 seconds allows clinical evaluation of synthetic apertureand 3D imaging. This paper describes a real-time systemspecifically designed for research purposes.
The system can acquire multichannel data in real-timefrom multi-element ultrasound transducers, and can per-form some real-time processing on the acquired data. Thesystem is capable of performing real-time beamforming forconventional imaging methods using linear, phased, andconvex arrays. Image acquisition modes can be intermixed,and this makes it possible to perform initial trials in a clin-ical environment with new imaging modalities for syntheticaperture imaging, 2D and 3D B-mode, and velocity imagingusing advanced coded emissions.
The system can be used with 128-element transducersand can excite 128 transducer elements and receive andsample data from 64 channels simultaneously at 40 MHzwith 12-bit precision. Two-to-one multiplexing in receivecan be used to cover 128 receive channels. Data can bebeamformed in real time using the system’s 80 signal pro-cessing units, or it can be stored directly in RAM. Thesystem has 16 Gbytes RAM and can, thus, store more than3.4 seconds of multichannel data. It is fully software pro-grammable and its signal processing units can also be recon-figured under software control. The control of the systemis done over a 100-Mbits/s Ethernet using C and Matlab.Programs for doing, e.g., B-mode imaging can be writtendirectly in Matlab and executed on the system over the netfrom any workstation running Matlab. The overall systemconcept is presented along with its implementation and ex-amples of B-mode and in vivo synthetic aperture flow imag-ing.
I. Introduction
Modern ultrasound scanners employ digital signalprocessing to generate high quality images which are
Manuscript received February 4, 2003; accepted October 12, 2004.This work was supported by grants 9700883 and 9700563 from theDanish Science Foundation, by B-K Medical A/S, and by grant EF-782 from the Danish Academy of Technical Sciences.
J. A. Jensen, S. I. Nikolov, B. G. Tomov, P. Munk, H. M. Pedersen,and K. L. Gammelmark are with the Center for Fast UltrasoundImaging, Ørsted•DTU, Technical University of Denmark, DK-2800Kgs. Lyngby, Denmark (e-mail: [email protected]).
O. Holm, L. J. Jensen, H. Bendsen, M. Hansen, K. Salomonsen, J.Hansen, K. Gormsen, and H. M. Pedersen are with the IO Technolo-gies A/S, Carl Jacobsens Vej 16, DK-2500 Valby, Denmark.
dynamically focused in receive. Processing has to be madeon data streams in the Gbytes per second range, and thisnecessitates the use of dedicated chips to perform process-ing in real time to keep the cost, space, and power con-sumption moderate. Fundamental changes to the signalprocessing are, thus, difficult or impossible to make.
The current scanners perform image acquisition sequen-tially one line at a time, and the frame rate is, thus, lim-ited by the speed of sound. When imaging flow, severalemissions have to be made in the same direction, and thislimits the frame rate, especially for large depths and largecolor flow sectors. For a 100-line image at 15-cm depth,the frame rate can be below 6 Hz, which is unacceptablefor cardiac imaging.
New imaging techniques based on synthetic aperture(SA) imaging have therefore been suggested and investi-gated [1]–[3]. The methods can potentially increase bothresolution and frame rate, since the images are recon-structed from RF data from the individual transducer ele-ments. Hereby a perfectly focused image in both transmitand receive can be made. Research in real-time 3D imagingis also underway [4], [5]. The purpose is to make systemsthat in real time can display a pyramidal volume of theheart, where different slices hereafter can be visualized.
It has been intensely discussed whether SA imagingcould give better images, and how they will be affectedby tissue motion and limited signal-to-noise ratio. It hasalso been stated that flow imaging cannot be performedwith SA methods. A fundamental problem in SA imag-ing is the poor signal-to-noise ratio in the images, sincea single element is used for emission. This gives a muchlower emitted energy compared to using the full aperturein conventional imaging and therefore limits the depth ofpenetration. A potential solution to this is the use of codedexcitation, and several groups are working on employingcoded signals to enhance the signal-to-noise ratio [6]–[8].Coded imaging can also be used to further increase theframe rate [9]–[11]. It has also recently been shown that SAimaging can be used for velocity estimation [12], [13]. Thisshows that SA systems can be made with all of the func-tionality of conventional systems. There are, thus, goodreasons for constructing an experimental system capableof measuring SA data in vivo to evaluate the proposedmethods. It is the purpose of this paper to describe such asystem and give some examples from its use, demonstrat-ing that many of the problems in SA imaging mentionedabove can be solved.
0885–3010/$20.00 c© 2005 IEEE
Authorized licensed use limited to: Danmarks Tekniske Informationscenter. Downloaded on December 2, 2009 at 03:41 from IEEE Xplore. Restrictions apply.

882 ieee transactions on ultrasonics, ferroelectrics, and frequency control, vol. 52, no. 5, may 2005
All of the above techniques require digital signal pro-cessing on signals from individual transducer elements.The most advanced techniques also use different codes thatchange as a function of element and emission number, sothat a fully flexible emissions system is needed. For re-search purposes both demands can be difficult to fulfillwith commercial scanners, since they are often highly in-tegrated, and it is difficult to access individual signals.Programming commercial scanners for new imaging tech-niques is often also either cumbersome or impossible. It is,thus, beneficial to develop a dedicated research system thatcan acquire, store, process, and display ultrasound imagesfrom multi-element transducers for any kind of imagingstrategy.
This paper describes such a research scanner, its de-sign, implementation, and use in vivo. The primary pur-pose of the scanner is to acquire complete RF data sets,where the signals on the individual elements are storedand can be used for later processing in development of al-gorithms and imaging schemes. A large memory coveringseveral heart cycles is, thus, needed. It must be possible toimplement any kind of imaging, and a fully flexible trans-mission system is needed. Not all mentioned methods canbe implemented in real time, since the resources neededfor real-time processing can be determined only after thealgorithm has been developed. A key requirement is there-fore to store all data and then transport them to generalcomputer clusters for processing. To allow scanning on hu-man volunteers, it is, however, necessary to have real-timeprocessing capabilities for orientation of the scanning, andthe various traditional scanning methods should be imple-mented. The processing should be so flexible that someof the new methods can be implemented or experimentedwith for real-time implementation. Finally, the scannershould be easy to program, allowing one to implement en-tirely new scanning methods with minimal efforts. Sucha system can assist in the development of scanning tech-niques and algorithms and facilitate preclinical trials. Also,such a system makes it possible to investigate the role oftissue motion in SA imaging and to quantify the emittedintensities for the advanced imaging methods.
The demands on the system are further elaborated inthe next section. A description of the individual units ofthe system is given in Section III, and the actual imple-mentation is also shown. The programming model for thesystem, and how phased array imaging can be done in fewlines of code, is shown in Section IV. Examples of clini-cal use of the system on human volunteers is described inSection V, and a summary of experiences with the systemand its further development is given in Section VI.
II. System Specification
The purpose of the system is to make the acquisition ofmultichannel data in real-time from clinical multi-elementultrasound transducers possible, and to enable real-timeor near real-time processing of the acquired data. The sys-tem must be capable of performing the beam formation for
all currently available imaging methods, and this makes itpossible to carry out initial trials with new imaging modal-ities for synthetic aperture imaging, 3D imaging, and 2Dand 3D velocity estimation. It must be capable of workingin a clinical environment to evaluate the performance ofvarious algorithms on human volunteers.
The system is specifically intended for research pur-poses, and is not intended for commercial use. The sizeof the system is, thus, not very important, and it is notnecessary to make it easily transportable. Also, it is usedonly by experts and the user interface to the medical doc-tor is of minor importance. Most efforts have been put onthe flexibility of the system and its ease of configurationfor new uses.
The function of the system is defined by the differentimaging methods for which it can be used. Each of theimaging types is described below, and the consequencesfor the system then given.
A. Linear Array Imaging
A linear array image is generated by a multi-elementtransducer with 128 to 256 elements [14]. The beam ismoved by selecting, e.g., 64 adjacent elements and emittinga focused beam from these. The focusing in receive is alsodone by a number of elements, and dynamic focusing isused. Apodization in both transmit and receive are oftenapplied. The number of active elements is usually 32 to 64.The transducer frequency is from 2 to 10 MHz. Imaging isdone down to a depth of 30 cm.
Thus, the demand on the system for 64 channels is si-multaneous sampling at 40 MHz. The focusing delay forelement i is given by
td(i) =|�ri − �rp| − |�rc − �rp|
c, (1)
where c is speed of sound, �rp is the imaging point, �rc de-notes the center element of the active aperture, and �ri isthe location of the element. Assuming the point to be veryclose to the transducer gives the maximum delay
td max =|�ri| − |�rc|
c. (2)
A linear array often has λ = c/f0 pitch, and the maximumdelay is then
td max =Ne/2 · c/f0
c=
Ne
2f0, (3)
where f0 is center frequency and Ne is the number of activeelements. For 64 elements and f0 = 2 MHz, td max equals16 µs.
The maximum time to sample one line to a depth of dis given by
ts =2d
c. (4)
This gives ts = 430 µs, corresponding to 17,200 samplesat 40 MHz for a depth of 30 cm.
Authorized licensed use limited to: Danmarks Tekniske Informationscenter. Downloaded on December 2, 2009 at 03:41 from IEEE Xplore. Restrictions apply.

jensen et al.: scanner for real-time synthetic aperture data acquisition 883
B. Phased Array Imaging
The beam is electronically swept over the imaging areaby using a 64-to-256 element array [15]. The beamformingdelays are used both for steering and focusing. The pitch isreduced to λ/2 to avoid grating lobes, and a very conserva-tive estimate of maximum delay is to assume the imagingpoint to be at the edge of the array. The maximum delaythen is
td max =Neλ/2
c=
Ne
2f0, (5)
which is equal to the demand for linear array imaging.The transducer frequency is from 2 to 10 MHz. Investi-
gations are done to a depth of 20 cm.Thus, the demand on the system for 128 channels is
sampling at 40 MHz. The demands on focusing delays,sampling time, and storage are the same as for linear arrayimaging.
C. Flow Estimation, Spectrum
Beamforming is done in one direction with either a lin-ear or a phased array [16]. The flow signal from blood has40 dB less power than that from stationary tissue. Thedynamic range of the flow signal is 30 dB. The effectivenumber of bits must be 12 or more when the signals fromall channels have been combined. The pulse emitted canhave from 4 to 16 periods of the center frequency of thetransducer or a coded signal can be employed.
D. Flow Imaging
Imaging is done by pulsing repeatedly in one directionand then changing the direction to generate an image [17].An image can therefore be assembled from up to 1000 pulseemissions.
E. Three-Dimensional Imaging
A matrix element transducer is used with, e.g., 40 × 40elements [4], [18]. Only some of the elements are used fortransmit and receive. The area of the elements is small,and pulsing should be done with 100 to 300 volts. Codedsignals should be used. Coded pulses with up to 64 cycleperiods must be possible with a high-amplitude accuracy.This corresponds to emission over a period of 32 µs with asampling frequency of 40 MHz and an accuracy of 12 bits.
The maximum delay conservatively corresponds to thetransmission time over the aperture. Assuming λ/2 pitchgives
td max =√
2Neλ/2c
=Ne√2f0
, (6)
which for 64 × 64 elements and f0 = 2 MHz gives 23 µs.Parallel lines are generated by using parallel beamform-ers and reusing data from one pulse emission. The system
must be capable of reading the data sampled from oneelement a number of times, and using different phasingschemes for each cycle through the data. This gives a veryhigh demand on the processing that might not be obtain-able by the system.
F. Synthetic Aperture Imaging
A standard linear or phased array multi-element trans-ducer is used. Pulsing is done on a few elements and thereceived response is acquired for all elements [19], [20]. Theimage is then reconstructed from only a small number ofpulse emissions by using the data from all elements.
This type of imaging needs large amounts of storageand the ability to reuse the data for the different imag-ing directions. The system must be capable of storing 3seconds of data for all channels. For a 12-bit resolution at40 MHz, 64 channels, and 3 seconds of data, this amountsto a total storage demand of more than 14 Gbytes.
The processing of the data cannot be done in the sys-tem due to the very large demand on processing. This issolved by storing the data in real time and the transferringthem to a multiprocessor system for storage and image re-construction.
G. Synthetic Aperture Flow Imaging
The data are acquired in the same way as for syntheticaperture imaging, but the focusing is done continuouslyfor all points in the image [21]. Hereby the data for flowestimation are present for all image locations for all time.It is, thus, very important that the image measurement becontinuous over the whole data acquisition time.
H. Fast Coded Synthetic Aperture Imaging
Here the image is acquired by sending different codes onthe individual elements for different emissions [9]–[11]. Theimage is then created by processing the received signalsusing different filters to separate out the individual signals.
The system must, thus, be capable of sending an arbi-trary code that is different for the different channels, andthat can change from emission to emission.
In general the demands for all of these imaging modescan be condensed into a few generic demands. The trans-mission system should be capable of sending an arbi-trary signal on each element. The signals can be differ-ent from element to element and from emission to emis-sion. The transmission system must be capable of focus-ing the transmission differently for emission to emission.The sampling frequency should be 40 MHz and the res-olution is determined by the dynamic range of the sys-tem, which should be above 60 dB. A 12-bit digital-to-analog converter (DAC) is, thus, sufficient. Coded wave-forms should be emitted for up to 32 µs and different codesshould be emitted for different emissions and elements. For100-image lines this gives 80 ksamples of memory for eachtransducer element.
Authorized licensed use limited to: Danmarks Tekniske Informationscenter. Downloaded on December 2, 2009 at 03:41 from IEEE Xplore. Restrictions apply.

884 ieee transactions on ultrasonics, ferroelectrics, and frequency control, vol. 52, no. 5, may 2005
Fig. 1. Overall diagram of system.
The receiving system should be capable of sampling fullRF data from all channels. The sampling frequency shouldbe 40 MHz and the resolution at least 12 bits. Samplingshould be possible over a couple of heart beats. Three sec-onds of real-time data at 40 MHz with 2 bytes per samplegives a demand of 229 Mbytes, so that a RAM of 256Mbytes per channel is necessary. To process the data itmust be possible to dynamically focus the data in realtime. A focusing chip must be used for each channel, andthis chip must have memory with parameters for the fo-cusing, and the system must be capable of summing thedata from the individual channels. Ideally the processingshould be easily reconfigurable, and it must be possible tostore the raw RF data, the focused data, or the focusedand summed data. The beamformed and summed datashould also be transported out of the system in real timefor further processing and display on a screen.
III. System Realization
The Remotely Accessible Software configurable Mul-tichannel Ultrasound Sampling (RASMUS) system con-sists of four distinct modules: transmitters, analog am-plifiers (Rx/Tx amplifiers), receivers, and a sync/masterunit. The main blocks are depicted in Fig. 1. The connec-tion to the transducer is through a 128-wire coaxial cablethrough the Rx/Tx amplifiers. The transmitter sends thesignals through the transmit amplifiers, and the receiverunit samples the amplified and buffered signals from theRx/Tx amplifiers. The sync/master unit holds a crystaloscillator and controls the central timing of the scanningprocess. The overall operation of the system is controlledthrough a number of single-board PCs in the individualunits interconnected through a standard 100-Mbits/s Eth-ernet. The waveforms and focusing delay data are trans-mitted from the controlling PC to the transmitters and
Fig. 2. Main diagram of the transmitter board.
receiver boards. The data from the sampling are processedby field programmable gate arrays (FPGAs) that can beconfigured for specific signal processing tasks over the net.One Focus FPGA is used for each element and a SumFPGA is placed for each eight elements. The processedand summed signal can then be routed from Sum FPGAto Sum FPGA through a cascade bus. The resulting signalis read by one or more signal processors (ADSP) that canbe connected through serial link channels capable of trans-mitting 40 Mbytes per second. The beamformed signal issent via the link channels to the PC for further processingand display.
The following paragraphs detail the overall design of theindividual boards.
A. Transmitter
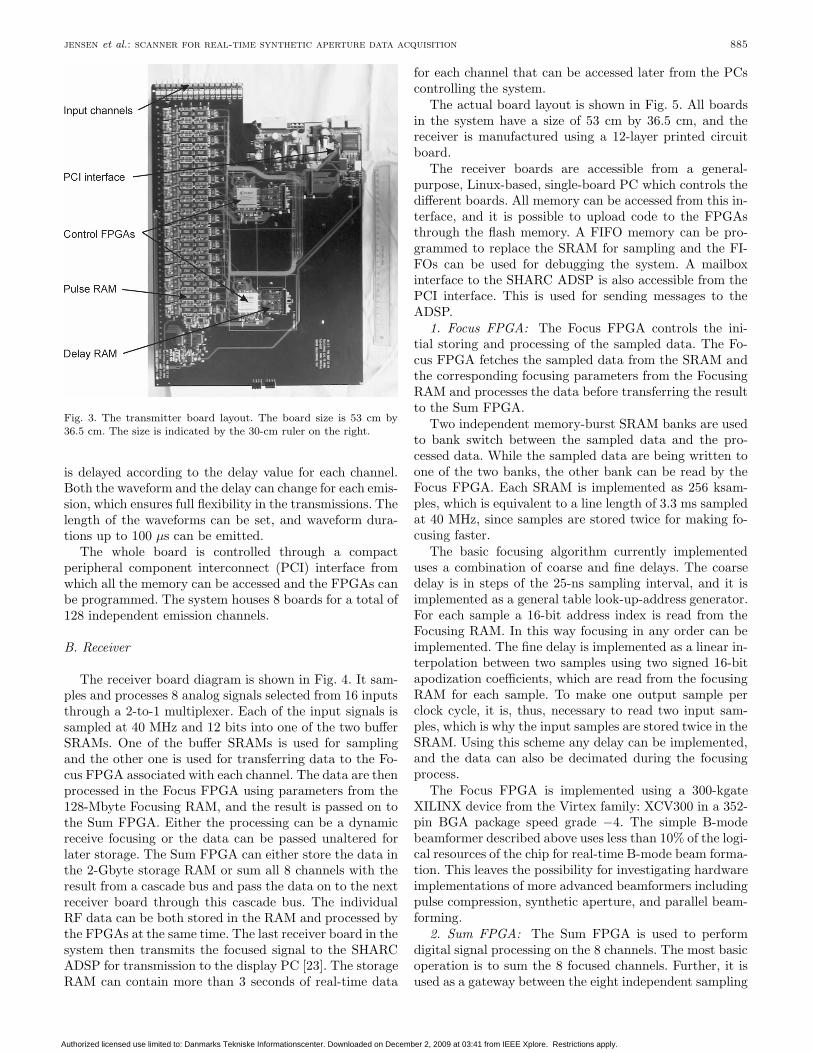
The overall diagram of the transmitter is shown in Fig. 2and its layout is shown in Fig. 3. Each transmitter boardhas 16 channels each having a 128-ksample pulse RAMconnected to a 40-MHz, 12-bit DAC. The pulse RAM iscontrolled by two FPGAs, where the individual waveformsare selected as a memory start address and a transmit de-lay. The delay RAM holds the start address of the wave-form in the pulse RAM and the corresponding delay foreach line. The delay RAM is implemented as 32 k × 32bit SRAM. At the start of each line the pulse emission
Authorized licensed use limited to: Danmarks Tekniske Informationscenter. Downloaded on December 2, 2009 at 03:41 from IEEE Xplore. Restrictions apply.
jensen et al.: scanner for real-time synthetic aperture data acquisition 885
Fig. 3. The transmitter board layout. The board size is 53 cm by36.5 cm. The size is indicated by the 30-cm ruler on the right.
is delayed according to the delay value for each channel.Both the waveform and the delay can change for each emis-sion, which ensures full flexibility in the transmissions. Thelength of the waveforms can be set, and waveform dura-tions up to 100 µs can be emitted.
The whole board is controlled through a compactperipheral component interconnect (PCI) interface fromwhich all the memory can be accessed and the FPGAs canbe programmed. The system houses 8 boards for a total of128 independent emission channels.
B. Receiver
The receiver board diagram is shown in Fig. 4. It sam-ples and processes 8 analog signals selected from 16 inputsthrough a 2-to-1 multiplexer. Each of the input signals issampled at 40 MHz and 12 bits into one of the two bufferSRAMs. One of the buffer SRAMs is used for samplingand the other one is used for transferring data to the Fo-cus FPGA associated with each channel. The data are thenprocessed in the Focus FPGA using parameters from the128-Mbyte Focusing RAM, and the result is passed on tothe Sum FPGA. Either the processing can be a dynamicreceive focusing or the data can be passed unaltered forlater storage. The Sum FPGA can either store the data inthe 2-Gbyte storage RAM or sum all 8 channels with theresult from a cascade bus and pass the data on to the nextreceiver board through this cascade bus. The individualRF data can be both stored in the RAM and processed bythe FPGAs at the same time. The last receiver board in thesystem then transmits the focused signal to the SHARCADSP for transmission to the display PC [23]. The storageRAM can contain more than 3 seconds of real-time data
for each channel that can be accessed later from the PCscontrolling the system.
The actual board layout is shown in Fig. 5. All boardsin the system have a size of 53 cm by 36.5 cm, and thereceiver is manufactured using a 12-layer printed circuitboard.
The receiver boards are accessible from a general-purpose, Linux-based, single-board PC which controls thedifferent boards. All memory can be accessed from this in-terface, and it is possible to upload code to the FPGAsthrough the flash memory. A FIFO memory can be pro-grammed to replace the SRAM for sampling and the FI-FOs can be used for debugging the system. A mailboxinterface to the SHARC ADSP is also accessible from thePCI interface. This is used for sending messages to theADSP.
1. Focus FPGA: The Focus FPGA controls the ini-tial storing and processing of the sampled data. The Fo-cus FPGA fetches the sampled data from the SRAM andthe corresponding focusing parameters from the FocusingRAM and processes the data before transferring the resultto the Sum FPGA.
Two independent memory-burst SRAM banks are usedto bank switch between the sampled data and the pro-cessed data. While the sampled data are being written toone of the two banks, the other bank can be read by theFocus FPGA. Each SRAM is implemented as 256 ksam-ples, which is equivalent to a line length of 3.3 ms sampledat 40 MHz, since samples are stored twice for making fo-cusing faster.
The basic focusing algorithm currently implementeduses a combination of coarse and fine delays. The coarsedelay is in steps of the 25-ns sampling interval, and it isimplemented as a general table look-up-address generator.For each sample a 16-bit address index is read from theFocusing RAM. In this way focusing in any order can beimplemented. The fine delay is implemented as a linear in-terpolation between two samples using two signed 16-bitapodization coefficients, which are read from the focusingRAM for each sample. To make one output sample perclock cycle, it is, thus, necessary to read two input sam-ples, which is why the input samples are stored twice in theSRAM. Using this scheme any delay can be implemented,and the data can also be decimated during the focusingprocess.
The Focus FPGA is implemented using a 300-kgateXILINX device from the Virtex family: XCV300 in a 352-pin BGA package speed grade −4. The simple B-modebeamformer described above uses less than 10% of the logi-cal resources of the chip for real-time B-mode beam forma-tion. This leaves the possibility for investigating hardwareimplementations of more advanced beamformers includingpulse compression, synthetic aperture, and parallel beam-forming.
2. Sum FPGA: The Sum FPGA is used to performdigital signal processing on the 8 channels. The most basicoperation is to sum the 8 focused channels. Further, it isused as a gateway between the eight independent sampling
Authorized licensed use limited to: Danmarks Tekniske Informationscenter. Downloaded on December 2, 2009 at 03:41 from IEEE Xplore. Restrictions apply.

886 ieee transactions on ultrasonics, ferroelectrics, and frequency control, vol. 52, no. 5, may 2005
Fig. 4. Main diagram of receiver board (from [22]).
Fig. 5. The receiver board layout without RAM modules to revealthe processing electronics. The board size is 53 cm by 36.5 cm.
channels and the ADSP. The Sum FPGA controls the 2-Gbyte storage SDRAM.
When the focusing is done in the Focus FPGA, the 8channels are added to the accumulated sum that is passedto the next receiver board using a high-speed cascade busconnecting the Sum FPGAs directly with each other. Thelast Sum FPGA in the chain uses the ADSP link ports totransfer the final result to an external PC that displaysthe final image.
The Sum FPGA is implemented using a 1-Mgate XIL-INX device from the Virtex family: XCV1000 in a 560-pin
BGA package speed grade −4. The simple design describedabove uses less than 5% of the logical resources of the chipfor conventional real-time imaging.
C. Sync/Master Unit
The sync/master unit controls the timing of the system.A highly stable oven-controlled crystal oscillator generatesthe 40-MHz clock frequency. The clock jitter is below 5 ps.The clock is distributed using coax cables and emitter-coupled logic (ECL) in order to minimize jitter. The tim-ing source also transmits a synchronization (SYNC) sig-nal. The receiver and transmitter uses the SYNC signalto start and stop the sampling cycles. An image consistsof a number of lines, each with a transmission of a pulseand a reception of the echoes. The transmitter and receivergenerate an internal LINE signal from the SYNC signal tocontrol the sampling process for the received signal.
The sync/master board also generates the time-gaincompensation (TGC) signal used for the Rx/Tx boards.The sampling clock for the TGC waveform is 1 MHz. Thevalues for the TGC and generation of the synchronizationsignals are loaded through the board’s PCI interface.
D. Current Processing Capabilities
The current system only uses 10% of the available ca-pacity in the FPGAs. With the programs it is possible toperform real-time beam formation for linear, phased, andconvex arrays. The beam formation for all conventionalultrasound systems can, thus, be implemented. The post-
Authorized licensed use limited to: Danmarks Tekniske Informationscenter. Downloaded on December 2, 2009 at 03:41 from IEEE Xplore. Restrictions apply.

jensen et al.: scanner for real-time synthetic aperture data acquisition 887
processing for image display and flow estimation is todaydone in PCs, but could be implemented in the Sum FPGA.
It is possible to focus data at a rate of 40 MHz. Thisgives 8000 beamformed samples for a 200-µs acquisitioncorresponding to a depth of 15 cm. Sparse output samplescould also be generated [24] and normally 512 complexsamples per line is sufficient for B-mode display, so thata 1-to-8 parallel beamformer can easily be implemented.The remaining resources can then be used for filtration,code compression, or other processing.
Currently it is not possible to make real-time process-ing of SA images. Here a full image must be formed af-ter each pulse emission corresponding to more than 100parallel beamformers. Compression of coded signal shouldalso be done. The main bottlenecks are currently the datatransfer rates, since the FPGAs still have room for moreprocessing. The data acquisition can, however, always bedone in real time, which is the most important feature forresearch purposes. Since different image sequences can beintermixed, a conventional B-mode image can be acquiredand processed in real time for orientation purposes. TheSA image can then be acquired in between B-mode im-ages and full orientation of the scanning can therefore beobtained.
E. Physical Realization
Two 19-inch racks house the 8 transmitter and the8 receiver boards, respectively, as shown in Fig. 6. Thesync/master board is located in the rack cabinet for thereceiver boards. Each of these racks also houses a slot PCrunning Linux, which controls the setup and operation ofthe boards. A separate enclosure is used for the analogfront-end, which is shielded from the digital electronics.Here linear laboratory power supplies (Toellner TOE 8841and 8852, Herdecke, Germany) are also used to supply thefront-end to keep the noise low.
Although the system is quite large and weighs severalhundred kilograms, it is still transportable and it can bemoved around in the lab by two persons. The system is nowfully functional and has been used for acquiring data forseveral new imaging methods, as described in Section V.
IV. Programming of the System
From the software point of view, the system consistsof several computers that are directly connected to anumber of transmitter and receiver boards and a singlesync/master board. The computers are linked by a LAN,and use Linux as the operating system and TCP/IP as theunderlying communication protocol.
The software was designed to meet the following re-quirements:
• Flexibility and ease of use. It is of prime impor-tance that new imaging methods can be quickly imple-mented with a minimal amount of programming evenfor new users.
Fig. 6. The RASMUS scanner seen from the front with the receiverson the top, the transmitters in the middle, and the power supplies inthe bottom. The analog front-end and transducer connection alongwith a control PC is placed in the other rack cabinet.
• Data encapsulation. All data for the imaging algo-rithm are stored in the boards of the scanner.
• Distributed computations. The computers work inde-pendently of each other, and each calculates only thoseimaging parameters for boards that are connected tothat particular computer.
• Portability. The software is written in ANSI C and isplatform-independent.
The client/server communication model was adopted forthe software. The computers controlling the boards run aserver program. The server waits for requests coming fromthe LAN and processes them. The requests can be sent byany client program running on a computer connected tothe LAN using the TCP/IP communication protocol.
Fig. 7 shows the client-server model of the software. Atstart-up the server detects which boards are in the PCIenclosures. The computers can handle any combinationof transmitter and receiver boards plugged into the samePCI back-plane. The server is in idle mode until an event
Authorized licensed use limited to: Danmarks Tekniske Informationscenter. Downloaded on December 2, 2009 at 03:41 from IEEE Xplore. Restrictions apply.

888 ieee transactions on ultrasonics, ferroelectrics, and frequency control, vol. 52, no. 5, may 2005
Fig. 7. Client-server model of software.
occurs. In the case of a hardware malfunction, the serversends an emergency message to a program, called monitordaemon. Another event is a request by the client. The re-quest can be for transferring parameters to the boards, forperforming some calculations, or for retrieving data fromthe boards to the computer with the user.
The interface to the client program is implemented asa Matlab (The MathWorks Inc., Natick, MA) tool box.The function calls are implemented to be as close to thefunctions in the simulation program Field II [25] as possi-ble. Algorithms created using Field II can thereby easilybe tested on the scanner with only minor changes in theMatlab program. An example for setting the system toperform phased array B-mode imaging is shown below:
% Auto-detect and initialize the systemsys init(’auto’);% Set the pulse repetition frequencysys set fprf(fprf);% Set the sampling range gate in receivesys set sampling interval(start depth, end depth);% Set the number of scan-lines per framesys set no lines(no lines);% Define the transducer. Necessary for the delay calculationstr linear array(no elements, width, height, kerf);% Do for all lines in the image:
for line no = 1: no lines
% Set the pulse and the apodization for the current linexmt excitation(waveform(line no));xmt apodization(line no,xmt apo(line no, : ));rcv apodization(line no,times, rcv apo(line no, : , : ));
% Set the focus, defined in 3D coordinatesxmt focus(line no,focus(line no));rcv dynamic focus(line no, theta(line no), fi(line no));end
% Set the time-gain compensation curvetmg tgc(tgc vector);% Start the continuous imaging processtmg start
In order to make the system perform linear array imag-ing, only one line needs to be added, which changes theorigin of the individual scan lines.
V. Examples of Use
The initial design of the system was started in October1998 and the first images using the full system were ac-quired in the spring of 2001. The full real-time capabilitiesof the system were completed in 2002 and the RASMUSsystem is now capable of real-time focusing for conven-tional imaging and real-time data acquisition for all modes.This is illustrated in the following examples.
The first example shows a comparison between a tradi-tional linear array image and a synthetic aperture image.A commercial 7-MHz probe is used and the system is pro-grammed to alternate between linear array imaging andsynthetic aperture imaging. Therefore, both images are ac-quired at the same time on the same patient and with thesame view, and a direct comparison can be made. The lin-ear array image uses 64 elements in transmit and 128 inreceive, and the active aperture is moved across the physi-cal aperture to perform the image. The synthetic apertureimage is acquired using a number of spherical wave emis-sions. Normally one element is used in transmit, but toensure sufficient transmitted energy here, a number of ele-ments are used in transmit. A set of 33 elements are usedin transmission to form a spherical wave, and this emissionaperture is moved over the physical aperture. This is donefor 96 emissions. A 20-µs chirp signal is also used dur-ing emission, and two emissions are used for sampling thewhole 128-element aperture using the 2-to-1 receive mul-tiplexing. More details on this temporally encoded multi-element SA imaging (TMS) method and the correspondingintensity levels can be found in [8].
The resulting images are shown in Fig. 8, with the lineararray image to the left and the synthetic aperture image tothe right. It can be seen that the SA image attains a 40%increase in depth of penetration and that the resolutionfor the deeper-lying wires are improved [8].
The second example demonstrates the system’s abilityto estimate flow in vivo. The image is made using syntheticaperture techniques with a 7-MHz linear array. Here 11 el-ements are grouped for the emission. Eight emissions areused over the full 128-element aperture to form an image.A 20-µs chirp is used as excitation to ensure a good signal-to-noise ratio. The 64 elements closest to the center of theemission are sampled during reception and hereby signalsfrom all 128 elements are sampled for the whole emissionsequence. The sequence is repeated 16 times for a total of128 emissions with a pulse repetition frequency of 3 kHz.The velocity is then estimated by focusing along the di-rection of the flow and these signals are cross-correlated toestimate the movement and thereby the velocity. Detailsabout the method can be found in [13]. The resulting im-age taken of the carotid artery (bottom) and jugular vein(top) in the neck of a male volunteer is shown in Fig. 9.
Authorized licensed use limited to: Danmarks Tekniske Informationscenter. Downloaded on December 2, 2009 at 03:41 from IEEE Xplore. Restrictions apply.

jensen et al.: scanner for real-time synthetic aperture data acquisition 889
Fig. 8. Linear array (left) and synthetic aperture scan (right) ofnylon wires in a tissue mimicking phantom with an attenuation of0.5 dB/(MHz cm) (from [8]).
It should be noted that the raw estimates are displayed,and the velocity is, thus, accurately estimated. The esti-mates start at a depth of only 13 mm due to the use ofthe chirp excitation. The white areas at the bottom of theartery are artifacts from the velocity estimation process.This is due to the selection of a wrong peak in the cross-correlation function [26], probably due to an insufficientsignal-to-noise ratio.
In the last example, data are sampled to a depth of32 mm, although the pulse repetition frequency is 3 kHz,so that sampling is only done in 12.5% of the time. Thesystem is then capable of storing a sequence of image datafor 26.9 seconds.
Several other image types have also been acquired, suchas convex synthetic aperture images [27], 3D syntheticaperture data [28], and transverse flow data [29] and pre-clinical trials of convex array SA imaging [30]. The systemhas, thus, shown that it is a very flexible tool that is ableto sample data for nearly any imaginable application.
Fig. 9. In vivo color flow map image at a 77-degree flow angle forthe jugular vein and carotid artery. The color scale indicates thevelocity along the flow direction: red hues indicate forward flow andblue reverse flow (from [13]).
VI. Summary and Future Extensions
The RASMUS system has been described in this pa-per. The system is currently fully operable and gives highquality in vivo data that can be used for devising andtesting new imaging schemes such as synthetic apertureimaging, directional flow techniques, and real-time three-dimensional imaging. The main method for operation hasbeen real-time data acquisition with storage of all the datain the system’s RAM. The data are then transferred forlater processing on a Linux cluster with 32 CPUs. Themodel of control under Matlab has shown to be very effi-cient, since the user can work at a very high level of controlwithout being buried in the system’s details. More than 15people have currently been using the system without a verylong introduction to its facilities. The software model hasalso greatly helped in debugging the system, since smallscripts for testing can easily be written. The network fea-ture has also eased the use. Most phantom experiments fordebugging have been set up in the laboratory, and then thescript debugging and data acquisition is done from the of-fice.
By far the most important features are the flexibletransmission system and the real time storage facility thatare nearly always used. The main annoyance in the use ofthe system has been the slow transfer of data out of the sys-tem’s memory. This is currently done through the control-ling PCs, and this is limited by the 100-MBit/s Ethernetand the PCI interface of the boards. The PCI interface isbased on an FPGA, and it is currently slow and limited to
Authorized licensed use limited to: Danmarks Tekniske Informationscenter. Downloaded on December 2, 2009 at 03:41 from IEEE Xplore. Restrictions apply.

890 ieee transactions on ultrasonics, ferroelectrics, and frequency control, vol. 52, no. 5, may 2005
a transfer rate of 2–8 Mbytes/s. A full experiment storing16 Gbytes of data ideally takes nearly one hour to transferto external disk at best, and often it takes longer. The slowtransfer should be addressed in an updated version of thesystem, which could be based on a 1-Gbit/s Ethernet andan optimized PCI interface design.
The real-time capability has been the most difficult toget working. It relies on the global timing of the whole sys-tem and the coordination of all 72 FPGAs in the process-ing chain, and has been the last feature to work. Some ofthe examples mentioned in Section V have therefore beenmade by scanning with a normal B-K Medical 2102 scanner(B-K Medical A/S, Herlev, Denmark) and then switchingthe probe to the RASMUS system for data acquisition,which is very cumbersome. The real-time processing cannow make dynamic receive focusing for all transducer mod-els. This makes real-time orientation possible, and the sys-tem can be programmed to acquire several different imagesin the same sequence for comparison. Also, the potentialof the FPGA processing solution needs to be determined.The current processing fills 10% of the FPGAs. Many moreoptions exist and are currently being investigated.
The system has, however, already been capable of ac-quiring high-quality data for linear, phased, and convexSA imaging and for SA flow imaging, and the first preclin-ical trials comparing conventional and SA imaging havebeen conducted.
Acknowledgment
The anonymous reviewers are thanked for their manyuseful comments.
References
[1] J. T. Ylitalo and H. Ermert, “Ultrasound synthetic apertureimaging: Monostatic approach,” IEEE Trans. Ultrason., Ferro-elect., Freq. Contr., vol. 41, pp. 333–339, 1994.
[2] C. R. Hazard and G. R. Lockwood, “Theoretical assessmentof a synthetic aperture beamformer for real-time 3-D imag-ing,” IEEE Trans. Ultrason., Ferroelect., Freq. Contr., vol. 46,pp. 972–980, 1999.
[3] S. I. Nikolov, K. Gammelmark, and J. A. Jensen, “Recursiveultrasound imaging,” in Proc. IEEE Ultrason. Symp., 1999, pp.1621–1625.
[4] S. W. Smith, H. G. Pavy, and O. T. von Ramm, “High-speed ul-trasound volumetric imaging system—Part I: Transducer designand beam steering,” IEEE Trans. Ultrason., Ferroelect., Freq.Contr., vol. 38, pp. 100–108, 1991.
[5] G. R. Lockwood, J. R. Talman, and S. S. Brunke, “Real-time3-D ultrasound imaging using sparse synthetic aperture beam-forming,” IEEE Trans. Ultrason., Ferroelect., Freq. Contr., vol.45, pp. 980–988, 1998.
[6] P. Li, E. Ebbini, and M. O’Donnell, “A new filter design tech-nique for coded excitation systems,” IEEE Trans. Ultrason.,Ferroelect., Freq. Contr., vol. 39, pp. 693–699, 1992.
[7] T. X. Misaridis, K. Gammelmark, C. H. Jørgensen, N. Lindberg,A. H. Thomsen, M. H. Pedersen, and J. A. Jensen, “Potentialof coded excitation in medical ultrasound imaging,” Ultrasonics,vol. 38, pp. 183–189, 2000.
[8] K. L. Gammelmark and J. A. Jensen, “Multielement synthetictransmit aperture imaging using temporal encoding,” IEEETrans. Med. Imag., vol. 22, pp. 552–563, 2003.
[9] T. Misaridis, “Ultrasound imaging using coded signals,” Ph.D.dissertation, Ørsted•DTU, Technical University of Denmark,Lyngby, Denmark, 2001.
[10] T. Misaridis and J. A. Jensen, “A new coding concept for fastultrasound imaging using pulse trains,” in Proc. SPIE: Prog.Biomed. Optics Imag., vol. 3, 2002, pp. 68–78.
[11] F. Gran and J. A. Jensen, “Multi element synthetic aperturetransmission using a frequency division approach,” in Proc.IEEE Ultrason. Symp., 2003, pp. 1942–1946.
[12] S. I. Nikolov and J. A. Jensen, “Velocity estimation using syn-thetic aperture imaging,” in Proc. IEEE Ultrason. Symp., 2001,pp. 1409–1412.
[13] J. A. Jensen and S. I. Nikolov, “Transverse flow imaging us-ing synthetic aperture directional beamforming,” in Proc. IEEEUltrason. Symp., 2002, pp. 1488–1492.
[14] A. Macovski, “Ultrasonic imaging using arrays,” Proc. IEEE,vol. 67, pp. 484–495, 1979.
[15] F. L. Thurstone and O. T. von Ramm, “A new ultrasound imag-ing technique employing two-dimensional electronic beam steer-ing,” in Acoustical Holography. vol. 5, P. S. Green, Ed. NewYork: Plenum Press, 1974, pp. 249–259.
[16] D. W. Baker, “Pulsed ultrasonic Doppler blood-flow sens-ing,” IEEE Trans. Sonics Ultrason., vol. SU-17, pp. 170–185,1970.
[17] C. Kasai, K. Namekawa, A. Koyano, and R. Omoto, “Real-timetwo-dimensional blood flow imaging using an autocorrelationtechnique,” IEEE Trans. Sonics Ultrason., vol. SU-32, pp. 458–463, 1985.
[18] O. T. von Ramm, S. W. Smith, and H. G. Pavy, “High-speedultrasound volumetric imaging system—Part II: Parallel pro-cessing and image display,” IEEE Trans. Ultrason., Ferroelect.,Freq. Contr., vol. 38, pp. 109–115, 1991.
[19] S. Bennett, D. K. Peterson, D. Corl, and G. S. Kino, “A real-timesynthetic aperture digital acoustic imaging system,” in Acoust.Imaging, vol. 10, P. Alais and A. F. Metherell, Eds. 1982, pp.669–692.
[20] M. Karaman, P. C. Li, and M. O’Donnell, “Synthetic apertureimaging for small scale systems,” IEEE Trans. Ultrason., Fer-roelect., Freq. Contr., vol. 42, pp. 429–442, 1995.
[21] S. I. Nikolov and J. A. Jensen, “In-vivo synthetic aperture flowimaging in medical ultrasound,” IEEE Trans. Ultrason., Ferro-elect., Freq. Contr., vol. 50, pp. 848–856, 2003.
[22] J. A. Jensen, O. Holm, L. J. Jensen, H. Bendsen, H. M. Ped-ersen, K. Salomonsen, J. Hansen, and S. Nikolov, “Experimen-tal ultrasound system for real-time synthetic imaging,” in Proc.IEEE Ultrason. Symp., vol. 2, 1999, pp. 1595–1599.
[23] S. I. Nikolov, J. P. G. Gonzalez, and J. A. Jensen, “Real time3D visualization of ultrasonic data using a standard pc,” Ultra-sonics, vol. 41, pp. 421–426, 2003.
[24] B. G. Tomov and J. A. Jensen, “A new architecture for a single-chip multi-channel beamformer based on a standard FPGA,” inProc. IEEE Ultrason. Symp., 2001, pp. 1529–1533.
[25] J. A. Jensen, “Field: A program for simulating ultrasoundsystems,” Med. Biol. Eng. Comp., 10th Nordic-Baltic Conf.Biomed. Imag. vol. 34, suppl. 1, pt. 1, pp. 351–353, 1996b.
[26] J. A. Jensen, “Artifacts in velocity estimation using ultrasoundand cross-correlation,” Med. Biol. Eng. Comp., vol. 32/4, suppl.,pp. s165–s170, 1994a.
[27] K. L. Gammelmark and J. A. Jensen, “Experimental study ofconvex coded synthetic transmit aperture imaging,” in Proc.IEEE Ultrason. Symp., 2002, pp. 1573–1576.
[28] S. I. Nikolov, R. Dufait, A. Schoisswohl, and J. A. Jensen,“Three-dimensional real-time synthetic aperture imaging usinga rotating phased array transducer,” in Proc. IEEE Ultrason.Symp., 2002, pp. 1545–1548.
[29] J. A. Jensen and R. Bjerngaard, “Directional velocity estimationusing focusing along the flow direction. II: Experimental inves-tigation,” IEEE Trans. Ultrason., Ferroelect., Freq. Contr., vol.50, pp. 873–880, 2003.
[30] M. H. Pedersen, K. L. Gammelmark, and J. A. Jensen, “Prelimi-nary in-vivo evaluation of convex array synthetic aperture imag-ing,” in Proc. SPIE—Ultrason. Imag. Signal Process., 2004, pp.33–43.
Authorized licensed use limited to: Danmarks Tekniske Informationscenter. Downloaded on December 2, 2009 at 03:41 from IEEE Xplore. Restrictions apply.

jensen et al.: scanner for real-time synthetic aperture data acquisition 891
Jørgen Arendt Jensen (M’93–SM’02)earned his Master of Science in electrical en-gineering in 1985 and the Ph.D. degree in1989, both from the Technical University ofDenmark. He received the Dr.Techn. degreefrom the university in 1996. He has publisheda number of papers on signal processing andmedical ultrasound and the book “Estimationof Blood Velocities Using Ultrasound”, Cam-bridge University Press in 1996. He is also de-veloper of the Field II simulation program. Hehas been a visiting scientist at Duke Univer-
sity, Stanford University, and the University of Illinois at Urbana-Champaign. He is currently full professor of Biomedical Signal Pro-cessing at the Technical University of Denmark at Ørsted•DTU andhead of Center for Fast Ultrasound Imaging. He has given courses onblood velocity estimation at both Duke University and University ofIllinois and teaches biomedical signal processing and medical imag-ing at the Technical University of Denmark. He has given severalshort courses on simulation, synthetic aperture imaging, and flow es-timation at international scientific conferences. He has received sev-eral awards for his research. He is also the co-organizer of a newbiomedical engineering education offered by the Technical Univer-sity of Denmark and the University of Copenhagen. His research iscentered around simulation of ultrasound imaging, synthetic aper-ture imaging and blood flow estimation and constructing systemsfor such imaging.
Svetoslav Ivanov Nikolov received M.Sc.in electrical engineering and MBA in interna-tional business relations from the TechnicalUniversity of Sofia in 1996 and 1997, respec-tively. In 2001 he got a Ph.D. degree from theTechnical University of Denmark, Lyngby. Hisdissertation explored approaches for syntheticaperture tissue and flow imaging, and possi-bilities for real-time 3D imaging.
After completing his doctoral work, hestayed on at Ørsted•DTU, Technical Univer-sity of Denmark as an assistant professor,
where he teaches digital design, software development, and digitalsignal processing. His current research interests are focused on real-time systems and signal processing, and methods for high-resolutiontissue and flow imaging.
Borislav Gueorguiev Tomov was bornon Nov. 28, 1973 in Montana, Bulgaria. Heearned a M.Sc. degree in electronics fromthe Technical University of Sofia, Bulgaria, in1996, and Ph.D. degree form the Danish Tech-nical University, Denmark, in 2003. He is cur-rently an Assistant Professor at the latter. Hisresearch interests include ultrasound imagingand digital signal processing.
Peter Munk received a B.Sc. degree in elec-trical engineering in 1987 from the UniversityCollege of Aarhus, and M.Sc. and Ph.D. de-grees in 1996 and 2000, respectively, from theTechnical University of Denmark (DTU) inCopenhagen.
He joined Bruel & Kjaer A/S, Denmark,later B-K Medical A/S, from 1987 to 2002,where he worked with development and re-search for medical ultrasonic imaging. He iscurrently employed at NATO SACLANT Un-derwater Research Centre, Italy, working on
mine-hunting sonar systems on AUVs. His areas of interest are acous-tics, statistics, navigation, and multi-dimensional signal processingfor imaging and velocity estimation.
Kim Løkke Gammelmark (S’02) was bornin Fakse, Denmark on May 1, 1975. He re-ceived his M.S. degree in electrical engineeringfrom the Technical University of Denmark,Kgs. Lyngby, Denmark, in August 2001. Hecompleted his Ph.D. project in BiomedicalEngineering at the Ørsted•DTU, the Techni-cal University of Denmark in 2004. His majorresearch interests are the application of syn-thetic aperture techniques in medical ultra-sound imaging, and medical ultrasound beam-forming.
Authorized licensed use limited to: Danmarks Tekniske Informationscenter. Downloaded on December 2, 2009 at 03:41 from IEEE Xplore. Restrictions apply.