ultraviolet radiation in the southern seas in early spring ... · nitrous oxide as a dynamical...
TRANSCRIPT
rise. CIO, particularly in the lower stratosphere where it isresponsible for rapid, massive destruction of ozone, has avery strong diurnal cycle, with concentration droppingdramatically in a 2-4-hour period around sunset andincreasing even more rapidly at sunrise. CIO observationswere started during the March sunset period to establishthe altitude range of the "normal" upper stratosphericlayer (which is a persistent global feature), before the onsetof wintertime downward air transport. There was no evi-dence of a lower stratospheric CIO layer at this time. Wecontinued to track the "normal" CIO layer, after realizingthat it remained weakly visible many days after sunset, anddetected it again beginning to appear significantly beforepolar sunrise. It proves, therefore, to be an additional use-ful tracer of lateral transport from regions receiving sun-light. During the spring sunrise period, we also made con-tinuous observations at McMurdo, as well as South Poleobservations of CIO every third or fourth day.NO2. The millimeter-wave emission lines from this mole-cule are numerous but very weak in the normal stratos-phere and have never before been observed with millime-ter-wave equipment. We accidentally discovered the pres-ence of several NO 2 emission lines which fall within thespectral ranges used for CIO and HNO 3 observations, whenobserving the latter species. These lines began to appearlate in May and lasted into July. Their extreme narrownessreveals an origin no lower than approximately 50 km. Dueto the weakness and high altitude of these lines, our obser-vations give a measure of the total column amount only.The increase of mesospheric NO 2 revealed in these andother recent observations is regarded to be a result of pole-ward and downward transport from lower latitudes andhigher altitudes (e.g., Fisher, O'Neill, and Sutton 1993). Webelieve that the present record may be the most completeset of observations of the time duration and variation ofthis process yet obtained.H202. This species has not been observed before withground-based millimeter-wave equipment, although anearlier attempt by us resulted in a useful upper limit beingset (de Zafra et al. 1985). The mixing ratio is quite small,and the emission intensity will be extremely weak. Since
no observational data at polar latitudes was available onthis important species, whose concentration mightincrease in the winter vortex night, we made a brief butunsuccessful attempt to find emission. An upper limit wasset on mixing ratio similar to that of our earlier midlatitudeattempt.
R.L. de Zafra, D.T. Shindell, and C. Trimble all participat-ed in setting up the equipment and debugging it at theAmundsen-Scott Station. C. Trimble remained to maintainthe equipment and conduct all observations through the fol -lowing year.
This work was supported by National Science Founda-tion grant OPP 91-17813. Continuing collateral support wasfurnished by the National Aeronautic and Space Administra-tion's Upper Atmospheric Research Program through grantNAGW 2182. We gratefully acknowledge the expert assistancerendered by Antarctic Support Associates personnel in logis-tics and in readying a building for our use.
References
de Zafra, R., A. Parrish, J. Barrett, and P. Solomon. 1985. An observedupper limit on stratospheric hydrogen peroxide. Journal of Geo-physical Research, 90(D7), 13087-13090.
Farman, J.C., B.G. Gardiner, and J.D. Shanklin. 1985. Large losses oftotal ozone in the Antarctic reveal seasonal CIO/NO interaction.Nature, 315, 207-210.
Fisher, M., A. O'Neill, and R. Sutton. 1993. Rapid descent of meso-spheric air into the stratospheric polar vortex. GeophysicalResearch Letters, 20(12), 1267-1270.
Garcia, R.R., and S. Solomon. 1994. A new numerical model of themiddle atmosphere, 2, Ozone and related species. Journal of Geo-physical Research, 99(D6), 12937-12952.
Lowenstein, M., J.R. Podolsky, K.R. Chan, and S.E. Strahan. 1989.Nitrous oxide as a dynamical tracer in the 1987 Airborne AntarcticOzone Experiment. Journal of Geophysical Research, 94(D9),11589-11598.
Parrish, A., R.L. de Zafra, M. Jaramillo, B. Connor, P.M. Solomon, andJ.W. Barrett. 1988. Extremely low N 20 concentrations in thespringtime stratosphere at McMurdo Station, Antarctica. Nature,332(6159), 53-55.
Roche, A., J.B. Kumer, and J.L. Mergenthaler. 1993. CLAES observa-tions of C1ONO2 and HNO3 in the antarctic stratosphere, betweenJune 15 and September 17, 1992. Geophysical Research Letters,20(12), 1223-1226.
Ultraviolet radiation in the southern seas in early spring 1993GERD WENDLER and TIM QUAKENBUSH, Geophysical Institute, University ofAlaska, Fairbanks, Alaska 99775- 7320
The National Science Foundation research vessel NathanielB. Palmer carried out a cruise to Antarctica in early spring
of 1993. It left Punta Arenas, Chile, close to the tip of SouthAmerica on 11 August 1993, sailed south for 3 days to the tip ofthe Antarctic Peninsula, stopping at O'Higgins and Palmer Sta-tions, and from there went southwest and into the Bellings-hausen Sea. On 10 September, it reached the most southerly
position, 71 0S, some distance north of the Thurston Island.From there, it went as far as 1 10°W before returning to PuntaArenas. The main purpose of the cruise was to investigate thesnow- and sea-ice thickness, properties, and structures in thispart of the southern oceans (Jeifries 1994). It also allowed us tocarry out continuous radiation measurements. We measuredthe following fluxes: global radiation (Eppley PSP), infrared
ANTARCTIC JOURNAL - REVIEW 1994254
incoming radiation (Eppley Pyrgeometer PM),120ultraviolet-A radiation (Eppley UV meter), ultravio-
let-B radiation (Yankee Environmental Systems),100
and pitch and roll of the ship (Lucas Sensing Sys-80tems, Inc.). All instruments were sampled twice per
second (Campbell Scientific, Model 21 X), and a60
notebook computer (ASI Patriot) stored 1-minute40averages of the radiation data and 1-minute stan-
dard deviation of the ship's pitch and roll. Visual20observations of cloud cover were also recorded. 0
First, the validity of the data had to be con-
firmed, and we were able to demonstrate the validity4.0
for hourly values. We normalized the ultraviolet flux-3.5
es by dividing them by the global radiation and were30
able to show that these values were independent of2.5the ship's movement. Some of the results follow:20• The radiative levels changed substantially during
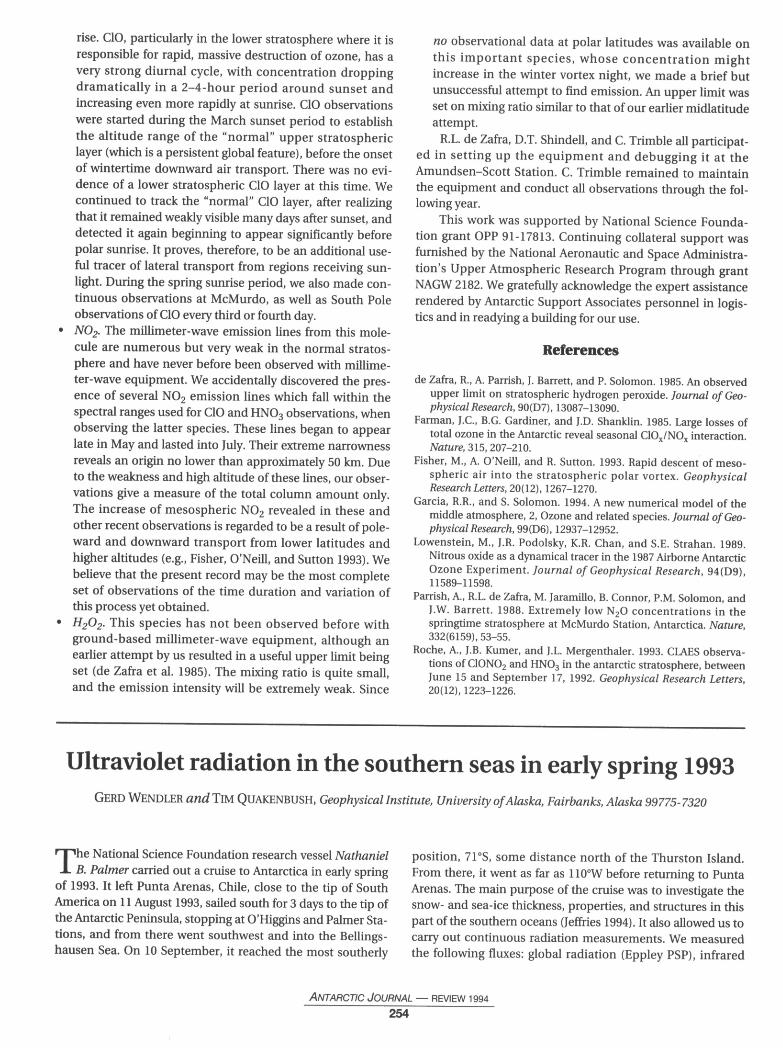
the trip, as both latitude and season changed. In1.5
figure 1, daily values of global, ultraviolet-A, and1.0ultraviolet-B radiation are presented. 0.5
•
AI value of the clearness index K (total0.0transmissivity) was found to be 0.44. This is a low
value, but the cloudiness was high (mean value0.07
78 percent). The clearness index increased with0.06
decreasing cloudiness from 0.41 for overcast to0.05
0.62 for clear-sky conditions. Individual daily val-004ues varied even more but were always between0.2 and 0.8. 0.03
• The ultraviolet-A and ultraviolet-B radiation0.02
were related to the global radiation. Correlation0.01coefficients increased substantially when the
relationship was investigated for different cloudi-0.00
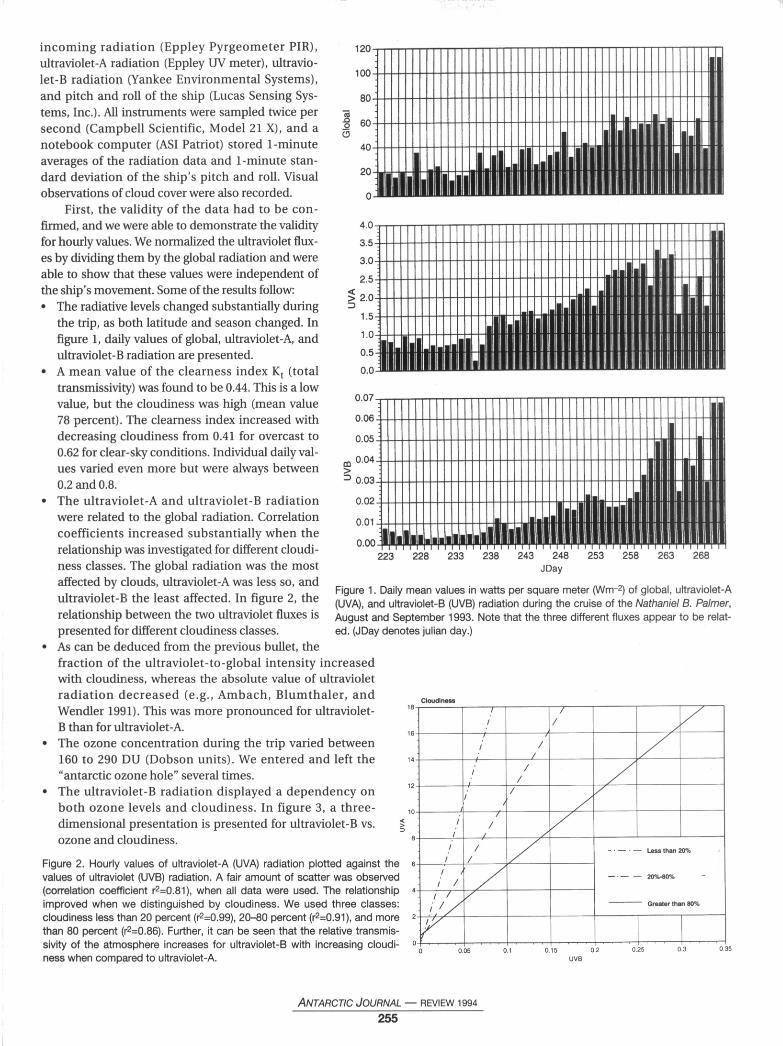
ness classes. The global radiation was the mostaffected by clouds, ultraviolet-A was less so, andultraviolet-B the least affected. In figure 2, therelationship between the two ultraviolet fluxes ispresented for different cloudiness classes.
• As can be deduced from the previous bullet, thefraction of the ultraviolet-to-global intensity increasedwith cloudiness, whereas the absolute value of ultravioletradiation decreased (e.g., Ambach, Blumthaler, andWendler 1991). This was more pronounced for ultraviolet-B than for ultraviolet-A.
• The ozone concentration during the trip varied between160 to 290 DU (Dobson units). We entered and left the"antarctic ozone hole" several times.
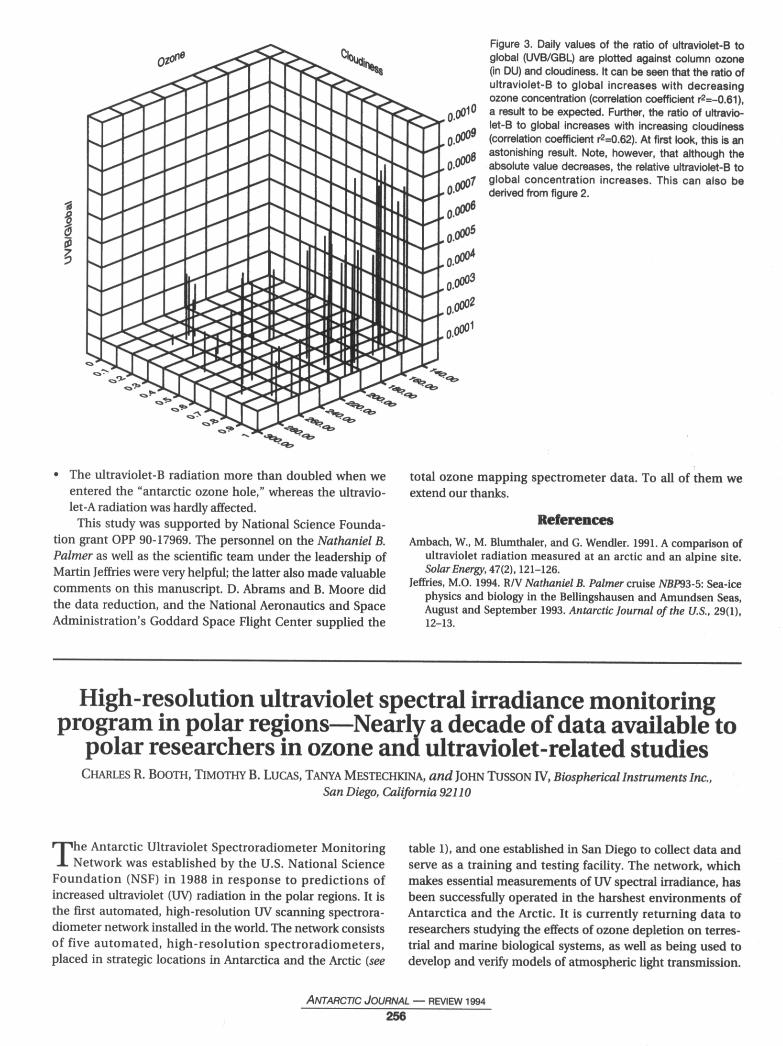
• The ultraviolet-B radiation displayed a dependency onboth ozone levels and cloudiness. In figure 3, a three-dimensional presentation is presented for ultraviolet-B vs.ozone and cloudiness.
223228233238243248253258263268JDay
CloudinesslB
I /16
14- I
12
10
!/8!/
Less than 20%
2080%
Greater than 80%
00.050.10.150.20.250.30.35UVB
Figure 1. Daily mean values in watts per square meter (Wm- 2) of global, ultraviolet-A(UVA), and ultraviolet-B (UVB) radiation during the cruise of the Nathaniel B. Palmer,August and September 1993. Note that the three different fluxes appear to be relat-ed. (JDay denotes julian day.)
Figure 2. Hourly values of ultraviolet-A (UVA) radiation plotted against thevalues of ultraviolet (UVB) radiation. A fair amount of scatter was observed(correlation coefficient r2=0.81), when all data were used. The relationshipimproved when we distinguished by cloudiness. We used three classes:cloudiness less than 20 percent (r2=0.99), 20-80 percent (r2=0.91), and morethan 80 percent (r2=0.86). Further, it can be seen that the relative transmis-sivity of the atmosphere increases for ultraviolet-B with increasing cloudi-ness when compared to ultraviolet-A.
ANTARCTIC JOURNAL - REVIEW 1994255
0.0010
0.0009
0.0008
0.0006
0
0.0001
Figure 3. Daily values of the ratio of ultraviolet-13 toglobal (UVB/GBL) are plotted against column ozone(in DU) and cloudiness. It can be seen that the ratio ofultraviolet-B to global increases with decreasingozone concentration (correlation coefficient r2=-0.61),a result to be expected. Further, the ratio of ultravio-let-13 to global increases with increasing cloudiness(correlation coefficient r2=0.62). At first look, this is anastonishing result. Note, however, that although theabsolute value decreases, the relative ultraviolet-B toglobal concentration increases. This can also bederived from figure 2.
• The ultraviolet-B radiation more than doubled when weentered the "antarctic ozone hole," whereas the ultravio-let-A radiation was hardly affected.
This study was supported by National Science Founda-tion grant OPP 90-17969. The personnel on the Nathaniel B.Palmer as well as the scientific team under the leadership ofMartin Jeffries were very helpful; the latter also made valuablecomments on this manuscript. D. Abrams and B. Moore didthe data reduction, and the National Aeronautics and SpaceAdministration's Goddard Space Flight Center supplied the
total ozone mapping spectrometer data. To all of them weextend our thanks.
ReferencesAmbach, W., M. Blumthaler, and G. Wendler. 1991. A comparison of
ultraviolet radiation measured at an arctic and an alpine site.Solar Energy, 47(2), 121-126.
Jeffries, M.O. 1994. R/V Nathaniel B. Palmer cruise NBP93-5: Sea-icephysics and biology in the Bellingshausen and Amundsen Seas,August and September 1993. Antarctic Journal of the U.S., 29(1),12-13.
High-resolution ultraviolet spectral irradiance monitoringprogram in polar regions—Nearly a decade of data available to
polar researchers in ozone and ultraviolet-related studiesCHARLES R. BOOTH, TIMoThY B. LucAs, TANYA MESTECHKINA, and JOHN TUSSON IV, Biospherical Instruments Inc.,
San Diego, California 92110
The Antarctic Ultraviolet Spectroradiometer MonitoringNetwork was established by the U.S. National Science
Foundation (NSF) in 1988 in response to predictions ofincreased ultraviolet (UV) radiation in the polar regions. It isthe first automated, high-resolution UV scanning spectrora-diometer network installed in the world. The network consistsof five automated, high-resolution spectroradiometers,placed in strategic locations in Antarctica and the Arctic (see
table 1), and one established in San Diego to collect data andserve as a training and testing facility. The network, whichmakes essential measurements of UV spectral irradiance, hasbeen successfully operated in the harshest environments ofAntarctica and the Arctic. It is currently returning data toresearchers studying the effects of ozone depletion on terres-trial and marine biological systems, as well as being used todevelop and verify models of atmospheric light transmission.
ANTARCTIC JOURNAL - REVIEW 1994256