umass lowell center for public opinion national survey
TRANSCRIPT

UMASS LOWELL CENTER FOR PUBLIC OPINION
National survey: Occupy Wall Street/Tea Party/Ideology
Oct. 28-Nov. 1, 2011 - 1,005 American adults
Sample design: Probability-based online sample of adults age 18+ in all 50 states + DC from panel recruited using address-
based sampling; laptops/online access provided to panelists who couldn’t get online otherwise. English only.
Form A/Form B: each a random half sample.
Survey producer: Mike Mokrzycki for the University of
Massachusetts Lowell
Data collection/tabulation: Knowledge Networks, sampling
from national KnowledgePanel®
Subgroup sizes and sampling error for:
All adults (n=1,005): +/- 3.8 percentage points
All registered voters (n=776): +/- 4.3 percentage points Half sample Form A (n=500): +/- 5.3 points
Half sample Form B (n=505): +/- 5.4 points
View Occupy Wall Street favorably (n=345): +/- 6.4 points
View Tea Party movement favorably (n=327): +/- 7.0 points
View both movements favorably (n=89): +/- 13 points *** SMALL SUBGROUP ***
View both movements unfavorably (n=206): +/- 8.3 points
Results are shown for all adults unless noted otherwise.
RVs = subset of adults who are registered to vote at their current address
FAV = favorable; UNFAV = unfavorable
Percentages may not add to 100% because of rounding.
See http://uml.edu/poll for analysis and methodology detail
One University Avenue
Lowell, MA 01854
Telephone: 978.934.3224

University of Massachusetts Lowell – Center for Public Opinion
National poll: Occupy Wall Street/Tea Party/ideology
Probability-based online survey – Oct. 28-Nov. 1, 2011 – N=1,005 adults
2
Q.1 Which comes closer to your view: [RANDOMIZE ORDER OF ITEMS] ALL RVs
Government should do more to solve problems 51% 47%
Government is doing too many things better 48 53 left to businesses and individuals ___ ___
100 100
Crosstabs among all adults:

University of Massachusetts Lowell – Center for Public Opinion
National poll: Occupy Wall Street/Tea Party/ideology
Probability-based online survey – Oct. 28-Nov. 1, 2011 – N=1,005 adults
3
Q.2 Generally speaking, how much influence would you say the following have on American politics today: [GRID; RANDOMIZE ORDER OF ITEMS] Too little
influence
About the
right amount
Too much
influence
People who are not wealthy 74% 15% 9%
Labor unions 22% 38% 39%
Political action committees, which
finance political campaigns 7% 19% 74%
Wall Street and large corporations 4% 15% 80%

University of Massachusetts Lowell – Center for Public Opinion
National poll: Occupy Wall Street/Tea Party/ideology
Probability-based online survey – Oct. 28-Nov. 1, 2011 – N=1,005 adults
4
Q.3 Overall, what is your impression of: [GRID; RANDOMIZE ORDER OF ITEMS]
FAVORABLE UNFAVORABLE Don’t
know NET Strongly Somewhat NET Somewhat Strongly
The Occupy Wall
Street movement 35% 13% 23% 40% 20% 21% 24%
The Tea Party
movement 29% 10% 19% 50% 19% 31% 21%
Wall Street and
large corporations 16% 1% 15% 71% 33% 38% 12%
The government in
Washington 21% 2% 19% 71% 35% 36% 8%
University of Massachusetts Lowell – Center for Public Opinion
National poll: Occupy Wall Street/Tea Party/ideology
Probability-based online survey – Oct. 28-Nov. 1, 2011 – N=1,005 adults
5
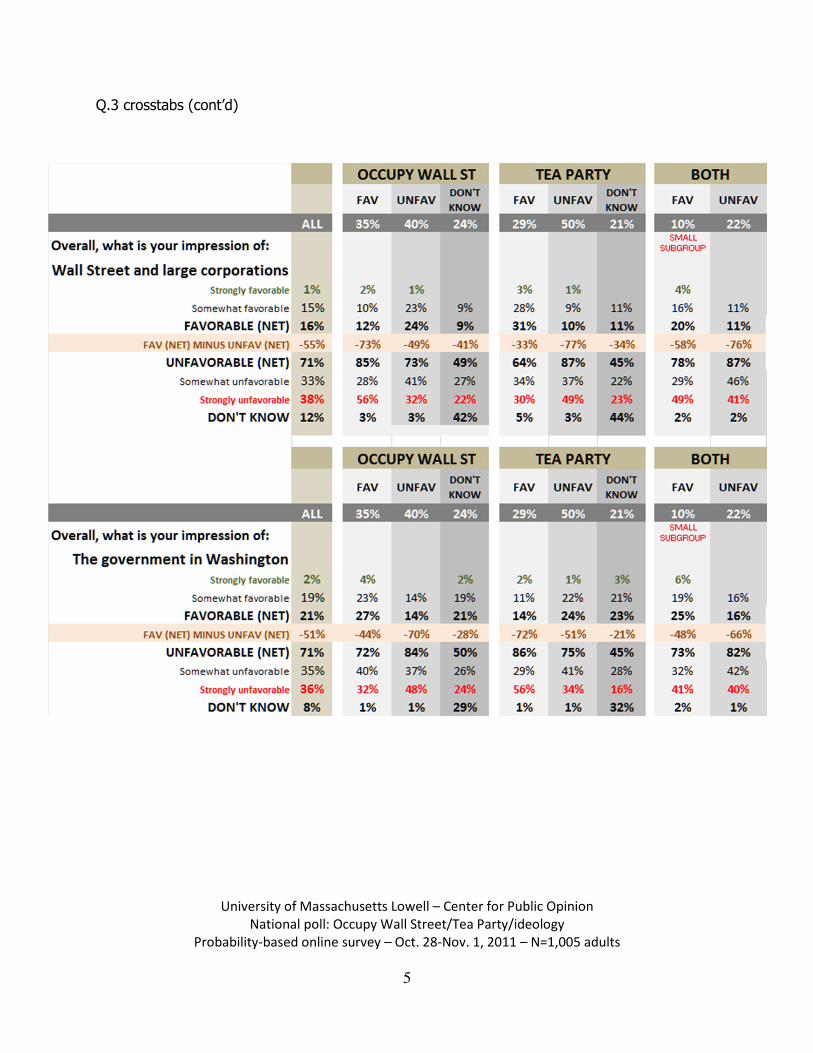
Q.3 crosstabs (cont’d)

University of Massachusetts Lowell – Center for Public Opinion
National poll: Occupy Wall Street/Tea Party/ideology
Probability-based online survey – Oct. 28-Nov. 1, 2011 – N=1,005 adults
6
ASKED OF FORM A HALF SAMPLE (n=500) Q.4 [DISPLAY RESPONSE CATEGORIES IN LIST; REVERSE ORDER FOR HALF OF
FORM A RESPONDENTS] LIBERAL MODERATE CONSERVATIVE NET Very Somewhat Somewhat Very NET In general, would you
describe your political views
as:
22% 6% 16% 48% 21% 8% 30%
ASKED OF FORM B HALF SAMPLE (n=505) Q.5 [GRID; RANDOMIZE ITEMS; REVERSE ORDER OF RESPONSE CATEGORIES
FOR HALF OF FORM B RESPONDENTS] In general, how would you
describe your views on:
LIBERAL MODERATE CONSERVATIVE
NET Very Somewhat Somewhat Very NET
Social issues
such as gay
marriage and abortion
36% 20% 16% 30% 12% 20% 33%
Fiscal issues such as taxes
and spending 18% 5% 13% 22% 22% 15% 36%
Q.4-5 crosstabs on next page

University of Massachusetts Lowell – Center for Public Opinion
National poll: Occupy Wall Street/Tea Party/ideology
Probability-based online survey – Oct. 28-Nov. 1, 2011 – N=1,005 adults
7
---END---