umassamherst transportation center understanding distraction knodler netsc.pdf · $100 with a...
TRANSCRIPT

Understanding Distraction
Michael A. Knodler JrNortheast Safety Conference
October 24, 2017
UMassAmherst Transportation Center
Distraction= Bad

Visit to UMass‐Amherst
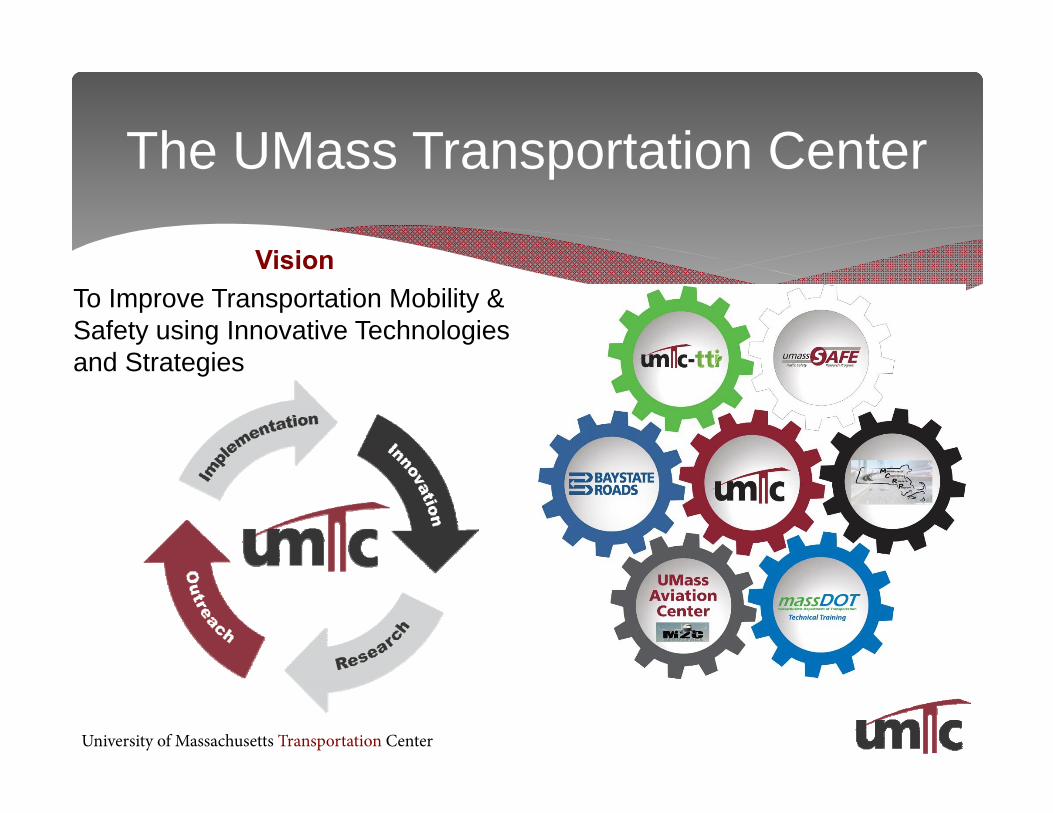
VisionTo Improve Transportation Mobility & Safety using Innovative Technologies and Strategies
The UMass Transportation Center
University of Massachusetts Transportation Center

About UMassSafe
Support highway safety through combined approach
Scientific data-driven problem identification, program design, and
evaluation
Traditional highway safety practices
(engineering, enforcement &
education)
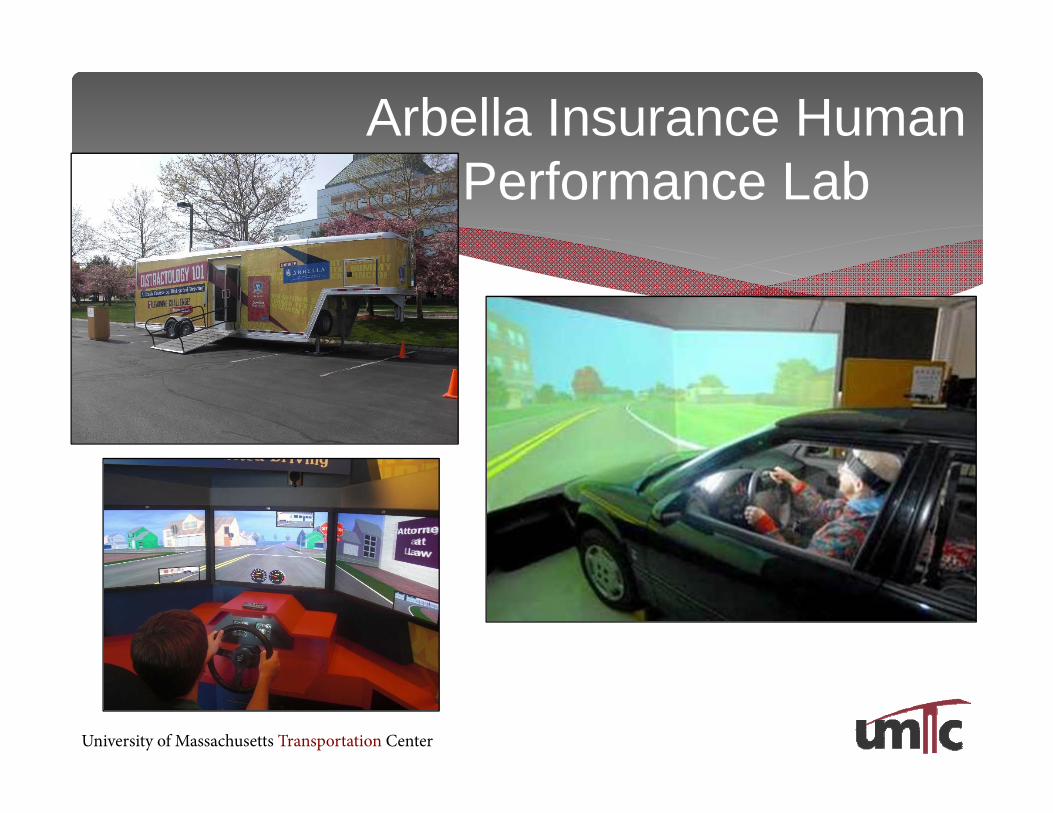
Arbella Insurance Human Performance Lab
University of Massachusetts Transportation Center

Background – Massachusetts Laws
Text Messaging
Drivers are not allowed to manipulate any electronic device to send, write or read messages. The
penalty is $100 for the first offense, $250 for the second and $500 for subsequent every
offense5.
Junior Operators (CDL) Commercial Drivers License
Drivers under 18 years of age, are not permitted to use cell phones while
driving. The first offense is $100 with a 60‐day license suspension, the second is
$250 with 180‐day suspension, and the third
is $500 with 1‐year suspension5.
Mobile device use prohibited is nationwide while operating vehicles that require a CDL. These larger vehicles require
specific licensure resulting in greater penalties,
including fines of up to $2,750 or loss of CDL for
repeat offenders6.
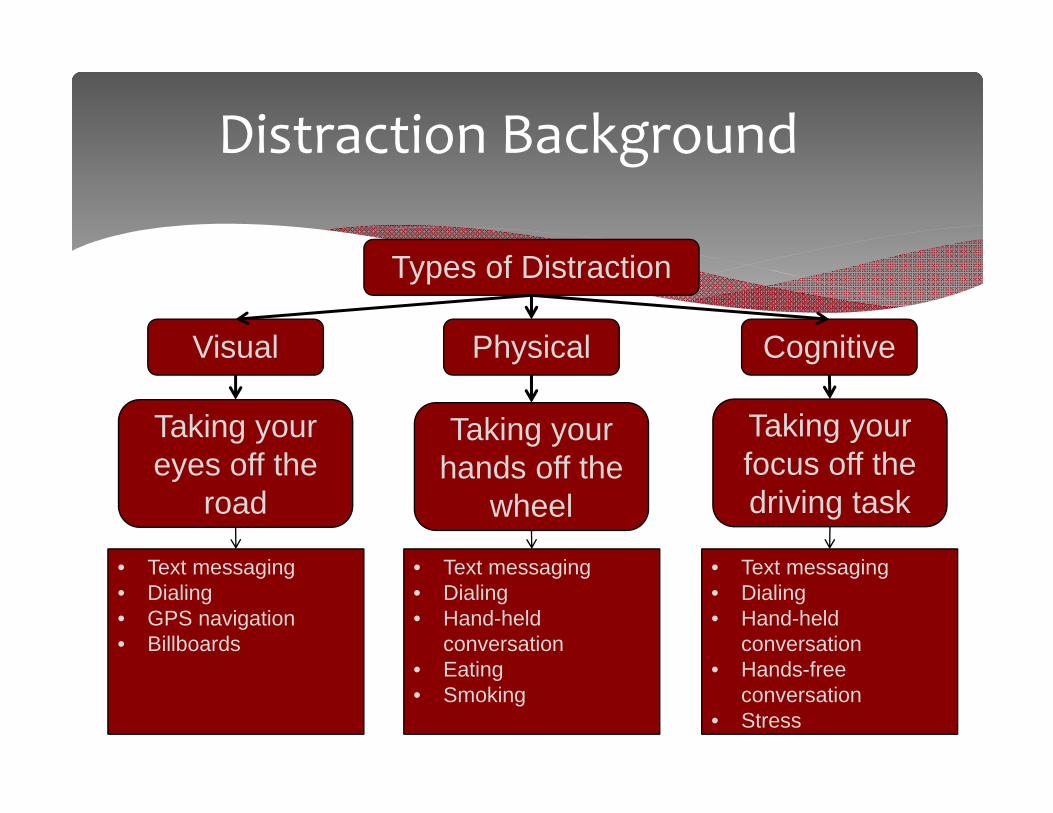
Distraction Background
Types of Distraction
PhysicalVisual Cognitive
Taking your eyes off the
road
Taking your hands off the
wheel
Taking your focus off the driving task
• Text messaging• Dialing• GPS navigation• Billboards
• Text messaging• Dialing• Hand-held
conversation• Eating• Smoking
• Text messaging• Dialing• Hand-held
conversation• Hands-free
conversation• Stress
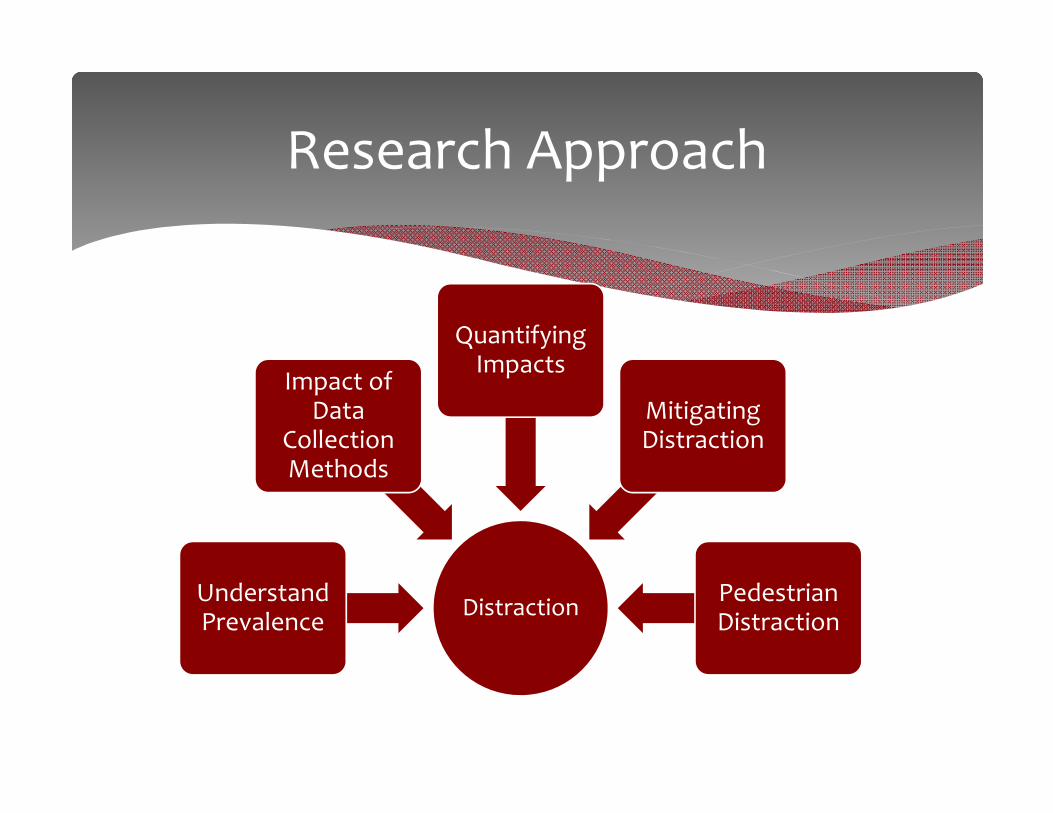
Research Approach
DistractionUnderstand Prevalence
Impact of Data
Collection Methods
Quantifying Impacts
Mitigating Distraction
Pedestrian Distraction

Nationwide Belt Usage
0%
10%
20%
30%
40%
50%
60%
70%
80%
90%
100%
2003
Saf
ety
Bel
t Use
Rat
es
Primary Secondary
Source: Glassbrenner, D. Safety Belt Use in 2003 - Use Rates in the States and Territories , NHTSA Technical Report March 2004
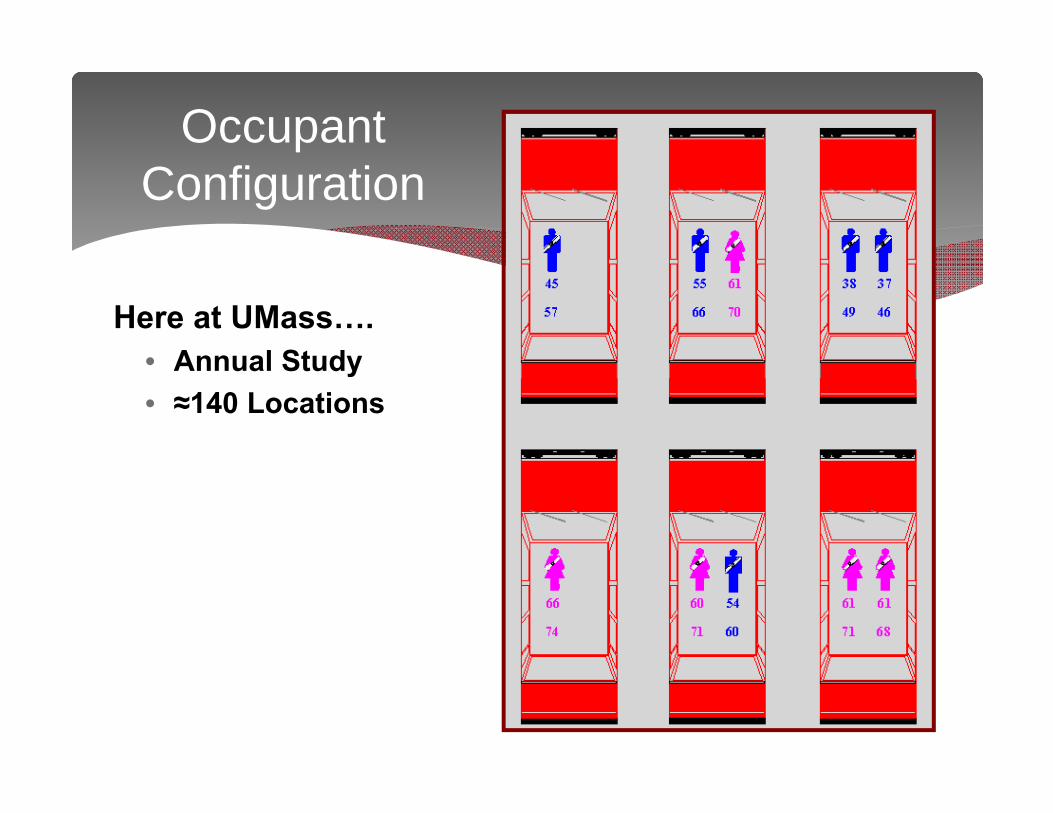
Occupant Configuration
Here at UMass….• Annual Study• ≈140 Locations

Direct Observation
Observation survey of drivers’ cell phone and seat belt use in MA Controlled intersections Teams of two Day time observations (7AM‐7PM) 1 hour in duration
Large scale statewide observations 100+ observation locations 15,000+ drivers observed Allows for demographic comparisons
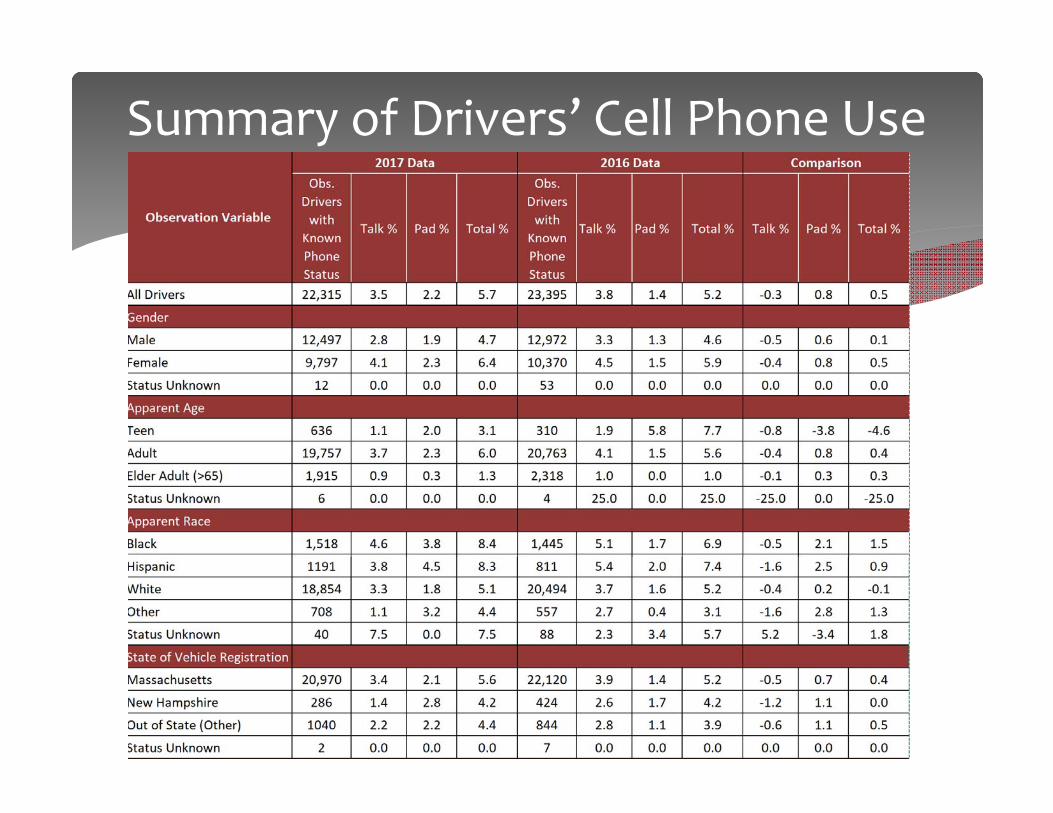
Summary of Drivers’ Cell Phone Use Prevalence ‐ 2017
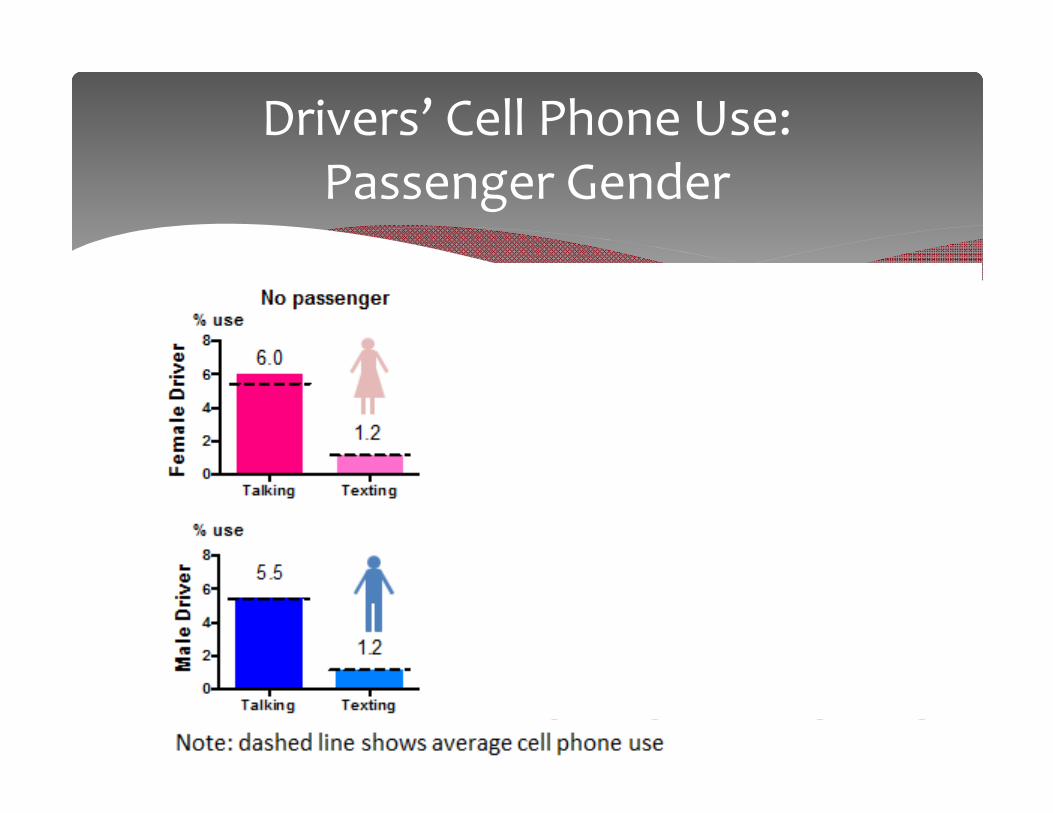
Drivers’ Cell Phone Use: Passenger Gender
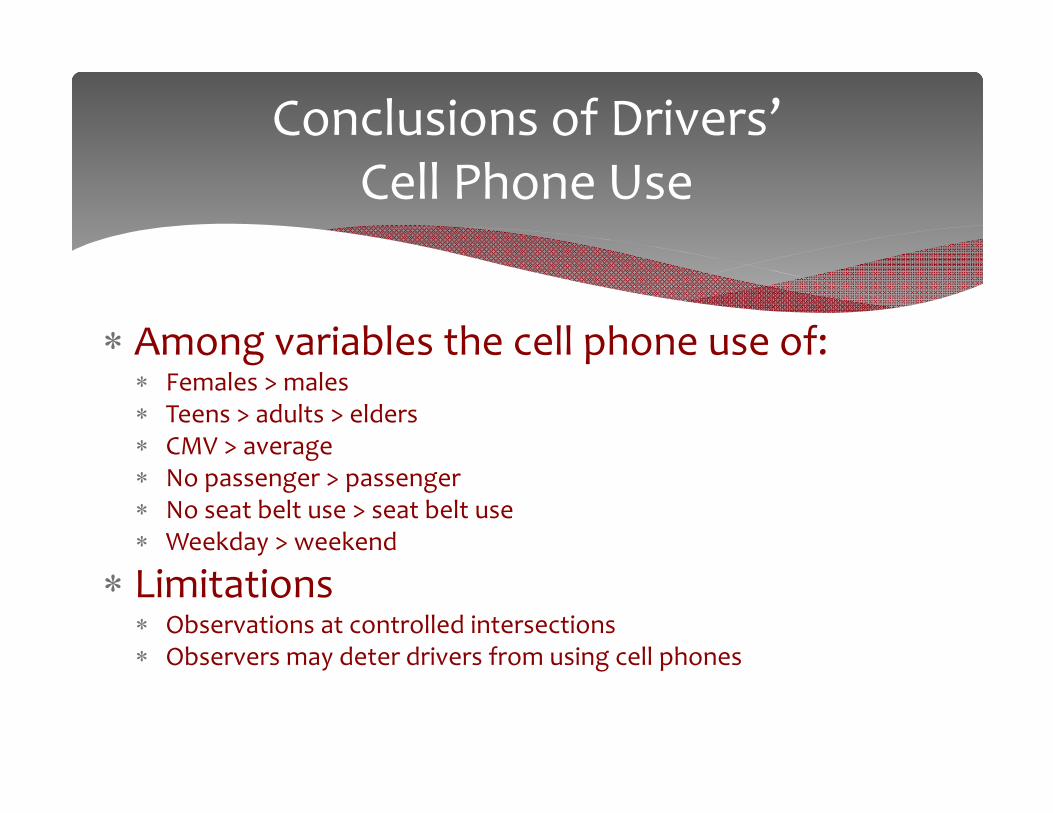
Conclusions of Drivers’ Cell Phone Use
Among variables the cell phone use of: Females > males Teens > adults > elders CMV > average No passenger > passenger No seat belt use > seat belt use Weekday > weekend
Limitations Observations at controlled intersections Observers may deter drivers from using cell phones
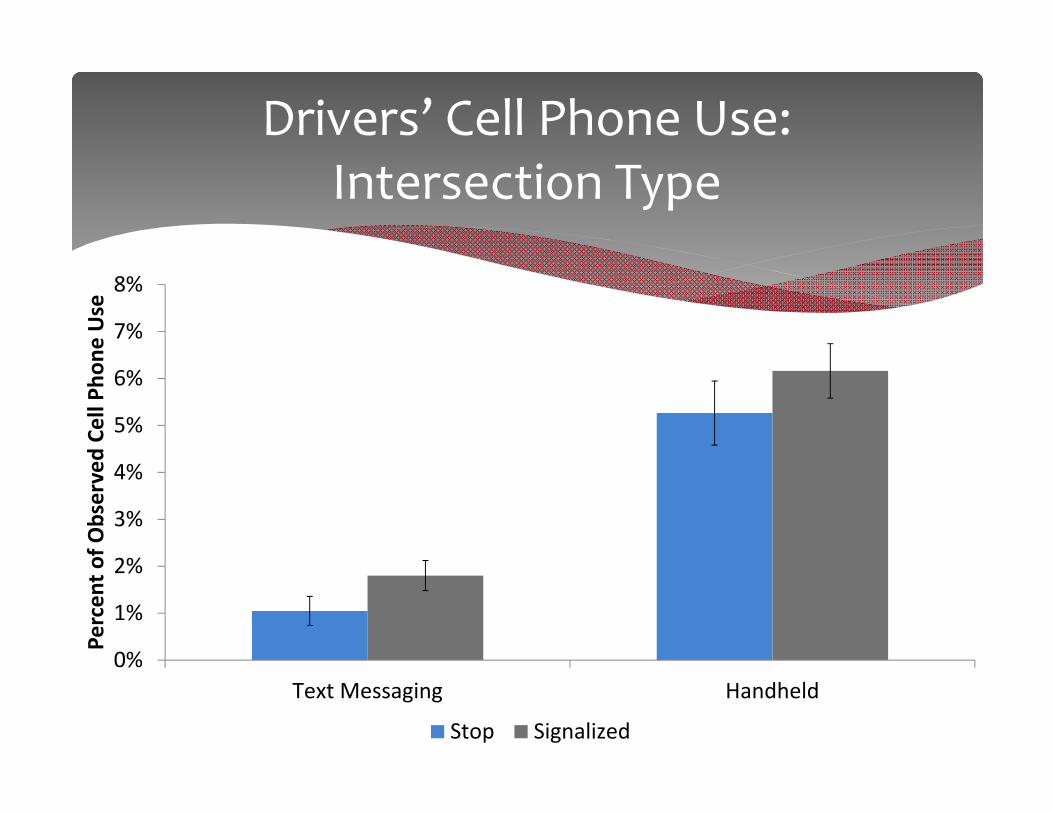
Drivers’ Cell Phone Use: Intersection Type
0%
1%
2%
3%
4%
5%
6%
7%
8%
Text Messaging Handheld
Percen
t of O
bserved Ce
ll Ph
one Use
Stop Signalized
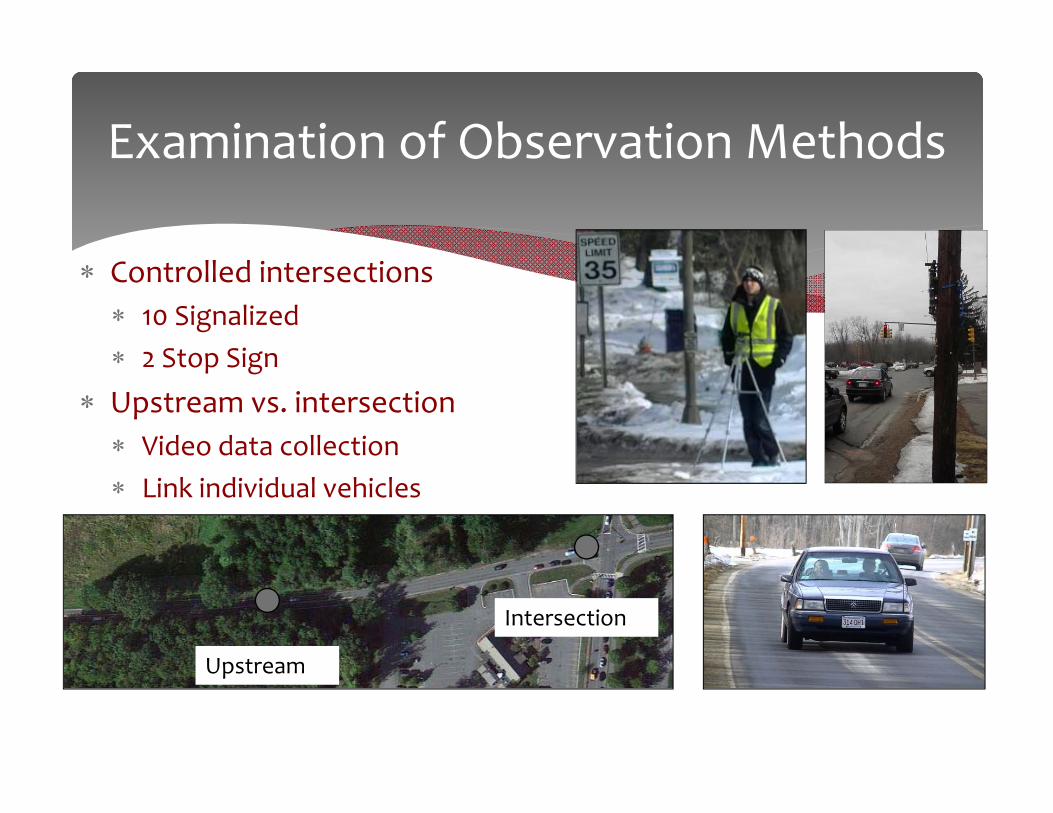
Examination of Observation Methods
Controlled intersections 10 Signalized 2 Stop Sign
Upstream vs. intersection Video data collection Link individual vehicles
Upstream
Intersection
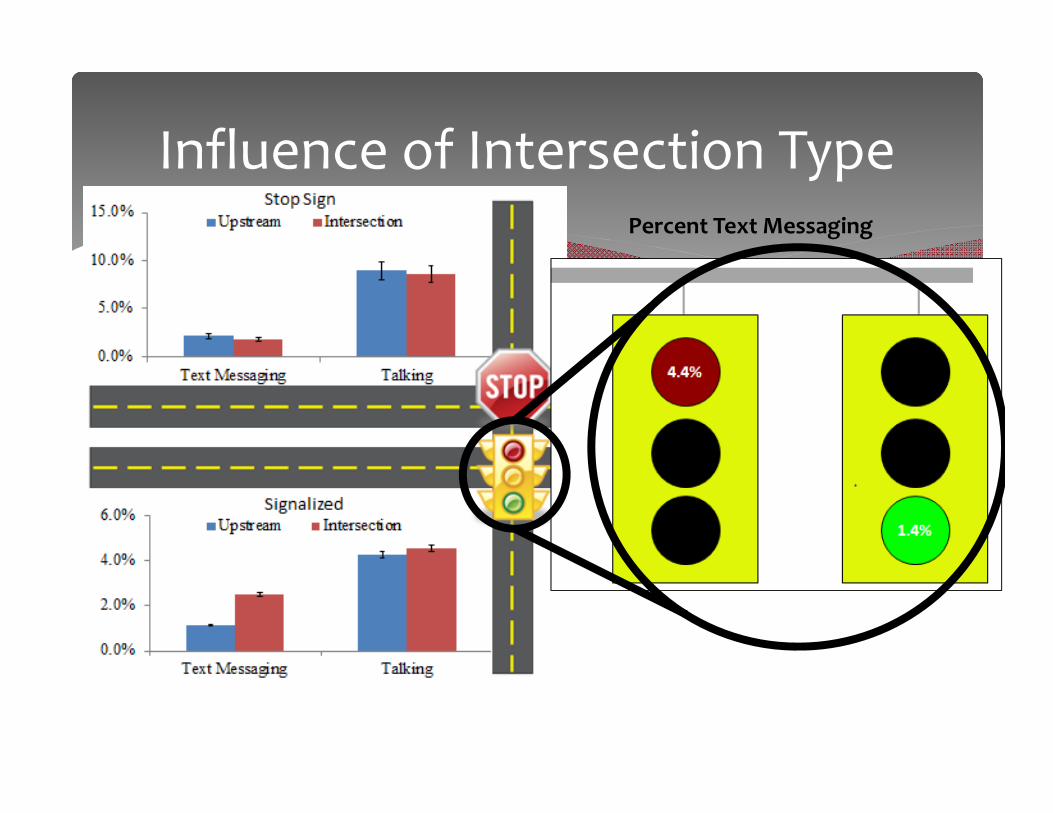
Percent Text Messaging
Influence of Intersection Type

Influence of Observer
Signalized intersection Two observations No observer Observer at intersection
Constant variables Same locations Day of week Time of day Weather

The Influence of an Observer
0.0%
0.5%
1.0%
1.5%
2.0%
2.5%
3.0%
3.5%
4.0%
4.5%
Upstream Intersection Upstream Intersection
Text Messaging Percentage Talking Percentage
Percen
t of O
bserved Ce
ll Ph
one Use
No Observer One Observer at the Intersection

Mobile Distraction Field Observations
Research team observed driver behavior from a probe vehicle Site information (roadway type, date, weather, time) was be recorded
17 driving periods with 89 segments and 1575 recorded observations
Observed variables of interest:
VEHICLE TRAVEL LANE ACTION DRIVER PASSENGERPassenger Left Lane Passing Male Age 16‐19 Distraction: Holding Position: Adult 1 Child Seated Front Action:SUV Middle Lane Non‐passing Female Age 20‐39 Cell Talk 12:00 Elder 2 Children Seated Back AlertPick‐Up Right Lane Stopped Unknown Age 40‐59 Cell Touch 2:00 / 10:00 Teen 3 Children Cell UseMini‐Van Other: At Crosswalk Age 60+ iPad/Tablet 6:00 Child SleepingCommercial Other: Unknown Other: Other: None Other:
No Distraction

Field Observations—Results
Summary
Distraction Type Count Percent of
Observations Cell Talk 124 7.87% Cell Touch 74 4.70% No Distraction 1,306 82.92% Other 71 4.51% Total 1,575 100.00%
7.87%4.70%
82.92%
4.51%
Percent of Observations for Total Distraction Type
Cell Talk Cell Touch No Distraction Other
Field Observations—Results
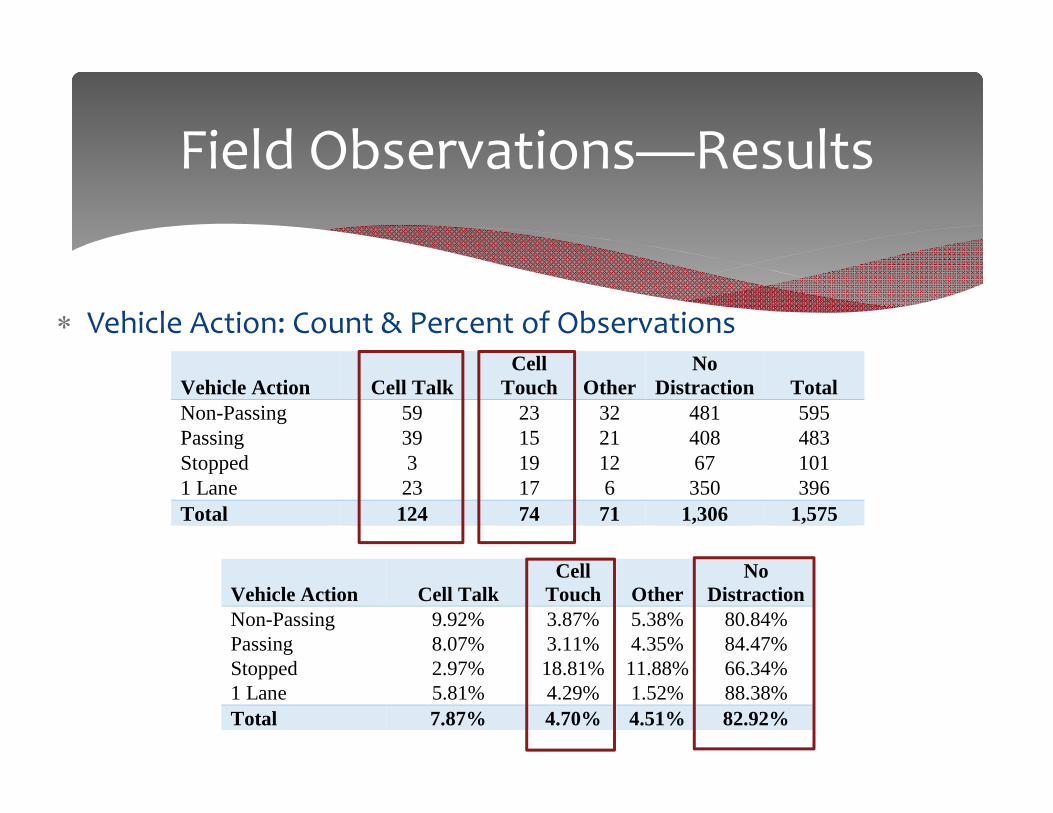
Vehicle Action: Count & Percent of Observations
Vehicle Action Cell Talk Cell
Touch Other No
Distraction Total Non-Passing 59 23 32 481 595 Passing 39 15 21 408 483 Stopped 3 19 12 67 101 1 Lane 23 17 6 350 396 Total 124 74 71 1,306 1,575
Vehicle Action Cell Talk Cell
Touch Other No
DistractionNon-Passing 9.92% 3.87% 5.38% 80.84% Passing 8.07% 3.11% 4.35% 84.47% Stopped 2.97% 18.81% 11.88% 66.34% 1 Lane 5.81% 4.29% 1.52% 88.38% Total 7.87% 4.70% 4.51% 82.92%

Field Observations—Results
Holding Position
Holding Position Cell Talk Cell
Touch OtherNo
Distraction Total 12:00 78 24 32 232 366 2:00/10:00 8 12 10 311 341 6:00 19 25 14 170 228 Other 1 6 1 14 22 Not Recorded 18 7 14 579 618 Total 124 74 71 1,306 1,575
Holding Position Cell Talk Cell
Touch Other No
Distraction12:00 21.31% 6.56% 8.74% 63.39% 2:00/10:00 2.35% 3.52% 2.93% 91.20% 6:00 8.33% 10.96% 6.14% 74.56% Other 4.55% 27.27% 4.55% 63.64% Not Recorded 2.91% 1.13% 2.27% 93.69% Total 7.87% 4.70% 4.51% 82.92%

Recommendations for Observation Methods
Signalized intersections Add a cell phone use type “texting while stopped” Observe upstream
Stop sign controlled No change necessary
Influence of observers No change necessary Large scale study may show difference
Vehicle action while moving is arguably more important
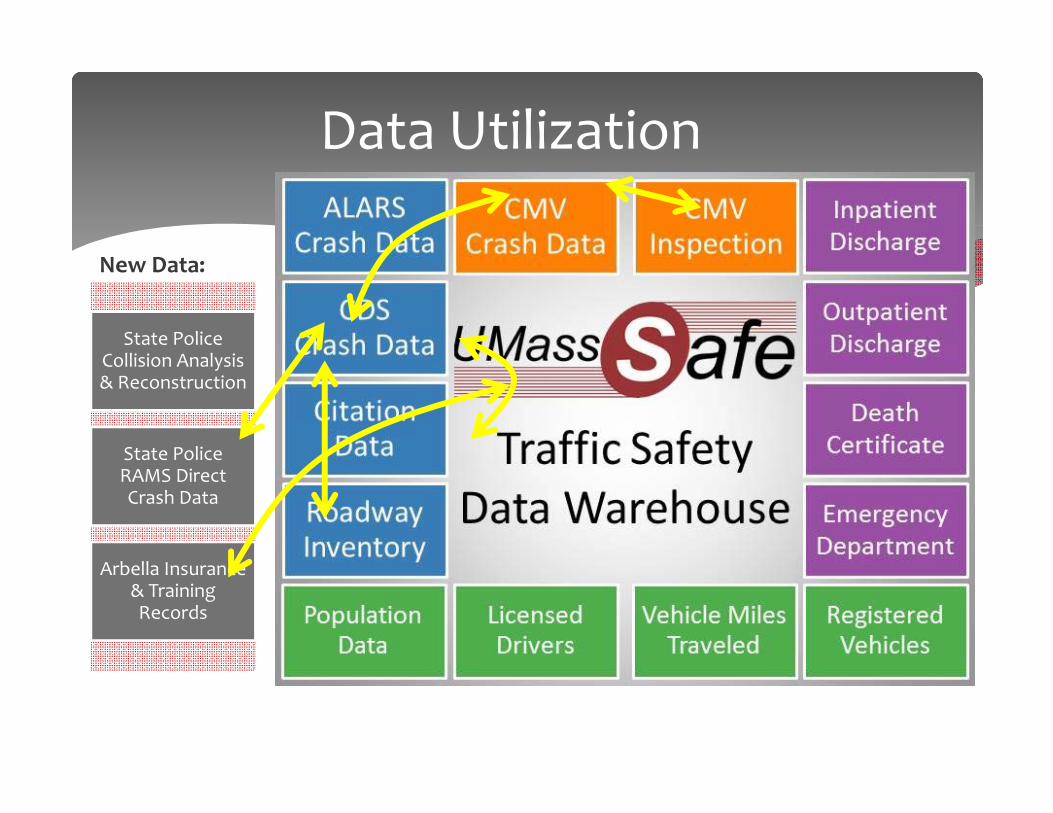
Data Utilization
State Police Collision Analysis & Reconstruction
State Police RAMS Direct Crash Data
Arbella Insurance & Training Records
New Data:

Crash Data Analyses
Massachusetts Safe Driving Law Effective September
30, 2010 Determine crash hot spots using GIS
Where are these crashes occurring?
Changes before and after MA Safe Driving Law?
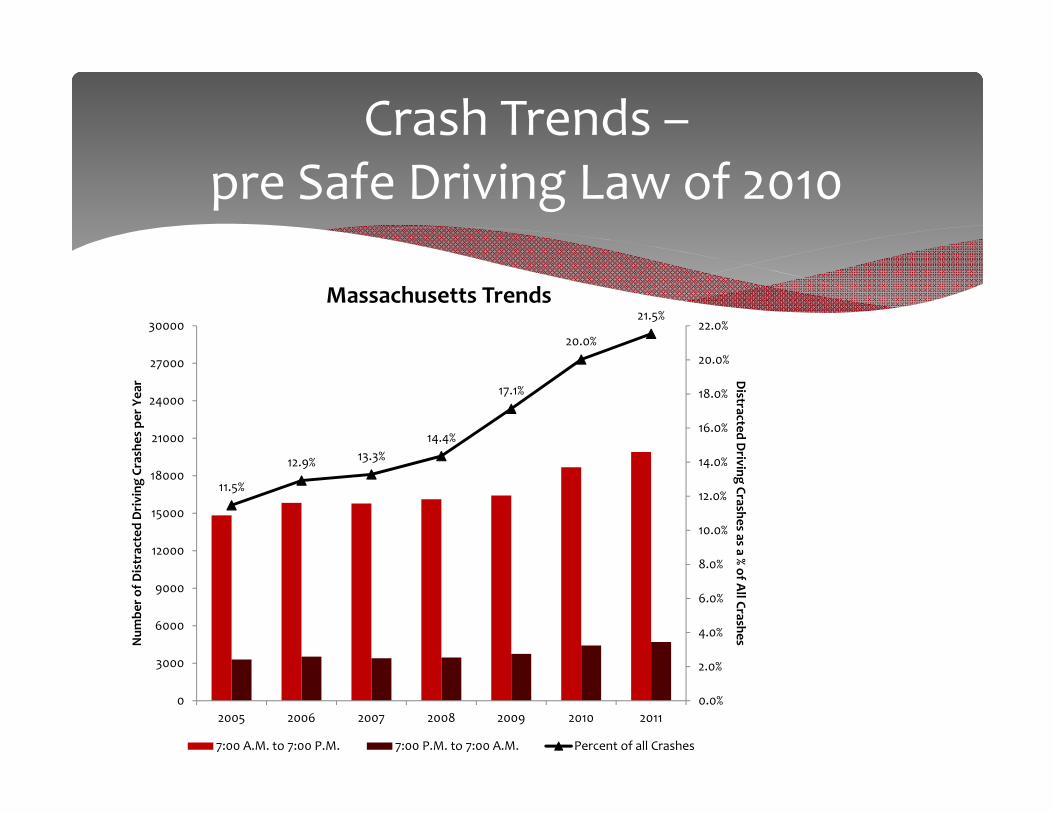
Crash Trends –pre Safe Driving Law of 2010
11.5%
12.9% 13.3%14.4%
17.1%
20.0%
21.5%
0.0%
2.0%
4.0%
6.0%
8.0%
10.0%
12.0%
14.0%
16.0%
18.0%
20.0%
22.0%
0
3000
6000
9000
12000
15000
18000
21000
24000
27000
30000
2005 2006 2007 2008 2009 2010 2011
Distracted D
riving Crashes as a % of All CrashesN
umbe
r of D
istrac
ted Driving Crash
es per Yea
r
Massachusetts Trends
7:00 A.M. to 7:00 P.M. 7:00 P.M. to 7:00 A.M. Percent of all Crashes

Trends in Distracted DrivingCrashes by Age
0%
5%
10%
15%
20%
25%
0
2000
4000
6000
8000
10000
12000
14000
16000
18000
20000
2007 2008 2009 2010 2011
Percen
t of Distracted Driv
ing Crashe
s
Num
ber o
f Distracted Driv
ing Crashe
s
Teen Adult ElderTeen Percentage Adult Percentage Elder Percentage

Conclusions Regarding Safety Impacts
Observed a relationship between cell phone use rate and distracted driving crash rate
• Teens had the highest distracted driving crash rate and the highest cell phone use rate
• Females had the highest distracted driving crash rate and the highest observed cell phone use rate
Age and Gender Safety Implications
0 5 10 15 200
5
10
15
Cel
l Pho
ne U
se (%
)
Distracted Driving Crash Rate (%)
Male TeenMale Adult
Male Elder
Female Teen
Female Adult
Female Elder

Influence of Speed on Distracted Driving Crashes
0.0%
5.0%
10.0%
15.0%
20.0%
25.0%
30.0%
35.0%
0
5000
10000
15000
20000
25000
30000
5 10 15 20 25 30 35 40 45 50 55 60 65
Percen
t of Distracted Driv
ing Crashe
s
Num
ber o
f Distracted Driv
ing Crashe
s
Speed Limit
Number Percent
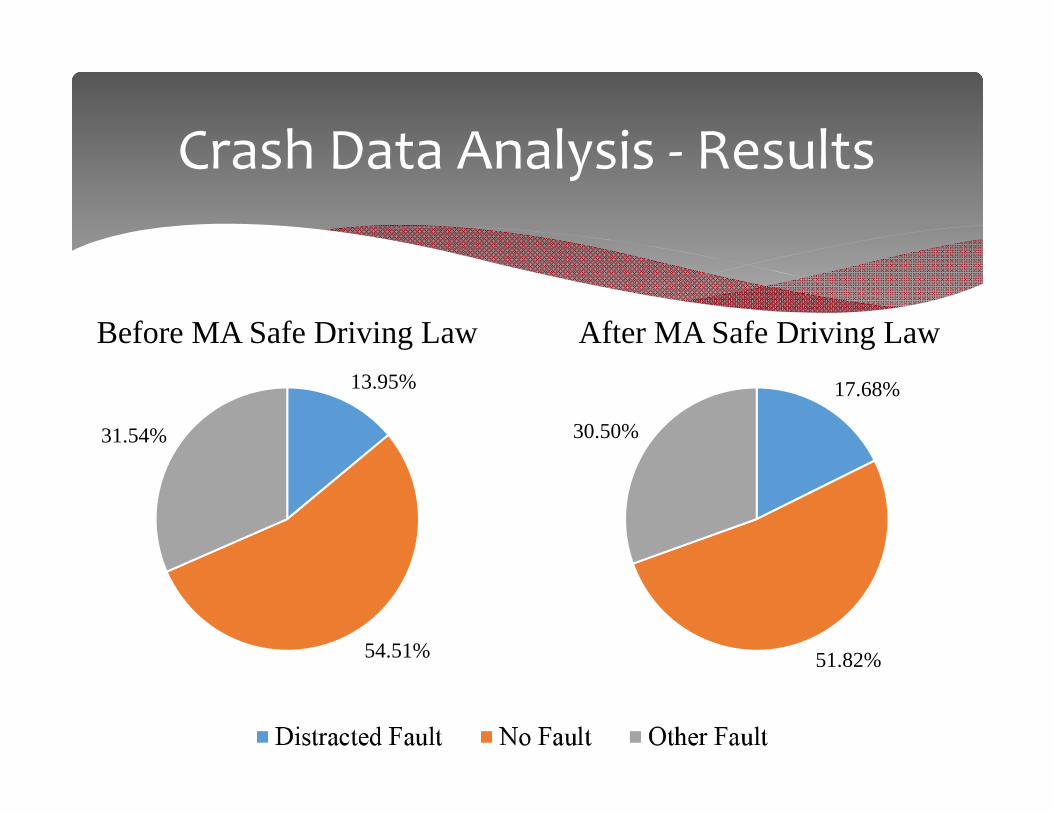
Crash Data Analysis ‐ Results
13.95%
54.51%
31.54%
Before MA Safe Driving Law
17.68%
51.82%
30.50%
After MA Safe Driving Law

Mapping Results—EPDO Maps
EPDO: Equivalent Property Damage Only Crash severity point system based on injury status
Max Injury Severity EPDO WeightFatal injury 9.5 Non-fatal injury – Incapacitating 4.5 Non-fatal injury – Non-incapacitating 3.5 Non-fatal injury – Possible 2.5 No injury 1 Not Applicable 1 Not Reported 1 Reported but invalid 1 Unknown 1 Deceased not caused by crash 1

Mapping Results—EPDO Maps
Before MA Safe Driving Law(2008‐2010)
After MA Safe Driving Law(2012‐2013)

Crash Report Narrative Search
UMass Safety Data Warehouse Develop a list of keywords indicating distraction Ex: cell, phone, text, call, etc.
200 random reports pulled 100 distraction classified 100 non‐distraction classified
Team of 7 reviewers 66 double blind reviews 33 distraction/non‐distraction
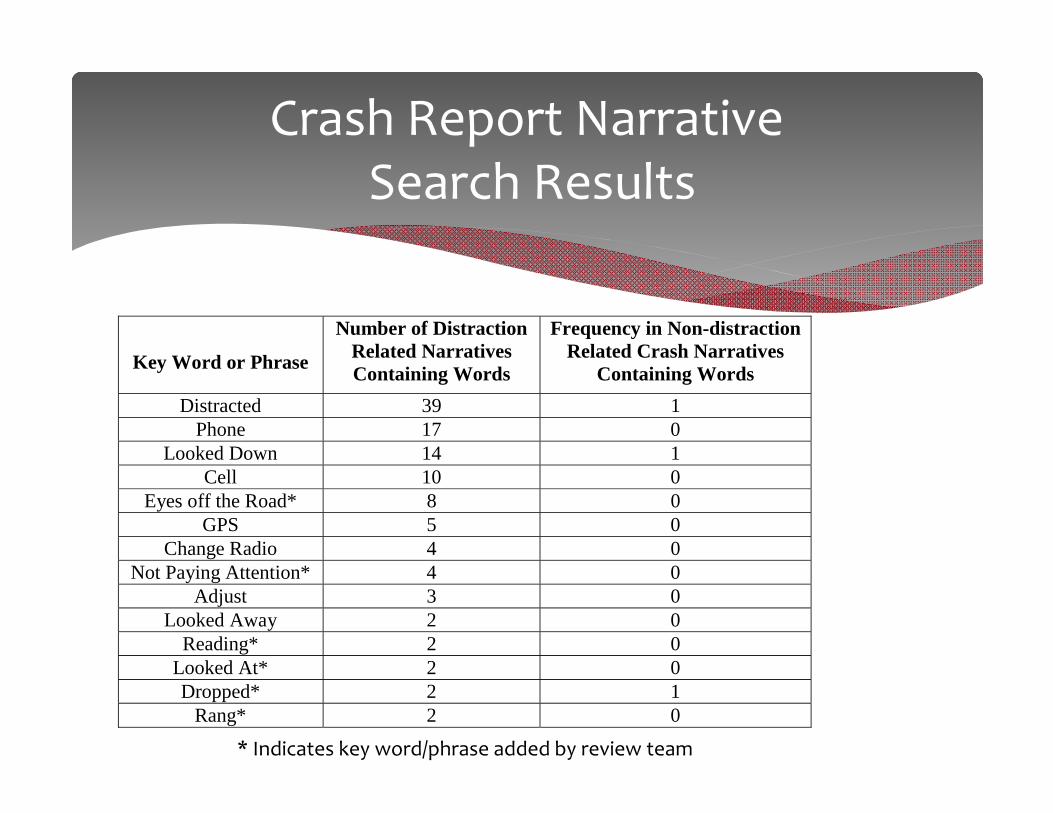
Crash Report NarrativeSearch Results
Key Word or Phrase
Number of Distraction Related Narratives Containing Words
Frequency in Non-distraction Related Crash Narratives
Containing Words Distracted 39 1
Phone 17 0 Looked Down 14 1
Cell 10 0 Eyes off the Road* 8 0
GPS 5 0 Change Radio 4 0
Not Paying Attention* 4 0 Adjust 3 0
Looked Away 2 0 Reading* 2 0
Looked At* 2 0 Dropped* 2 1
Rang* 2 0 * Indicates key word/phrase added by review team

Crash Report Narrative Search—Results
Distraction Classified Non‐Distraction ClassifiedDistraction Related 70 4
Non‐Distraction Related 25 96
Crash Report InformationReviewer Determination

Inexperienced Drivers
McCartt A.T., Shabanova, V.I., and Leaf W.A. (2003). Driving experience, crashes and traffic citations of teenage beginning drivers. Accident Analysis and Prevention, 35, 311-320.
2.3 crashes/10,000 miles
0.4 crashes/10,000 miles
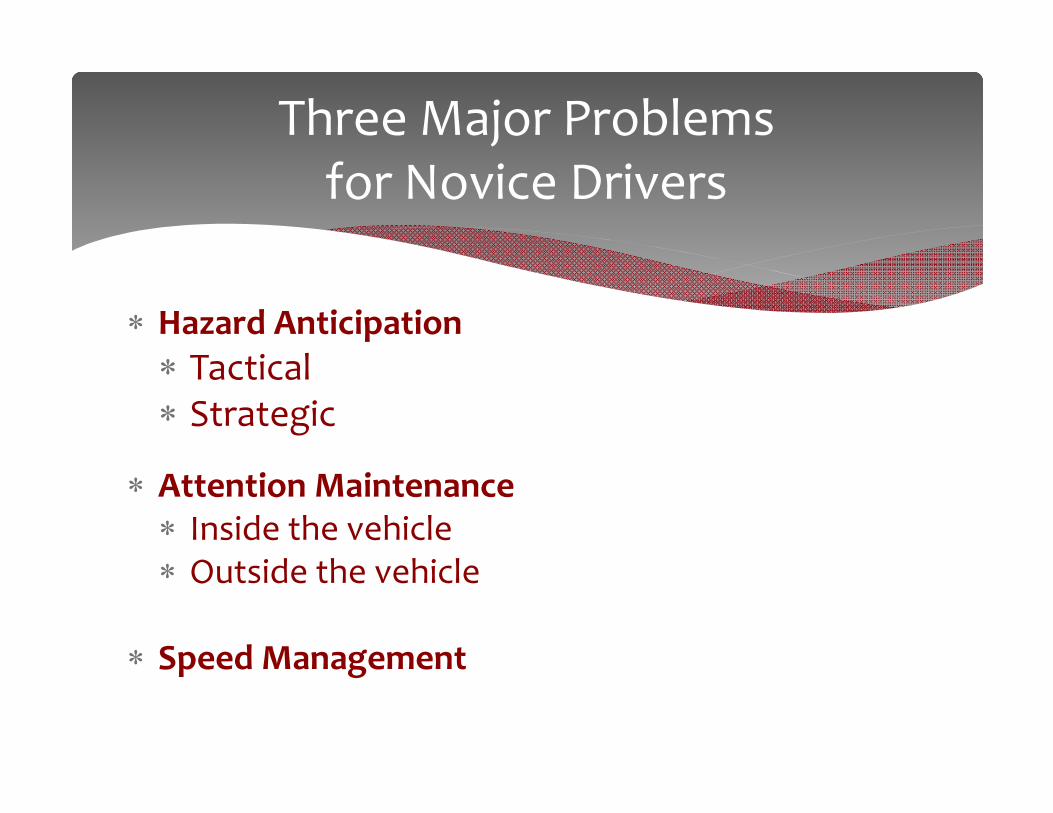
Three Major Problems for Novice Drivers
Hazard Anticipation Tactical Strategic
Attention Maintenance Inside the vehicle Outside the vehicle
Speed Management

Driving Simulator & Eye Tracker
A ‐ videos\NA06_OppTruckLT_Error.mpg
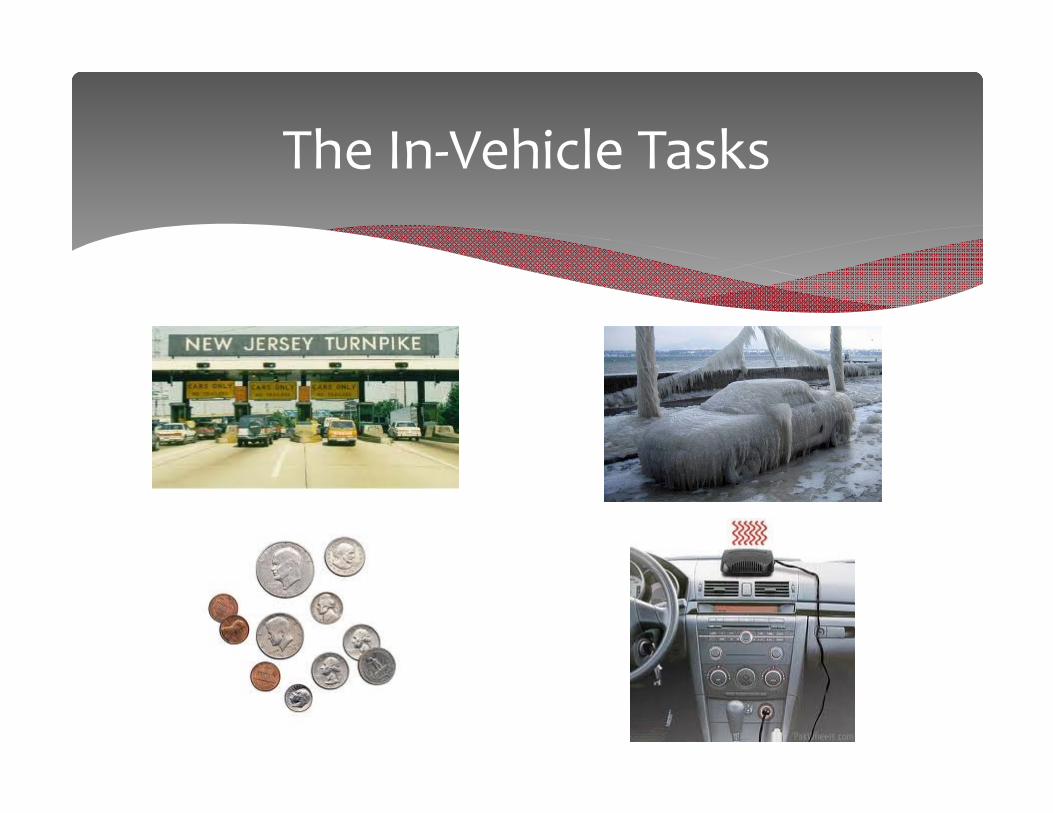
The In‐Vehicle Tasks
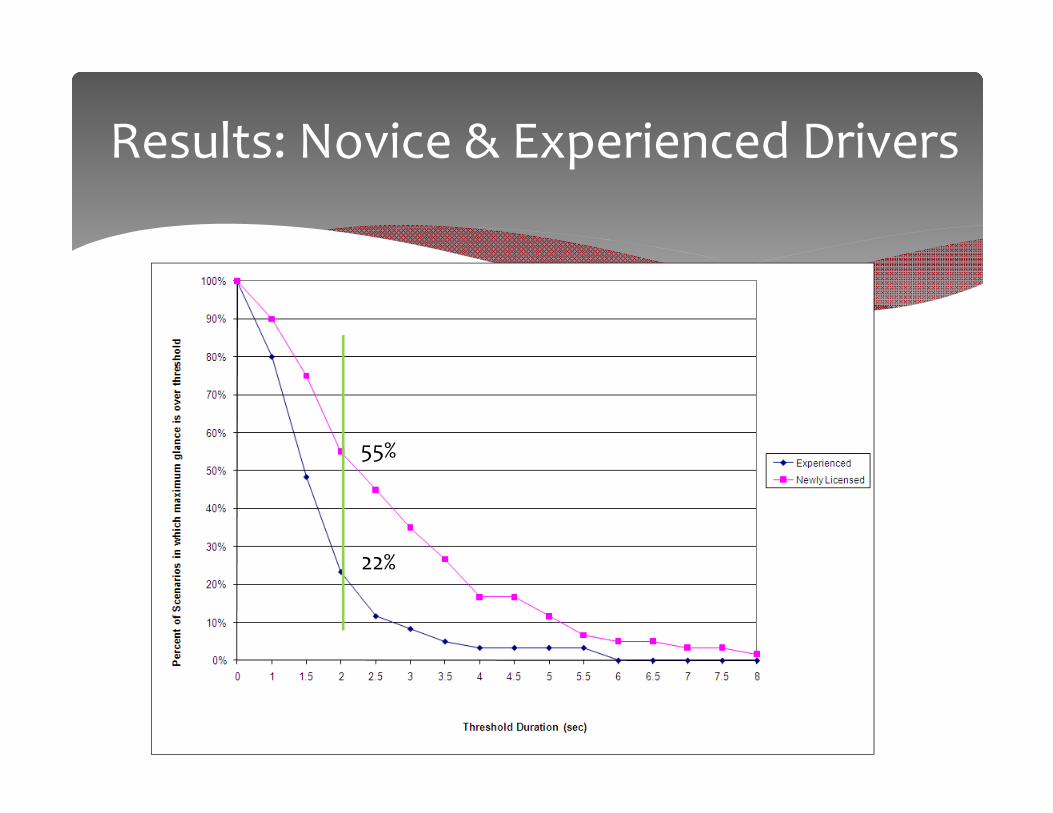
Results: Novice & Experienced Drivers
55%
22%

Attention Maintenance Training: FOCAL

Field EvaluationSuburban New Jersey

Results: Trained & Untrained Drivers
> 2 sec > 2.5 sec > 3 secTrained 59.50% 41.90% 30.20%Untrained 75.90% 60.20% 41.70%
0.00%
10.00%
20.00%
30.00%
40.00%
50.00%
60.00%
70.00%
80.00%
Percen
t of S
cena
rios
Percentage of Scenarios with a Glance Greater than ThresholdUntrained
Trained
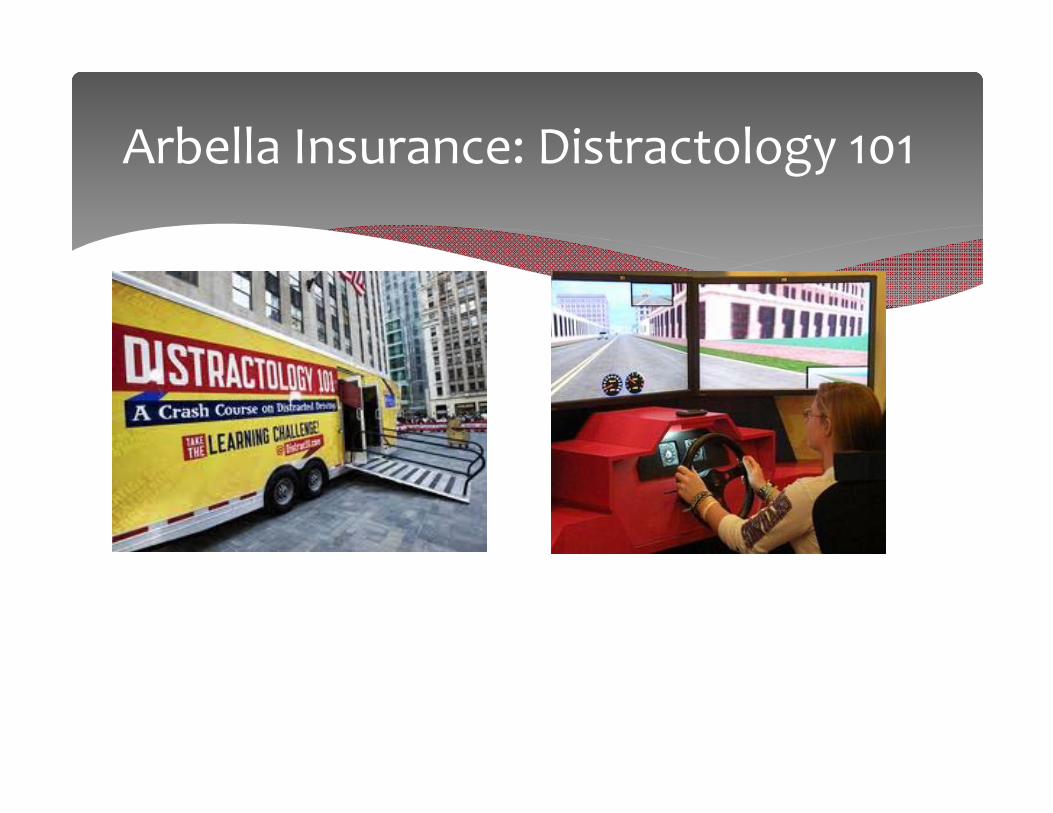
Arbella Insurance: Distractology 101
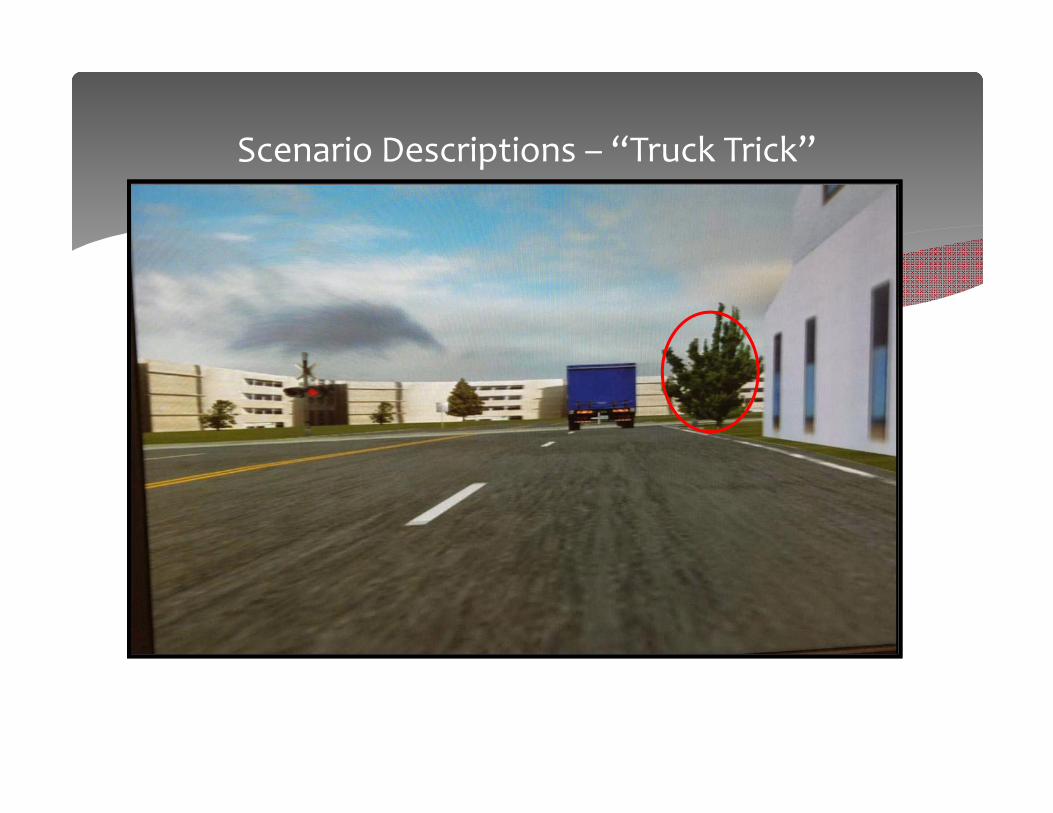
Scenario Descriptions – “Truck Trick”

Alternative Treatments at Railroad Grade Crossings
Dynamic Envelope Pavement Markings
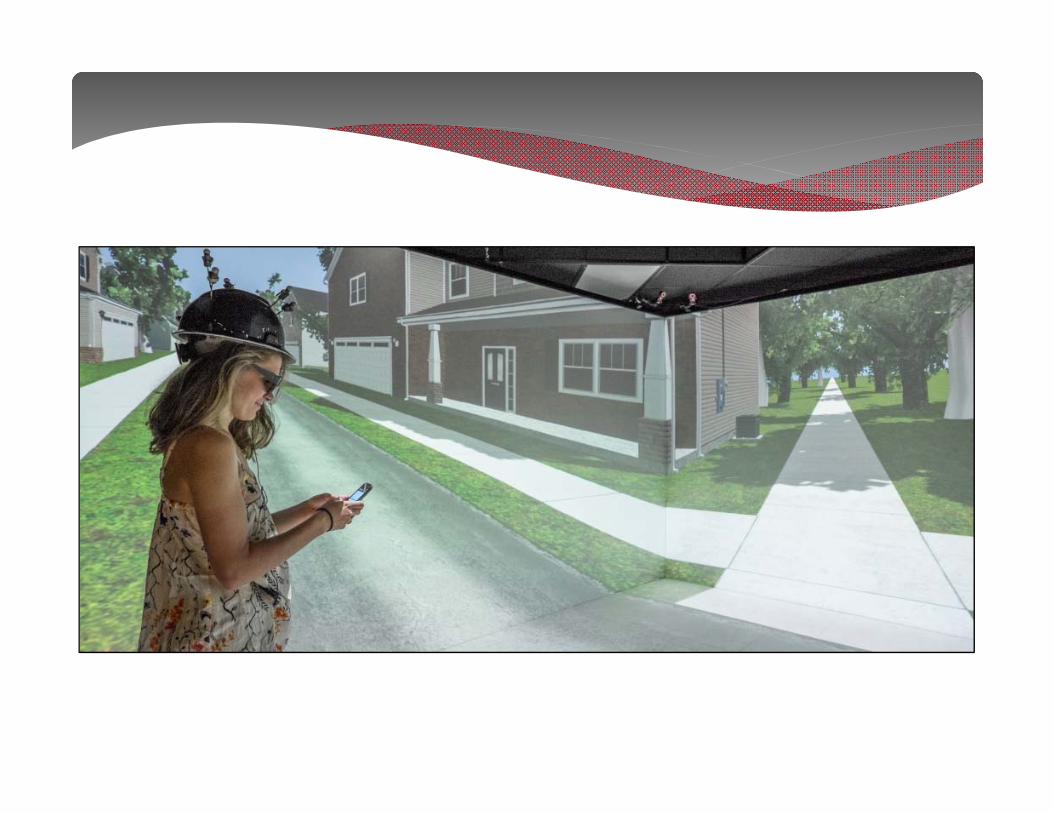

Distracted Peds - Methodology
1386 pedestrian crossings, 7 treatment types Distraction Vehicle Action – Yield or Don’t Yield Pedestrian Action – Look Before or Crossing?
50
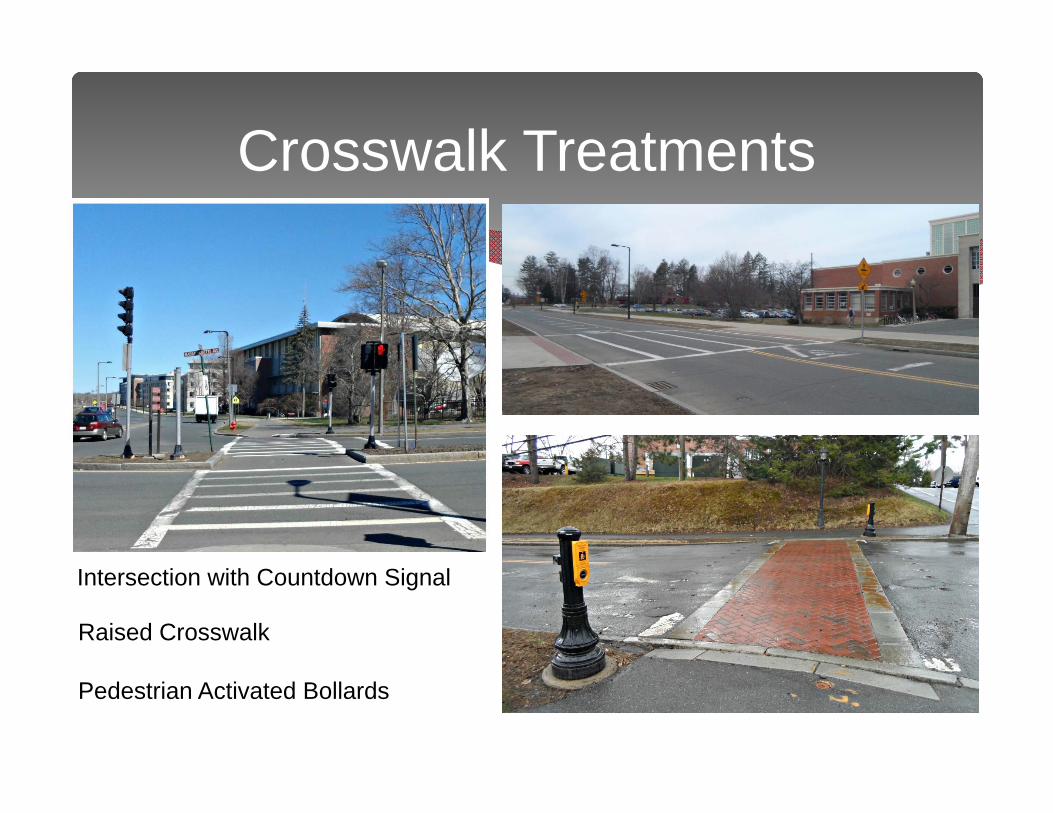
Crosswalk Treatments
Intersection with Countdown Signal
Raised Crosswalk
Pedestrian Activated Bollards

52
Overhead Flashing Lights T-Intersection
Traditional Crosswalk Flashing Signs, Advanced Yield Markings, Rumble Stripes
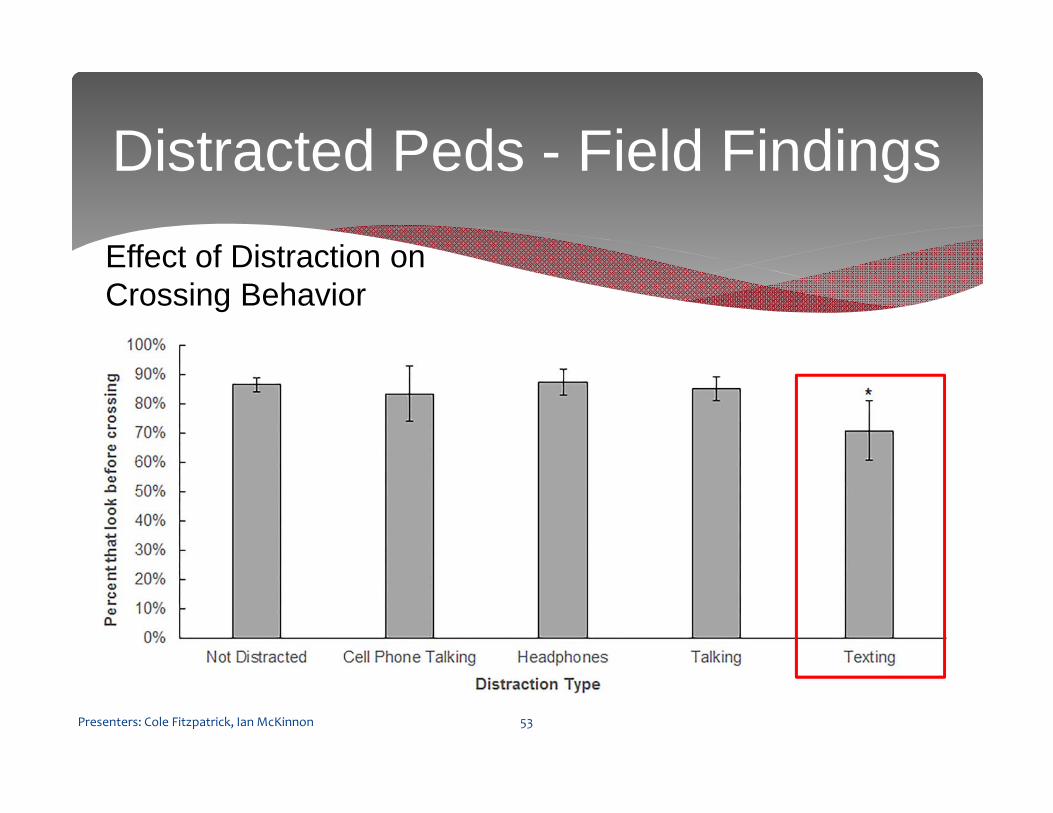
Distracted Peds - Field Findings
Presenters: Cole Fitzpatrick, Ian McKinnon 53
Effect of Distraction on Crossing Behavior

Distracted Peds - Field Findings
Crossing Behavior based on Crosswalk Treatment
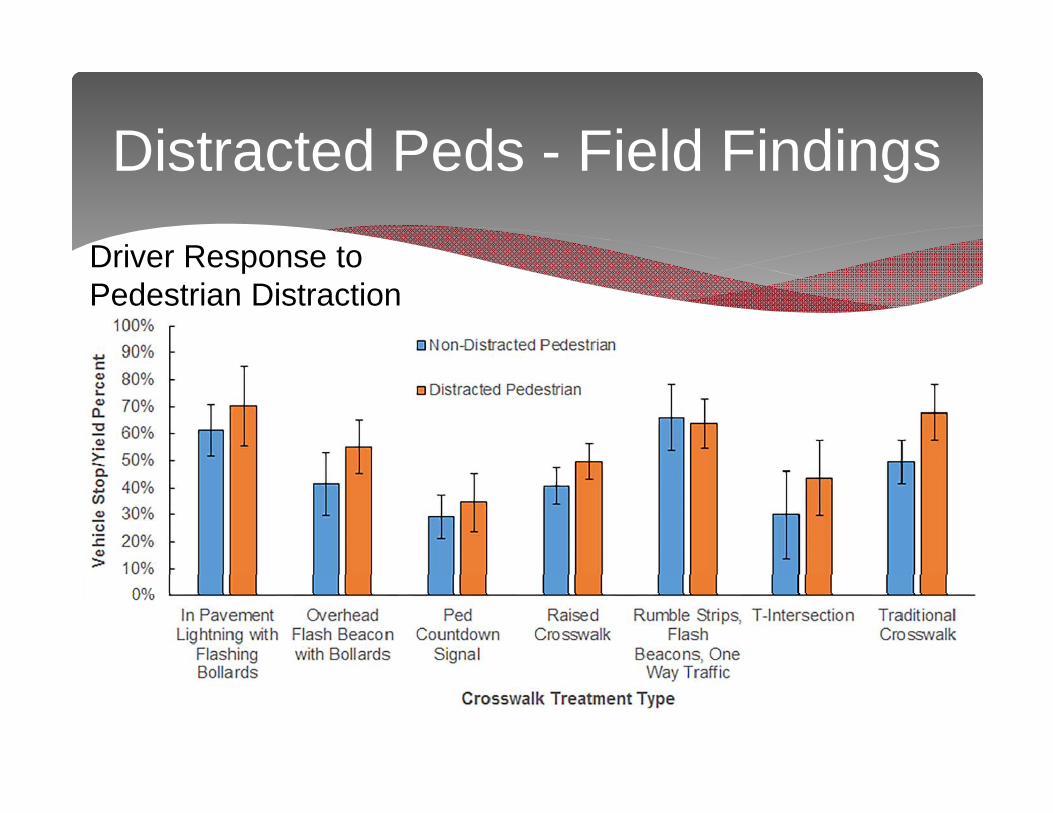
Distracted Peds - Field FindingsDriver Response to Pedestrian Distraction
Questions
Michael KnodlerDirector, UMass Transportation Center
University of [email protected]
www.umasstransportationcenter.org(413) 545‐0228

Experiment Summary
Drivers benefitted tremendously from the addition of the dynamic envelope markings.
One of the important findings of this experiment is that the visibility of the lights and the presence of a car ahead are significantly important aspects for driver safety in the vicinity of crossings.
The cell phone group fared much better than the radio group.
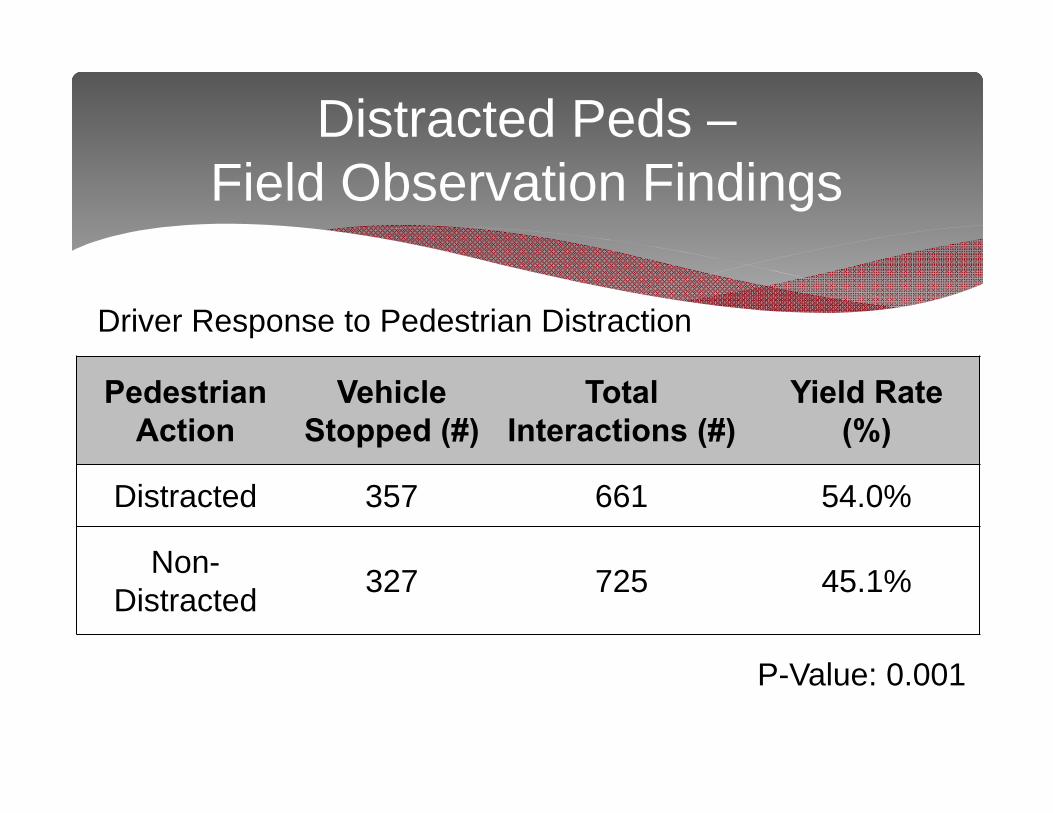
Distracted Peds –Field Observation Findings
Pedestrian Action
Vehicle Stopped (#)
Total Interactions (#)
Yield Rate(%)
Distracted 357 661 54.0%
Non-Distracted 327 725 45.1%
P-Value: 0.001
Driver Response to Pedestrian Distraction
Questions?

Crash Data Analysis—Results Compared crash data from before and after the Massachusetts Safe Driving Law was passed
Description Number of Crashes Before MA Safe Driving Law 437,762 After MA Safe Driving Law 451,312 Total 889,074
Description Distracted
Fault No
Fault Other Fault Total
Before MA Safe Driving Law 43,547 170,139 98,451 312,137 After MA Safe Driving Law 66,729 195,636 115,129 377,494 Total 110,276 365,775 213,580 689,631

Mobile Observation Experiment Research Objectives
1. Identify attributes of observed distracted driving behaviors and determine which behaviors are more common or dangerous.
2. Understand the role and impact of distraction on crashes, and the reliability associated with crash reporting for distraction related crashes.

Research Questions
1. Has the number of drivers engaging in distracted driving and the number of distracted driving crashes decreased since the existence of the Massachusetts Safe Driving Law?
2. Can crash report narratives provide insight to distraction related crashes? Are these events always correctly identified as distraction related?
3. Are there identifiable hot spot locations for distracted driving crashes in Massachusetts?

Crash Report Narrative Search Results
Distraction Classified Narratives 72 out of 100 narratives contained distraction key words 5 out of 33 blind reviews had contradicting opinions 25 out of the remaining 95 were classified as non‐distracted by
the reviewers 23 out of these 25 did not have key words present

Crash Report Narrative Search Results
Non‐Distraction Classified Narratives 5 out of 100 narratives contained distraction key words 4 out of 5 incorrectly classified as distracted Driver contributing codes for 4 “distraction” narratives:
Disregarded traffic signs, signals, or road markings Inattention Wrong side or wrong way Operating vehicle in erratic, reckless, careless, negligent, or aggressive manner.
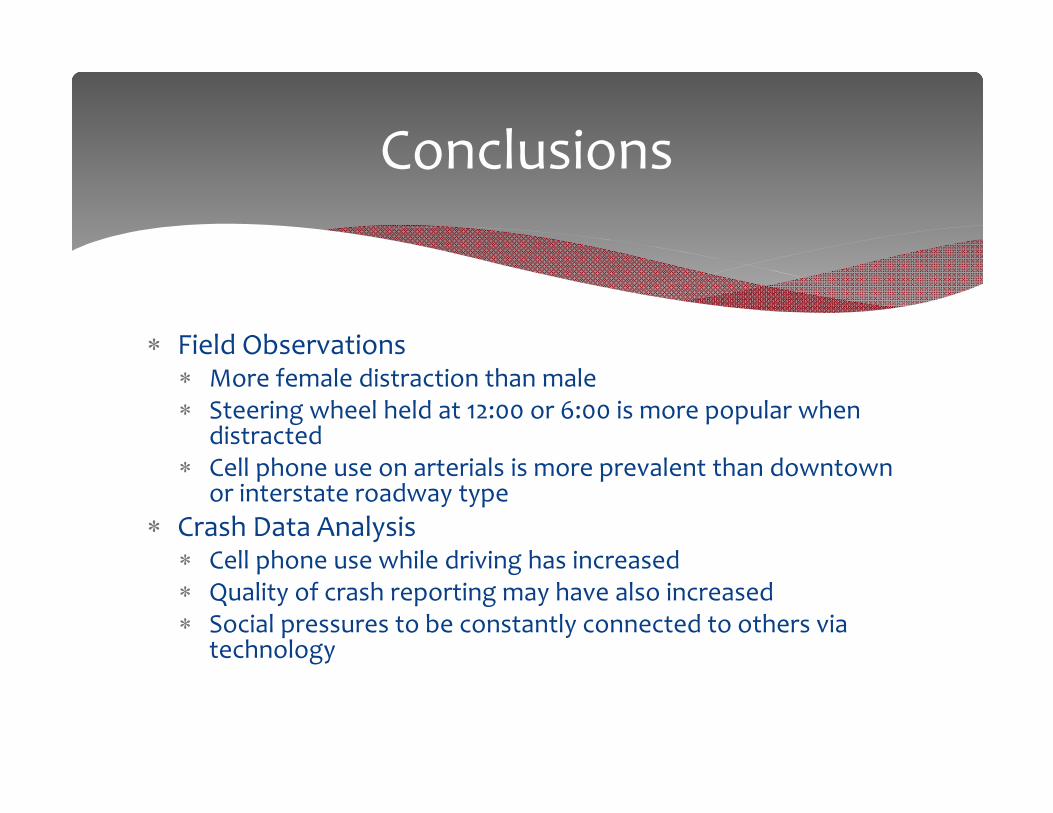
Conclusions
Field Observations More female distraction than male Steering wheel held at 12:00 or 6:00 is more popular when
distracted Cell phone use on arterials is more prevalent than downtown
or interstate roadway type Crash Data Analysis
Cell phone use while driving has increased Quality of crash reporting may have also increased Social pressures to be constantly connected to others via
technology
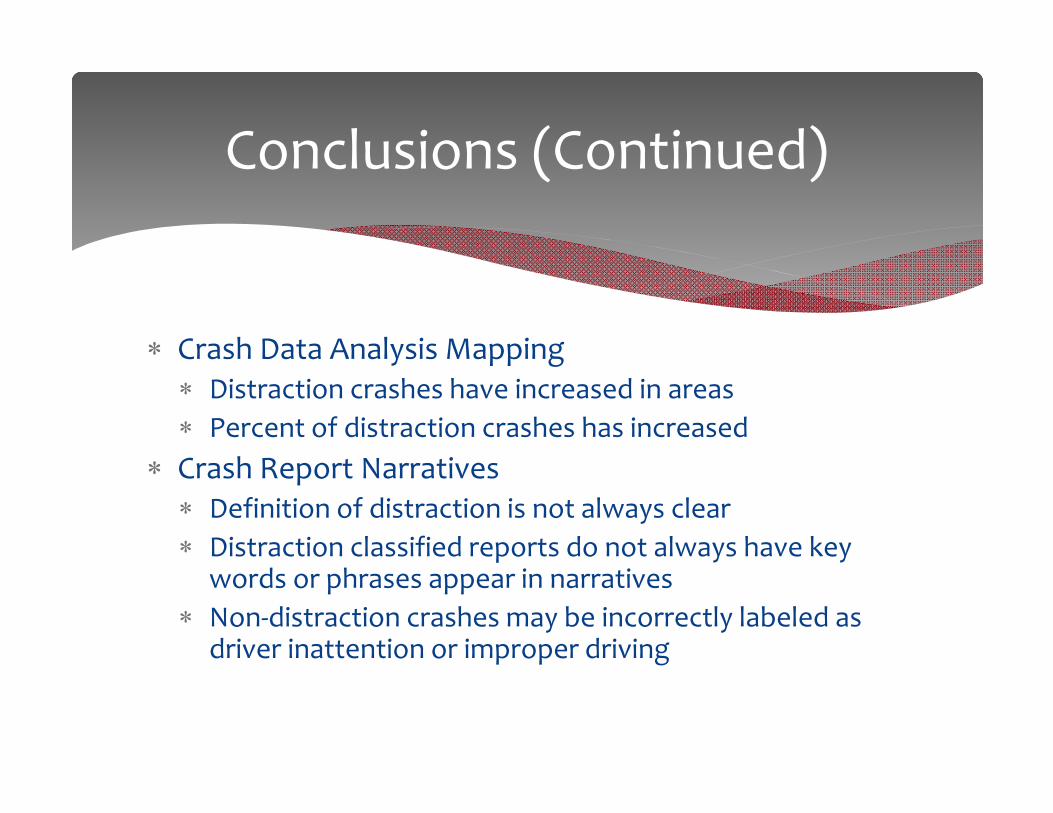
Conclusions (Continued)
Crash Data Analysis Mapping Distraction crashes have increased in areas Percent of distraction crashes has increased
Crash Report Narratives Definition of distraction is not always clear Distraction classified reports do not always have key
words or phrases appear in narratives Non‐distraction crashes may be incorrectly labeled as
driver inattention or improper driving

Mapping Results ‐ Distracted Crashes
2012 2013
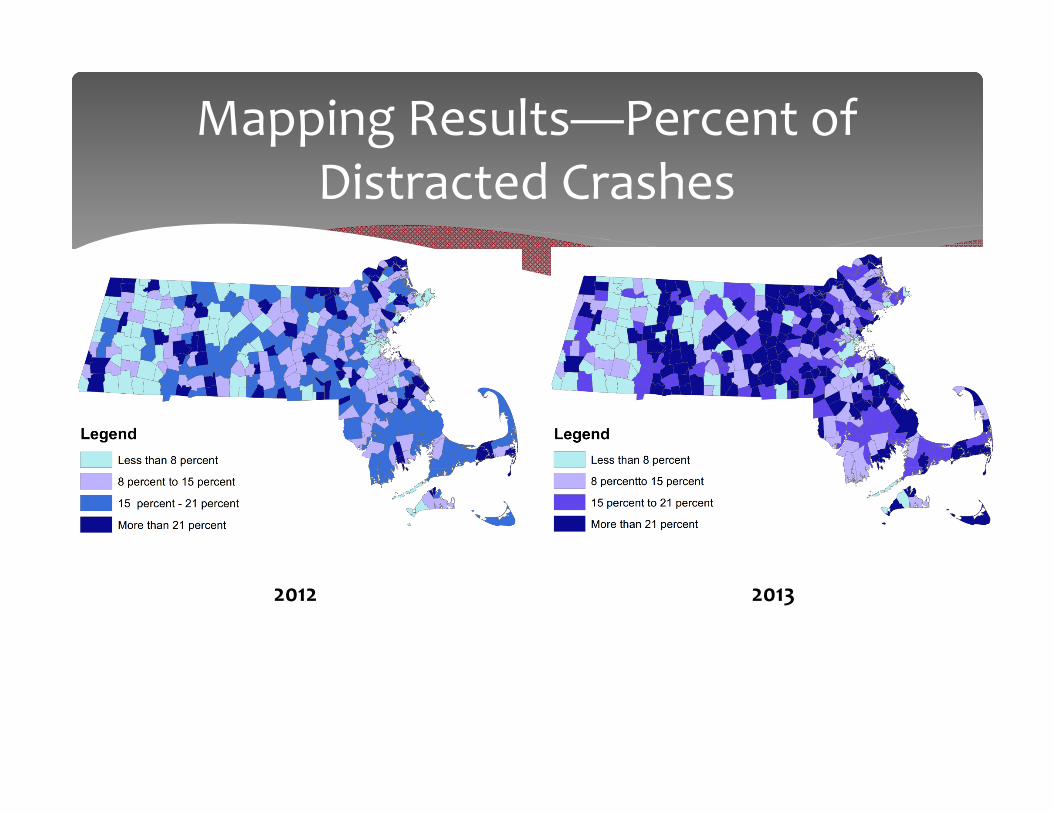
Mapping Results—Percent of Distracted Crashes
2012 2013
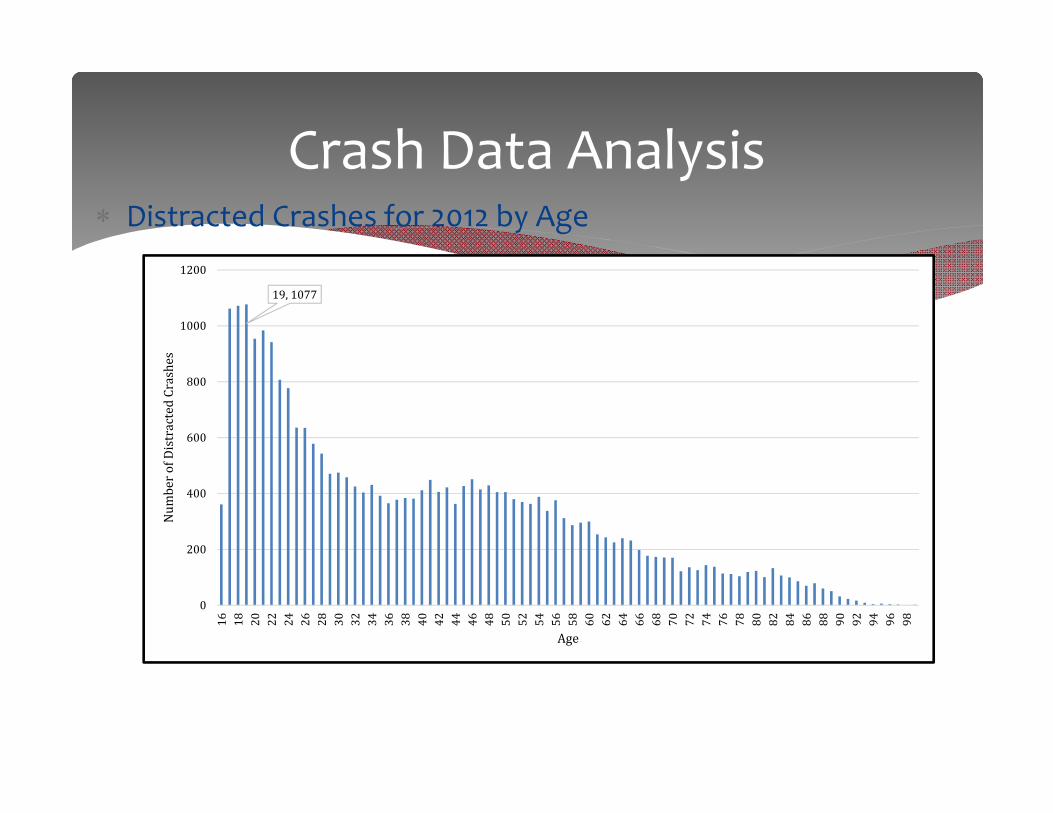
Crash Data Analysis Distracted Crashes for 2012 by Age
19,1077
0
200
400
600
800
1000
1200
16 18 20 22 24 26 28 30 32 34 36 38 40 42 44 46 48 50 52 54 56 58 60 62 64 66 68 70 72 74 76 78 80 82 84 86 88 90 92 94 96 98
Num
berofDistractedCrashes
Age
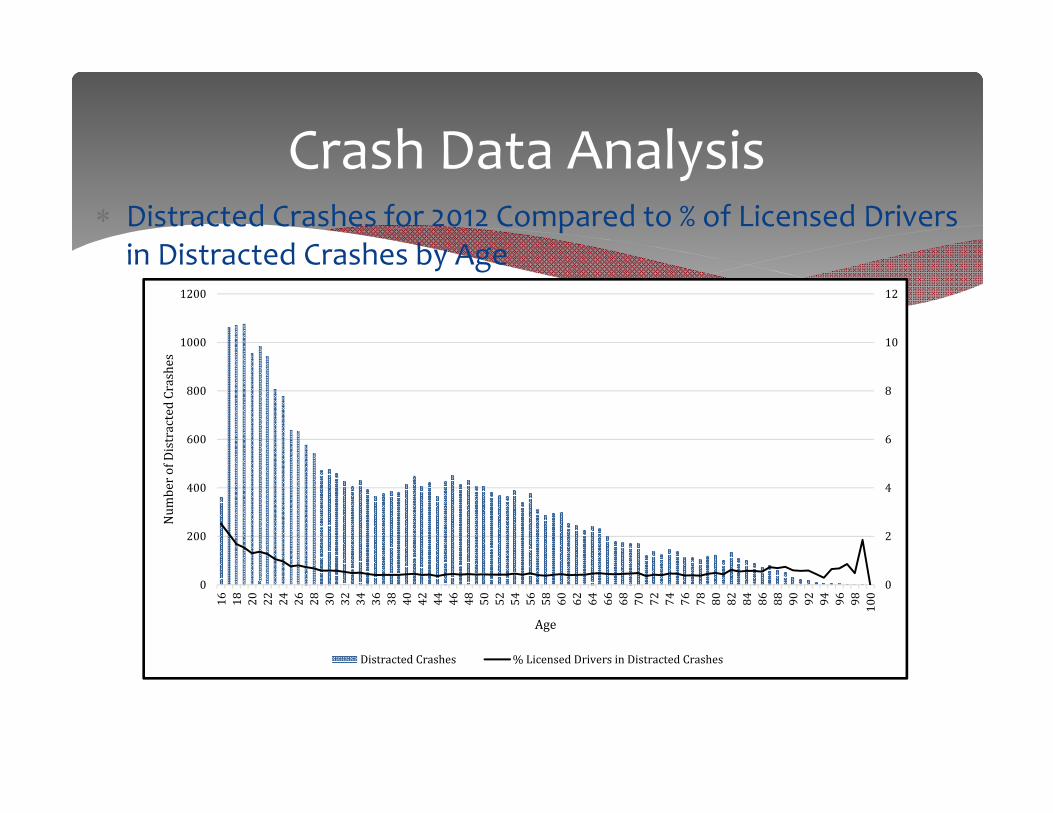
Crash Data Analysis Distracted Crashes for 2012 Compared to % of Licensed Drivers in Distracted Crashes by Age
0
2
4
6
8
10
12
16 18 20 22 24 26 28 30 32 34 36 38 40 42 44 46 48 50 52 54 56 58 60 62 64 66 68 70 72 74 76 78 80 82 84 86 88 90 92 94 96 98 100
0
200
400
600
800
1000
1200
Age
Num
berofDistractedCrashes
DistractedCrashes %LicensedDriversinDistractedCrashes

Crash Data Analysis Distracted Crashes for 2012 & 2013 with % Crash Increase
18,1363
0
10
20
30
40
50
60
0
200
400
600
800
1000
1200
1400
1600
16 18 20 22 24 26 28 30 32 34 36 38 40 42 44 46 48 50 52 54 56 58 60 62 64 66 68 70 72 74 76 78 80 82 84 86 88 90 92 94
PercentCrashIncrease
Num
berofDistractedCrashes
Age
2012 2013 %Increase

Field Observations—Results
Vehicle Type: Count & Percent of Observations
Vehicle Type Cell Talk Cell
Touch Other No
Distraction Total Commercial 10 3 14 101 128 Mini-Van 9 3 3 60 75 Passenger 57 48 40 765 910 Pick-Up 17 7 8 119 151 SUV 31 13 6 261 311 Total 124 74 71 1,306 1,575
Vehicle Type Cell Talk Cell
Touch Other No
DistractionCommercial 7.81% 2.34% 10.94% 78.91% Mini-Van 12.00% 4.00% 4.00% 80.00% Passenger 6.26% 5.27% 4.40% 84.07% Pick-Up 11.26% 4.64% 5.30% 78.81% SUV 9.97% 4.18% 1.93% 83.92% Total 7.87% 4.70% 4.51% 82.92%
Field Observations—Results
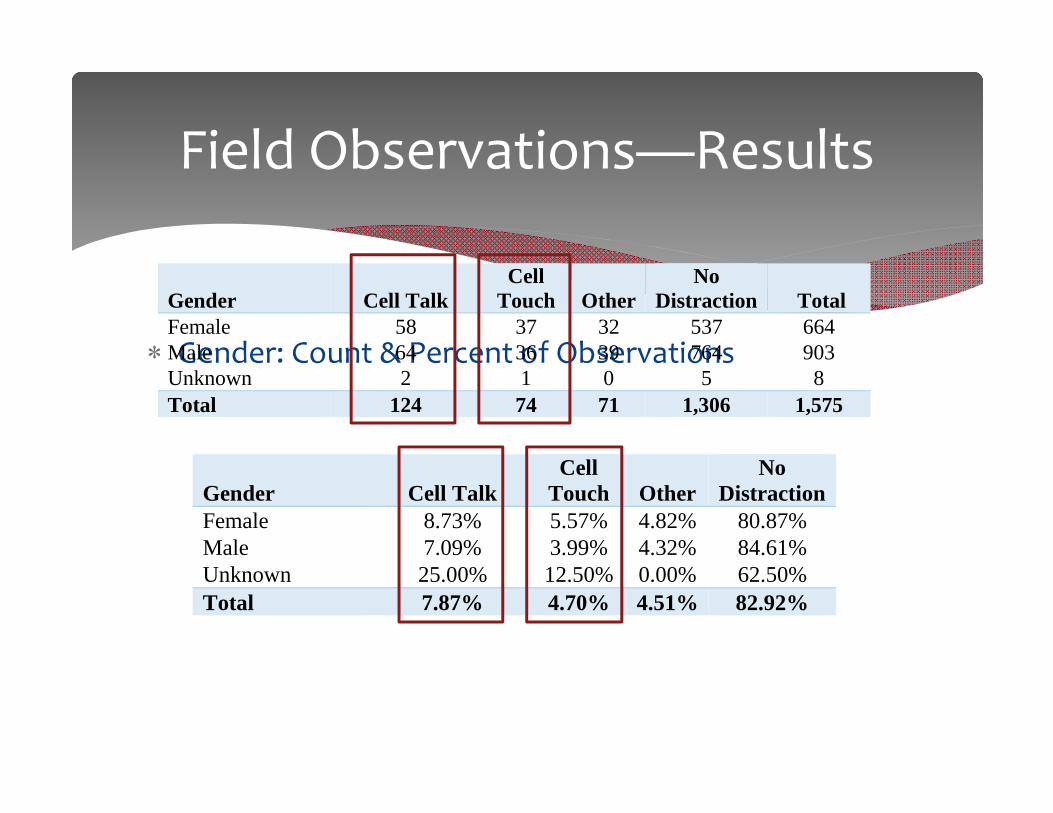
Gender: Count & Percent of Observations
Gender Cell Talk Cell
Touch Other No
Distraction Total Female 58 37 32 537 664 Male 64 36 39 764 903 Unknown 2 1 0 5 8 Total 124 74 71 1,306 1,575
Gender Cell Talk Cell
Touch Other No
DistractionFemale 8.73% 5.57% 4.82% 80.87% Male 7.09% 3.99% 4.32% 84.61% Unknown 25.00% 12.50% 0.00% 62.50% Total 7.87% 4.70% 4.51% 82.92%

Field Observations—Results
Age Group: Count & Percent of Observations
Age Group Cell Talk Cell
Touch Other No
Distraction Total 16-19 4 1 1 13 19 20-39 70 54 36 610 770 40-59 46 18 27 507 598 60+ 4 0 7 173 184 Unknown 0 1 0 3 4 Total 124 74 71 1,306 1,575
Age Group Cell Talk Cell
Touch Other No
Distraction16-19 21.05% 5.26% 5.26% 68.42% 20-39 9.09% 7.01% 4.68% 79.22% 40-59 7.69% 3.01% 4.52% 84.78% 60+ 2.17% 0.00% 3.80% 94.02% Unknown 0.00% 25.00% 0.00% 75.00% Total 7.87% 4.70% 4.51% 82.92%

ConclusionsObjective 1: Observe
Prevalence
Objective 2: Examine Observation Methods
Objective 3: Assess Safety Impacts
Improved understanding of the magnitude of drivers’ cell phone use among demographics, locations, and driving conditions.
This evaluation can serve as an aid to focus countermeasures aimed to reduce distracted driving.
Evaluate Drivers’ Cell Phone Use
Higher use at signalized intersections as a result of stopped conditions. Observer influence is not significant.
Improved understanding of the prevalence of distracted driving crashes.

Opportunity for Countermeasures
Targeted countermeasures are recommended for populations and conditions that had a higher driving cell phone use and higher distracted driving crash rates: Advertisement based
Females Teens Teen females
Enforcement based Roadways with speed limits 25‐45 Signalized intersections Weekday afternoons CMV

Recommendations for Future Research
Combine cell phone and seat belt observations Continue annually in Massachusetts Encourage other states to combine studies
Improve the quality and accuracy of future observations of cell phone use Include drivers who only text message while stopped as a
separate category Large scale study to determine the influence of an observer on
drivers’ cell phone use Examine non‐intersections to determine the influence of speed
limit, sinuosity and urbanicity on drivers’ cell phone use.

Drivers’ Cell Phone Use: Intersection Type
0%
2%
4%
6%
8%
10%
12%
14%
Roundabout Signalized Stop Yield
Percen
t of O
bserved Ce
ll Ph
one Use
Handheld Text Messaging
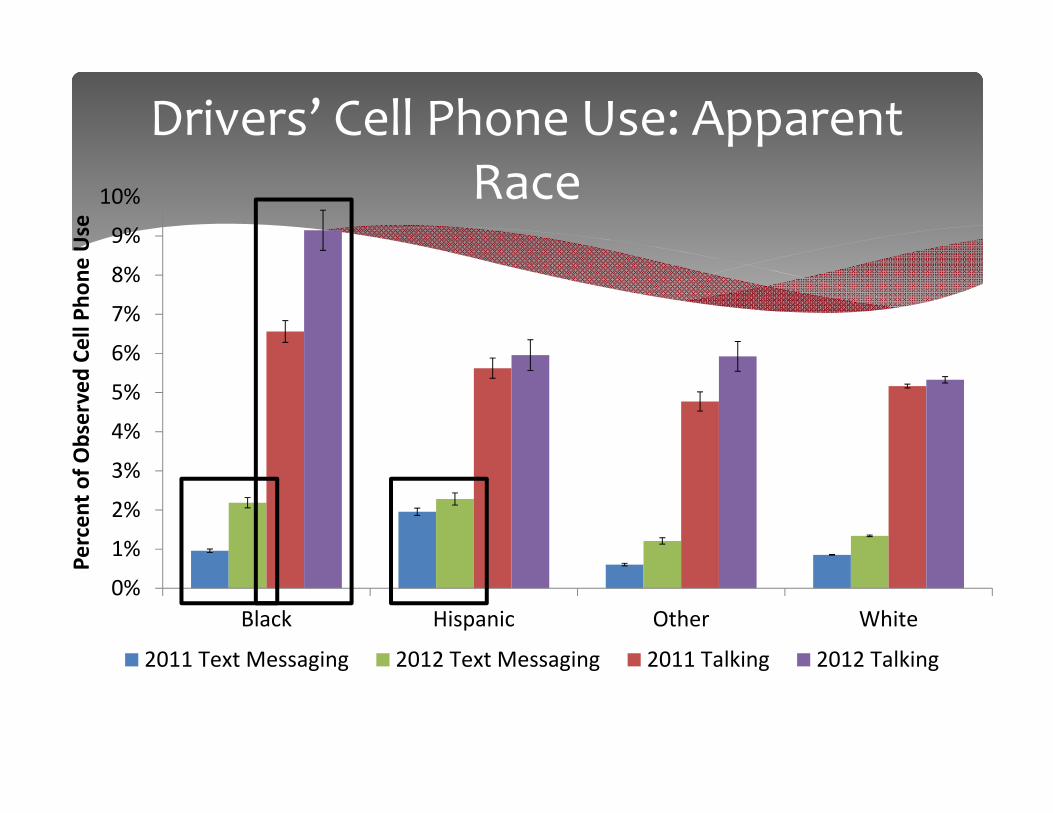
Drivers’ Cell Phone Use: Apparent Race
0%
1%
2%
3%
4%
5%
6%
7%
8%
9%
10%
Black Hispanic Other White
Percen
t of O
bserved Ce
ll Ph
one Use
2011 Text Messaging 2012 Text Messaging 2011 Talking 2012 Talking
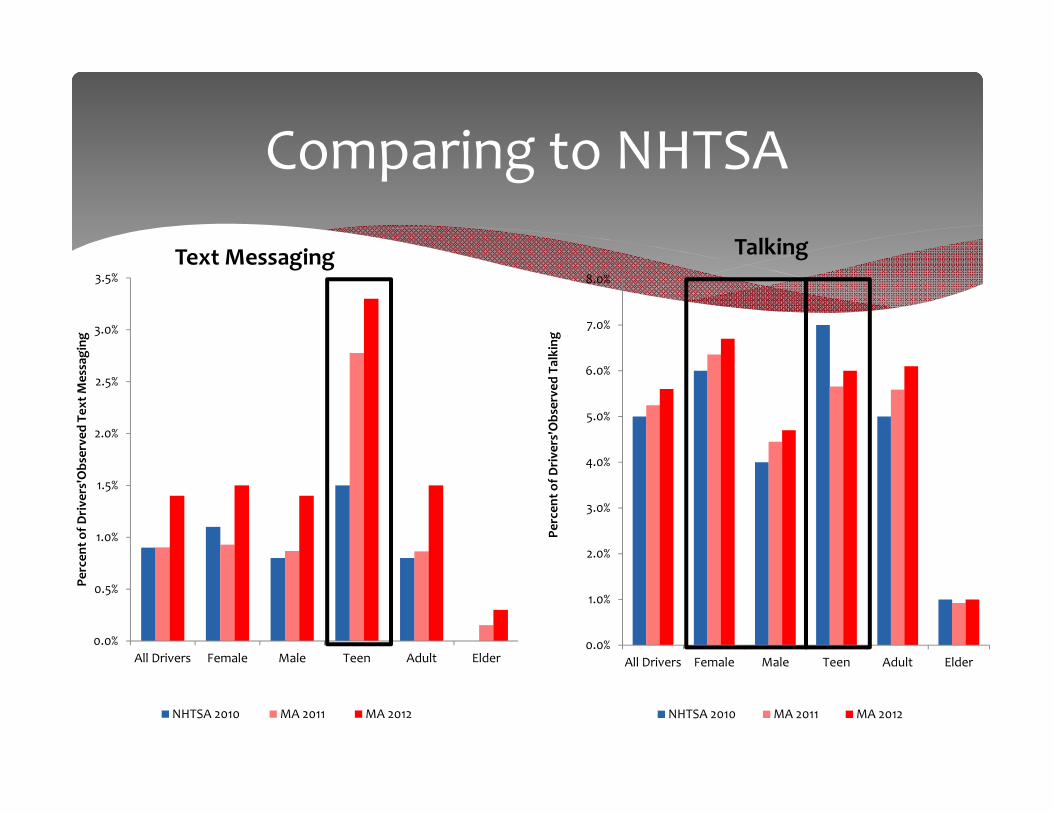
Comparing to NHTSA
0.0%
1.0%
2.0%
3.0%
4.0%
5.0%
6.0%
7.0%
8.0%
All Drivers Female Male Teen Adult Elder
Percen
t of D
rive
rs'O
bserve
d Ta
lking
Talking
NHTSA 2010 MA 2011 MA 2012
0.0%
0.5%
1.0%
1.5%
2.0%
2.5%
3.0%
3.5%
All Drivers Female Male Teen Adult Elder
Percen
t of D
rive
rs'O
bserve
dTe
xt M
essa
ging
Text Messaging
NHTSA 2010 MA 2011 MA 2012
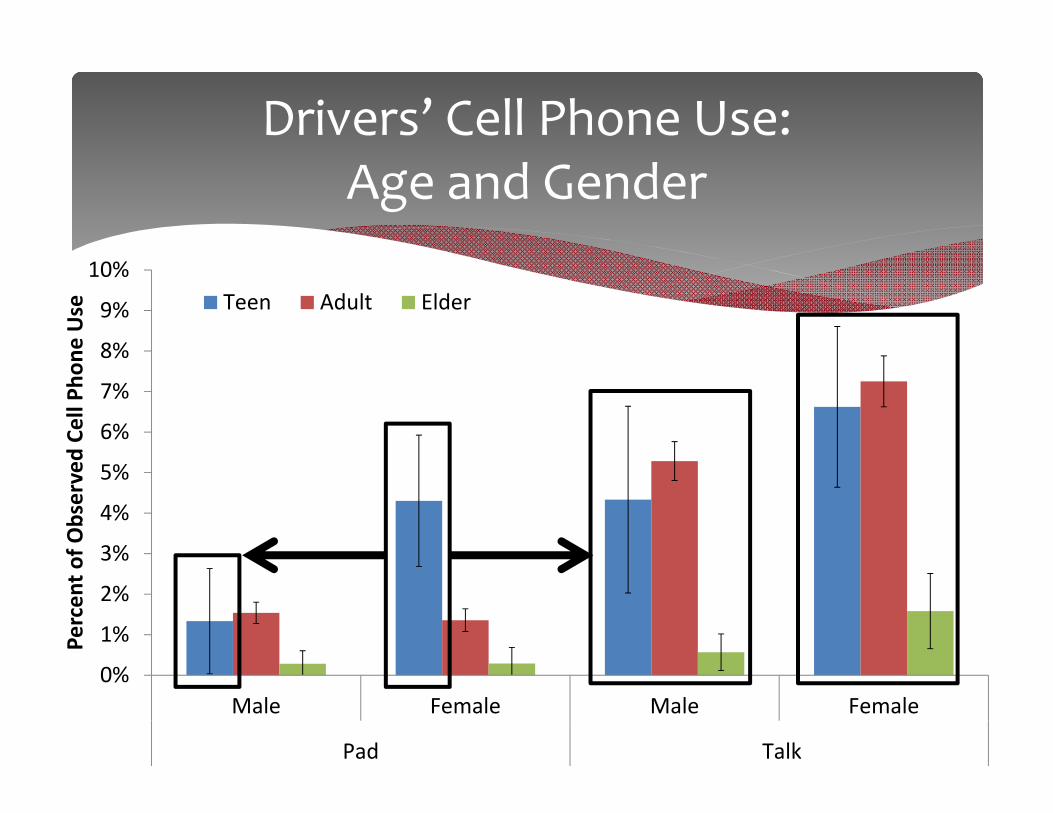
Drivers’ Cell Phone Use: Age and Gender
0%
1%
2%
3%
4%
5%
6%
7%
8%
9%
10%
Male Female Male Female
Pad Talk
Percen
t of O
bserved Ce
ll Ph
one Use Teen Adult Elder

Findings
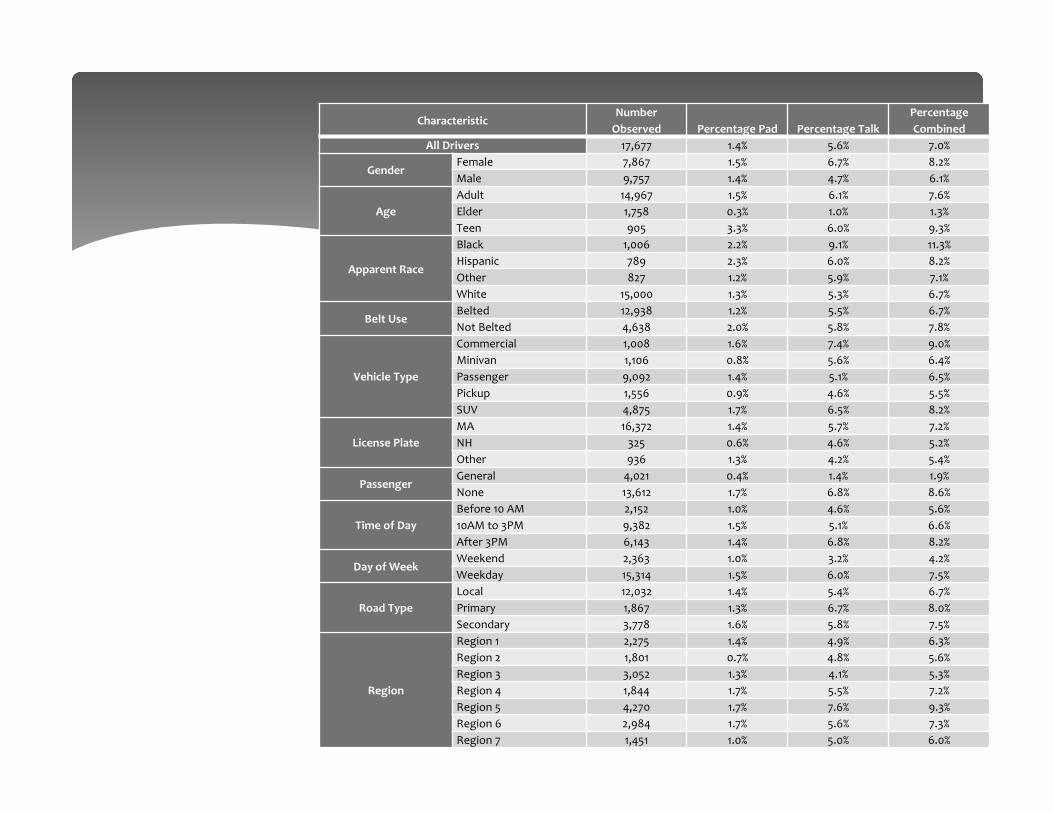
Results 2012Characteristic
Number Observed Percentage Pad Percentage Talk
Percentage Combined
All Drivers 17,677 1.4% 5.6% 7.0%
GenderFemale 7,867 1.5% 6.7% 8.2%Male 9,757 1.4% 4.7% 6.1%
AgeAdult 14,967 1.5% 6.1% 7.6%Elder 1,758 0.3% 1.0% 1.3%Teen 905 3.3% 6.0% 9.3%
Apparent Race
Black 1,006 2.2% 9.1% 11.3%Hispanic 789 2.3% 6.0% 8.2%Other 827 1.2% 5.9% 7.1%White 15,000 1.3% 5.3% 6.7%
Belt UseBelted 12,938 1.2% 5.5% 6.7%Not Belted 4,638 2.0% 5.8% 7.8%
Vehicle Type
Commercial 1,008 1.6% 7.4% 9.0%Minivan 1,106 0.8% 5.6% 6.4%Passenger 9,092 1.4% 5.1% 6.5%Pickup 1,556 0.9% 4.6% 5.5%SUV 4,875 1.7% 6.5% 8.2%
License PlateMA 16,372 1.4% 5.7% 7.2%NH 325 0.6% 4.6% 5.2%Other 936 1.3% 4.2% 5.4%
PassengerGeneral 4,021 0.4% 1.4% 1.9%None 13,612 1.7% 6.8% 8.6%
Time of DayBefore 10 AM 2,152 1.0% 4.6% 5.6%10AM to 3PM 9,382 1.5% 5.1% 6.6%After 3PM 6,143 1.4% 6.8% 8.2%
Day of WeekWeekend 2,363 1.0% 3.2% 4.2%Weekday 15,314 1.5% 6.0% 7.5%
Road TypeLocal 12,032 1.4% 5.4% 6.7%Primary 1,867 1.3% 6.7% 8.0%Secondary 3,778 1.6% 5.8% 7.5%
Region
Region 1 2,275 1.4% 4.9% 6.3%Region 2 1,801 0.7% 4.8% 5.6%Region 3 3,052 1.3% 4.1% 5.3%Region 4 1,844 1.7% 5.5% 7.2%Region 5 4,270 1.7% 7.6% 9.3%Region 6 2,984 1.7% 5.6% 7.3%Region 7 1,451 1.0% 5.0% 6.0%
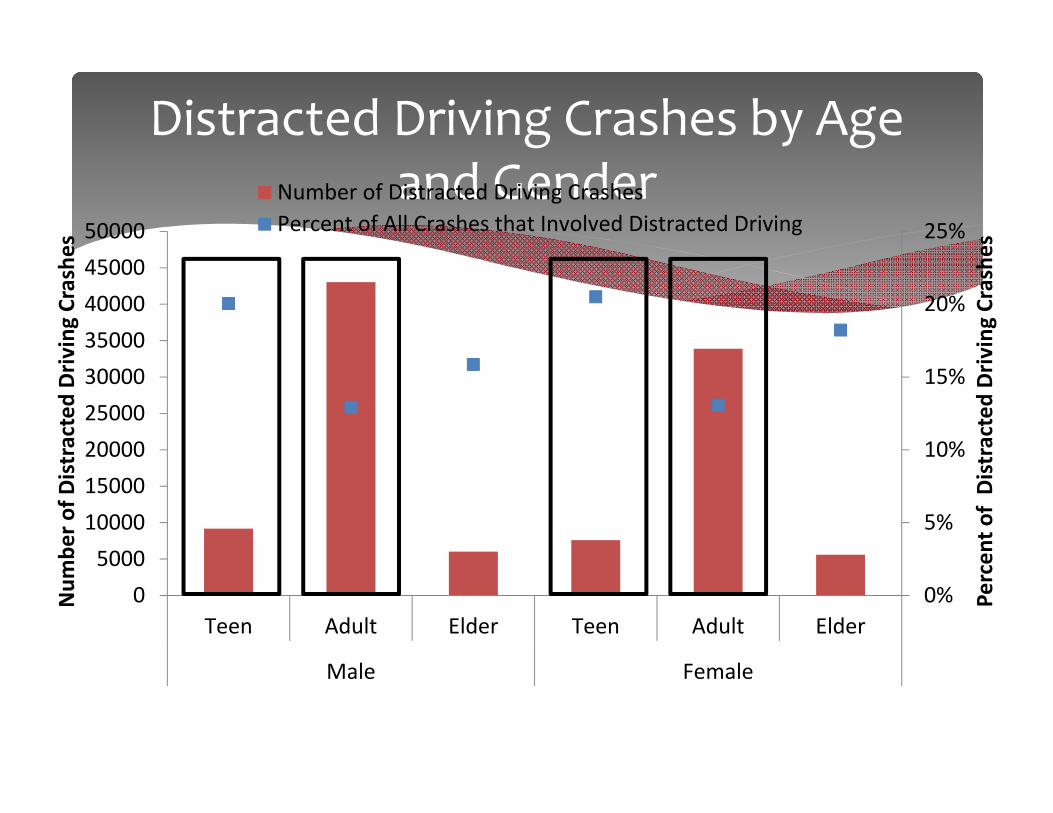
Distracted Driving Crashes by Age and Gender
0%
5%
10%
15%
20%
25%
05000100001500020000250003000035000400004500050000
Teen Adult Elder Teen Adult Elder
Male Female
Percen
t of Distracted Driv
ing Crashe
s
Num
ber o
f Distracted Driv
ing Crashe
s
Number of Distracted Driving CrashesPercent of All Crashes that Involved Distracted Driving
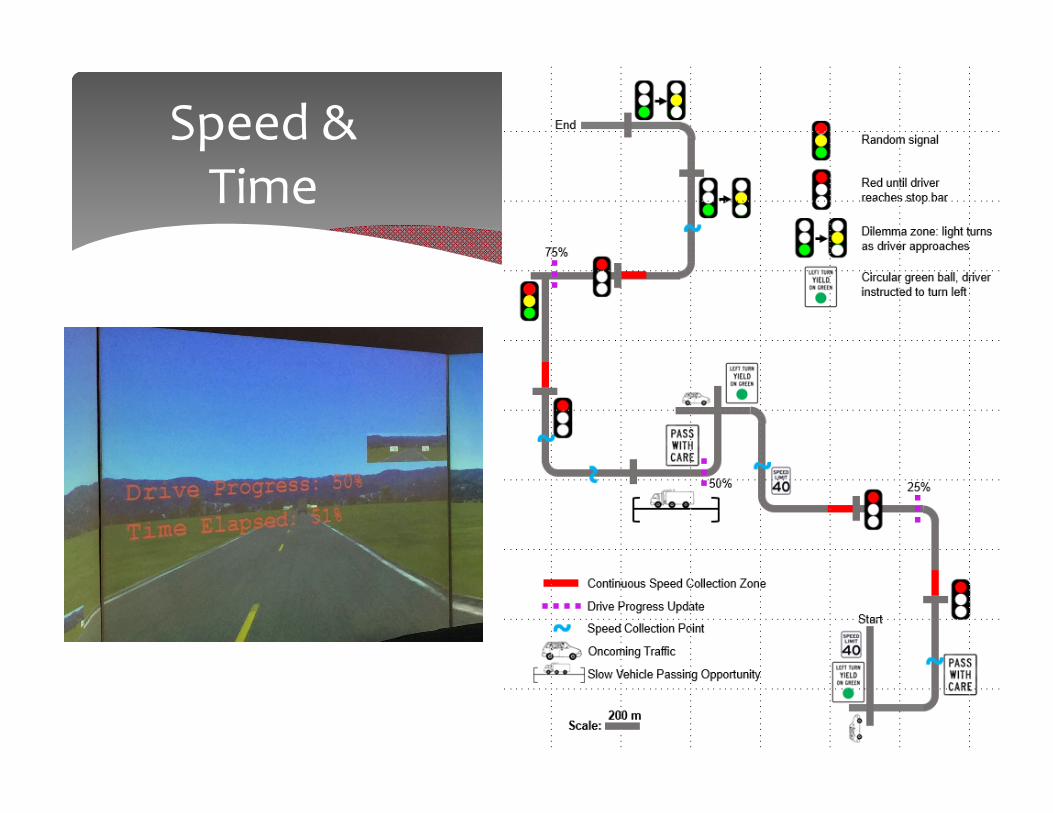
Speed & Time
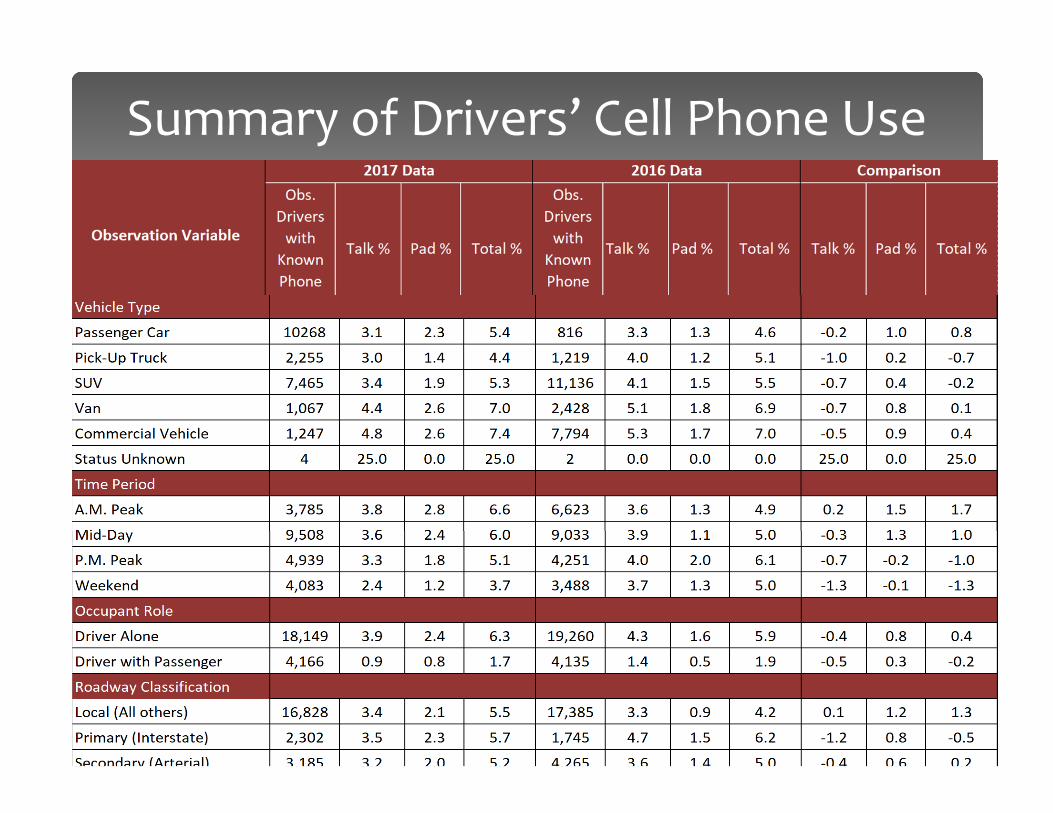
Summary of Drivers’ Cell Phone Use Prevalence ‐ 2017
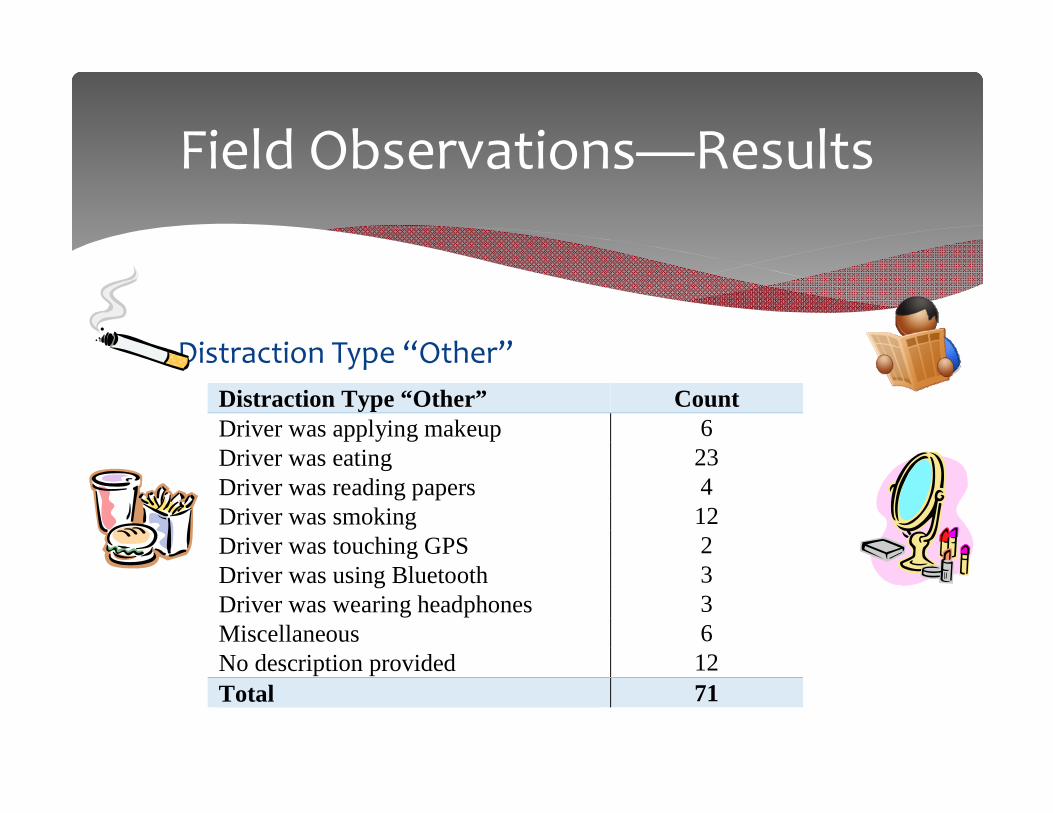
Field Observations—Results
Distraction Type “Other”Distraction Type “Other” Count Driver was applying makeup 6 Driver was eating 23 Driver was reading papers 4 Driver was smoking 12 Driver was touching GPS 2 Driver was using Bluetooth 3 Driver was wearing headphones 3 Miscellaneous 6 No description provided 12 Total 71