u:/my documents/dokumente/latex/dissertation final3 ... · as the fourfold tetragonal anisotropy....
TRANSCRIPT

HZG REPORT 2013-3 // ISSN 2191-7833
The Magnetic Spin Structure of Fe50Pt50—xRhx Films: A Neutron Diffraction Study(Vom Promotionsausschuss des Fachbereichs Physik der Universität Hamburg im Jahr 2012 als Dissertation angenommene Arbeit)
J. Fenske


The Magnetic Spin Structure of Fe50Pt50—xRhx Films: A Neutron Diffraction Study(Vom Promotionsausschuss des Fachbereichs Physik der Universität Hamburg im Jahr 2012 als Dissertation angenommene Arbeit)
Helmholtz-Zentrum GeesthachtZentrum für Material- und Küstenforschung GmbH | Geesthacht | 2013
HZG RepoRt 2013-3
J. Fenske

Die HZG Reporte werden kostenlos abgegeben.HZG Reports are available free of charge.
Anforderungen/Requests:
Helmholtz-Zentrum GeesthachtZentrum für Material- und Küstenforschung GmbHBibliothek/LibraryMax-Planck-Straße 121502 GeesthachtGermanyTel.: +49 4152 87-1690Fax.: +49 4152 87-1717
Druck: HZG-Hausdruckerei
Als Manuskript vervielfältigt.Für diesen Bericht behalten wir uns alle Rechte vor.
ISSN 2191-7833
Helmholtz-Zentrum GeesthachtZentrum für Material- und Küstenforschung GmbHMax-Planck-Straße 121502 Geesthacht
HZG RePoRT 2013-3
( Vom Promotionsausschuss des Fachbereichs Physik der Universität Hamburg im Jahr 2012 als Dissertation angenommene Arbeit)
Jochen Fenske
139 pages with 77 figures and 9 tables
Abstract
In the work presented here the structural and magnetic properties of Fe50Pt50—xRhx alloys with different Rh concentration (x=5, 10, 17.5
and 25) and thicknesses (100 nm, 200 nm, 300 nm and 500 nm) have been analyzed with macroscopic measurements and magnetically
sensitive probes with resolution on the atomic range. Compared to previous studies on bulk Fe50Pt50—xRhx alloys with macroscopic
measurements the magnetically sensitive investigations on the thin films allow together with structure factor calculations not only the
determination of general magnetic properties but for the first time the development of a detailed model of the magnetic configuration.
The structural analysis and macroscopic magnetic measurements were carried out by X-ray diffraction and MoKe measurements,
respectively, indicating that the films are well chemically ordered in a bct structure and show different magnetic phases depending on
the composition.
A more detailed analysis of the magnetic properties has been carried out by unpolarized and polarized neutron diffraction. The measu-
rements showed that in the 200 nm thick Fe50Pt50—xRhx films a transition between a ferromagnetic (FM) order in the in-plane direction
and an antiferromagnetic (AF) order in the out-of-plane direction takes place with increasing Rh concentration. Additionally a tempe-
rature driven AF-FM transition can be observed in the film with x=10. Measurements with the application of an external magnetic field
induce a FM order in the out-of-plane direction in the films with low Rh concentration while the AF ordered films with high Rh content are
not affected by the field. The thickness of the Fe50Pt40Rh10 films has in a range from 100 nm to 500 nm almost no influence on the funda-
mental magnetic properties. only the AF-FM transition of the thicker films is more rapid with increasing temperature.
The applications of detailed structure factor calculations allow to develop a model of the magnetic configuration of the Fe50Pt50—xRhx alloys.
The magnetic moments in the films with low Rh concentration are FM ordered with a dominant alignment in the out-of-plane direction
while in the films with high Rh concentration they are AF ordered and are dominantly orientated in the in-plane direction. The different
magnetic configurations can be described by a phenomenological model considering two major contributions: The first term is a bilinear
anisotropic Hamiltonian with direction dependent exchange constants and the second term includes the easy axis anisotropy as well
as the fourfold tetragonal anisotropy. The phenomenological model indicates that the easy axis anisotropy is dominant for low Rh
concentration while the fourfold tetragonal anisotropy becomes prominent for high Rh concentrations.
Die Magnetische Spin Struktur von Fe50Pt50—xRhx Filmen: eine Neutronendiffraktions-Studie
Zusammenfassung
In der hier präsentierten Arbeit wurden die strukturellen und magnetischen eigenschaften von Fe50Pt50—xRhx Legierungen mit unter-schiedlicher Rh Konzentration (x=5, 10, 17.5 und 25) und Schichtdicken (100 nm, 200 nm, 300 nm und 500 nm) untersucht. Hierfür wurden makroskopische Messungen und magnetisch sensitive Sonden mit Auflösungen im Bereich atomarer Abstände eingesetzt. Im Gegensatz zu früheren Untersuchungen von Volumen Fe50Pt50—xRhx Legierungen mit makroskopischen Untersuchungsmethoden, erlau-ben die magnetisch sensitiven Messungen nicht nur die Bestimmung der allgemeinen magnetischen eigenschaften, sondern zum ersten Mal auch die entwicklung eines detaillierten Modells der magnetischen Anordnungen.
Die strukturellen Untersuchungen und die makroskopisch magnetischen Messungen wurden mit Röntgendiffraktion und MoKe Messun-gen durchgeführt. Die ergebnisse dieser Untersuchungen zeigen, dass die Filme eine gute chemische ordnung mit bct Struktur haben. Des Weiteren wurden Hinweise auf unterschiedliche magnetische Phasen gefunden, die von der Rh Konzentration der Filme abhängen.
The Magnetic Spin Structure of Fe50Pt50—xRhx Films: A Neutron Diffraction Study

Genauere Untersuchungen der magnetischen eigenschaften wurden mit unpolarisierter und polarisierter Neutronendiffraktion durchge-führt. Diese Messungen zeigen in den 200 nm dicken Fe50Pt50—xRhx Filmen mit ansteigender Rh Konzentration einen Übergang von einer ferromagnetischen (FM) ordnung in der Richtung parallel zur Probenebene zu einer antiferromagnetischen (AF) ordnung in der Richtung senkrecht zur Probenebene. ein weiterer AF-FM Übergang kann mit ansteigender Temperatur in dem Film mit x=10 beobachtet werden. Messungen mit einem externen angelegten Magnetfeld zeigen eine Induktion einer FM ordnung in Richtung senkrecht zur Probenebene. Dieser effekt wurde nur in Filmen mir niedriger Rh Konzentration gefunden, während Filme mit hohem Rh Gehalt nicht beeinflusst werden von einem externen Magnetfeld.
Die Schichtdicke der Fe50Pt40Rh10 Filme hat in einem Bereich von 100 nm bis 500 nm nahezu keinen einfluss auf die grundlegenden magnetischen eigenschaften der Filme. es wurde lediglich beobachtet, dass der AF-FM Übergang in den dickeren Filmen mit steigender Temperatur schneller von statten geht.
Die Anwendung von detaillierten Strukturfaktorrechnungen ermöglichte es ein genaues Modell der magnetischen Anordnung zu entwickeln, welches zeigt, dass die Filme mit geringer Rh Konzentration eine FM ordnung haben, in der die magnetischen Momente in Richtung senkrecht zur Probenebene orientiert sind. Filme mit hohem Rh Gehalt haben wiederum eine AF ordnung. Hier sind die mag-netischen Momente in Richtung parallel zur Probenebene ausgerichtet. Die unterschiedlichen magnetischen Anordnungen können mit Hilfe eines phänomenologischen Modells beschrieben werden. Dieses Modell berücksichtigt zwei Beiträge: Der erste Ausdruck ist ein bilinearer anisotroper Hamilton-operator mit Richtungsabhängigen Austauschkonstanten und der zweite Ausdruck beinhaltet die easy axis Anisotropie, sowie die fourfold tetragonal Anisotropie. Das phänomenologische Modell deutet für geringere Rh Konzentrationen eine dominante easy axis Anisotropie an, während die fourfold tetragonal Anisotropie für hohe Rh Konzentrationen dominant wird.
Manuscript received / Manuskripteingang in Druckerei: 21. März 2013

Contents
1. Introduction 1
2. Fe50Pt50−xRhx related Systems 4
2.1. Fe100−xPtx . . . . . . . . . . . . . . . . . . . . . . . . . . . . . . . . . . . . 42.2. Fe100−xRhx . . . . . . . . . . . . . . . . . . . . . . . . . . . . . . . . . . . . 62.3. ternary FeRh and FePt based alloys . . . . . . . . . . . . . . . . . . . . . . 7
3. Scattering Theory 11
3.1. Scattering Geometry . . . . . . . . . . . . . . . . . . . . . . . . . . . . . . 113.2. Kinematical Scattering Theory . . . . . . . . . . . . . . . . . . . . . . . . . 12
3.2.1. Scattering length of Neutrons and X-rays . . . . . . . . . . . . . . . 133.2.2. Bragg Scattering from a Crystal . . . . . . . . . . . . . . . . . . . . 153.2.3. Magnetic Scattering . . . . . . . . . . . . . . . . . . . . . . . . . . 17
4. Experimental Methods and Instrumentation 22
4.1. Sample Preparation . . . . . . . . . . . . . . . . . . . . . . . . . . . . . . . 224.2. X-ray Instruments . . . . . . . . . . . . . . . . . . . . . . . . . . . . . . . 224.3. MOKE Instruments and Technique . . . . . . . . . . . . . . . . . . . . . . 244.4. Neutron Instruments . . . . . . . . . . . . . . . . . . . . . . . . . . . . . . 264.5. Data Treatment . . . . . . . . . . . . . . . . . . . . . . . . . . . . . . . . . 30
5. Measurements and Results 34
5.1. X-ray characterization . . . . . . . . . . . . . . . . . . . . . . . . . . . . . 345.1.1. Composition . . . . . . . . . . . . . . . . . . . . . . . . . . . . . . . 345.1.2. Film Thickness . . . . . . . . . . . . . . . . . . . . . . . . . . . . . 40
5.2. Structure Factor Calculation . . . . . . . . . . . . . . . . . . . . . . . . . . 425.3. MOKE . . . . . . . . . . . . . . . . . . . . . . . . . . . . . . . . . . . . . . 465.4. Neutron Diffraction . . . . . . . . . . . . . . . . . . . . . . . . . . . . . . . 47
5.4.1. Composition . . . . . . . . . . . . . . . . . . . . . . . . . . . . . . . 495.4.2. Magnetic Field . . . . . . . . . . . . . . . . . . . . . . . . . . . . . 665.4.3. Film Thickness . . . . . . . . . . . . . . . . . . . . . . . . . . . . . 73
5.5. Discussion . . . . . . . . . . . . . . . . . . . . . . . . . . . . . . . . . . . . 815.5.1. Discussion and Model (Temperature) . . . . . . . . . . . . . . . . . 835.5.2. Discussion and Model (Magnetic Field) . . . . . . . . . . . . . . . . 1055.5.3. Discussion and Model (Film Thickness) . . . . . . . . . . . . . . . . 1075.5.4. Theoretical Discussion . . . . . . . . . . . . . . . . . . . . . . . . . 109
6. Conclusions and Outlook 118
Bibliography 121
A. Debye-Waller factor 129

Contents v
Acknowledgements 133

1. Introduction
The improvement of fabrication techniques for artificially structured thin films and lay-ered structures, e.g. templating, lithography etc., provide systems of excellent quality andallow the tailoring of these systems on an almost atomic level [1, 2]. It allows in generalto change system parameters, e.g. the film thickness, the composition in alloys or thechemical order, independently with a high degree of precision. Artificially structures aretherefore ideally suited to study fundamental physics. For example, magnetic propertiesof a system can be studied in respect of different crystallographic aspects. Moreover,the magnetic properties of a system can be tuned by the tailoring of the structure whichoffers new opportunities for technological applications. In the information technology oneof the most prominent examples is the use of thin films for hard-disk-drives (HDD) whichreduced the production costs and increased the storage density [3]. The improvementof the storage media allowed a doubling of the storage density approximately every twoyears which is also known as Moore’s law.HDDs with longitudinal recording technology were the dominant data storage devicesuntil recently. Here, the data is stored in grains with the magnetization parallel to themedia surface [3]. Problems in the recording media emerge if the grain size reaches acritical value. Below this limit the magnetization of the grains can be thermally excited,becomes unstable and partially flip. The flipping of the magnetization without any ex-ternal magnetic field is called superparamagnetism and is the threshold of any recordingmedia [3, 4]. Since the grain sizes and, associated with this, the storage density of thelongitudinal media are on their limits the recording technology is nowadays more andmore replaced by perpendicular recording media [3]. The advantage of these media isthat they have in general a higher magnetocrystalline anisotropy compared to the longi-tudinal media which allow the grain size to be even smaller before the superparamagenticlimit is reached and thus they provide higher recording densities. In the perpendiculargeometry the magnetization of the grains are perpendicular to the media surface.Today’s recording media use magnetic materials with a high magnetocrystalline anisotropyof larger than 107erg/cm3 like CoPtCr based alloys ( 0.2×10⁷erg/cm3) that guaran-tee a high thermal stability, a lifetime above ten years and a storage density of about600Gbits/in2 [3, 5]. The aim, however, is to access even higher storage densities beyond1Tbit/in2. One possible candidate for such a high density recording media is FePt in theequiatomic composition. FePt has a high perpendicular anisotropy of about 7×10⁷erg/cm3
[6, 5] which allows to increase the storage density by a factor of about 10. The problemarising from the high anisotropy is in general a high coercivity which makes high magneticfields necessary to write the data on the media. In case of FePt magnetic fields of about7T are necessary but today’s write heads can only reach a write field of about 1.7T [7].New technologies have been explored to reduce the write field like the heat assisted mag-netic recording (HAMR) which is also known as thermally assisted magnetic recording(TAR) [8, 9]. In this technique the storage medium is heated during the writing process.Close to the Curie point the anisotropy is reduced and thus also the magnetic write field.The heating to high temperatures, however, suffers from certain drawbacks. For the FePt

2
medium thermal stresses are expected if it is heated close to the Curie temperature ofabout 500C which causes problems at the head disk interfaces and reduces the signal tonoise ratio [10]. One possible solution for this so-called trilemma between media signal tonoise, writability and thermal stability is to combine the recording medium with a softunderlayer [11]. The combination of a high anisotropic, ferromagnetic recording mediawith a low anisotropic, ferromagnetic underlayer reduces the coercivity of the recordingmedia and helps to reverse its magnetization at a reduced write field [10, 12].A promising candidate for such an underlayer is FeRh [13, 14, 15]. First measurements onthe FePt/FeRh bilayer showed that the necessary write field can be significantly reduced[10, 12, 16]. The different structures of both components, i.e. face-centered-tetragonal(fct) for FePt and body-centered-cubic (bcc) for FeRh, however, lead to lattice distortionsat their interfaces and therefore reduces the effective recording density.To overcome the problems of the lattice mismatch it is suggested to introduce a thirdelement into the crystal matrix. If Pt in the FePt alloys is partially replaced by Rh mea-surements on the bulk Fe50Pt50−xRhx system demonstrate that at low Rh concentrationsthe FM order of FePt is conserved and the Curie temperature is lowered. In certaincomposition ranges even an AF-FM transition can be found like in FeRh [17, 18]. Thesemagnetic behaviors as well as the better lattice match between the different Fe50Pt50−xRhx
alloys makes it an interesting candidate for technological applications.For these applications, in particular, in HDDs the use of thin films is preferred to reduceproduction costs and device sizes. It is well known that the magnetic properties of suchsystems with reduced sizes can differ drastically from the one of the bulk system dueto dimensionality effects. The information about the magnetic changes is essential forfurther technological applications. A challenge arising from the introduction of a thirdelement into the crystal matrix is that the process of the magnetic transitions is not fullyunderstood. Here, a good knowledge of the spin configuration is mandatory.The research on the bulk Fe50Pt50−xRhx system carried out so far mainly used macro-scopic measurements, e.g. vibrating sample magnetometer measurements [17, 18, 19].These methods are suited to study the macroscopic magnetic properties of the systembut not to examine the magnetic configuration in detail. For these measurements a tech-nique is needed which not only accesses the structure on an atomic scale but also probesthe magnetic configuration of the magnetic moments. Here, neutrons are ideal suitedsince they carry a magnetic moment themselves and therefore interact directly with themagnetic moments of a material (i.e. unpaired electrons). Furthermore with a wavelengthin the range of 1Å (thermal neutrons), similar to atomic distances in condensed matter,neutrons are ideal to resolve interatomic distances [20]. The neutron diffraction investi-gations of the nuclear and magnetic structure on an atomic scale allow in combinationwith structure factor calculations the development of a detailed model of the magneticconfiguration.The aim of this work is to investigate the magnetic properties and the spin configurationof Fe50Pt50−xRhx films. The study does not only shed light on the atomic spin structureof the system but also investigates dimensionality effects. In a first step the spin config-uration is analyzed in dependence on the temperature while the influence of an appliedmagnetic field on the magnetic configuration is investigated in a second step. Finallythe influence of the film thickness on the magnetic properties is analyzed in more de-tail which should give knowledge about the dimensionality effects. For the investigationsof the magnetic spin structure both unpolarized and polarized neutron diffraction wereperformed. Beforehand the samples were characterized by X-ray diffraction and MOKE

1. Introduction 3
measurements.In the following chapter a detailed motivation for the Fe50Pt50−xRhx system is given witha wide overview of past and recent research on related systems like FePt and FeRh. Thelast part of this chapter deals with the recent investigations on the bulk Fe50Pt50−xRhx
system. Chapter 3 gives a short overview of the fundamentals of the here applied scat-tering physics. Chapter 4 deals with the instrumental set-ups used for the investigations.In chapter 5 the results obtained with the different methods are presented and discussed.Additionally structure factor calculations are introduced which are necessary to distin-guish between different magnetic configuration models. Chapter 6 summarizes the resultsand gives a brief outlook for future investigations.

2. Fe50Pt50−xRhx related Systems
In this chapter the investigation of the Fe50Pt50−xRhx system will be motivated. It willbe highlighted why the system is of scientific interest as well as a prominent candidate forfuture technological spintronics applications. The chapter is divided in three parts. Thefirst and the second part deals with the past and recent investigations on Fe100−xPtx andFe100−xRhx systems, respectively. In the last part ternary FePt and FeRh based alloys willbe discussed with the main focus on the former investigations on the bulk Fe50Pt50−xRhx
system.
2.1. Fe100−xPtx
Since many years Fe100−xPtx systems are one of the most heavily investigated systems dueto their interesting magnetic properties and the variety of their crystallographic structures.The Fe100−xPtx systems near the equiatomic state (x=50) have drawn much attention asmaterials for high density recording media [21]. The L10 FePt alloys in the orderedphase are FM ordered with a high coercivity. Here, particularly its high anisotropy(KU=7 × 10⁷erg/cm3) which is essential for a good thermal stability of storage media,makes FePt to one of the prime candidates for future recording media.An important prerequisite for such magnetic properties is the good crystallographic andchemical order of the system. In the disordered state the FePt system is still FM orderedbut possesses no significant anisotropy and therefore only a low thermal stability. Onepossibility to achieve the ordered state is to anneal the disordered FePt alloys to about600C-1300C depending on the composition. During the annealing process the FePtsystem undergoes a phase transition from a disordered face-centered-cubic (fcc) A1-typestructure to a face-centered-tetragonal (fct) L10-type structure [22, 23, 24]. The fractionof the ordered phase increases with the annealing time [25]. Another important feature ofthe post annealing procedure and the corresponding tetragonal distortion is the transitionfrom a magnetic soft material without significant coercivity to a hard magnet with a highincrease of the coercivity of up to 9 kOe [26].Another important ingredient for high density recording media is the orientation of themagnetic moments and therefore the crystallographic orientation of the FePt alloys toovercome the superparamagnetic limit by the help of materials with perpendicular mag-netic geometry. The L10 FePt alloy grows usually in the [111] preferred orientation withan in-plane magnetic anisotropy [27]. For the desired perpendicular magnetic anisotropythe alloy needs a [001] orientation which can be provided by the growth on different sub-strates like CrRu, MgO or RuAl [28, 29].Besides the substrate and the magnetic order also the composition of the alloys plays animportant role for its magnetic properties. The ordered fct phase of Fe100−xPtx can onlybe achieved in a composition range of 35 ≤ x ≤ 55 (see Fig. 2.1). For lower and highercompositions the alloy grows in a cubic L12-type structure. Particularly the compositionaround the FePt3 alloy exhibits interesting properties [30, 31, 32, 33]. The ordered FePt3

2. Fe50Pt50−xRhx related Systems 5
Figure 2.1.: Phase diagram of the Fe100−xPtx system with the corresponding crystallo-graphic structures [36] in dependence of the temperature. L, A1, L10 and L12are the strukturbericht symbols for the different crystal structures (adaptedfrom [37]).
alloys have two different AF phases depending on the temperature [34]. At low tempera-ture, T<160K, it shows the so-called Q1-phase. In this state, the Fe moments are locatedin alternating ferromagnetic layers along the (110) plane and the AF unit cell is given bythe doubling of the L12 unit cell along the (001)- and (010)-axis. In this configurationthe Fe atoms carry a magnetic moment of about 3.3µB. In slightly Fe enriched FePt3 theQ1-phase changes into a second AF-phase below T<100K which is called the Q2-phase.The Fe moments are now located in alternating ferromagnetic layers along the (100) planewith a magnetic moment of about 2.0µB. The unit cell in this phase is here given only bythe doubling of the L12 unit cell along the (001)-axis. It is important to note that only theFe atoms carry a magnetic moment in both AF phases without inducing any moment onthe Pt atoms. In the FM phase of the ordered FePt alloys, however, the Fe atoms as wellas the Pt atoms show a magnetic moment of 2.83µB and 0.41µB, respectively [35]. Theinduction of the magnetic moment on the Pt atoms in the FM phase can be explained bythe eight Fe nearest neighbors which surround one Pt atom (see the structure insets inFig. 2.1). The orientation of the magnetic moments of Fe in the same direction leads toa resulting magnetization at the Pt site and thus induces a magnetic moment on it. Inthe AF phase, on the other hand, the magnetic moments of the Fe atoms have oppositeorientations which results to a zero net magnetic moment at the Pt site.
The previous section gives a short impression about the particular growth conditionswhich have to be fulfilled to achieve high density recording media. Besides these condi-tions, however, different tasks are still unresolved to use ordered FePt alloys as recordingmedia.The high anisotropy of FePt provides a good thermal stability but due to the inherent highcoercivity also high write fields are necessary to write the information on the recordingsystem. A solution would be to heat the system close to the Curie point to about 500C

6 2.2. Fe100−xRhx
to lower the necessary write field. At such high temperatures, however, problems at thehead-disk interfaces are expected, i.e. due to thermal stresses that reduce the signal tonoise ratio. A solution for the so-called trilemma, between thermal stability, writabilityand the media signal to noise ratio, is the combination of the recording system with anunderlayer to lower the write field.It should be noted, that besides the technological application the FexPt100−x system it isalso interesting for the investigation of fundamental effects in magnetism. As discussedabove the FePt3 alloys have an AF order in the ordered state as well as a FM order forthe FePt alloy or the disordered state. A combination of both states makes the system agood candidate to study exchange mechanism, i.e. exchange bias [38, 39]. By the use ofFe100−xPtx with almost the same lattice constants (FePt: a=3.863Å, c=3.710Å [40] andFePt3: a=3.866Å [30]) lattice strain can be avoided. Therefore it offers the possibilityto study intrinsic magnetic exchange coupling phenomena between two magnetic phaseswithout the influence of lattice distortions at the interfaces.
2.2. Fe100−xRhx
A good candidate for a magnetic underlayer is a soft magnetic material with an AF-FMphase transition slightly above room temperature. The AF phase of the underlayer pro-vides additional thermal stability to the FePt recording media during the storage of theinformation while the FM phase lowers the magnetic write field which will be discussedin more detail later. The heating to temperatures of slightly above room temperaturereduces thermal stresses that were expected by heating the FePt alloy close to the Curietemperature of about 500C. A possible candidate for such an underlayer is the FexRh100−x
system due to its particular magnetic properties which will be discussed in the following.Similar to Fe100−xPtx the magnetic and structural properties of the bulk FexRh100−x alloysdepend on their composition. In a composition range of about 26 ≤ x ≤ 45 the alloyis purely AF with no phase transition [13] while for x > 64 the alloy becomes param-agnetic [14]. The composition range near the equiatomic state (51 ≤ x ≤ 60) is againof most interest, because they exhibit an AF-FM phase transition. The changes in themagnetic properties with the composition are also accompanied with structural changes.For Fe100−xRhx alloys below x < 56 only the body-centered-cubic (bcc) structure is ob-servable while in the range of about 56 ≤ x ≤ 63 the bcc and the fcc structure coexist[41]. Furthermore, X-ray diffraction measurements demonstrated that for the equiatomicstate (x=50) the appearance of the different structures is temperature dependent: at tem-peratures above the AF-FM transition temperature of T=350K only the bcc structure ispresent while below the system partially transforms to the fcc structure [15]. Associatedwith the AF-FM transition is a volume expansion of about 1%. A second magnetic tran-sition from FM to PM was found at a temperature of about Tc=670K.Mössbauer spectroscopy and neutron diffraction measurements furthermore show that inthe AF phase only the Fe atoms carry a magnetic moment of 3.3µB while the Rh atomshave no magnetic moment at all similar as it was observed in the FePt alloys. In the FMphase, on the other hand, a magnetic moment of 0.9µB was found for the Rh atoms whileat the same time the moments of the Fe atoms are slightly reduced to 3.2µB [42].Another feature that makes the FeRh alloy very interesting for technological applicationis that in thin films the transition temperature of the AF-FM transition can be modifiedby the choice of the substrate. The transition temperature for FeRh grown on a sapphiresubstrate, for example, is lower than for FeRh grown on a MgO substrate due to tensile

2. Fe50Pt50−xRhx related Systems 7
in-plane strain which favors the FM over the AF state [43]. Furthermore the transitiontemperature can be lowered by an external magnetic field [44].Other important factors for technological applications of magnetic materials are theswitching dynamics between the AF and FM state. First time resolved X-ray magneticcircular dichroism measurements on 30 nm polycrystalline thin Fe48.5Rh51.5 films by Raduet al. [45] showed that the switching process between the AF-FM state is a rapid nucle-ation and slow expansion process of FM regions which replace the AF order.
FeRh is an ideal candidate for an underlayer in a FePt recording system due to theAF-FM transition close to room temperature (T=350K). First experiments by Thiele onFePt/FeRh bilayer systems showed that the magnetic write field can be reduced. The dif-ferent lattice parameters of FeRh (a=2.986Å [46]) and FePt (a=3.863Å), however, causelarge lattice distortions or even canted growth of the FePt media. Since the magneticproperties of the FePt alloys depend strongly on the structure and the growth direction,the distortion would influence the magnetic properties and therefore reduce the storagedensity of the FePt media. To achieve a smoother lattice match both materials can bedoped by a third element as it will be shown in the next section.The read and write process in these coupled media follow the same principles. TheFePt/FeRh system, for example, is heated during the writing process up to a temperatureT0 in the range of about 350K<T<670K where the FeRh system is in the ferromagneticstate. The coupling of the high anisotropic, ferromagnetic FePt with the low anisotropic,ferromagnetic FeRh reduces the coercivity of the FePt alloy by a factor of two to three viaan exchange spring mechanism. The exchange spring are strongly nonuniform magneti-zation distributions located mainly in the FeRh alloy which later penetrate into the FePtalloy and helps to reverse its magnetization at a reduced write field [47, 16]. The data arethereafter stored at a temperature where the FeRh system is in the AF state (T<350K)and thus the anisotropy of the FM FePt is high providing a good thermal stability. Moredetails of the coupling process can be found in Ref. [12, 47, 48, 49].
2.3. ternary FeRh and FePt based alloys
The previous chapters gave a short overview about the magnetic properties of the FePtand FeRh alloys and their potential in real devices for technological applications. It wasalso pointed out that their use is hampered by abrasion effects when the FePt system isheated close to the Curie point or by complications of the structural growth due to thelarge lattice mismatches with the FeRh underlayer. To overcome these limitations theFePt as well as the FeRh alloys can be combined with a third element, e.g. to reduce theCurie temperature of the FePt system and to achieve a smoother lattice match betweenthe FePt and FeRh system. These so-called pseudo-binary or ternary alloys will be dis-cussed in the following.A good knowledge of the magnetic and structural properties of the ternary alloys is manda-tory for further technological developments since it is well known that the magnetic prop-erties of FeRh and FePt alloys can differ drastically if a third element is introduced intothe crystal matrix. For example, the addition of Ni or Cu into the FePt alloy replacing theFe atoms lowers the Curie temperature [10, 50, 51]. Here, Cu proved to be more effectivethan Ni [52]. The replacement of Fe by Ni, on the other hand, reduces the coercivity [53]and therefore lowers the write field of the system. It is important to note that the fctstructure is conserved if the third element is introduced into the FePt crystal matrix and

8 2.3. ternary FeRh and FePt based alloys
associated with this the perpendicular orientation of the magnetic moments.Similar to FePt also the magnetic properties of FeRh alloys can be modified by the addi-tion of a third element. If Rh is partly replaced by a small amount of Pd or Ni the AF-FMtransition temperature decreases [54, 55, 56, 57] while it increases if Ir or Pt is added tothe alloy [18, 58]. The cubic structure of the FeRh based alloy, however, is conservedduring the addition of a third element, as long as the amount of substitution is small.For higher amounts, on the other hand, not only the transition temperature but also thecrystal structure as well as the magnetic phase itself are affected as will be shown in thefollowing. Here, we will concentrate mainly on the partial substitution of Rh for Pt inthe FePt alloys since these ternary alloys lower the Curie temperature like the FePtNior FePtCu which is preferable for technological applications, e.g. HAMR. In contrast tothe two alloys described above the Fe50Pt50−xRhx alloy is a more promising candidatefor a recording system with an FeRh underlayer due to the better lattice match whichleads to smoother interfaces and the potential for higher recording densities. The effectof the Pt substitution for Rh in the bulk FeRh alloy or Rh for Pt in the bulk FePt alloy,respectively, is presented in the following.X-ray diffraction studies showed that the bulk Fe50Pt50−xRhx system has for concentra-tions of x≥45 an ordered bcc structure (B2), while for concentrations of x≤40 a transitionto an ordered body-centered-tetragonal (bct) structure of the CuAuI type (L10) takesplace [17]. This bct phase stabilizes with increasing Pt content. The structural transi-tions in dependence on the Pt or Rh concentration, respectively, are also accompanied bychanges of the magnetic properties.A detailed study of the magnetic properties of the bulk Fe50Pt50−xRhx system were car-ried out by the group of Yuasa. They used measurements of the linear thermal expansion(LTE) [19], the magnetostriction, the resistivity [18], a pendulum type and a vibratingsample magnetometer as well as Mössbauer spectroscopy [17, 59] to investigate the mag-netic properties of the alloys. By the comparison of the magnetization measurements ofthe magnetometer with, for example, the LTE coefficient it can be shown that the AF-FMphase transition is accompanied by a sharp drop of the LTE coefficient, while the resistiv-ity measurements showed a discontinuous behavior. The different measurements indicatethree different temperature driven magnetic transitions in the bulk Fe50Pt50−xRhx alloy(see Fig. 2.2): For a Rh content of about 14<x<40 an AF-PM transition was found whilethe measurements refer to an AF-FM-PM transition in a composition range of 9.5<x<14.A FM-PM phase transition was observed in a range of 0<x<9.5 and for compositionsabove x=42, where the Fe50Pt50−xRhx alloys have a bcc structure, an AF-FM-PM phasetransition can be observed. It is important to note that the AF-FM transition is of firstorder while the FM-PM phase transition is of second order. A more detailed study ofthe triple point has been carried out by the group of Takizawa. By the use of magne-tization measurements and Mössbauer spectroscopy together with X-ray diffraction theyconcluded that the triple point is located at about x=14.25 and at a temperature of aboutT=388K [58].Further magnetostriction measurements on the Fe50Pt50−xRhx system showed that theAF-FM transition can be induced by an external applied magnetic field. Another featureof the magnetic field is a reduction of the transition temperature [19].X-ray diffraction measurements for the bct structured Fe50Pt50−xRhx system with Rhconcentrations below x≤40 showed that no structural changes occur around the observedmagnetic transitions. The AF-FM transition, on the other hand, is accompanied by an in-crease of the lattice parameter c while the lattice parameter a decreases. For the AF-FM

2. Fe50Pt50−xRhx related Systems 9
transition in the bulk Fe50Pt40Rh10 system, for example, a decreases of about 0.3% canbe observed for the lattice parameter a while at the same time the parameter c increasesof about 0.75% (see Fig. 2.3). The decrease and increase, respectively, lead consequentlyto an increase of the c/a-ratio of about 1.05% as well as to an increase of the volume ofabout 0.15%. A similar behavior can be observed for the AF-PM transition. Here, thevolume of the Fe50Pt35Rh15 system increases of about 0.15% and the c/a ratio increasesof about 0.36%.Besides the discontinuity of the c/a-ratio due to the magnetic transitions it was alsoshown that the c/a-ratio as well as the volume increases with the Pt concentration of theFe50Pt50−xRhx alloys. The c/a-ratio increases here of about 14.7% from 1.185 for x=50to 1.359 for x=0. At the same time the volume of the unit cell changes from 26.49Å
3to
27.53Å3
which is an increase of about 3.8%. For compositions of x=49, 37.5 and x=10,however, a discontinuous behavior of the volume and the c/a-ratio can be observed. Thereason is a change of the dominant magnetic order, only for the Fe50Pt12.5Rh37.5 systemthe discontinuity is due to a martensitic transformation.First measurements on thin films were carried out by Lu on 50 nm thin Fe50Pt50−xRhx
alloys in the Rh rich regime (50 ≤ x ≤ 37.5) to investigate how the reduced sampledimension changes the magnetic properties [60, 61, 62]. By the use of X-ray diffraction,vibrating sample magnetometer and energy dispersion fluorescence X-ray spectrometrymeasurements a similar behavior as in the bulk system was observed with an increase ofthe AF-FM transition temperature with the Pt content. Furthermore they showed thatan external magnetic field reduces the transition temperature. It is important to notethat in the regime of x ≤ 42.5 the 50 nm thin Fe50Pt50−xRhx alloys still have the bccstructure of FeRh.
The previous investigations on Fe50Pt50−xRhx alloys have been carried out with macro-scopic measurement methods. These methods are able to study the macroscopic magneticproperties of the alloys but they are not sensitive to probe length scales with a resolutionon the atomic range. Therefore they are not able to study the magnetic configurationof the alloys in detail which is essential for future applications as already mentioned inthe introduction. The measurements on thin Fe50Pt50−xRhx films so far have been onlycarried out in the Rh rich regime. Data of thin alloy films in the Pt rich regime is stillmissing. The behavior of the AF-FM transition in the Fe50Pt40Rh10 alloy, for example, isnot known in thin films. Furthermore in the previous experiments the alloy thickness andits influence on the magnetic properties has not been investigated in detail. To investigatethese aspects of the Fe50Pt50−xRhx alloys the magnetic properties and configuration ofFe50Pt50−xRhx films in the Pt rich regime (x ≤ 25) will be investigated in the followingby the use of a magnetic sensitive probe with a wavelength in the atomic range. Neutrondiffraction measurements will be carried out in dependence on temperature (10K-500K),magnetic field (up to 12T) and sample thickness (100 nm-500 nm). The next chapter willgive an introduction to the neutron scattering theory followed by a description of theinstruments used for the investigations.

10 2.3. ternary FeRh and FePt based alloys
Figure 2.2.: Magnetic phase diagram of the bulk Fe50Pt50−xRhx system. Here AF’ labelsthe martensic antiferromagnetic, AF the antiferromagnetic, FM the ferromag-netic and PM the paramagnetic phase (adepted from [17]).
Figure 2.3.: Temperature dependence of the lattice constants a and c for the bulkFe50Pt40Rh10 alloy near the AF-FM transition temperature T0 (adepted from[17]).

3. Scattering Theory
In this chapter a brief overview of the scattering theory is given. Most of the formulahave been taken from reference [63] with additions from references [64, 65, 66, 67, 68]For the structural analysis of condensed matter different particles are used as probes, asthere are protons, neutrons, electrons, photons or atoms. The neutron and photon scat-tering, the latter in the X-ray regime, have some advantages compared to the scatteringwith electrons, protons or He-atoms. Both scattering methods are not limited to a smallsurface region but can penetrate deeper into the material due to their comparatively weakinteraction with matter. Therefore they are ideal probes for the non-destructive study ofbulk materials as well as thin films or multilayer.Neutrons interact with the nucleus of an atom. Since they are also spin one-half particlesthey carry a magnetic moment and interact with the unpaired electrons in matter mak-ing them sensitive to detect magnetism. X-rays or photons, on the other hand, are spinone particles and carry no magnetic moment themselves. As an electromagnetic wavethey interact with the electron shells of an atom and are also sensitive to the magneticmoments in matter. This interaction occurs between the spins of the electrons in matterand the electromagnetic field as well as an interaction of the orbital momentum of theelectrons and the magnetic field of the electromagnetic wave [69]. Compared to neutronscattering these interactions are in general weak, but can be drastically enhanced by tun-ing the photon energy to the absorption edge of the magnetic site. Here, the magneticinteraction can be even larger as for neutrons but it is limited to a certain energy rangewhich restrains the accessible reciprocal space for most cases. For 3d transition metals,e.g. Fe, a significant enhancement of the magnetic interaction can be only observed in thesoft X-ray regime. In this regime the X-rays are strongly absorbed by the matter and asa consequence the penetration depth is reduced which limits the investigation of thickerfilms and bulk samples to surface regions. Also measurements with the scattering vector~Q oriented in-plane are difficult due to the absorption. Considering the properties of bothprobes they can be used complementarilly to study the nuclear and the magnetic struc-ture of matter. The advantages or disadvantages of one of both probes depend stronglyon the sample system. For the investigations presented here of the Fe50Pt50−xRhx alloysneutrons are the probe of choice due to their higher penetration depths and the largeraccessible Q-range.The properties of neutrons and X-rays are summarized in table 3.1. The scattering theoryfor elastic neutron scattering and further information on the interaction with matter willbe discussed in the following.
3.1. Scattering Geometry
Figure 3.1 shows a typical elastic scattering process in the reflection geometry. Theincident beam with the incident angle θi in respect to the sample surface and the wavevector ~ki = 2π/λ with the wavelength λ is scattered at the surface and reflected under the

12 3.2. Kinematical Scattering Theory
sample
Figure 3.1.: Schematic sketch of a typical elastic scattering process in reflection from asample.
angle θf with the wave vector ~kf . The momentum transfer of the process is the differenceof the incident and scattered wave vector and denoted as the scattering vector ~Q:
~Q = ~kf − ~ki. (3.1)
In this work only elastic scattering will be considered, where∣∣∣~ki
∣∣∣ =∣∣∣~kf
∣∣∣, which means thatno energy transfer to the sample occurs and the wavelength of the neutrons is unalteredthroughout the scattering process. The scattering vector is then defined in the followingway:
| ~Q |=| ~kf − ~ki |= 4π/λ · sin θ. (3.2)
For the specular case it is θi = θf = θ and ~Q perpendicular to the plane of incidence.
3.2. Kinematical Scattering Theory
A typical scattering process of photons in the X-ray regime or neutrons is visualized inFig. 3.2. An incident plane wave ψ0 = eikx propagates along the x-direction and interactswith a scatterer. The scatterer in this process can be described by a potential V. If thispotential is considered as localized, i.e. the sphere of interaction of V is small comparedto the space dimension of the wave package, the potential can be described as point-like.Additionally it can be assumed that for X-ray photons and neutrons the interaction of
Neutrons X-rays (photons)elementary particles Quarks:udd exchange particle of
the electromagnetic interactionCharge 0 0Mass mn = 1, 675× 10−27kg 0Spin 1/2 1magnetic dipole µn = −1, 913µk 0Moment
Wave equation Schrödinger equation Maxwell equationsMomentum ~p = m~v = ~~k; p = h/λ ~p = ~~k; p = h/λ
Energy E = mv2
2 = ~2k2
2m = kBT E = hν = hcλ
Table 3.1.: Properties of neutrons and X-rays

3. Scattering Theory 13
Figure 3.2.: Schematic sketch of the scattering process of a neutron or X-ray beam rep-resented by a plane wave ψ0 with a wavelength λ and a point like scattererresulting in a spherical wave ψs (adapted from [70]).
the wave package with the potential is in general weak and multiple scattering can beexcluded. These assumptions are taken into account in the Born approximation which isused to describe the scattering process under these conditions. Here, the interaction ofthe incident beam with the point like scatterer can then be described as a perturbationof the incident plane wave ψ0 by the potential V and thus the scattered wave in fardistance (r → ∞) by a spherical wave. The entire scattering process is then given bya superposition of a transmitted plane wave which continues to propagate along the x-direction and a scattered spherical wave [63]:
ψs(~r) = eikx + f(θ)eikr
r, (3.3)
with the scattering amplitude f(θ) which is the Fourier transform of the scattering po-tential:
f(θ) = A( ~Q) ∝ b
∫d3rei
~Q~rδ(~r − ~Rn) = bei~Q~Rn , (3.4)
with the scattering vector ~Q as defined in equation 3.1, ~Rn the positions of the scattererand with b as the scattering length. The scattering intensity is then given by:
I( ~Q) =| A( ~Q) |2=| A( ~Q)A∗( ~Q) |∝| bei ~Q~r |2 . (3.5)
This term describes the interaction between the incident beam and the scatterer. Furtherdetails to the scattering length in neutron and X-ray diffraction will be given in the nextsection. It is important to note that in a typical scattering experiment only the intensity orthe square of the amplitude, respectively, is measured and therefore the phase informationis lost. In this case the only way to gain information about the structure of a sample isby comparison of the measured and calculated scattering intensity.
3.2.1. Scattering length of Neutrons and X-rays
The scattering length describes the interaction of the beam with the scatterer. Since neu-trons and X-rays interact physically in a different way with matter one has to distinguishbetween both probes.

14 3.2. Kinematical Scattering Theory
Neutrons
Neutrons interact with the nucleus and the unpaired electrons of an atom. Thereforea nuclear (bn) and a magnetic (p) part for the neutron scattering length have to beconsidered.For the nuclear scattering process with neutrons the scatterer can be described by theFermi pseudo potential [63]:
V (~r) =2π~2
mn
bδ(~r − ~Rn). (3.6)
In the Fermi potential it is considered that the wavelength of neutrons (≈ 10−10m) is largecompared to the small size of the nucleus and the short range of the strong interaction(both in the range of ≈ 10−15m). Therefore the scatterer can be assumed to be point-like and the nuclear scattering process can be described by a scalar scattering lengthbn which is independent of ~Q. Another feature of the nuclear scattering length is anunsystematical variation throughout the periodic table which gives often a large scatteringcontrast between elements with similar order number Z or isotopes. Some elements haveeven negative bn, e.g. H or Mn.Since neutrons are spin one-half particles they interact with the magnetic moment inthe sample (i.e. unpaired electrons). This interaction can be described by the magneticscattering length p [71]:
p =e2γ
2mc2gJf(θ) =
(2.7× 10⁻⁵Å
)· gJf(θ), (3.7)
where γ = µn
µk= −1.913 is the gyromagnetic moment of neutrons, µk the nuclear magneton
and g the Landé-factor which includes contribution from the spin and angular orbitalmoment: g = 1 + J(J+1)+S(S+1)−L(L+1)
2J(J+1)where S is the spin and L the orbital angular
moment, J is the Spin-Orbit quantum number. The magnetic form factor f(θ) is given bythe Fourier transform of the dispersion of the unpaired electron spins. Since the diameterof the orbitals is of the same size as the neutron wavelength the magnetic scattering lengthis ~Q-dependent in contrast to the nuclear part (see section 4.5).The contribution of the magnetic part to the scattering length is also very sensitive to thepolarization state of the incident neutrons and its orientation to the magnetic momentsof the scatterer. This will be discussed in section 3.2.3 in more detail.
X-rays
In contrast to neutrons X-rays interact with the electronic shells of the atoms. Thescattering of X-rays from electrons is called Thomson scattering, e.g. the scattering froma free electron is described by the scattering length [70]:
re =e2
mec2, (3.8)
where e is the charge of electron, me the electron mass and c the velocity of light. Forthe scattering process on a condensed matter sample all electrons in the atomic shellscontribute to the scattering process. Since the shells have a dimension in the same rangeas the wavelength of the incident X-rays they can not be treated as point scatterer. As a

3. Scattering Theory 15
consequence one has to integrate over all contributing electrons by considering their phaserelations leading to the scattering factor fe:
fe =
∫ρe(r)e
i ~QrdV, (3.9)
with ρe denoting the electron density. This integral over the shell of an atom is called theatomic form factor. The total scattering length of an atom can be written as [65]:
bx = re(fe +∆f′
e +∆f′′
e ), (3.10)
where the terms ∆f′
e and ∆f′′
e are correction terms, which become important if the pho-ton energy is near a resonance, denoting the real and imaginary parts of the dispersionand absorption correction, respectively. Since the scattering process of X-rays can not beconsidered as point-like the scattering length show a ~Q-dependence similar to the mag-netic scattering length of neutrons with a slower decay along
∣∣∣ ~Q∣∣∣. Another important
consequence is the quasi linear like behavior of the scattering length bx with the atomicnumber of the elements throughout the periodic table since the strength of the scatteringprocess for X-rays is directly dependent on the number of electron participating to thescattering process.
3.2.2. Bragg Scattering from a Crystal
A three dimensional perfect crystal can be described by three independent basic vectors~a1, ~a2, ~a3. These vectors form the unit cell with the volume V = ~a1 · (~a2 × ~a3). Thetranslation vector that leads from one point in the unit cell to an equivalent point in another cell is called lattice vector ~T = u~a1 + v~a2 + w~a3, where u, v, w are integers. Aso-called Bravais lattice consists of all points that are described by the lattice vector ~T[72].For every crystal lattice in the real space exists an equivalent reciprocal lattice in thereciprocal space that can be described by the reciprocal lattice vector ~G:
~G = h~a∗1 + k~a∗2 + l~a∗3. (3.11)
The reciprocal lattice vector with the Miller indices h, k and l is perpendicular to the(h,k,l)-lattice planes and is defined in such a way that the following relation is satisfied:
exp(i ~G~T ) = 1. (3.12)
The vectors of the reciprocal lattice and that of the real space are linked to each other by[65]:
~a∗1 =2π
V~a2 × ~a3, ~a∗2 =
2π
V~a3 × ~a1, ~a∗3 =
2π
V~a1 × ~a2. (3.13)
The distance between the (hkl)-planes in the perpendicular direction is called the latticeplane distance dhkl and the planes parallel to the (hkl)-plane are called lattice plane bands.The reciprocal lattice vector and the lattice distance are linked by the following equation:
| ~Ghkl |=2π
dhkl. (3.14)

16 3.2. Kinematical Scattering Theory
where the reciprocal lattice vector is perpendicular to the lattice planes.The equation 3.5 can now be written for one atom per unit cell as:
I( ~Q) ∝| b |2|∑
u,v,w
ei~Q~T | . (3.15)
For a three dimensional crystal with the basic vectors ~a1, ~a2, ~a3 the scattering amplitudeis given by [63]:
A( ~Q) = bUVW∑
uvw
eiu~Q~a1eiv
~Q~a2eiw~Q~a3 , (3.16)
leading to an expression for the scattered intensity of:
I( ~Q) ∝| A( ~Q) |2 = | b2 | sin2(U ~Q~a1) sin
2(V ~Q~a2) sin2(W ~Q~a3)
sin2(12~Q~a1) sin
2(12~Q~a2) sin
2(12~Q~a3)
(3.17)
= | b2 | L21( ~Q~a1)L
22( ~Q~a2)L
23( ~Q~a3),
with the Laue functions Li( ~Q~ai) = sin2(N ~Q~ai)
sin2( 12~Q~ai)
. The main maxima appear at positions
where the scattering vector satisfies the relation ~Q = n·2πai
(n = u, v, w; i = 1, 2, 3). Themore lattice planes or scatterer, respectively, contribute the sharper and more intense arethe main maxima. Between the main maxima appear n − 2 subsidiary maxima due tohigher order scattering. The solution for the main maxima is exactly given if the Lauecondition is fulfilled, which can be written by equation 3.14 as:
~Q = ~G. (3.18)
The scattering process where equation 3.18 is fulfilled is called Bragg scattering except inthe case of ~Q = 0, where no scattering takes place. The Laue conditions are equivalentto the Bragg-law which can be written as [65]:
λ = 2dhkl sin θ, (3.19)
with θ denoting the incident angle relative to the lattice planes. By the use of equation3.14, 3.18 and the Bragg law one can obtain the well known formula for the momentumtransfer at the scattering process:
∣∣∣ ~Q∣∣∣ = 4π
λsin θ. (3.20)
The scattering from a Bravais lattice as described above takes only one atom per unitcell into account. For n atoms per unit cell the position of the n-th scatterer is given by~Rn = ~T + ~ρ. Here it is ~ρ =
∑imi~ai (where mi are rational numbers and i=1,2,3) the
positions of the scatterer. From equation 3.15 the scattered intensity can be calculatedwith:
I( ~Q) ∝∣∣∣F ( ~Q)
∣∣∣2
=
∣∣∣∣∣∑
n
ei~Q~Rnbn
∣∣∣∣∣
2
. (3.21)
F ( ~Q) denotes here the structure factor which contains information about the configurationof the atoms in the unit cell and is one important factor for the relative peak intensity.In the case of pure Bragg scattering the structure factor can be written as:
F ( ~G) =∑
n
bnei ~G~ρ =
∑
n
bne2πi(hm1+km2+lm3). (3.22)

3. Scattering Theory 17
In this equation the following relations were used:
~a1 · ~a∗1 = ~a2 · ~a∗2 = ~a3 · ~a∗3 = 2π (3.23)
~a1 · ~a∗2 = ~a1 · ~a∗3 = ~a2 · ~a∗3 = 0.
At certain conditions the structure factor can become zero (F = 0) due to destructiveinterference effects. In a bcc structure for example with only one kind of atoms allreflections are forbidden for which the sum of the Miller indices h + k + l results in anodd number.It is important to note that the above description is only valid for perfect crystals. Realcrystals can be described as a conglomeration of many perfect crystallites that are slightlyshifted and canted to each other. The so-called mosaic crystals have different sizes andsimilar orientations. Information about the mosaic spread of the crystals can be gainedby the evaluation of rocking scans, since the larger the mosaic spread the broader is theangular distribution of the peaks. The average size of the crystals, on the other hand, canbe determined by the Debye-Scherrer approximation [73]:
B(2θ) =0.89λ
L cos θ, (3.24)
with B(2θ) the Full Width at Half Maximum (FWHM) of the radial measured peak, λthe wavelength of the used radiation and L the coherence length.
3.2.3. Magnetic Scattering
In the following the magnetic scattering process will be described. Here, two cases haveto be distinguished. In the unpolarized case the neutron beam consists ideally of equalamounts of spin up and down neutrons, while in the polarized case only one spin state ofthe neutrons, spin up or spin down, is present.
unpolarized case
As mentioned above neutrons interact with the core of an atom as well as with its mag-netic moments. Therefore two independent contributions have to be considered for thescattering intensity of unpolarized neutrons [65]:
| F ( ~Q) |2 = | Fn( ~Q) |2 + | Fmag( ~Q) |2, (3.25)
with | Fn( ~Q) |2 = |∑
i
biei ~Q~ri |2 (3.26)
| Fmag( ~Q) |2 =∑
i
∑
j
pi~qipj~qjei ~Q(~ri−~rj), (3.27)
where Fn denotes the nuclear term, Fmag the magnetic term, bi the nuclear scatteringlength and pi, pj the magnetic scattering lengths (see the section above). The vector ~q isthe so-called Halpern vector, describing the magnetic interaction [65]:
~q = ~ǫ(~ǫ ~K − ~K), (3.28)
with ~ǫ indicating the unit vector perpendicular to the scattering plane and the vector~K pointing in the direction of the magnetic moments. If ~ǫ is parallel to ~K then ~q = 0

18 3.2. Kinematical Scattering Theory
Figure 3.3.: Diffraction spectra of unpolarized neutrons scattered from a simple cubicstructure. Picture A shows the spectra of a ferromagnetic cubic structure.Picture B refers the antiferromagnetic case. The gray labeled intensity regionsare the magnetic contributions to the intensity (adapted from [74]).
while ~q reaches its maximum in the case of ~ǫ being perpendicular to ~K. In a saturatedferromagnetic material all spins are aligned parallel as shown in Fig. 3.3. In this case itis:
~qi~qj = q2 = sin2 α, (3.29)
where α is the angle between the unit vectors ~ǫ and ~K. In the ferromagnetic case it canbe easily seen that the magnetic contributions appear at the same Q-positions as for thenuclear reflections. Therefore, only the peak intensity is changing due to the additionalcontributions of the magnetic scattering.In the simplest antiferromagnetic case, where the spins of two ferromagnetic sublatticespoint in different directions, atom pairs exist with ~Ki = − ~Kj. In this case it can bewritten ~qi~qj = q2 = − sin2 α and equation 3.27 is modified to [65]:
| Fmag( ~Q) |2= sin2 α∑
i
∑
j
(±)pipjei ~Q(~ri−~rj) (3.30)
The plus and minus represent the spins of atom pairs being parallel or antiparallel. Dueto the doubling of the unit cell in the magnetic case in comparison to the nuclear oneadditional magnetic peaks appear at the half order positions between the nuclear peaks(see Fig. 3.3).
polarized case
For the description of the polarized neutron scattering a different ansatz will be used.As discussed before neutrons are spin one-half particles and carry a magnetic moment

3. Scattering Theory 19
and interact with the magnetic field of the unpaired electrons. This interaction can bedescribed by the potential Vm [63]:
Vm = − ~µn · ~B, (3.31)
where ~µn denoting the neutron spin given by:
~µn = −γµ~σ. (3.32)
In this equation µ denotes the nuclear magneton and γ = −1.913 the gyromagneticfactor of the neutrons. ~σ indicates the spin operator. The magnetic field of the unpairedelectrons results from two parts: the dipole field of the spin moment ~Bs defined as:
~Bs = ~∇× (~µe × ~R
R3), (3.33)
where µe is defined as µe = −2µB~S, and on the magnetic field from the orbital moment
BL following from Biot Savart law:
~BL = −ec
~ve × ~R
R3. (3.34)
To explain this scattering process the introduction of the differential cross section ( dσdΩ) is
useful. The cross section is defined by [75]:
(dσ
dΩ) =
number of interacting particles/unit time × unit cone dΩnumber of incident particles/unit time × unit area × unit cone dΩ
. (3.35)
For elastic scattering processes the differential cross section is proportional to the scatter-
ing intensity and thus to the square of the scattering amplitude: ( dσdΩ) ∝ I( ~Q) ∝
∣∣∣A( ~Q)∣∣∣2
.For the magnetic scattering process the differential cross section can be expressed asfollows [63]:
(dσ
dΩ) = (
m
2π~2)∣∣∣⟨~kf~σ
fz |Vm|~σi
z~ki
⟩∣∣∣2
, (3.36)
and by using 3.31 as the expression for the potential Vm, the scattering amplitude can bewritten as:
(dσ
dΩ) = (γr0)
2
∣∣∣∣1
2µB
⟨Sfz
∣∣∣~σ · ~M⊥( ~Q)∣∣∣Si
z
⟩∣∣∣∣2
. (3.37)
~M( ~Q) is the Fourier transformed of the magnetization density:
~M( ~Q) =
∫ei
~Q~r ~M(~r)dr3 (3.38)
with~M⊥ = ~Q× ~M( ~Q)× ~Q = ~M( ~Q)− ~Q( ~M( ~Q) · ~Q). (3.39)
~M(~r) denotes here the magnetization on an atomic scale. The corresponding geometry ofthe scattering process is shown in Fig. 3.4. It should again be noted that only magneticmoments perpendicular to ~Q contribute to the scattering amplitude.Considering the equation 3.37 the scattering amplitude
∣∣∣A( ~Q)∣∣∣ can be written as:
A( ~Q) = −γnr02µB
⟨Sfz
∣∣∣~σ · ~M⊥
∣∣∣Siz
⟩= −γnr0
2µB
⟨Sfz |~σa|Si
z
⟩~M⊥( ~Q)a, (3.40)

20 3.2. Kinematical Scattering Theory
where ~σa are the Pauli spin matrices:
~σx =
(0 11 0
); ~σy =
(0 −ii 0
); ~σz =
(1 00 1
). (3.41)
The spin up and down states can be written as(
10
)= |+〉 and
(01
)= |−〉, respec-
tively. The spin matrices can now be expressed as:
~σx |+〉 = |−〉 ; ~σx |−〉 = |+〉~σy |+〉 = i |−〉 ; ~σy |−〉 = −i |+〉 (3.42)
~σz |+〉 = |+〉 ; ~σz |−〉 = |−〉 .
Considering the equations for the spin matrices the magnetic scattering amplitude is givenby:
A( ~Q) = −γnr02µB
~M⊥z( ~Q)
− ~M⊥z( ~Q)~M⊥x( ~Q)− i ~M⊥y( ~Q)~M⊥x( ~Q) + i ~M⊥y( ~Q)
for
+ → + (NSF )− → − (NSF )+ → − (SF )− → + (SF )
. (3.43)
In the first two cases, denoted as Non-Spin-Flip (NSF) scattering, the spin state of theneutron is unaltered by the scattering process. Here, the scattering amplitude representsthe part of ~M⊥( ~Q) being parallel to the polarization of the neutrons. In the two (++)and (- -) NSF states the spins of the sample are oriented parallel to the guide field andperpendicular to ~Q. The guide field H serves as the quantization axis that aligns theneutron spins parallel to the field.In the last two cases the spins are flipped during the scattering process and is consequentlycalled Spin-Flip scattering (SF). In this process the scattering amplitude expresses thepart of ~M⊥( ~Q) being perpendicular to the polarization of the neutrons. In other words,the scattering of the neutrons at the spins of the sample which are oriented perpendicularto the guide field as well as to the scattering vector ~Q contribute to these terms. A sketchof the orientation of the SF and NSF components in the case of the guide field beingperpendicular to the scattering vector ~Q is shown in Fig. 3.5.By the choice of the scattering vector ~Q in respect to the guide field, i.e. parallel orperpendicular to each other, different magnetic components can be observed. In the caseof a perpendicular orientation, the NSF and SF scattering channels describe magneticmoments along and perpendicular to the guide field, respectively. For the NSF scatteringtwo cases have to be distinguished: If both NSF channels have identical intensity thematerial can be in an antiferromagnetic or paramagnetic phase as well as have no magneticcontribution at all, i.e. the intensities are of pure nuclear origin. A difference of both NSFchannels, on the other hand, can be attributed to a nonzero net magnetic moment alongthe guide field direction. Such a resulting magnetic moment can be due to a FM orderor a non-collinear structure with a non-zero net moment. Intensity in the SF channels,on the other hand, can be only of magnetic origin. It should be noted that in case of aperpendicular orientation of the scattering vector ~Q in respect to the guide field or thequantization axis z, respectively, the vector is parallel to the x- or y-axis. Consideringequation 3.43 and taking into account that only contributions of the magnetic momentsperpendicular to the scattering vector can be observed, it can be concluded that only one

3. Scattering Theory 21
Figure 3.4.: Magnetic scattering process from a sample. For more details see the text.
Figure 3.5.: Orientation of the SF and NSF components for the polarized neutron diffrac-tion. On the left side the orientation for the scattering vector ~Q being alongthe out-of-plane direction and on the right side the geometry for ~Q orientedin the in-plane direction.
component ~M⊥x or ~M⊥y contributes to the scattering amplitude A( ~Q). Consequently theintensity I( ~Q) of both SF (+-) and (-+) channel is always the same.In the case of a parallel orientation of the guide field and the scattering vector the SFchannel describe again magnetic moments perpendicular to the guide field. The NSFchannels, on the other hand, would be sensitive to magnetic moments along the guidefield but since the scattering vector is parallel to the guide field and magnetic momentsalong ~Q are not observable their intensities are only of pure nuclear origin. It should benoted that in the case of the parallel orientation of the guide field (quantization axis z)and the scattering vector magnetic moments along the x- and y-axis can be observed inthe SF scattering. Taking both components ~M⊥x and ~M⊥y into account that contributeto the scattering amplitude it can be concluded that in contrast to the previous case anintensity difference between both SF channels is possible. Such an effect is observable inhelical materials with different number of left and right turning spirals.
4. Experimental Methods and
Instrumentation
In this chapter the experimental set-ups and instruments are described that have beenused to grow, characterize and analyze the Fe50Pt50−xRhx films. Additionally a summaryof the data treatment is presented that was used for the data analysis.
4.1. Sample Preparation
All the samples of this work were grown by the group of Gary J. Mankey in the sputteringchamber ADAM at the MINT center at the University of Alabama. In this work a briefdescription of the sputtering chamber ADAM is given. A detailed description can befound in the PhD-thesis of P. Mani [76].A sketch of a typical sputtering chamber is shown in Fig. 4.1. A voltage of about 500V isapplied between the target and the sample yielding a potential difference. Here, the targetacts as the cathode while the substrate is the anode. The potential difference ionizes theAr gas which works as the working gas. The Ar+ ions and the electrons form togethera plasma. An additional applied external magnetic field bunches the Ar+ ions near thetarget surface which increases the plasma density and enables a high sputtering rate. TheAr+ ions lose their energy by collisions with the target which lead to ejections of targetatoms. These target atoms form finally the film on the substrate. Depending on severalparameters, e.g. sample temperature, applied voltage, etc., two principle growth modesare possible. There is, on the one hand, the layer by layer growth, where the next layerbegins to grow when the previous layer is completed. On the other hand, the atoms canconglomerate at certain positions at the sample and form island like structures which iscalled island growth. Often not optimized growth conditions lead to intermixtures of bothgrowth processes.An important factor in neutron scattering is the signal to noise ratio since only a sufficienthigh ratio allows an appropriate investigation of the condensed matter. For an increaseof this ratio one can try to optimize the amount of scatterer available in the samplewhich leads to a higher scattered intensity. The amount of scatterer in thin films isstrongly reduced compared to bulk systems. In order to compensate the reduction of thescatterers one can increase the sample size. To achieve large sample sizes of good qualitythe layer by layer growth was used in this work which provides large sample sizes of upto 2.5 cm×2.5 cm with homogeneously distributed films.
4.2. X-ray Instruments
The X-ray measurements were performed at the X-ray diffractometer RöDi at Helmholtz-Zentrum Geesthacht (HZG) the former GKSS using a Cu target. To produce X-rayselectrons are accelerated by a high voltage onto the Cu target. Then these electrons are

4. Experimental Methods and Instrumentation 23
Figure 4.1.: Sputtering process (adapted from [77])
slowed down by collision with the Cu target. The radiation generated by this decelerationis called Bremsstrahlung and gives a continuous X-ray spectrum. If the electrons hitthe Cu target with a sufficient energy, they can knock out an electron out of an innershell of the Cu target and the vacancy is filled again by electrons from higher energystates of the atom. By this recombination X-rays characteristic of the target materialare generated which in general are more intense by several order of magnitudes as thecontinuous Bremsstrahlung. For the Cu target used at RöDi the main contribution of thecharacteristic spectra are the CuKα1, CuKα2 and CuKβ radiation. A Ni-filter with a K-absorption-edge at about λ = 1.488Å is used to absorb higher X-ray energies, particularthe CuKβ (λ = 1.392Å) radiation. The CuKα1 (λ = 1.54059Å) and CuKα2 (λ =1.54441Å), on the other hand, are almost unhindered emitted. A splitting in the spectrumof diffraction scans for in Q sharp defined peaks is due to the slightly different wavelengthsof the CuKα1 and CuKα2 radiation. The X-ray beam is then parallelized by a Göbelmirror [78] which leads to a significant gain of intensity at the sample position. Anotherfeature of the Göbel mirror is an additional suppression of the CuKβ radiation as well asthe Bremsstrahlung while the reflectivity of the CuKα1, CuKα2 radiation is still about70%-90%.The size of the emitted X-ray beam used in the experiment is defined by slits in front andbehind the sample. The beam and sample size is important for geometrical correctionsof the experimental data. The data treatment of the X-ray and neutron data will bedescribed in more detail in section 4.5.

24 4.3. MOKE Instruments and Technique
4.3. MOKE Instruments and Technique
The magneto optic Kerr effect (MOKE) measurements were carried out at the Universityof Hamburg. The MOKE instrument is a static ellipsometer using a helium-neon-laserwhich has a wavelength of 632.8 nm by a power of 5mW and provides linear polarizedlight in a ratio of 500:1. For a higher polarization rate a Glan-Thompson prism is installedinto the beam which has a cancellation factor of smaller than 10−7. The polarized beamis reflected from the sample at an angle of 45 with the sample itself mounted betweenthe pole shoes of an electromagnet (see Fig. 4.2). The pole shoes have a distance of 3 cmwhich allow one to apply magnetic fields of up to 1T at the sample position. The actualvalue of the magnetic field is measured by a Hall-sensor that is mounted on one of the poleshoes. For the detection of the reflected light a combination of a second Glan-Thompsonprism and a phototransistor with an amplifier is used. For a high intensity a focusing lensis installed in front of the phototransistor. An additional optical filter helps to minimizethe influence of the environmental light.The set-up of the MOKE instrument allows measurements of the polar and the longitu-dinal Kerr effect. In the polar mode the sample surface is mounted perpendicular to theapplied magnetic field and a λ/4-plate is used to measure the ellipticity. The λ/4-platetransforms longitudinal polarized light into circular or elliptical polarized light and viceversa. This effect is, here, used to measure the ellipticity of the light: the larger theellipticity the higher the transmission and consequently the measured intensity. In thelongitudinal set-up the sample surface is orientated parallel to the magnetic field and themeasurements are carried out without the λ/4-plate.The MOKE measurements make use of the effect that the polarization vector of linearpolarized light rotates about the so-called Kerr rotation angle θ when it is reflected froma magnetized material. Additionally the polarization state changes from linear to elliptic.The degree of the ellipticity is given by the Kerr ellipticity ǫ. These two effects can beexplained in the following way: Linear polarized light is a superposition of left and rightcircular polarized light in-phase with identical amplitudes. In case of a magnetic materialthe refraction indices of left and right circular light are different which leads during ascattering process to a phase shift between them and a rotation of the resulting polar-ization vector of about θ. Additionally they have different absorption coefficients andconsequently the amplitudes of both reflected waves are different. This so-called mag-netic circular dichroism leads to an elliptic polarization of the light [79]. Since the Kerrrotation as well as the Kerr ellipticity are proportional to the magnetization of the sam-ple it is possible to measure hysteresis loops by determining the rotation and ellipticity,respectively, as a function of the applied magnetic field. By the use of the longitudinaland the polar Kerr effect, the resulting in-plane and perpendicular magnetization can bemeasured, respectively. The geometry for both cases is shown in Fig. 4.3.It is important to note that in the signal of the longitudinal Kerr effect still a contributionof the polar Kerr effect can be embedded. To correct the data from this contribution it isnecessary to measure additionally the longitudinal Kerr effect with the inverse light path.If both data sets are added up the polar Kerr effect should cancel out since it possessesthe opposite sign in both configurations. More detailed information about the Kerr effectand the experimental set-up can be found in the PhD-thesis of H. Stillrich [80].

4. Experimental Methods and Instrumentation 25
Figure 4.2.: MOKE set-up in the longitudinal mode. For more details see the text.
Figure 4.3.: Geometries of the polar and longitudinal Kerr effect.
26 4.4. Neutron Instruments
4.4. Neutron Instruments
The neutron diffraction measurements were performed at four different instruments. Theunpolarized measurements were carried out at POLDI at the HZG and D23 at the ILL.The cold triple axis machine IN12 at ILL was used for both unpolarized and polarizedmeasurements with polarization analysis. At the thermal three axis spectrometer IN3at the ILL additional polarized measurements with polarization analysis were performed.The main parameters of these instruments are listed in table 4.1 at the end of this section.
POLDI
The two axis diffractometer POLDI sketched in Fig. 4.4 was located at the end of thecurved neutron guide 7 at the 5MW research reactor in Geesthacht (FRG-1). The in-strument was operated in general in two different modes: The time-of-flight (TOF) modeby taking advantage of the white beam provided from the thermal neutron guide andselecting the wavelength by a chopper and the diffraction mode. The latter mode wasexclusively used in this work and will be explained here in more detail.In the diffraction mode the instrument was operated monochromatically, i.e. only a cer-tain neutron wavelength is used for the experiments. Therefore the neutrons producedby the reactor with a broad wavelength spectrum have to be monochromatized. A firstfiltering is provided by the curved Ni coated neutron guide 7. The Ni coated guide permitunder certain conditions the total reflection of the neutrons. A simplified rule for the totalreflection is: wavelength[Å] × 0.1. These conditions are easily fulfilled by thermal andcold neutrons which are reflected by the guide of an angle of about 1, while for neutronsin the hot or epithermal regime the angles of total reflection are much smaller 0.01 and0.05, respectively, and thus the probability of total reflection is much smaller. Thereforethe guides act as a kind of low pass filter for the wavelength distribution. The filteringeffect becomes more effective in the case of a curved neutron guide. More details to thecurved guide can be found in reference [81].The final wavelength in the diffraction mode is selected by a pyrolytic graphite PG (002)monochromator with a lattice spacing of dhkl = 3.55Å, making use of Bragg’s law:λ = 2dhkl sin θ. The wavelength can be chosen by the angle θ of the monochromatorto the incident neutron beam. At POLDI the wavelength can be set between 1Å and3.6Å. In the work presented here the wavelength was fixed at λ = 1.8Å. It is importantto note that a crystal monochromator not only allows the primary wavelength λ to bereflected but also higher orders in energy (e.g. λ/2). These higher orders contribute tothe background or result in unwanted reflections. For a wavelength of 1.8Å the λ/2 con-tamination is about 8%.For the suppression of these higher orders a velocity selector was used which allows onlya certain wavelength spectrum to pass. The wavelength can be chosen by the rotationvelocity of its curved lamellas. Too slow or too fast neutrons hit the lamellas which arecoated with neutron absorbing material 10B. More details to the higher order suppres-sion via velocity selectors can be found in the article of Wagner [82]. In the experimentspresented here the velocity was set to 20833 rpm which is equivalent to a wavelength of1.9Å. The selector has a resolution of λ
∆λ≈ 10% which means that also other wavelength
are transmitted through the selector. The wavelength offset of the selector reduces theflux intensity of the desired wavelength of 1.8Å but the advantage is that at the sametime the flux ratio of λ to λ/2 is significant increased compared to the set-up without thewavelength offset (see Fig. 4.5). In this set-up the suppression of the λ/2-contamination

4. Experimental Methods and Instrumentation 27
chopper
velocity-selector
beamstop
pencil-counter
slit 2
slit 1
mono-chromator
monitor
collimation
collimation
Neutrons
Figure 4.4.: Schematic top view of the diffractometer POLDI at HZG. The grey markedsection represents the shielding of the instrument. For more details see text.
is larger than 104.Furthermore the beam can be collimated by different collimators. The collimators con-sists of several absorber foils coated with neutron absorbing material Be or Gd with alength l mounted parallelly in a distance of d allowing only neutrons to pass through witha divergence smaller than 2 arctan d
l. In this work a collimator with a value of 30’ and 60’
were used in front and behind the sample (see sketch Fig. 4.4). Additionally Cd-slits canbe used to define the neutron beam on the sample position and on the detector, respec-tively, and to reduce the background noise. 3He filled pencil counters were used for themonitoring and detection of the beam. Since the task of the monitor is only to monitorthe incident beam intensity without cutting too much off, its probability of detection ishighly reduced (efficiency 1%) compared to the 3He counter of the detector (efficiencyclose to 100%).For the neutron diffraction experiments at POLDI a closed cycle refrigerator with a tem-perature range from 10K up to 325K and a cryofurnace with a temperature range between4K up to 475K was used.
D23
The instrument D23 is like POLDI a two axis diffractometer. It is installed at the thermalneutron guide H25 at the 58MW reactor at the ILL. A curved neutron guide prevents thecontamination of the fast neutrons. The diffractometer has the capability to be set-upwith two monochromators a vertical focusing PG (002) and a Heusler (111) for polarizedmeasurements as it is shown in Fig 4.6. In this work only unpolarized neutrons were usedfor the measurements and therefore the second monochromator was not installed. Thewavelength for the experiments was generally set to about 2.38Å. In contrast to POLDIthe λ/2-contamination was suppressed here by a graphite-filter which is orientated in sucha way that only the wavelengths of higher order satisfy the conditions of the Bragg law.These higher order wavelengths are then scattered out of the beam while the designatedwavelength is transmitted through the filter. The efficiency of the filter depends herestrongly on the wavelength, i.e. for a wavelength of λ = 2.384Å the λ/2-contaminationis less than 0.1%.

28 4.4. Neutron Instruments
Figure 4.5.: Schematic sketch of the effect of the wavelength offset for the velocity selector.The black and blue lines are the intensity distributions behind the selectorwithout and with the wavelength offset.
Another difference to the set-up of POLDI is that the goniometer at the sample positionhas no cradle. To compensate for it, the gas filled 3He detector can be lifted in a rangebetween -28<ν<29. For the measurements presented in this work different sampleenvironments were used like orange cryostats (1.5K - 300K), cryofurnaces (1.5K - 500K)and cryomagnets (1.5K - 300K, up to 12T). Details to the sample environment can befound at reference [83].D23 was used in addition to POLDI to perform the temperature dependent measurementswith and without field. The advantages of D23 compared to POLDI are a higher neutronflux and the various sample environments which were available at the ILL, in particularthe high magnetic field cryomagnets.
IN12
In contrast to the other two instruments IN12 is a three-axis spectrometer. It is located atthe cold double curved neutron guide H142 at the ILL. By the use of a double curved guidethe suppression of fast neutrons is higher compared to a single curved guide. The verticalfocusing PG (002) monochromator allows to select wavelengths between 2.3Å and 6Å.For wavelength larger than 4Å, the λ/2-contamination becomes significant and needs tobe suppressed by a Beryllium-filter. The suppression by the Be-filter bases again on theBragg law taking advantage of the effect that the filter becomes transparent for neutronsabove a certain wavelength. The higher order wavelength (e.g. λ/2) are now scatteredby the polycrystalline Beryllium while the designated wavelength are transmitted almostunopposed. The monochromatized neutron beam can be defined by different collimationsin front and behind the sample.An obvious difference to the two axis machines is the additional axis of the three axisspectrometer with the analyzer (see Fig 4.7). The additional axis allows in particularenergy dispersive measurements. In this work, however, we focus only on elastic measure-ments. The advantage of the analyzer allows one to select only elastic scattered neutronswhich fulfill the Bragg conditions of the analyzer. Neutrons that are scattered inelasticfrom the sample change their energy and associated with this their wavelength and arenot scattered from the analyzer to the detector. It should be noted that for the two axis
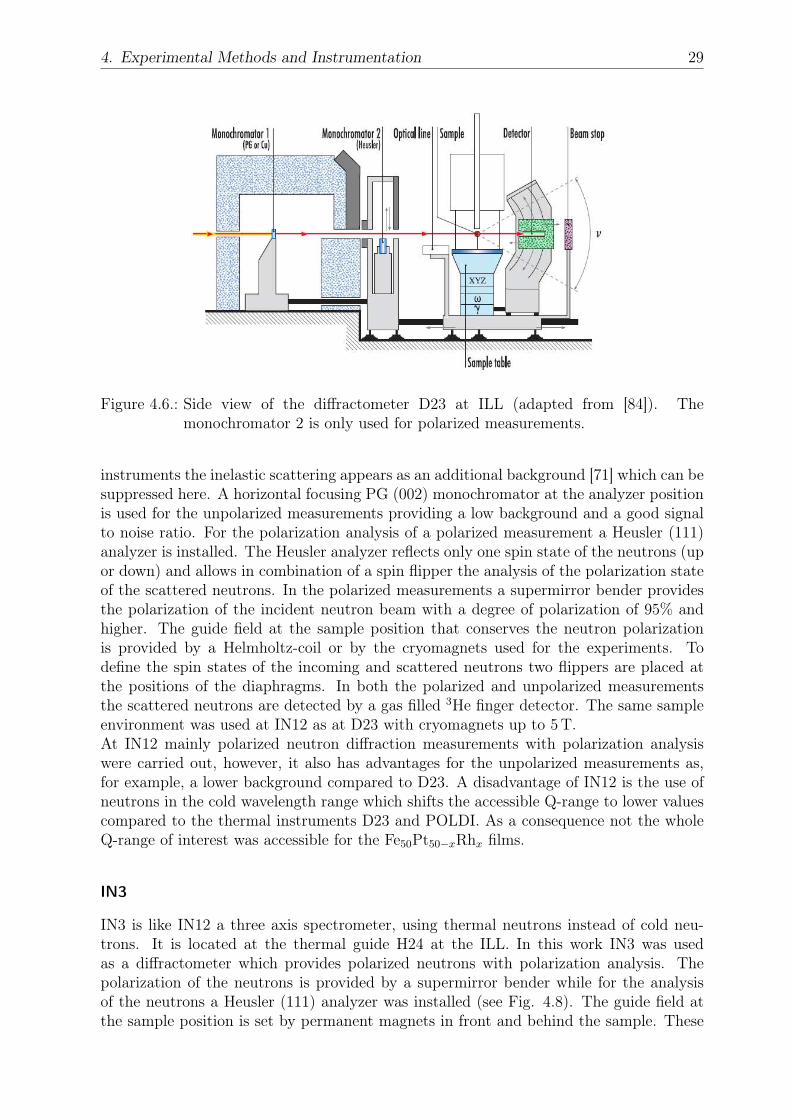
4. Experimental Methods and Instrumentation 29
Figure 4.6.: Side view of the diffractometer D23 at ILL (adapted from [84]). Themonochromator 2 is only used for polarized measurements.
instruments the inelastic scattering appears as an additional background [71] which can besuppressed here. A horizontal focusing PG (002) monochromator at the analyzer positionis used for the unpolarized measurements providing a low background and a good signalto noise ratio. For the polarization analysis of a polarized measurement a Heusler (111)analyzer is installed. The Heusler analyzer reflects only one spin state of the neutrons (upor down) and allows in combination of a spin flipper the analysis of the polarization stateof the scattered neutrons. In the polarized measurements a supermirror bender providesthe polarization of the incident neutron beam with a degree of polarization of 95% andhigher. The guide field at the sample position that conserves the neutron polarizationis provided by a Helmholtz-coil or by the cryomagnets used for the experiments. Todefine the spin states of the incoming and scattered neutrons two flippers are placed atthe positions of the diaphragms. In both the polarized and unpolarized measurementsthe scattered neutrons are detected by a gas filled 3He finger detector. The same sampleenvironment was used at IN12 as at D23 with cryomagnets up to 5 T.At IN12 mainly polarized neutron diffraction measurements with polarization analysiswere carried out, however, it also has advantages for the unpolarized measurements as,for example, a lower background compared to D23. A disadvantage of IN12 is the use ofneutrons in the cold wavelength range which shifts the accessible Q-range to lower valuescompared to the thermal instruments D23 and POLDI. As a consequence not the wholeQ-range of interest was accessible for the Fe50Pt50−xRhx films.
IN3
IN3 is like IN12 a three axis spectrometer, using thermal neutrons instead of cold neu-trons. It is located at the thermal guide H24 at the ILL. In this work IN3 was usedas a diffractometer which provides polarized neutrons with polarization analysis. Thepolarization of the neutrons is provided by a supermirror bender while for the analysisof the neutrons a Heusler (111) analyzer was installed (see Fig. 4.8). The guide field atthe sample position is set by permanent magnets in front and behind the sample. These
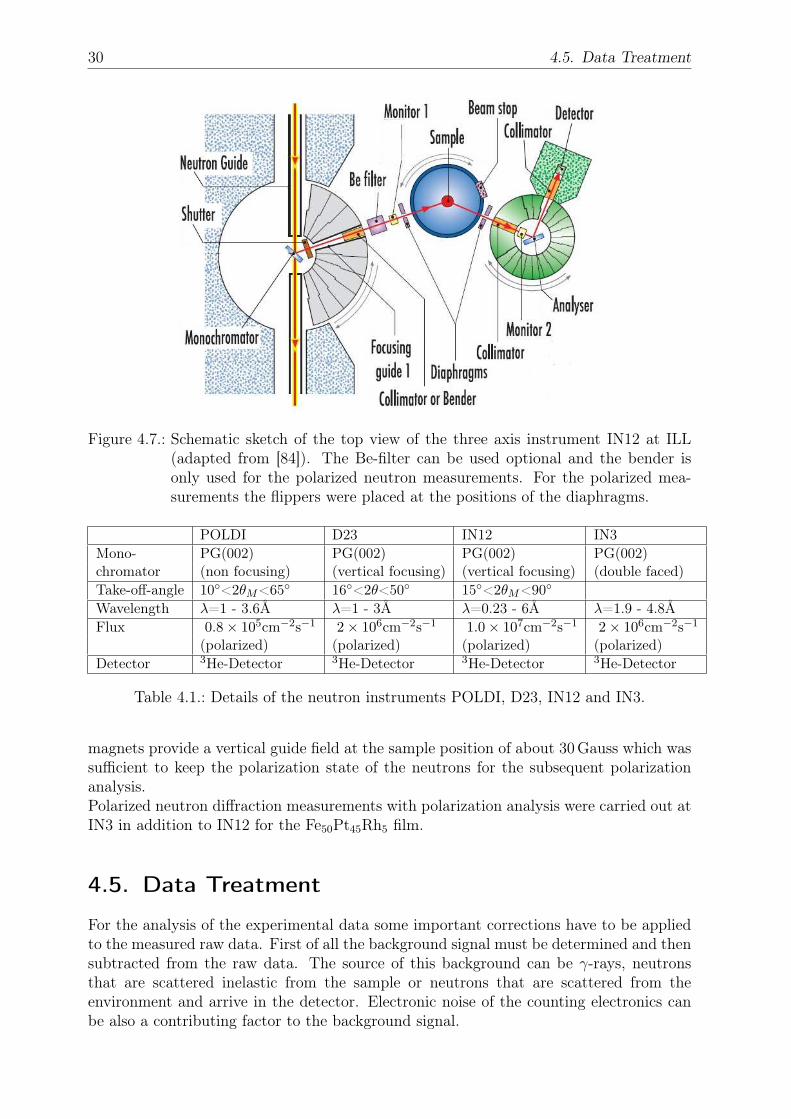
30 4.5. Data Treatment
Figure 4.7.: Schematic sketch of the top view of the three axis instrument IN12 at ILL(adapted from [84]). The Be-filter can be used optional and the bender isonly used for the polarized neutron measurements. For the polarized mea-surements the flippers were placed at the positions of the diaphragms.
POLDI D23 IN12 IN3Mono- PG(002) PG(002) PG(002) PG(002)chromator (non focusing) (vertical focusing) (vertical focusing) (double faced)Take-off-angle 10<2θM<65 16<2θ<50 15<2θM<90
Wavelength λ=1 - 3.6Å λ=1 - 3Å λ=0.23 - 6Å λ=1.9 - 4.8ÅFlux 0.8× 105cm−2s−1 2× 106cm−2s−1 1.0× 107cm−2s−1 2× 106cm−2s−1
(polarized) (polarized) (polarized) (polarized)Detector 3He-Detector 3He-Detector 3He-Detector 3He-Detector
Table 4.1.: Details of the neutron instruments POLDI, D23, IN12 and IN3.
magnets provide a vertical guide field at the sample position of about 30Gauss which wassufficient to keep the polarization state of the neutrons for the subsequent polarizationanalysis.Polarized neutron diffraction measurements with polarization analysis were carried out atIN3 in addition to IN12 for the Fe50Pt45Rh5 film.
4.5. Data Treatment
For the analysis of the experimental data some important corrections have to be appliedto the measured raw data. First of all the background signal must be determined and thensubtracted from the raw data. The source of this background can be γ-rays, neutronsthat are scattered inelastic from the sample or neutrons that are scattered from theenvironment and arrive in the detector. Electronic noise of the counting electronics canbe also a contributing factor to the background signal.

4. Experimental Methods and Instrumentation 31
Figure 4.8.: Top view on the thermal three axis instrument IN3 at ILL (adapted from[84]). For the polarized measurements the collimations are replaced by guidefields. The flippers are placed at the positions of the diaphragms.
illumination effects
The measured intensity of the scattered beam needs to be corrected for the geometryof the experiment. The corrections mainly depend on the size of the sample and thewidth of the incident beam. One of these is the so-called foot print correction. At smallangles of the incoming beam in respect to the sample surface only a part of the full beamcontributes to the scattering process. Here, the detected intensity has to be accordinglycorrected. In the simple case of a cubic or rectangular shaped sample illuminated by aparallel beam which is defined by a slit of the width W a footprint of the length L can beexpected:
sin θ =W
L(4.1)
The critical angle θc, where the footprint of the beam is the same as the sample widthW, is defined by:
sin θc =W
l, (4.2)
where l is the width of the sample. The fraction of the beam that illuminates the samplebelow θc is then given as follows:
l
L=
sin θ
sin θc. (4.3)
In order to correct the measurements, the data below θc have to be divided by equation4.3. The second effect takes the material into account that contributes as a scatterer.The more scatterers are involved in the scattering process the higher the intensity of themeasured peaks. Above the critical angle θc only a part of the scatterers are illuminatedby the neutron beam and thus contribute to the scattering process depending on thesample rotation. Therefore the data above θc has to be multiplied by the equation 4.3.Here, it should be noted that for the simplest case of a rectangular sample and a 90

32 4.5. Data Treatment
Figure 4.9.: Normalized Q-dependence of the magnetic form factor of Fe.
orientation to the sample holder only one correction is necessary, since the one is alreadyincluded in the other one. Only for complicated sample shapes and orientations bothcorrections need to be considered at the same time.
magnetic form factor
As already discussed in the previous chapter the magnetic scattering length p is Q-dependent. This dependence is taken into account by the magnetic form factor f( ~Q)(see Fig. 4.9). An approximation for small Q is given by:
f( ~Q) = (L+ 2S) 〈j0(q)〉+ L 〈j2(q)〉 , (4.4)
where 〈j0(s)〉 is given by 〈j0(s)〉 = Ae−as2 +Be−bs2 +Ce−cs2 +D and 〈j2(s)〉 is defined as〈j2(s)〉 = (Ae−as2 + Be−bs2 + Ce−cs2 + D)s2 with s = sin θ/λ. Since the orbital and thespin magnetic moment L and S as well as the prefactors (A to D) and the exponents (ato c) are unknown at the present stage for the different Fe50Pt50−xRhx films, the valuesare approximated by assuming that they differ not significantly from the values of α-Fe.A detailed explanation of the calculation and values for the prefactors can be found inreference [85]. For the magnetic moment the values S = 2.23 and L = 0.043 were used[86].
polarization state
In the case of measurements with polarized neutrons the data have to be corrected forthe polarization of the incident neutrons. The polarization of the neutrons is in generalless than 100% due to imperfection of the polarizer and the flippers. In particular, in apolarized neutron beam with predominant spin up neutrons also some neutrons with spindown are present. In the case of pure NSF scattering the neutrons with the opposite spinwill be detected in the SF channel instead of the NSF channel and vice versa. A figureof merit is the NSF to SF scattering ratio, which is called flipping ratio. In general this

4. Experimental Methods and Instrumentation 33
ratio is determined from a non magnetic reflection:
R =INSF
ISF(4.5)
INSF and ISF denote the Intensity of the NSF and SF channels, respectively. To correctthe neutron data the Intensity of the NSF channel has to be divided by the flipping ratioR and the result has to be subtracted or added to the intensity of the SF or NSF channel,respectively.

5. Measurements and Results
The Fe50Pt50−xRhx films were grown by magnetron co-sputtering in an UHV chamberas described in the previous chapter. The chamber had a base pressure of less than1 × 10−8 mbar and was back filled with ultra pure Ar to a pressure of 4.5 × 10⁻⁵ mbar.As substrate a single crystal MgO (001) was used which was degassed at 700C for a fewhours before the deposition of the layers. To provide a good epitaxial growth a combina-tion of Cr followed by Pt was reported to be ideal to grow FePt layer with L10 structure[87]. Here, the thicknesses of the seed layers were chosen to be 3 nm and 12 nm for the Crand Pt layer, respectively. It proved to be a good choice for the growth of L10 structuredFe50Pt50−xRhx films. To prevent oxidation the films were capped by a 2 nm Pt layer. In afirst step four films of Fe50Pt50−xRhx were grown with different Rh concentrations of x=5,10, 17.5 and 25. The sputter rates of the individual Fe, Pt and Rh targets were calibratedby quartz crystal microbalance for each composition in such a way that the nominal thick-nesses of the films have a value of 200 nm. In a second step three Fe50Pt40Rh10 films withdifferent thicknesses of 100 nm, 300 nm and 500 nm were grown.The following sections are divided in two parts, investigating the influence of the Rh con-centration and of the thickness of the Fe50Pt50−xRhx layer on the structural and magneticproperties, respectively.
5.1. X-ray characterization
For the characterization of the structural properties of the samples X-ray diffraction mea-surements were carried out at the X-ray diffractometer RöDi at HZG (see chapter 4).The measurements provide information about the quality of the crystal structure and thechemical order. The latter one is a measure for the distribution of the Fe and Pt/Rhatoms in the crystal, e.g. the atoms can be distributed uniformly or occupy only certainsites in the crystal.
5.1.1. Composition
Figure 5.1 shows the X-ray diffraction scans for the 200 nm thick Fe50Pt50−xRhx films withdifferent Rh concentrations probing the sample along the growth direction (out-of-plane).Three peaks can be detected in the four films. In general the strongest peak correspondsto the (002) reflection of the MgO substrate at 2θ = 42.998. Since the films were alignedon the (002) reflection of the Fe50Pt50−xRhx films and thus slightly detuned in respect tothe optimum alignment on the MgO substrate the intensity of the sharp MgO reflectionsis decreased as it can be seen in particular for the Fe50Pt25Rh25 film. The two remainingpeaks are due to the (001) and (002) Bragg reflections of the deposited Fe50Pt50−xRhx
film. The position of these peaks shifts with lower Rh concentration to higher 2θ values,e.g. for x=5 the (002) reflection can be found at 2θ = 48.938 while for x=25 the peakshifts to an angle of 2θ = 51.444. The shifts indicate a lattice expansion perpendicularto the sample plane (c-direction) with decreasing Rh content as expected considering the
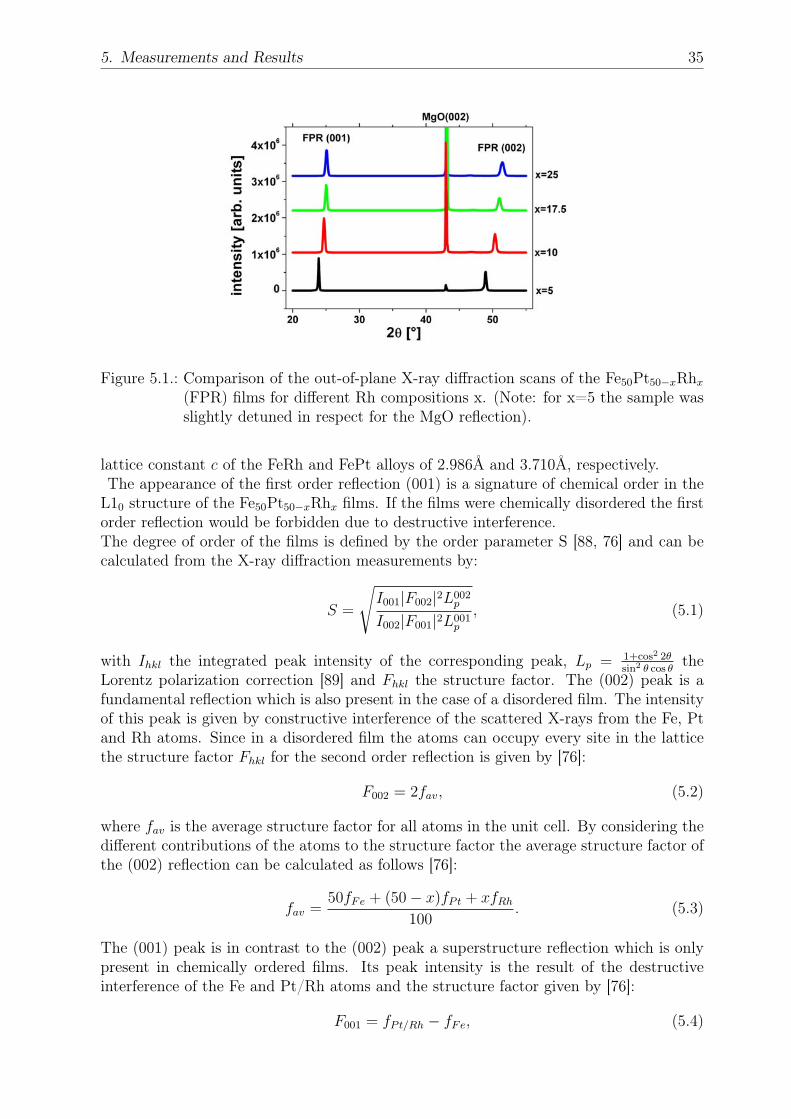
5. Measurements and Results 35
Figure 5.1.: Comparison of the out-of-plane X-ray diffraction scans of the Fe50Pt50−xRhx
(FPR) films for different Rh compositions x. (Note: for x=5 the sample wasslightly detuned in respect for the MgO reflection).
lattice constant c of the FeRh and FePt alloys of 2.986Å and 3.710Å, respectively.The appearance of the first order reflection (001) is a signature of chemical order in the
L10 structure of the Fe50Pt50−xRhx films. If the films were chemically disordered the firstorder reflection would be forbidden due to destructive interference.The degree of order of the films is defined by the order parameter S [88, 76] and can becalculated from the X-ray diffraction measurements by:
S =
√I001|F002|2L002
p
I002|F001|2L001p
, (5.1)
with Ihkl the integrated peak intensity of the corresponding peak, Lp = 1+cos2 2θsin2 θ cos θ
theLorentz polarization correction [89] and Fhkl the structure factor. The (002) peak is afundamental reflection which is also present in the case of a disordered film. The intensityof this peak is given by constructive interference of the scattered X-rays from the Fe, Ptand Rh atoms. Since in a disordered film the atoms can occupy every site in the latticethe structure factor Fhkl for the second order reflection is given by [76]:
F002 = 2fav, (5.2)
where fav is the average structure factor for all atoms in the unit cell. By considering thedifferent contributions of the atoms to the structure factor the average structure factor ofthe (002) reflection can be calculated as follows [76]:
fav =50fFe + (50− x)fPt + xfRh
100. (5.3)
The (001) peak is in contrast to the (002) peak a superstructure reflection which is onlypresent in chemically ordered films. Its peak intensity is the result of the destructiveinterference of the Fe and Pt/Rh atoms and the structure factor given by [76]:
F001 = fPt/Rh − fFe, (5.4)

36 5.1. X-ray characterization
x=5 x=10 x=17.5 x=25FWHM[] 0.66 0.65 0.7 0.52S 0.79 0.91 0.93 0.92L[Å] 390 266 249 219
Table 5.1.: Parameters of the X-ray diffraction scans for the composition dependence.The FWHM of the rocking scan of the (001) reflections, the order parameterS and the coherence length L. The coherence length was obtained from theFWHM of the radial diffraction scans as an average of the first and secondorder reflections of the films (see equation 3.24).
where fPt/Rh is the weighted average structure factor for the Pt and Rh atoms. It isimportant to note that in the chemically ordered films the Fe and Pt/Rh atoms occupyonly certain sites in the lattice (see Fig. 5.7) but the distribution of the Pt and Rh atomson the Pt/Rh sites is unknown. Similar to equation 5.3 an average structure factor hasto be calculated taking the different contributions of the Pt and Rh atoms into account[76]:
fPt/Rh =(50− x)fPt + xfRh
50(5.5)
With these equations the order parameters for the different films can be determined.Besides the order parameter also the Full Width at Half Maximum (FWHM) of therocking scans can give information on the crystalline structure of the samples. As alreadydiscussed in the chapter 3 real crystals consist often of small crystallites which are tiltedto each other (mosaic spread) and the relative tilt of those crystallites can be determinedby the FWHM of the rocking scan. In the rocking scans 2θ is fixed to a certain valueand the sample is rotated in such a way that the angle of the incident beam is varied inrespect to the sample surface. Another indication of the quality of the structure is thecoherence length L which can be calculated from the FWHM of the radial measured Braggreflections and the Debye-Scherrer approximation (see equation 3.24). Here, the FWHMis used to determine the average crystallite size. These parameters are summarized intable 5.1.All films have an order parameter above S>0.79 which is relatively close to the perfect
order of S=1. The films with x≥10 even have an order parameter above S>0.9. Thesmall values of the FWHM (≤0.7) of the rocking scans around the (001) reflections (seeexemplarily the rocking scan for the Fe50Pt32.5Rh17.5 film in Fig. 5.2) and the coherencelengths of L>200Å (see table 5.2) indicate that the films possess a good crystallinity,even though they are not single crystals. In fact the FWHM of the rocking scans showthe presence of small crystallites in the sample which are slightly tilted to each other.Additional scans have been performed in the sample plane to investigate the orientation
of the film in respect to the MgO-substrate as well as the structure of the film itself.Therefore so-called phi-scans have been carried out around the (101) reflection of thefilms and the (202) peaks of the MgO substrates. In the phi-scans the detector is fixed toa certain 2θ value and the sample is rotated around the angle φ (see Fig. 5.3). To accessthe different peaks the samples have to be rotated about 52 for the film peaks and forthe MgO reflections at about 45 in ψ-direction (see Fig. 5.3). In case of the tetragonal

5. Measurements and Results 37
Figure 5.2.: Rocking scan of the (001) reflection of the Fe50Pt32.5Rh17.5 film.
Figure 5.3.: Orientation of the different sample directions and the orientation of the scat-tering plane (adapted from [76]).
lattice the angles ψ can be calculated by [64]:
cosψ =h1h2+k1k2
a2+ l1l2
c2
(h2
1+k2
1
a2+
l21
c2)1
2 (h2
2+k2
2
a2+ l2
c2)1
2
, (5.6)
the indices 1, 2 denote two scattering planes which include the angle ψ. Figure 5.4 showsexemplarily the phi-scan of the Fe50Pt25Rh25 film. Further phi-scans of the other Rhconcentrations show nearly identical pattern and are therefore not illustrated here. Fourpeaks of the film can be easily observed: the (101), (011), (101) and the (011) shiftedfrom the corresponding MgO reflections by ∆φ =45. Considering the crystallographicrelations between the film and the substrate this reveals a 45 shift of the (100)-vector ofthe film in respect to the (100)-vector of the substrate. Furthermore the appearance ofthe four in-plane film peaks is a clear evidence for the bct structure of the film. In a L10structure of the fct phase the (101), (011), (101) and the (011) reflection are forbiddendue to destructive interference. Additional in-plane phi-scans were measured around the

38 5.1. X-ray characterization
Figure 5.4.: Phi-scan at the (011) reflection of the Fe50Pt25Rh25 film (green color) and the(202) reflection of the MgO substrate (blue color). The peaks of the film are45 shifted in respect to the reflections of the MgO substrate.
(111)-reflection of the film with ψ=29 confirming the good crystalline structure of thefilm (see Fig. 5.5).
Besides the chemical order and crystallinity, the lattice constants can be determinedfrom the X-ray diffraction scans. The out-of-plane lattice parameter c can be calculatedfrom the Q-positions of the (002) or (001) reflections of the films, respectively, by usingequation 3.14. The determination of the in-plane lattice parameter a is slightly morecomplex since its calculation depends also on the lattice parameter c [90]:
1
d2hkl=h2 + k2
a2+l2
c2. (5.7)
This relation in combination with equation 3.14 can be used to determine the in-planelattice parameter from the Q-position of the (101) or (111) reflection of the film. Figure5.6 shows the lattice parameters a and c for the different Rh concentrations. It can beseen that c decreases with higher Rh content from 3.728Å for x=5 to 3.556Å for x=25.Contrary to that the in-plane lattice parameter a increases with higher Rh content from2.741Å for x=5 to 2.779Å for x=25. As a consequence of the increase and decrease ofthe lattice constants a and c, respectively, the c/a- ratio decreases with increasing Rhconcentration from 1.358 to 1.278. The decreasing and increasing of the lattice constantc and a with the Rh content indicates a lattice contraction in the out-of-plane directionand an expansion in the in-plane direction. The c/a-ratio of 1 < c/a <
√2, on the other
hand, shows that the bct structure is an intermediate structure between the bcc structureof FeRh (c/a = 1) and the disordered fcc structure of FePt (c/a =
√2). The ordered
fct structure of FePt, however, has a similar c/a∗-ratio of 1.363. It is important to notethat most materials with L10 structure have a fct phase [91] like the ordered FePt system.
To compare the c/a-ratio with a bct structure the relation a∗ =
√2a2
fct
2was used. The
corresponding lattice constants a and a∗ are shown in Fig. 5.7.The results from the X-ray diffraction measurements of the 200 nm thick films are similar

5. Measurements and Results 39
Figure 5.5.: Phi-scan of the (111) reflection from the Fe50Pt45Rh5 film. The sample isrotated of about 29 in ψ.
Figure 5.6.: a) Lattice parameter a and c as function of the Rh content x: The latticeconstants c were obtained as an average of the first and second order peakpositions while the lattice parameters a were determined from the average ofthe (011) and (111) peak positions in the X-ray diffraction scans. b) c/a-ratioas a function of the Rh composition. The solid symbols are the values for the200 nm film and the open symbols represent the values of the bulk system[17].

40 5.1. X-ray characterization
Figure 5.7.: Sketch of the L10 structure with the lattice constants abct for the bct latticeand afct for the fct lattice. Details to the lattice constant a∗ can be found inthe text.
to the one for the bulk Fe50Pt50−xRhx system [17]. Both systems have a bct structure andalso the lattice constants show a similar behavior. The only difference is that the valuesof the lattice constants a in the thin films are larger.
5.1.2. Film Thickness
The X-ray diffraction scans of the Fe50Pt40Rh10 films with different thicknesses are plottedin Fig. 5.8 showing the first (001) and the second (002) order reflections. Here the (002)reflections from the MgO substrates are absent which can be explained by the sharpnessof these peaks and the slightly more detuned alignment in respect to the MgO substrateas it was measured for the films in the previous section.The appearance of the first order reflections of the films indicate the well chemically or-dered L10 structure of the films as already discussed in the previous section.Table 5.2 summarizes the values of the order parameter, the coherence length and the
FWHM of the rocking scans. The order parameter S increases with decreasing samplethickness. While the 500 nm thick film has an order parameter of about S=0.79, it in-creases to S=0.91 for the thinnest film of 100 nm. It shows that the chemical order ofthese films is of the same quality as it was observed for the 200 nm thick films before. Thecrystalline quality is also reflected by the small FWHM of the rocking scans of the (001)reflections (FWHM≤ 1.3) as well as in the relative large coherence length of L>190Åwhich are again similar to the previous results on the concentration dependent films.As described above additional scans have been carried out along the in-plane direction
around the (011) and (111) reflections of the Fe50Pt40Rh10 films as well as around the(202) peak position of the MgO substrate. Similar to Fig. 5.4 and Fig. 5.5 for the 200 nmfilms all in-plane reflections of the films are shifted by 45 in respect to the reflectionsof the substrate. As pointed out before it is an evidence for the bct structure of theFe50Pt40Rh10 films.The X-ray diffraction measurements of the Fe50Pt40Rh10 films of the second series showedthat no structural changes occur if the sample thickness is varied in a range from 100 nmto 500 nm. Moreover, there is no indication of any significant changes of the lattice con-

5. Measurements and Results 41
Figure 5.8.: Comparison of the out-of-plane X-ray diffraction scans of the Fe50Pt40Rh10
(FPR) films for different sample thicknesses. The intensity of the 100nm filmwas multiplied by a factor of 5.
100 nm 300 nm 500 nmFWHM[] 1.33 0.69 0.66S 0.91 0.85 0.79L[Å] 190 307 277
Table 5.2.: Parameters of the X-ray diffraction scans for the Fe50Pt40Rh10 samples withdifferent thickness. The Full Width at Half Maximum (FWHM) of the rockingscan of the (001) reflections, the order parameter S and the coherence length L.The coherence length was obtained from the FWHM of the radial diffractionscans as an average of the first and second order reflections of the films.

42 5.2. Structure Factor Calculation
Figure 5.9.: a) Lattice parameter a and c as function of the sample thickness. The latticeparameters c were obtained as an average of the first and second order peakpositions while the lattice parameters a were determined from the average ofthe (011) and (111) peak positions in the X-ray diffraction scans. b) c/a-ratioas a function of the sample thickness.
stants. The decreases of both lattice parameters a and c are in the range of the error barsand can therefore be considered as quasi constant. As a consequence also the c/a-ratio(see Fig. 5.9 b) remains constant. These results show that the bct structure is still con-served if the sample thickness is varied in a range of at least up to 500 nm.
The X-ray diffraction measurements of both sample series with composition and thick-ness dependence confirm that the Fe50Pt50−xRhx samples have a L10 (bct) structure with[001]-orientation similar to the bulk alloys studied by Yuasa [17]. Furthermore the mea-surements show that the films are oriented in such a way that the (001), (111) and (110)reflections lie in a scattering plane. Figure 5.3 summarizes the orientation and the rela-tions between the different scattering planes.
5.2. Structure Factor Calculation
The presence or absence of certain reflections in the X-ray diffraction measurements allowto draw conclusions about the atomic structure of the Fe50Pt50−xRhx films by comparisonof the observed reflection intensities with structure factor calculations. In the previouschapter 3 it was shown that the structure factor is proportional to the measured scatteringintensity: I ∝ |F |2 (see equation 3.21). By using this relation information about intensityratios of different reflections can be obtained which can be used for example to determinethe degree of the chemical order (see equation 5.1). Besides the determination of thenuclear structure the structure factor calculations allow to distinguish between magneticand nuclear contributions to different reflections. Moreover, by comparing the structurefactor calculations, i.e. the calculated peak intensities, with the measured peak intensitiesof neutron diffraction experiments the order and orientation of the magnetic momentscan be determined in detail. In the following the calculation of the nuclear and magneticstructure factor used here will be outlined in more detail.The structure factor of the bct structure can be calculated by the use of the equations

5. Measurements and Results 43
Figure 5.10.: Magnetic unit cell of the bct structure. The right side shows the top viewon the bct structure. The Fe and Pt/Rh atoms in the ground and first levelhave different positions in z-direction as can be seen in the sketch on the leftside. For more details see the text.

44 5.2. Structure Factor Calculation
3.22-3.30. The calculation based on the configuration of the magnetic unit cell which isshown in fig. 5.10. Compared to the nuclear unit cell of the Fe50Pt50−xRhx alloy consistingof 1 Fe and 1 Pt atom the magnetic unit cell has to be extended to 8 Fe and 8 Pt/Rhatoms to describe the different possible magnetic orders, in particular AF order. Theright hand side of the figure shows a top view of the magnetic unit cell. The positions ofthe atoms is expressed by mi with i = x, y, z indicating the corresponding direction. Thedistance between two Fe atoms or two Pt/Rh atoms is mi = 1 while the distance betweena Fe and a Pt/Rh atom is defined as mi = 1/2. It is important to note that the definitionof the distance is valid for all h, k, l-directions. Furthermore the distance between theground level and the first level is also mi = 1. The origin of this coordinate system is setto the Fe atom on the ground level which is marked with mi = 0, i.e. mx = my = mz = 0.The structure factor for the magnetic unit cell can be now written as:
F ( ~Q) = Fn( ~Q) + Fmag( ~Q), (5.8)
with Fn( ~Q) =∑
i
bie2πi(hmx+kmy+lmz) (5.9)
Fmag( ~Q) =∑
i
(±)pie2πi(hmx+kmy+lmz). (5.10)
For the discussion the structure factor will be separated in the magnetic and the nuclearpart. The nuclear structure factor can be further separated in a structure factor part forthe Fe atoms and the Pt/Rh atoms, respectively:
Fn( ~Q) = FFe( ~Q) + FPt/Rh( ~Q) =∑
xyz
bFee2πi(hmx+kmy+lmz) +
∑
xyz
bPt/Rhe2πi(hmx+kmy+lmz),
(5.11)where bFe and bPt/Rh are the scattering lengths of the Fe and the Pt/Rh atoms, respec-tively. From the X-ray data it is known that the Fe50Pt50−xRhx films are well ordered,i.e. the Fe and Pt/Rh atoms only occupy certain sites in the crystal. Since the distribu-tion of the Pt/Rh atoms is assumed to be random, an average scattering length will beconsidered (see section 5.1):
bPt/Rh =(50− x)bPt + xbRh
50, (5.12)
with x denoting the amount of Rh and bPt and bRh are the scattering length of Rh andPt, respectively. By considering all atoms in the unit cell three cases can be distinguishedfor the nuclear structure factor:
F nuchkl =
8(bFe + bPt−Rh) for h+ k + l = even8(bFe − bPt−Rh) for h+ k + l = odd0 for h+ k + l = n
2
, (5.13)
where n denotes odd numbers.In the case of neutron scattering the values for the scattering length of Fe is 9.45 fm, forPt 9.6 fm and for Rh 5.88 fm, resulting in the structure factors given in table 5.3. Asalready mentioned the measured scattering intensity is proportional to the square of thestructure factor I ∝ |F |2. Considering the given unit cell the following conclusions can bederived from the structure factor calculations for a neutron diffraction experiment: Thesecond order reflections (002) and (200) have a strong nuclear contribution while it will

5. Measurements and Results 45
x=5 x=10 x=17.5 x=25h+k+l=even 18.678 18.306 17.748 17.19h+k+l=odd 0.222 0.594 1.125 1.71
Table 5.3.: Nuclear structure factors Fhkl for different Fe50Pt50−xRhx compositions in fmunits.
be reduced for the first order reflections (001), (100) and (111) due to the different signfor the Fe and Pt/Rh atoms in the structure factor terms, respectively. Furthermore itcan be expected that with higher Rh concentration the scattering intensity or the nuclearcontribution to the scattering intensity, respectively, of the second order peaks decreaseswhile it increases for the first order reflections.In the next step the magnetic structure factor will be calculated. The structure factor
can be again separated in the contributions of the Fe and the Pt/Rh atoms, respectively:
Fmag( ~Q) = FmagFe ( ~Q) + Fmag
Pt/Rh(~Q)
=∑
xyz
(±)pFee2πi(hmx+kmy+lmz) +
∑
xyz
(±)pPt/Rhe2πi(hmx+kmy+lmz), (5.14)
where pFe and pPt/Rh denote the magnetic scattering length of Fe and Pt/Rh, respectively.The sign (±) taking into account neighboring magnetic moments being antiferromagnet-ically or ferromagnetically ordered.For the magnetic structure factor two principle cases will be considered, an AF and a FMordered Fe50Pt50−xRhx film. In the AF case three solutions for the magnetic scatteringlength are possible:
Fmaghkl =
0 for h+ k + l = even0 for h+ k + l = odd8(pFe + pPt−Rh) for h+ k + l = n
2
(5.15)
In case of a FM order the relative spin direction of the neutrons to the magnetic momentsof the sample has to be considered: In the case of the parallel orientation of the neutronspin to the magnetic moments of the sample the structure factors are given by:
Fmaghklp
=
8(pFe + pPt−Rh) for h+ k + l = even8(pFe − pPt−Rh) for h+ k + l = odd0 for h+ k + l = n
2
(5.16)
In the case of an antiparallel orientation of the neutron to the magnetic moments of thesystem the structure factors are given by:
Fmaghkla
=
−8(pFe + pPt−Rh) for h+ k + l = even−8(pFe − pPt−Rh) for h+ k + l = odd0 for h+ k + l = n
2
(5.17)
The measured peak intensity for the unpolarized neutrons is then given by the sum ofboth contributions: 1
2F 2hklp
+ 12F 2hkla
. It is important to note that in the FM as well asin the AF case an order of the magnetic moments perpendicular to the scattering vector~Q is assumed. If the magnetic moments are not completely aligned perpendicular to ~Q,the intensity from the magnetic scattering decreases and the angle of the magnetic mo-ments with respect to ~Q has to be considered (see section 5.5). Furthermore, the presence

46 5.3. MOKE
or absence of the different reflections depends on the exact alignment of the magneticmoments, e.g. in the bct structure AF configurations are possible with the magnetic mo-ments oriented perpendicular to the scattering vector ~Q of the (1
200) reflection which do
not contribute to its intensity due to destructive interference.
Since the intensity in the neutron diffraction measurements is proportional to the squareof the structure factor and by considering both contributions, the nuclear and magneticstructure factor, the following conclusion can be drawn: The first and second order re-flections contain besides the nuclear contribution also a magnetic contribution from a FMorder if present. Moreover, the equations 5.13, 5.16 and 5.17 show clearly, that in the caseof FM order the ratio between the magnetic and the nuclear contribution is much largerfor the first order than for the second order peak intensity and easier to be observed.Therefore the first order Bragg reflections will be the prime candidates to study the FMorder in the samples. Half order reflections, on the other hand, are only present if an AForder exists.
5.3. MOKE
The MOKE measurements in this section were carried out at the University of Hamburg(see chapter 4). These measurements provide information about macroscopic magneticproperties, e.g. the magnetic anisotropy of the films. From the shape of the hysteresisloops also first indications of the microscopic magnetic spin structure can be obtainedsince the microscopic spin structure influences the magnetization reversal process.However, it should be noted that the penetration depths of the laser light (λ=632.8 nm)is only about 20 nm [92, 93]. Therefore the observed behaviors are limited to the surfaceregion of the 200 nm thick films where surface effects can play an important role whichcan differ significantly from the behavior of the rest of the film.The measurements of the polar and longitudinal Kerr effect for the films with differentRh concentrations are plotted in Fig. 5.11. For the Fe50Pt50−xRhx films with x=17.5 andx=25 the Kerr rotation and ellipticity are around zero for the entire range of the appliedmagnetic field. Such a behavior can be explained in three ways. One possible explanationis that both films have no magnetic moments that can be oriented in the applied mag-netic field. Another possibility for the absence of the signal is that both films are in theparamagnetic state and the applied field is not high enough to orient the moments in thefield direction. The third interpretation is that the films are AF ordered and thereforehave no resulting magnetic moment and the magnetic field of 1T is not high enough toalign the AF coupled spins and induce a non-zero magnetic net moment along the fielddirection. It should be noted that the distinction of the three cases is not possible withthe MOKE measurements if only measured at room temperature.The Fe50Pt45Rh5 film shows a linear hysteresis for the longitudinal geometry which istypical for hard axis hysteresis curves. A similar behavior can be observed for the polargeometry for small fields, but it shows an open hysteresis if the magnetic field is in therange of the saturation magnetization (µ0H = 600mT) which indicates an alignment ofthe magnetic moments along an easy axis. Therefore the film with x=5 has an out-of-plane anisotropy. Taking the linear part into account the shape of the hysteresis loop canbe explained in the following way: In the linear region (µ0H = 0− 300mT) the magneticmoments align parallel to the applied magnetic field but are uniformly distributed in dif-ferent domains of spin up or down. Such a spin configuration gives a zero magnetization

5. Measurements and Results 47
perpendicular to the sample plane (parallel to the applied magnetic field). Similar be-haviors were observed in Co/Pt [94], [80] or Co/Pd multilayers [95]. There it was shownwith magnetic force microscopy (MFM) that the linear region of the MOKE hysteresisloops corresponds to up and down domains with labyrinth structures which are calledmaze pattern or labyrinth domain pattern. With increasing magnetic field the part ofthe uniformly distributed maze patterns decreases while the domains with orientation infield direction increase. Close to the saturation magnetization almost all spins are alignedalong the applied magnetic field and only isolated domains remain with opposite mag-netization direction, the so-called bubble domains. Furthermore MFM measurements ofCo/Pt showed that if a saturating magnetic field is applied in-plane the magnetic mo-ments form for low magnetic fields stripe domains with the magnetic moments orientedparallel or antiparallel to the applied magnetic field [94]. It is important to note that theobserved effects could be only limited to the surface region and not be representative forthe entire 200 nm Fe50Pt45Rh5 film.The measurements of the longitudinal and polar Kerr effect for the Fe50Pt40Rh10 filmshow no saturation effects of the hysteresis curves but the high magnetic signal in themeasurements with polar geometry is a strong indication of a FM order in the film. Sinceno saturation effects can be observed for both Kerr geometries no clear information aboutthe anisotropy can be achieved. Considering the strong magnetic signal for the polargeometry, similar to the Fe50Pt45Rh5 film, an out-of-plane anisotropy can be expected.It should be noted that the hysteresis curves of the polar rotation of the film with x=5and x=10 should be symmetric around zero. The observed shift can be explained asfollows: A Glan-Thompson prism is used to minimize the signal in the alignment of theexperiment, in the actual measurements the prism is tilted from the minimum to achievea low signal from the sample. The signal is in general expected to be linear and thelinearity is considered in the data treatment. In the measurements presented here a nonlinearity occurs due to the high magnetic signal which was not considered in the datatreatment and leads to the observed shift of the hysteresis curves but has no influence onthe fundamental magnetic properties, e.g. the anisotropy.
In summary the MOKE measurements on the four 200 nm thick films reveal no FMorder for the Fe50Pt32.5Rh17.5 and the Fe50Pt25Rh25 films while the Fe50Pt40Rh10 andthe Fe50Pt45Rh5 film show FM behavior. Furthermore the MOKE measurements on thefilm with x=5 indicate an out-of-plane anisotropy while the film with x=10 can not besaturated in fields of 1T and no clear conclusion about the anisotropy can be drawn. Sincethe magnetic signal is similar to the one for the film with x=5 an out-of-plane anisotropycan be expected. The MOKE measurements in this work have exclusively been performedat room temperature and thus the observed magnetic properties can be only stated forthis temperature.
5.4. Neutron Diffraction
The MOKE measurements have given first indications about the magnetic properties andthe magnetic configurations of the different Fe50Pt50−xRhx films but as already pointedout, the technique only probes the surface region which may differ from the bulk regime.To investigate the magnetic structure in more detail a method is needed which is able toprobe the magnetic configuration on a microscopic or even atomic level and to be able toaccess the whole sample volume. For this task polarized and unpolarized neutron diffrac-

48 5.4. Neutron Diffraction
Figure 5.11.: Hysteresis curves of the Fe50Pt50−xRhx films with x=5 (black squares), x=10(red circles), x=17.5 (green solid triangles) and x=25 (blue open triangles)for the polar Kerr rotation and longitudinal Kerr ellipticity.
tion is an ideally suited technique. As already mentioned in the introduction, cold andthermal neutrons possess a wavelength in the range of atomic distances (in the Å-regime)and interact with the core of an atom as well as with the unpaired electrons hence enablingone to study the nuclear and the magnetic structures on an atomic level. Furthermore,the neutrons possess a much higher penetration depth than photons, particularly for thelaser light in the visible range used in the MOKE measurements. The high penetrationdepth allows measurements of the entire sample material, i.e. of the film of interest andis not restricted to the surface.In the following the data of the polarized and unpolarized neutron diffraction measure-ments will be presented. As discussed in section 3.2.3 the unpolarized neutron diffractionmeasurements are sensitive to the magnetic moments which are perpendicular to the scat-tering vector ~Q. It is important to note, however, that no distinction between magneticmoments in the plane is possible by using unpolarized neutrons. In particular, it can notbe distinguished between the orientation of magnetic moments along the in-plane axes aor b, respectively. By comparison of the integrated intensities of different Bragg reflec-tions by means of structure factor calculations information about the magnetic order, e.g.AF or FM order, and their orientation can be gained, in particular if the magnetic orderis along the in-plane or out-of-plane direction. The determination of the different compo-nents of the magnetic moments along the different symmetry axes, however, requires theanalysis of polarization states of the neutrons during the scattering process provided bypolarized neutron diffraction with polarization analysis (see section 3.2.3).In the following sections the neutron diffraction data is presented in detail. All the unpo-larized neutron diffraction measurements were carried out at POLDI, D23 and IN12 (seechapter 4). Latter instrument was also used for the polarized measurements with polar-ization analysis. Some additional measurements for the Fe50Pt45Rh5 film were performedat IN3. The guide field in these measurements was oriented in such away that it was setparallel to one of the in-plane axes which is here denoted without loss of generality as theb-axis of the Fe50Pt50−xRhx films.The neutron diffraction measurements in this chapter are divided in two parts showingthe dependence of the data on the composition and on the thickness, respectively. Alldata presented in the following are corrected for sample illumination, the Q-dependenceof the magnetic form factors and normalized by the beam monitor as described in section

5. Measurements and Results 49
4.5.
5.4.1. Composition
Before the neutron diffraction data is presented for the individual Fe50Pt50−xRhx compo-sitions some general remarks will be given first: Most of the diffraction investigations werecarried out with unpolarized neutrons to identify the nuclear and magnetic order in thesamples. Due to the symmetry of the bct structure of the samples the first, second andhalf order reflections along two orthogonal directions [001] and [100] were examined. Theother in-plane direction along [010] is crystallographically identical to [100] and thereforeno differences to the reflections along the [100] direction are expected. Since it is possiblethat the magnetic moments are not aligned along the symmetry axes additional reflections((111) and (1
21212)) along diagonal symmetry directions have been measured additionally.
In section 5.2 the structure factor calculations were discussed in detail for the bct struc-ture of the Fe50Pt50−xRhx samples. From this discussion the following conclusions can bedrawn:
1. Any observed half order reflections are exclusively due to an AF order.
2. First and second order reflections possess always a nuclear contribution with a pos-sible FM part.
For the AF order of the half order reflections the doubling of the unit cell should bekept in mind. For the first and second order reflections it is important to note that thenuclear part for the first order reflections is significant less compared to the second orderreflections. Therefore the magnetic contribution due to the FM order will be more visiblefor the first order reflections as already pointed out before. Therefore the discussion of FMcontributions to the scattering intensity will be focused on the first order while changes inthe structural properties, e.g. lattice constants, are more prominent at the second orderBragg reflections due to the larger shift in Q.Further diffraction measurements were carried out with polarized neutrons for selectedreflections to identify the orientation of the magnetic moments in the plane perpendicularto the scattering vector ~Q.
Fe50Pt45Rh5
Figure 5.12 presents the neutron diffraction results for the Fe50Pt50−xRhx film with thelowest Rh doping for the here investigated films of x=5. Here, only intensity of the firstand second order Bragg reflections along the [100]- and [001]-direction as well as of the(111) Bragg reflection can be observed. The (222) reflection was not accessible in theexperimental set-up. Intensity of the half order peaks in any of the proposed directionswas not detected indicating that for the low concentration of 5% Rh no AF order is presentfor the whole temperature range.The out-of-plane reflection (002) shows constant values of the integrated intensities overthe whole temperature range within the error bars. Such a behavior indicates an absenceof a magnetic contribution to the peak intensity. A similar behavior is present for the (001)reflection. Here, the neutron diffraction measurements indicate only a very slight decreaseof the integrated intensity with increasing temperature. This slight decrease of intensityis not of magnetic origin but can be explained by thermal fluctuations and associated with

50 5.4. Neutron Diffraction
it a decrease of the signal to noise ratio (for more details see the appendix A). The two in-plane Bragg reflections, (100) and (200), on the other hand show a significant temperaturedependence. Their integrated intensities decrease with increasing temperature, whereasthe effect is much stronger observable at the first order peak as discussed before. Aspointed out in the section 3.2.3 the changes in the intensity can be attributed to a FMcontribution. A nearly identical behavior can be observed for the (111) Bragg reflection.The decrease of the integrated peak intensities can be fitted by a power law which is shownin the following. The temperature dependence of a spontaneous magnetization [96, 97]can be described by the equation:
M(T ) =M0D(1− T
Tc)β, (5.18)
where D is a factor near unity which represents the misfit between the above expressionand the behavior of real substances at T=0K. It is sensitive to such factors as the detailsof the spin-wave spectrum, e.g. the spin-wave gap at k=0 and the spin-wave dispersion[98]. Tc and β denote the critical temperature and the critical exponent, respectively.Since the integrated intensity I of a magnetic peak is proportional to the magnetizationM and the magnetic moment, respectively: I ∝ p2 ∝ m2 and M ∝ m, where m denotesthe magnetic moment and p is the magnetic scattering length, (see section 5.5 and 3) theabove equation can be written as:
√I(T )
I0∝ M(T )
M0
= D
(1− T
T ∗
)β∗
, (5.19)
with I(T ) denoting the integrated intensity, β∗ the transition exponent, T ∗ the transitiontemperature and T the temperature parameter. It is important to note that the powerlaw 5.18 is used to calculate phase transitions in ferromagnets [97] and antiferromagnets[98]. Therefore Tc is equivalent to the Curie or the Néel temperature of a system and βindicates whether the transition is of first (β → 0) or second order (β > 0). In the workpresented here the power law 5.19 is used to fit the intensity decreases of the magneticreflections.Fitting the decay of the integrated intensities of the (100) and (111) reflections by thepower law leads to a transition temperature of about T ∗
100 = 521K±2K and T ∗111 =
510K±4K, respectively.Considering the results from the unpolarized neutron diffraction measurements which in-dicate magnetic contributions to the in-plane but not to the out-of-plane first and secondorder reflections, respectively, one can conclude that the Fe50Pt45Rh5 film shows pure FMbehavior with the main distribution of the magnetic moments in the out-of-plane direc-tion. A transition to the PM state can be observed slightly above T=500K. The decreaseof the integrated intensities of the (100) and (111) reflections indicate a continuous FM-PM transition which is also indicated by the values of the transition exponents of aboutβ∗=0.31.From the bulk Fe50Pt50−xRhx systems it is known that the magnetic and structural tran-
sitions are accompanied by discontinuous or abrupt changes of the lattice parameters aswell as the c/a-ratio [17]. Such effects are also often observed in materials with first ordertransitions to the FM or from the FM state due to magnetostriction. In the Fe50Pt50−xRhx
film with x=5 no transition of such a kind can be found up to temperatures of T=500K.However, the knowledge of the temperature behavior of the lattice constants in thin films

5. Measurements and Results 51
Figure 5.12.: Temperature dependence of the integrated neutron diffraction intensity ofthe Fe50Pt45Rh5 film at two in-plane (200), (100) (open symbols) and twoout-of-plane (002), (001) reflections (solid symbols) as well as the (111)reflection. The red and blue line for the (100) and (111) peaks are fitswith the power law 5.19. The (001
2), (1
200) and (1
21212) reflections can not be
observed.

52 5.4. Neutron Diffraction
Figure 5.13.: a) The variation of the lattice parameter a and c of the Fe50Pt45Rh5 filmwith temperature. b) The temperature dependence of the c/a-ratio.
without magnetic transitions helps to assign changes of the lattice constants, e.g. abruptchanges, to magnetic transitions.The lattice parameter a and c can be calculated from the peak positions of the secondorder reflections (002) and (200), respectively, using the equations dhkl = 2π
Qand 5.7. The
corresponding results are plotted in Fig. 5.13. The lattice parameter c increases withincreasing temperature up to a maximum at about T=300K before it decreases slightlyagain. The lattice parameter a, on the other hand, shows a continuous increase withtemperature. No abrupt changes can be observed for both lattice parameter a and c, aswell as for the c/a-ratio confirming the absence of magnetic transitions in the observedtemperature range.In order to extract more detailed information about the magnetization in the sample, e.g.
about the orientation of the magnetic moments, measurements with polarized neutronswith polarization analysis of the diffracted beam were carried out. As pointed out in detailin section 3.2.3 the polarization analysis enables one to distinguish between the differentcontributions of the magnetization in the sample perpendicular to the scattering vector~Q and in respect to the applied guide field (e.g. NSF or SF scattering, see section 3.2.3).It should be noted that the guide field for the film with x=5 was oriented in contrast tothe other films along the a-axis which corresponds to the [100]-direction in the reciprocalspace.Figure 5.14 shows two reflections (002) and (100) of the Fe50Pt45Rh5 film analyzed by po-larized neutron diffraction at IN12. It is important to note that for the in-plane reflection(100) the magnetic field was parallel to the scattering vector ~Q. Since the unpolarizedneutron diffraction measurements reveal no magnetic transitions the polarization analysiswas limited to two distinct temperatures, T=100K and T=305K, respectively. The (002)reflection exhibit identical intensity in both NSF channels (++ and - -) but no significantintensity in the SF channel. This behavior also does not change with increasing tem-perature as it was already observed in the unpolarized neutron diffraction measurementsindicating once more the absence of a magnetic contribution for this reflection. The po-larization analysis of the first order in-plane (100) reflection reveals, on the other hand,the dominant intensity in the SF channel while only a small constant component is ob-served in the NSF channels. It should be noted that the data presented here is correctedfor polarization efficiency as described in section 4.5. The small component of the NSF

5. Measurements and Results 53
Figure 5.14.: Polarized neutron diffraction scans of the Fe50Pt45Rh5 film for the (002)and the FM (100) reflection at T=100K and T=305K plotted against theindividual reciprocal lattice units (r.l.u.). The guide field was oriented alongthe [100]-direction (a-axis) of the film.
channels is therefore real and not due to polarization inefficiency. Since the magneticfield is parallel to the scattering vector for the (100) reflection a magnetic signal can notbe observed in the NSF channels and the origin of the small NSF component is purelynuclear while the observation of the SF intensity can only be caused by magnetic mo-ments which have perpendicular components to the guide field and the scattering vector~Q along the in-plane or the out-of-plane direction. Considering the absence of SF inten-sity of the (002) reflection and the identical intensity of the NSF channels it follows thatthe magnetic moments have no in-plane components and are directed in the out-of-planedirection. It should be pointed out that unlike a FM contribution with moments alongthe guide field which would cause a splitting of both NSF channels, no splitting can bedetected in the SF channels therefore only one SF channel is shown here (for more detailssee section 3.2.3).In an additional step the decrease of the second order (200) reflection was examined by
polarized neutron diffraction with polarization analysis in order to verify if the decreaseis of magnetic or has a structural origin (e.g. lattice vibration). The measurements werecarried out at the thermal three axis instrument IN3 since the cold three axis instrumentIN12 was unable to access the high Q-values of the (200) reflection. The guide field wasset again along the a-axis parallel to the in-plane scattering vector. To study the mag-netic effect the ratio of the NSF to the SF intensity was analyzed. For comparison, thisflipping ratio was also measured for the second order reflection (002) of the film whichis a pure nuclear Bragg reflection. For reflections of pure nuclear origin the ratio shouldbe constant with temperature while in the case of a magnetic contribution to the (200)peak, with respect to the results of the (100) reflection, the ratio should increase due

54 5.4. Neutron Diffraction
Figure 5.15.: Flipping ratio (NSF/SF) of the Fe50Pt45Rh5 film for the nuclear Bragg peak(002) and the (200) reflection as function of the temperature. The red lineis a guide to the eyes.
to the decrease of the SF intensity. The corresponding results for both reflections areshown in Fig. 5.15. The flipping ratio of the (002) reflection is constant within the er-ror bars with a mean value of the flipping ratio of about 45±7. This value is in goodagreement with the flipping ratio of the (002) reflection of the MgO substrate which wasmeasured to determine the intrinsic flipping ratio. This confirms the pure nuclear originof the (002) reflection. The flipping ratio of the in-plane (200) reflection, on the otherhand, increases from a value of 18±4 for T=100K to a value of 27±6 for T=500K. Theincrease is a strong indication for a magnetic contribution to the (200) peak intensity andconfirms the magnetic origin of the observed decrease in intensity of the unpolarized data.
In summary the unpolarized and polarized neutron diffraction measurements of theFe50Pt45Rh5 film reveal a FM out-of-plane alignment of the magnetic moments withoutany temperature driven reorientation of the magnetic moments.
Fe50Pt40Rh10
In Fig. 5.16 the results of the unpolarized neutron diffraction analysis of the Fe50Pt40Rh10
film are plotted. The half, first and second order reflections along the [001]- and [100]-direction as well as the (111) and (1
21212) reflection were observed. At low temperature the
half order reflections exhibit significant intensity, in particular the (0012) reflection which
is the most dominant reflection. The integrated intensities of these peaks decrease withincreasing temperature. The decay of the intensities can again be fitted by the powerlaw (equation 5.19). For the out-of-plane half order reflection a transition temperatureof about T ∗
00 1
2
=330K±4K can be determined while the (1200) and (1
21212) reflections are
already vanished at about T ∗1
200
=252K±3K and T ∗1
2
1
2
1
2
=230K±30K, respectively. The in-
tegrated intensity of the (100) reflection, on the other hand, increases with increasing tem-perature with a maximum at about T=300K where the half order reflections are almostvanished. For higher temperature T>300K the peak intensity decreases again. Fittingthe decay by the power law leads to a transition temperature of about T ∗
100=414K±20K.

5. Measurements and Results 55
A similar behavior can be observed for the (111) reflection but the error bars are muchlarger due to the lower intensity. From the structure factor calculation it is obvious thatboth peak intensities (100) and (111), respectively, have contributions from a FM order.Such a FM order should also lead to a magnetic contribution in the (200) reflection butthe integrated intensity of the peak shows no visual increase with temperature (see Fig.5.16). The circumstance that the magnetic contribution to the (200) reflection can beobserved in the film with x=5 but not in the film with x=10 can be explained by thedifferent instruments used for the neutron diffraction measurements with different signalto noise ratios. The much lower ratio for the measurements of the Fe50Pt40Rh10 filmleads to larger error bars for the (200) intensities, e.g. it is only about 2% for the filmswith x=5 but 14% for the film with x=10. Considering the magnetic contribution of the(100) reflection and the Q-dependence of the magnetic form factor this value is in thesame range as the expected magnetic contribution to the (200) reflection. In the raw datathe contribution is even lower than the error and therefore no clear signal of a magneticcontribution can be observed in the measurements. Since the fraction of the magneticcontribution to the (200) peak intensity can not be determined the integrated intensitywas not corrected for the Q-dependence of the magnetic form factor.The first and second order reflections along the [001]-direction, on the other hand, show
both constant intensities over the whole temperature range indicating to be only of nu-clear origin.Considering the results from the unpolarized neutron diffraction measurements obtainedfor the Fe50Pt40Rh10 film a transition from a dominant AF order out-of-plane to a dom-inant FM order in-plane takes place in a temperature range from about T=100K toT=330K. A second magnetic transition from the FM to the PM phase can be observedabove T=400K. The decays of the half order reflections as well as the first order reflec-tions (100) and (111) indicate continuous magnetic transitions which is also reflected inthe transition exponents β∗ > 0.2 (see table 5.4).In contrast to the film with x=5 a temperature driven AF-FM transition can be deter-mined in the film with x=10. In the following, the changes in the lattice constants aand c will be discussed to examine if these behaviors can be also observed for the latticeconstants. The temperature dependent lattice constants determined by the position ofthe second order reflections (002) and (200) are presented in Fig. 5.17. Similar to thesample with x=5, the lattice constant c increases with temperature up to a maximum atabout T=300K before it slightly decreases again. The lattice parameter a exhibits againa continuous increase over the whole temperature range in respect to the error bars. Abehavior similar to the lattice constant c can also be observed for the c/a-ratio it increasesup to temperatures of about T=300K and then decreases again. Both lattice constantsas well as the c/a-ratio show no abrupt changes indicating that the observed magnetictransitions are not accompanied by sudden structural changes.The unpolarized neutron diffraction measurements reveal an AF order with the mag-
netic moments dominantly oriented in-plane for low temperature and a dominant FMorder with the moments oriented out-of-plane for high temperatures. To examine thedifferent contributions of the magnetic moments to the symmetry axes polarized neutrondiffraction with polarization analysis have been carried out at low temperature T=150Kwhere the film has a dominant AF order and at T=300K where the dominant order isFM. It should be noted that for the polarized measurements with polarization analysisshown in Fig. 5.18 the scattered intensity is significant lower (less than 50%) than forthe unpolarized neutron diffraction due to the restriction of the incident neutron beam to

56 5.4. Neutron Diffraction
Figure 5.16.: Temperature dependence of the integrated peak intensities of theFe50Pt40Rh10 film at three in-plane (200), (100) and (1
200) reflections (open
symbols) and three out-of-plane (002), (001) and (0012) reflections (solid
symbols) as well as the (111) and (121212) peak. The intensities of the (111),
(1200) and (1
21212) reflection have been multiplied by a factor 8.
Figure 5.17.: a)Temperature dependence of the lattice parameter a and c. b) The varia-tion of the c/a-ratio of the Fe50Pt40Rh10 film with temperature.

5. Measurements and Results 57
only one spin state and loss of intensity due to flippers and mirrors used for the flippingof the neutron spin and the polarization analysis of the scattered neutrons, respectively.Therefore only the reflections with the highest intensity could be investigated while otherpeaks, i.e. (1
21212) and (111) were already too weak to be analyzed. The magnetic guide
field for the polarized measurements was oriented here in-plane along the b-axis.The most dominant AF reflection is the (001
2) peak which shows intensity in the polariza-
tion analysis in the SF as well as in the NSF channel. For low temperatures the intensityin the SF channel is slightly higher than for the SF channel while for high temperaturesboth intensities are almost identical. Since both scattering channels show intensity it canbe concluded that magnetic components along the b-axis as well as along the a-axis con-tribute to the AF out-of-plane half order reflection. The in-plane (1
200) reflection exhibit
intensity only in the NSF channel indicating that the contributions to the reflection areonly due to magnetic moments oriented in-plane. The FM (100) reflection has in contrastto the AF reflections intensity only in the SF channel. Considering the results from theunpolarized neutron diffraction measurements this shows that only magnetic momentsalong the c-axis contribute to the peak intensity. The same behavior is found for highertemperatures. The increase of the intensity was already observed in the unpolarized neu-tron diffraction data.
In summary the unpolarized and polarized neutron diffraction measurements of theFe50Pt40Rh10 film showed a dominant AF order in the out-of-plane direction for lowtemperature with an orientation of the magnetic moments in-plane. For high temperaturea dominant FM order in the in-plane direction can be observed with the magnetic momentsaligned along the out-of-plane axis c. In a temperature range between T=100K andT=300K a transition from the AF to the FM order takes place. A second magnetictransition to the PM phase can be observed above T=400K.
Fe50Pt32.5Rh17.5
The MOKE measurements of the Fe50Pt32.5Rh17.5 film did not show an indication of aFM order in the sample. Unpolarized neutron diffraction measurements now allow oneto investigate the presence of any other magnetic order. The integrated intensities andtheir temperature dependencies are shown in Fig. 5.19. The half, first and second orderreflections can be observed along the [001]-direction while for the [100]-direction only thesecond and half order peaks appear. Additionally intensity at the (1
21212) peak can be
measured. Intensity around the (111) reflection was not observed.The first and second order reflections in both [001]- and [100]-direction have constantintensities over the whole temperature range within the error bars indicating that thesereflections are of pure nuclear origin. The out-of-plane half order reflection (001
2), on
the other hand, shows a significant temperature dependence, i.e. its integrated intensitydecreases with increasing temperature. Applying the power law 5.19 a transition temper-ature of about T ∗
00 1
2
=408K±10K can be determined with a transition exponent of about
β∗ = 0.15 ± 0.05. The integrated intensities of the (1200) and (1
21212) reflections are much
weaker compared to the (0012) reflection, but also indicate a decrease of the integrated
intensity with similar parameters.Considering the results from the unpolarized neutron diffraction and the structure factorcalculations one can summarize that the Fe50Pt50−xRhx film has an AF order with themagnetic moments dominantly oriented in-plane. The fit of the out-of-plane half order

58 5.4. Neutron Diffraction
Figure 5.18.: Polarized neutron diffraction scans of the Fe50Pt40Rh10 film for the AF (0012),
(1200) and the FM (100) reflection at T=150K and T=300K. The data of
the (1200) reflection have been multiplied by a factor of 1/3. The guide field
for the measurements was oriented along the [010]-direction (b-axis) of thefilm.

5. Measurements and Results 59
Figure 5.19.: Temperature dependence of the integrated peak intensities of theFe50Pt32.5Rh17.5 film at three in-plane (200), (100), (1
200) reflections (open
symbols) and three out-of-plane (002), (001) and (0012) reflections (solid sym-
bols) as well as the (121212) peak. The intensities of the half order reflections
(1200) and (1
21212) have been multiplied by a factor 5.
integrated peak intensity indicates a transition to the PM phase above T=400K.The lattice constant a and c presented in Fig. 5.20 are almost constant for low tempera-tures T<100K and increase continuously for higher temperatures. A similar behavior canbe found for the c/a-ratio. No abrupt changes can be observed in the lattice constants a,c and in the c/a-ratio which is an indication for the absence of crystallographical changesup to temperatures of about T=500K.Polarized neutron diffraction measurements with polarization analysis were carried out
for the Fe50Pt32.5Rh17.5 film to examine the different contributions of the magnetic mo-ments to the symmetry axes and their temperature dependencies. Since the unpolarizedneutron diffraction data indicate that the first and second order reflections have a nuclearorigin and the intensity of the (1
21212) peak is too low to be measured in the polarization
analysis the measurements were restricted to the in-plane and out-of-plane half order re-flections. Furthermore, no magnetic transitions can be found in the sample therefore thepolarization analysis was only carried out at two distinct temperatures, T=200K andT=330K, respectively. For an AF order no differences in the intensity are expected be-

60 5.4. Neutron Diffraction
Figure 5.20.: a) Temperature dependence of the lattice parameter a and c of theFe50Pt32.5Rh17.5 film. b) The variation of the c/a-ratio with temperature.
tween both NSF and both SF channels, respectively, which was experimentally confirmedfor the Fe50Pt32.5Rh17.5 film. Therefore only one combined component is shown in Fig.5.21. The guide field in the polarization measurements was oriented along the b-axis ofthe film.For both temperatures the (001
2) reflection exhibits identical intensity in the SF and NSF
channel within the error bars and both channels show a decrease of the intensity withincreasing temperature as it was already observed in the unpolarized neutron diffraction.The presence of both scattering channels indicates that components of the magnetic mo-ments pointing along the in-plane direction contribute to the AF-order. The half orderreflection (1
200) exhibits intensity only in the NSF channel excluding any out-of-plane
orientation of the magnetic moments for this reflection.
In summary of the Fe50Pt32.5Rh17.5 film one can conclude that the film has a dominantAF order in the out-of-plane direction with the magnetic moments predominantly orientedin-plane. The transition to the paramagnetic phase can be expected above T=400K.
Fe50Pt25Rh25
Figure 5.22 shows the results from the unpolarized neutron diffraction measurements forthe Fe50Pt25Rh25 film. The half, first and second order reflections along the [001]- and[100]-direction as well as the (1
21212) reflection can be observed, while the (111) peak was
not present at any temperature.At low temperature (T<200K) only the (1
21212) reflection can be measured which remains
the strongest reflection up to T=225K. Then it strongly decays and vanishes at aroundT ∗
1
2
1
2
1
2
=276K±4K (see table 5.4). At T=200K the (0012) reflection appears and becomes
most dominant with a maximum at around 290K. For higher temperatures it rapidlydecays again. The fit with the power law leads to a transition temperature of aboutT ∗00 1
2
=354K±6K. Around the same temperature as the (0012) reflection, the in-plane (1
200)
peak appears which becomes most prominent at around T=350K which correspond toits intensity maximum. A decay of the intensity can be observed for higher temperaturesuntil it vanishes at about T ∗
1
200
=469K±13K. The first and second order reflections along
the [001]- and [100]-direction are, on the other hand, constant within the error bars indi-
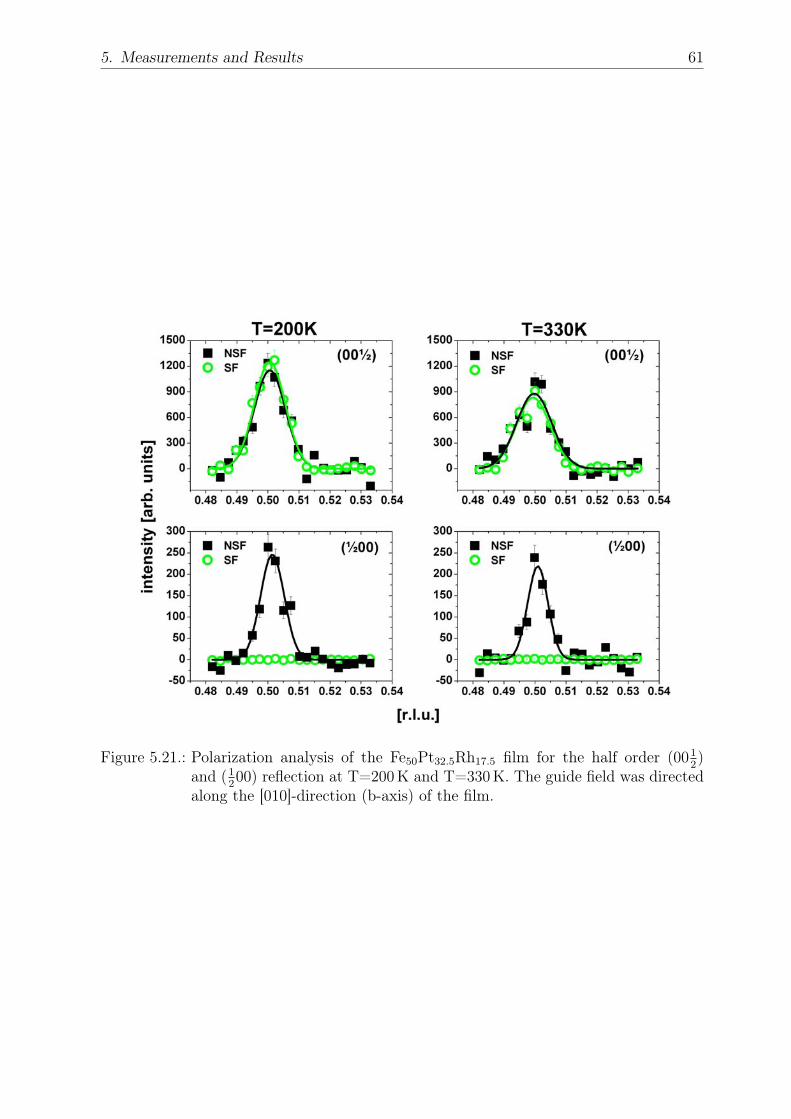
5. Measurements and Results 61
Figure 5.21.: Polarization analysis of the Fe50Pt32.5Rh17.5 film for the half order (0012)
and (1200) reflection at T=200K and T=330K. The guide field was directed
along the [010]-direction (b-axis) of the film.

62 5.4. Neutron Diffraction
Figure 5.22.: Temperature dependence of the integrated neutron diffraction intensities ofthe Fe50Pt25Rh25 film at the half, first and second order reflections alongthe [001]- (solid symbols) and [100]-direction (open symbols) as well as the(121212) peak. The lines are fits to equation 5.19.
cating that no magnetic components contribute to their intensity.From the unpolarized neutron diffraction measurements one can conclude that at low
temperature an AF order is present along the [111]-direction while in a temperature rangebetween 200K<T<350K an AF order in the out-of-plane direction becomes dominant.For temperature T>350K another AF order in the in-plane direction is dominant beforethe film becomes paramagnetic above T=470K. The slow decays of the half order re-flections indicate continuous transitions between the different AF orders and to the PMphase, respectively, which is also expressed in the fitted values of the transition exponentslisted in table 5.4.Fig. 5.23 describes the behavior of the lattice constants a and c and the c/a-ratio withtemperature. Both lattice constants a and c increase continuously while the c/a-ratioshow only a slight indication of an increase. As already observed in the other films noabrupt changes can be found indicating that the transitions of the dominant reflectionare not accompanied by drastic changes of the crystal structure.The polarized neutron diffraction analysis of the Fe50Pt25Rh25 film was carried out at

5. Measurements and Results 63
Figure 5.23.: a) The variation of the lattice parameter a and c of the Fe50Pt25Rh25 filmwith temperature. b) Temperature dependence of the c/a-ratio.
various temperature with the magnetic guide field directed along the b-axis. Figure 5.24shows the analysis in more detail for two distinct temperatures: At T=250K where the(001
2) reflection is dominant and at T=330K where both (001
2) and (1
200) peaks have
quasi identical intensities. Besides the half order reflections also the first order peaks(001) and (100) were analyzed. Here, both NSF channels and one SF channel was mea-sured. The first order reflections show almost identical intensity in both NSF channelsfor both temperatures while no intensity can be found in the SF channel indicating thatthe measured intensity is of pure nuclear origin without any FM contribution. The (001
2)
reflection, on the other hand, shows for both temperatures identical intensities in theSF and NSF channel, only the intensity drops for higher temperatures as already seenin the unpolarized neutron diffraction measurements. The identical intensities of bothscattering channels indicate magnetic moments with components along the a- and b-axis.The (1
200) reflection also exhibits intensity in both the SF and the NSF channel, but
with different intensities. While the NSF channel is strong at T=250K, the SF channelbecomes slightly dominant at T=330K indicating that magnetic moments along as wellas perpendicular to the guide field contribute to the AF order but with a temperaturedriven slight reorientation of the magnetic moments from the in-plane to the out-of-planedirection. A more detailed temperature analysis of the polarized neutron diffraction ispresented in Fig. 5.25. Here, it can be seen that the dominant intensity of the (1
200)
reflection changes from the NSF to the SF channel at about T=315K. Furthermore, theSF channel becomes more dominant with higher temperature.
The neutron diffraction measurements reveal an AF order along the [111]-direction forlow temperature that changes to an AF order in the out-of-plane direction for highertemperature and for even higher temperature an AF order in the in-plane direction canbe found before the film becomes PM above T=470K. The polarization analysis of theFe50Pt25Rh25 film indicates components of the magnetic moments along the three symme-try axes. Here, the contribution of the components in the out-of-plane direction becomesdominant for higher temperature.
The data from the neutron diffraction measurements are summarized in table 5.4. Themeasurements reveal a FM order for the Fe50Pt50−xRhx film with x=5 while the film
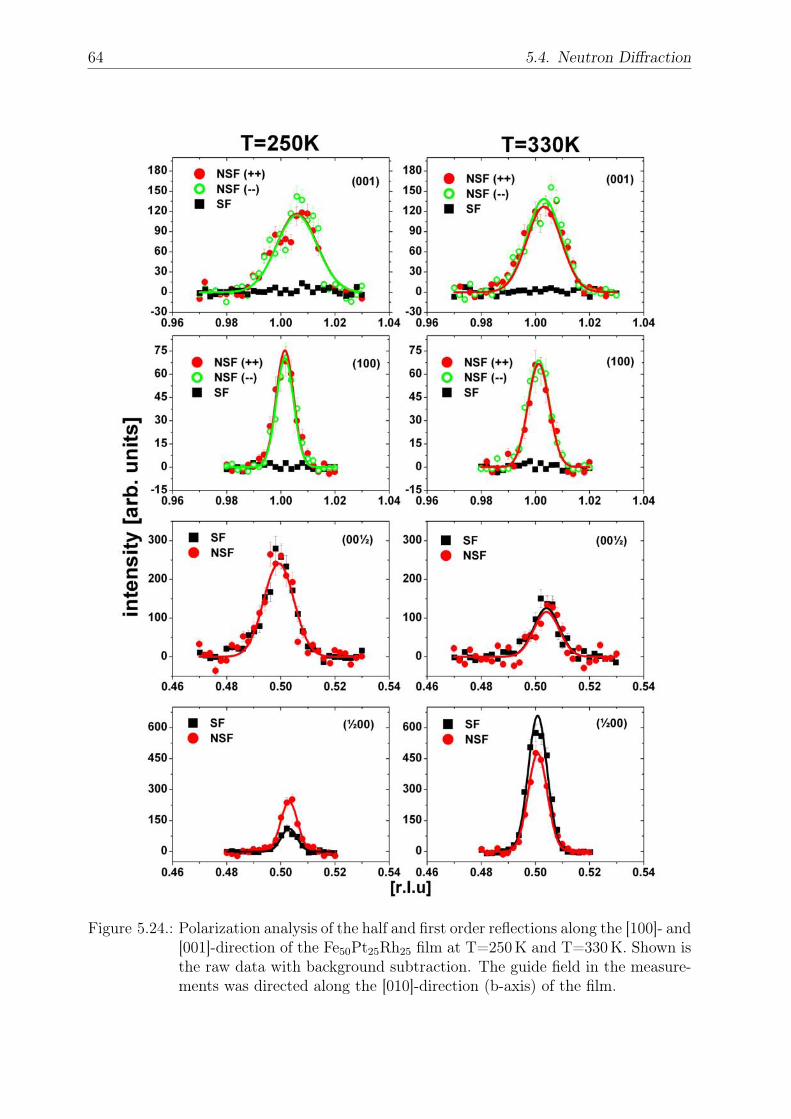
64 5.4. Neutron Diffraction
Figure 5.24.: Polarization analysis of the half and first order reflections along the [100]- and[001]-direction of the Fe50Pt25Rh25 film at T=250K and T=330K. Shown isthe raw data with background subtraction. The guide field in the measure-ments was directed along the [010]-direction (b-axis) of the film.

5. Measurements and Results 65
Figure 5.25.: Polarization analysis of the Fe50Pt25Rh25 film for the nuclear Bragg reflec-tions (001), (100) and the AF (001
2), (1
200) peaks. Plotted are the integrated
intensities (including the data treatment) against the temperature. The in-tegrated intensity of the (001
2) reflection has been multiplied by a factor
1/8.
with x=17.5 has a pure AF order. The magnetic behavior of the film with x=10 canbe considered as an intermixture of the Fe50Pt45Rh5 film and the Fe50Pt32.5Rh17.5 filmshowing the transition from an AF behavior at low temperature to a FM order at hightemperature. The Fe50Pt25Rh25 film exhibits similar to the film with x=17.5 a pure AFbehavior, but in contrast the AF order changes with temperature. The results of thepolarization analysis show that the magnetic moments in the films with AF order aredominantly oriented along the in-plane direction while in FM ordered films the magneticmoments are aligned along the out-of-plane direction. An exception is the Fe50Pt25Rh25
film since in this film the dominant orientation of the AF aligned magnetic momentschanges with the temperature.The decay of the different reflections can be fitted by the power law 5.19 leading to thetransition temperatures in the table 5.4. The examined Néel and Curie temperaturesof the samples highlighted in the table are about T=100K lower compared to the bulksystem [17]. Additionally the decrease of the integrated intensities show no abrupt orrapid behavior which is also reflected in the values of the transition exponents β∗ in therange between 0.2 and 0.3 (see table 5.4).Considering the in-plane and out-of-plane lattice constants a and c of the different filmsone can see that the magnetic configuration is also reflected in these parameters. Bothlattice constants increase in the four films with the temperature due to thermal expansionsof the lattice as expected, but the c/a-ratios show different behaviors depending on themagnetic configuration in the films. For the AF ordered films with x=25 and x=17.5a continuous increase of the ratio can be observed with temperature while for the FMordered film with x=5 a decrease of the c/a-ratio can be found. In the film with x=10

66 5.4. Neutron Diffraction
(001) (100) (0012) (1200) (12
1212)
x=5 const. 521K±2K no peak no peak no peak0.31±0.02
x=10 const. 414K±20K 330K±4K 252K±3K 230K±30K0.29±0.06 0.24±0.03 0.3±0.1 0.3±0.1
x=17.5 const. const. 408K±10K slight slight0.15±0.05 decrease decrease
x=25 const. const. 354K±6K 469K±13K 276K±4K0.3±0.1 0.2±0.09 0.14±0.05
Table 5.4.: Transition temperatures and exponents for the different 200 nm Fe50Pt50−xRhx
films. The highlighted values are the Néel and Curie temperatures, respec-tively, of the corresponding films.
again a transition between these behaviors is present. The change from a continuousgrowth to a decrease of the c/a-ratio indicates magnetostriction effects during the AF-FM transition. In the bulk Fe50Pt40Rh10 alloy the AF-FM transition is associated bydiscontinuities of the lattice constants and the c/a-ratio. In the 200 nm thick film onlya continuous behavior of the parameters can be observed which can be explained by thefact that the parameters are determined from the average over all contributing domains(AF and FM domains).
5.4.2. Magnetic Field
The temperature and magnetic field dependent data were obtained at the instrumentsIN12 and D23 at the ILL. The measurements were carried out to examine the magneticfield dependence of the different compositions, e.g. to investigate if it is possible to ma-nipulate the magnetic transitions or even introduce them into the system if they are notpresent before. Four Fe50Pt50−xRhx films with x=5, 10, 17.5 and 25 have been analyzedwith the magnetic field directed in the in-plane and out-of-plane direction. The magneticfields up to 12T were provided by different superconducting magnets with horizontal (upto 5T) and vertical magnetic field (up to 12T). The temperature in these measurementswas limited to T=315K due to technical restrictions of the cryomagnets.The focus of the magnetic field measurements is on the Fe50Pt40Rh10 film since this is themost promising candidate for a manipulation of the magnetic transition temperature bythe application of a magnetic field due to the observed AF-FM transition (see previoussection).
Fe50Pt40Rh10
The measurements for the Fe50Pt40Rh10 film were carried out by using two distinct su-perconducting magnets covering the magnetic field ranges from 0T to 5T and from 5Tto 12T, respectively. A temperature range from T=100K to the maximum temperatureof about T=312K available by the superconducting magnet was selected which includesthe observed AF-FM transition at zero field.Figure 5.26 presents the magnetic field dependence of the (001
2) and (1
200) reflections for
different temperatures and clearly shows that the integrated intensities of both half orderreflections can be suppressed by the application of an in-plane magnetic field. The in-

5. Measurements and Results 67
(0012) (1200)
0T T=317K±15K T=260K±8Kβ=0.3±0.1 β=0.2±0.1
12 T/5 T T=280K±17K T=230K±20Kβ=0.4±0.2 β=0.33±0.08
Table 5.5.: Transition temperatures and exponents for the Fe50Pt40Rh10 film with andwithout the application of a magnetic field. The (001
2) reflection was measured
at 12T and the (1200) peak at 5T.
tensity of the out-of-plane half order reflection (0012) decreases only slightly by magnetic
fields of up to 5T before a more significant decrease can be observed for fields up to12T. The suppression of intensity, however, is more pronounced for higher temperatures.The integrated intensity, for example, is reduced only by about 22% from 0T to 12T forT=150K while for T=258K a decrease of about 68% can be observed. An even moresignificant intensity decrease can be found for the (1
200) reflection with a similar tem-
perature behavior. For a temperature of about T=100K the integrated intensity can besuppressed about 62% by a field of 5T while for T=200K the suppression is about 81%at the same magnetic field. It should be noted that the intensity drop to zero from 5Tto 7T at T=300K for the (001
2) reflection indicated in Fig. 5.26 can be explained by the
two different magnets and instruments used for the measurements. The signal to noiseratio of the instrument and magnet used for the high magnetic field measurements wasbelow the one used for the low magnetic field measurements. The low scattering signalmakes it challenging to observe the (001
2) reflection at high field and temperature. The
low signal to noise ratio also restricted the study of the magnetic field behavior for theweak (1
200) reflection for magnetic fields up to 5T. The influence of the magnetic field on
the temperature behavior of the integrated intensity is shown in Fig. 5.27. On the left andright side the temperature curves of the (001
2) reflection at 0T and 12T and of the (1
200)
reflection at 0T and 5T are plotted, respectively. Fitting the decay of the integrated in-tensities lead to a transition temperature of about T ∗
00 1
2
=317K±15K for the out-of-plane
half order reflection (0012) without magnetic field. This result is in good agreement with
the earlier determined transition temperature of about T ∗00 1
2
=330K±4K with respect tothe error bars. In a field of 12T the transition temperature is suppressed of about 40K toT ∗00 1
2
=280K±17K. A similar decrease of about T=30K can be also observed for the (1200)
reflection at 5T. Without a magnetic field the transition temperature has a value of aboutT ∗
1
200
=260K±8K which is again in good agreement with earlier results (T ∗1
200
=252K±3K)while at a field of 5T the transition temperature is reduced to T ∗
1
200
=230K±20K. It shouldbe noted that the intensity decay is slower in the measurements with the application of amagnetic field. This behavior is reflected in the higher values of the transition exponents(see table 5.5) indicating a more continuous magnetic transition.Not only the half order but also the first order reflections are influenced by the applica-
tion of an external magnetic field which indicates changes in the FM configuration (seeFig. 5.28). The integrated intensity of the (001) reflection increases significantly withthe magnetic field while for the (100) reflection only a slight increase of its intensity canbe detected. Without a magnetic field the integrated intensity of the (001) reflection isvery low and constant over the whole temperature range as already observed before in theneutron diffraction measurements indicating its pure nuclear origin. By the application
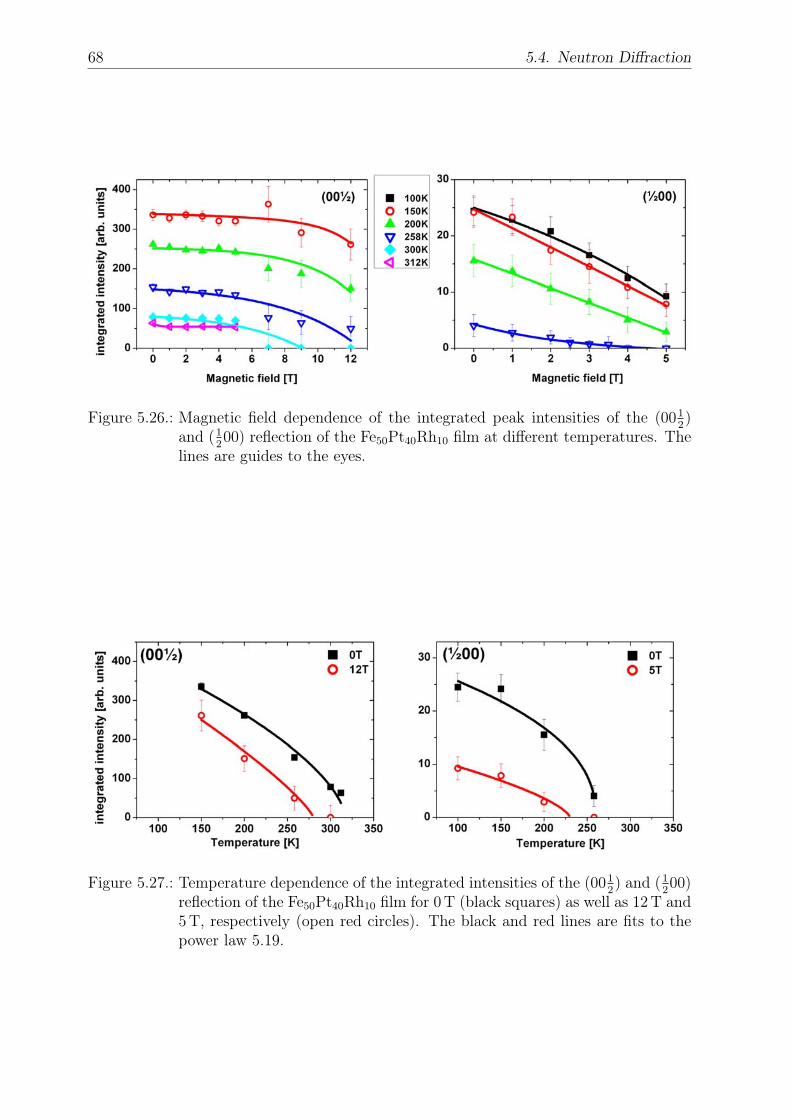
68 5.4. Neutron Diffraction
Figure 5.26.: Magnetic field dependence of the integrated peak intensities of the (0012)
and (1200) reflection of the Fe50Pt40Rh10 film at different temperatures. The
lines are guides to the eyes.
Figure 5.27.: Temperature dependence of the integrated intensities of the (0012) and (1
200)
reflection of the Fe50Pt40Rh10 film for 0T (black squares) as well as 12T and5T, respectively (open red circles). The black and red lines are fits to thepower law 5.19.
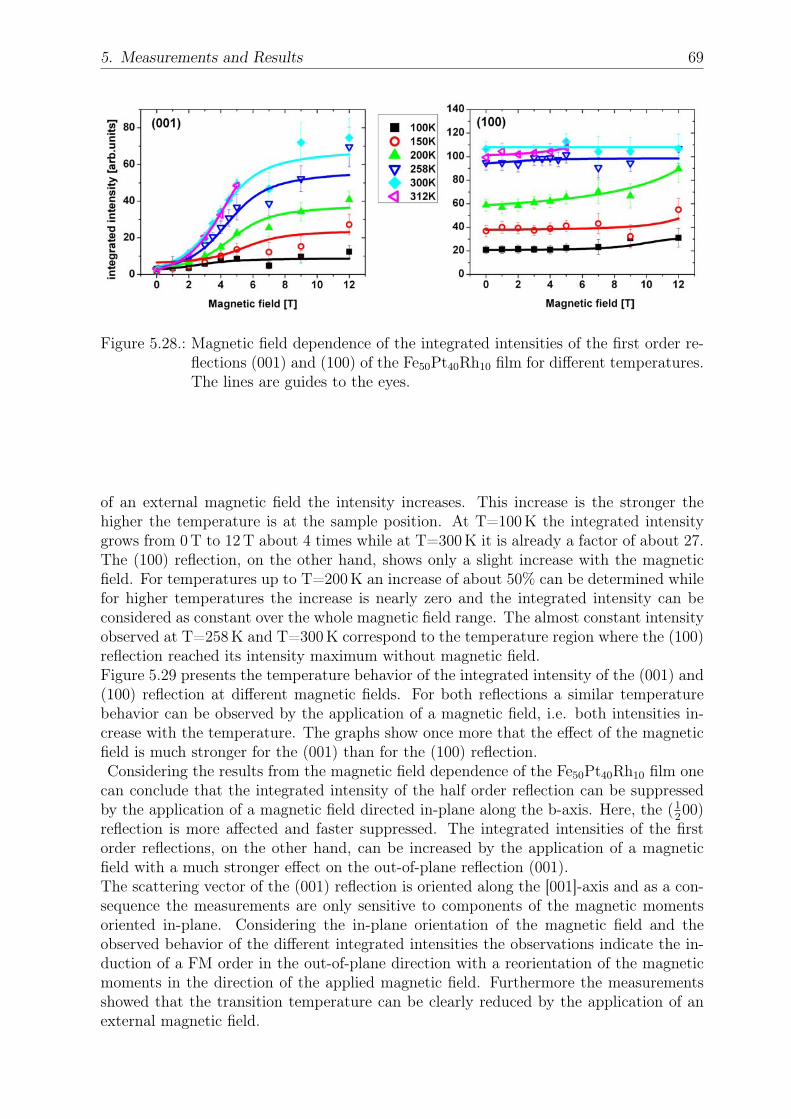
5. Measurements and Results 69
Figure 5.28.: Magnetic field dependence of the integrated intensities of the first order re-flections (001) and (100) of the Fe50Pt40Rh10 film for different temperatures.The lines are guides to the eyes.
of an external magnetic field the intensity increases. This increase is the stronger thehigher the temperature is at the sample position. At T=100K the integrated intensitygrows from 0T to 12T about 4 times while at T=300K it is already a factor of about 27.The (100) reflection, on the other hand, shows only a slight increase with the magneticfield. For temperatures up to T=200K an increase of about 50% can be determined whilefor higher temperatures the increase is nearly zero and the integrated intensity can beconsidered as constant over the whole magnetic field range. The almost constant intensityobserved at T=258K and T=300K correspond to the temperature region where the (100)reflection reached its intensity maximum without magnetic field.Figure 5.29 presents the temperature behavior of the integrated intensity of the (001) and(100) reflection at different magnetic fields. For both reflections a similar temperaturebehavior can be observed by the application of a magnetic field, i.e. both intensities in-crease with the temperature. The graphs show once more that the effect of the magneticfield is much stronger for the (001) than for the (100) reflection.Considering the results from the magnetic field dependence of the Fe50Pt40Rh10 film one
can conclude that the integrated intensity of the half order reflection can be suppressedby the application of a magnetic field directed in-plane along the b-axis. Here, the (1
200)
reflection is more affected and faster suppressed. The integrated intensities of the firstorder reflections, on the other hand, can be increased by the application of a magneticfield with a much stronger effect on the out-of-plane reflection (001).The scattering vector of the (001) reflection is oriented along the [001]-axis and as a con-sequence the measurements are only sensitive to components of the magnetic momentsoriented in-plane. Considering the in-plane orientation of the magnetic field and theobserved behavior of the different integrated intensities the observations indicate the in-duction of a FM order in the out-of-plane direction with a reorientation of the magneticmoments in the direction of the applied magnetic field. Furthermore the measurementsshowed that the transition temperature can be clearly reduced by the application of anexternal magnetic field.

70 5.4. Neutron Diffraction
Figure 5.29.: Temperature behavior of the integrated intensities of the (001) and (100)reflection of the Fe50Pt40Rh10 film at four distinct magnetic fields 12T (blacksquares), 7T,(open red circles) 3T (green triangles) and 0T (blue opentriangles). The lines are guides to the eyes.
Fe50Pt45Rh5
The magnetic field dependent neutron diffraction measurements of the Fe50Pt45Rh5 filmwere carried out with a horizontal superconducting magnet with fields up to 3.5T appliedin-plane along the a-axis of the film which is parallel to the scattering vector ~Q of the(100) reflection. It should be noted that in this set-up the measurements in the in-plane direction are sensitive to magnetic moments directed in the out-of-plane directionand not additionally to in-plane magnetic moments along the magnetic field as in themeasurements of the Fe50Pt40Rh10 film. The measurements were restricted to the firstorder reflections (001) and (100) since any intensity from the half order reflections canbe already excluded according to the unpolarized neutron diffraction measurements (seesection 5.4.1).The results of the magnetic field investigations are presented in Fig. 5.30. It should bereminded that without a magnetic field the integrated intensity of the (001) reflection isconstant with a very low count rate. By the application of an external magnetic fieldthe intensity increases strongly and enhances the signal of about a factor of 10 for 3.5Twithout reaching the saturation. The (100) reflection shows in contrast to the (001)reflection a decrease of the integrated intensity with the application of a magnetic field.Figure 5.31 shows the temperature behavior of the integrated intensities of the (001)and (100) reflection at different magnetic fields. For the (100) reflection an intensitydecrease can be observed which is qualitatively nearly identical as for zero magnetic field.The integrated intensity of the (001) reflection shows, on the other hand, only a slightdecrease of intensity with temperature by the application of a magnetic field while it isalmost zero without field. These results show that the influence of the temperature onthe magnetic field dependence is obviously less significant as it is for the Fe50Pt40Rh10
film.The unpolarized neutron diffraction measurements of the Fe50Pt45Rh5 film show an
induction of a FM order in the out-of-plane direction with a reorientation of the magneticmoments along the in-plane direction. This is supported by the decrease of the integratedintensity of the (100) reflection indicating that the magnetic moments align in the directionof the applied magnetic field along the a-axis.

5. Measurements and Results 71
Figure 5.30.: Magnetic field dependence of the integrated intensities of the first orderreflections (001) and (100) of the Fe50Pt45Rh5 film for different temperatures.The lines are guides to the eyes.
Figure 5.31.: Comparison of the temperature curves of the integrated intensities of the(001) and (100) reflection of the Fe50Pt45Rh5 film for 0T (black solidsquares), 1.5T (green triangles) and 3.5T (red open circles). The linesare guides to the eye.

72 5.4. Neutron Diffraction
Figure 5.32 shows the results of the polarization analysis of the second order reflection(002) and the first order reflection (100) at 1T for two distinct temperatures. It isimportant to note that the integrated intensity of the (001) reflection was too low inintensity to be analyzed at 1T and the application of higher magnetic fields was notpossible in the set-up without loosing the degree of polarization of the neutron beamto large parts. A problem arising in the set-up for higher magnetic fields is that thestray magnetic fields are perpendicular to the guide field and therefore influences thequantization axis of the neutrons. For the in-plane measurements it should be noted thatthe magnetic field is parallel to the scattering vector ~Q. As a consequence any signal inthis channel is of pure nuclear origin and no magnetic signal can be detected in the NSFchannel (see section 3.2.3).In contrast to the polarized measurements without a magnetic field, a splitting of bothNSF channels (++) and (- -) of the second order reflection (002) can be observed at anexternal magnetic field of 1T (compare with Fig. 5.14). A measure for the splitting isthe asymmetry ratio:
I++ − I−−
I++ + I−− , (5.20)
with I++ and I−− denoting the integrated intensities of both NSF channels. The asym-metry ratio at 1T has a value of about 9% which does not change with temperature asit is exemplarily shown for T=100K and T=300K. The splitting of the NSF channels isthe fingerprint of a FM contribution which should be also observed in the (001) reflectionindicating that the components of the magnetic moments are oriented along the appliedmagnetic field. The polarization analysis of the (100) reflection, on the other hand, isqualitatively identical to the analysis without a magnetic field. The strong magneticsignal in the SF channel indicates that components of the magnetic moments along theout-of-plane direction contribute to the peak intensity. This contribution decreases withtemperature. The NSF intensity is as discussed of pure nuclear origin.The results from the polarized and unpolarized neutron diffraction measurements for the
Fe50Pt45Rh5 film show that with the application of a magnetic field along the a-axis FMaligned magnetic moments pointing in the out-of-plane direction can be tilted along thedirection of the magnetic field which induces a FM order in the out-of-plane direction.The FM in-plane order, however, still remains indicating that a magnetic field of 3.5Twas not sufficient to saturate the sample and tilt all magnetic moments along the fielddirection.
Fe50Pt32.5Rh17.5 and Fe50Pt25Rh25
The neutron diffraction measurements of the Fe50Pt40Rh10 film shows an effect of themagnetic field even at low field values of about 2T (see Fig. 5.33). A similar behaviorcan be observed for the Fe50Pt45Rh5 film (see Fig. 5.34). In both cases the magnetic fieldwas directed in-plane. Measurements with even higher magnetic fields of 3.5T and thehighest possible temperature near the magnetic transition show no effect when the fieldis applied out-of-plane. The AF ordered Fe50Pt32.5Rh17.5 and the Fe50Pt25Rh25 film, onthe other hand, show no effect under the same conditions whether the magnetic field isapplied in the in-plane nor in the out-of-plane direction (see Fig. 5.35 and 5.36). TheAF structure of the film with x=17.5 could not be modified even by the application ofmagnetic fields up to 10T.

5. Measurements and Results 73
Figure 5.32.: Polarization analysis of the Fe50Pt45Rh5 film for the (002) and (100) reflec-tion at 1T for T=100K and T=305K. Plotted are the integrated intensitiesagainst the reciprocal lattice units (r.l.u.). The magnetic field was set alongthe [100]-direction (a-axis) of the film.
The measurements with the external magnetic field applied along the in-plane directionsdemonstrated that the field has an effect on the samples with low Rh concentration andthose samples which already showed FM behavior at zero magnetic field, i.e. Fe50Pt45Rh5
and Fe50Pt40Rh10. For the other samples which have a larger Rh concentration and areAF ordered, Fe50Pt32.5Rh17.5 and Fe50Pt25Rh25, no effect can be observed for fields up to3.5T. For the film with x=10 an induction of a FM order out-of-plane can be observedby the application of a magnetic field. Here, the measurements show a reorientation ofthe magnetic moments from the out-of-plane to the in-plane direction. The reorientationis accompanied with a lowering of the AF-FM transition temperature. The observedmagnetic field effect becomes stronger for higher temperatures. The neutron diffractionmeasurements with an external field on the film with x=5 also reveal an induction of a FMorder out-of-plane with a reorientation of the magnetic moments along the applied field.The influence of the temperature on the effects of the magnetic field is here in contrastto the Fe50Pt40Rh10 film significantly lower, i.e. the effect of the magnetic field becomesnot significantly stronger for higher temperatures.
5.4.3. Film Thickness
In the following section the influence of the film thickness on the magnetic properties andthe magnetic configuration will be investigated. In particular the Fe50Pt40Rh10 film isinteresting for this study since here the influence of the film thickness on the observedAF-FM transition can be investigated.

74 5.4. Neutron Diffraction
Figure 5.33.: Magnetic field dependence of the (001) and (1200) reflection of the
Fe50Pt40Rh10 film at T=258K for 0T (black squares) and 1.5T (open cir-cles). The magnetic field was directed along the b-axis.
Figure 5.34.: Magnetic field dependence of the (001) and (100) reflection of theFe50Pt45Rh5 film at T=311K for 0T (black squares) and 1.5T (open circles).The magnetic field was directed along the a-axis.

5. Measurements and Results 75
Figure 5.35.: Magnetic field dependence of the (001) and (1200) reflection of the
Fe50Pt32.5Rh17.5 film at T=250K for 0T (black squares) and 3.5T (opencircles). The magnetic field was directed in-plane along the b-axis.
Figure 5.36.: Magnetic field dependence of the (001) and (1200) reflection of the
Fe50Pt32.5Rh17.5 film at T=250K for 0T (black squares) and 3.5T (opencircles). The external magnetic field was applied in-plane along the b-axis.

76 5.4. Neutron Diffraction
unpolarized neutron diffraction
Figure 5.37 shows the unpolarized neutron diffraction measurements of three Fe50Pt40Rh10
films with different thicknesses of 100 nm, 300 nm and 500 nm. The half, first and secondorder reflections along the [001]- and [100]-direction were investigated. The behavior ofthe integrated intensities of the observed reflections resembles very much the previousmeasurements on the 200 nm thick Fe50Pt40Rh10 film. The integrated intensities of thehalf order reflections (001
2) and (1
200) decrease with increasing temperature. Fitting the
decay of the half order reflections with the power law 5.19 a transition temperature ofabout T ∗
00 1
2
= 377K and T ∗1
200
=282K can be determined for the in-plane and out-of-plane
reflections respectively, for all three films (see table 5.6). The integrated intensities ofthe (100) reflections, on the other hand, increase abruptly at T=250K and reach theirmaxima at about T=325K before they decrease again. The fitting of the decay of theintegrated intensities lead to a transition temperature of about T ∗
100=400K for the dif-ferent (100) reflections with respect to the error bars. The integrated intensities of theout-of-plane (001) reflections, on the other hand, are constant in all three films over thewhole temperature range indicating that they are of pure nuclear origin. The temperaturebehavior of the first order reflections should also be observed in the second order reflec-tions (002) and (200) as already discussed in section 5.2 but the fraction of the magneticcontribution to the peak intensity is once more to low to be determined. It should benoted that the raw data of the second order reflections indicate a temperature behaviorof the integrated intensity whose origin is non-magnetic. The data shown here have beencorrected for this behavior by the Debye-Waller (DW) factor. More information to theDW-factor can be found in the appendix.The only clear differences of the various film thicknesses which can be observed are thehigher integrated intensities of the thicker films due to larger amount of scatterer in thebeam and a faster decay of the integrated intensities of the half order reflections in thethicker films which can also be seen in the lower values of the transition exponents β∗ (seetable 5.6) indicating an AF-FM transition in a smaller temperature range.Compared to the 200 nm thick Fe50Pt40Rh10 film, the transition temperatures of the (001
2)
and the (1200) reflections are about T=50K and T=30K higher, respectively, while the
transition temperature of the (100) reflection is in good agreement with the one deter-mined for the 200 nm film (T ∗=414K±14K). Another difference is the appearance of theintegrated intensity of the (100) peak in a smaller temperature range.The observed differences to the 200 nm thick film can be attributed to the growth of twodifferent sample series: one series of the 200 nm thick composition dependent Fe50Pt50−xRhx
films and another for the thickness dependent films. Slight variations in the sample prepa-ration, e.g. slight variations of the growth temperatures, or random growth effects, canlead to slight differences in the film composition, i.e. in the Rh concentration and thereforeto a different magnetic behavior. The magnetic phase diagram of the bulk Fe50Pt50−xRhx
system in Fig. 2.2 showed that slight differences in the Rh concentration lead to drasticchanges of the magnetic behavior, in particular for Rh concentrations around x=10. Theappearance of the (100) reflection at higher temperature indicates a Rh concentrationslightly higher than x=10.
polarized neutron diffraction and magnetic field
The diffraction measurements with unpolarized neutrons have shown that the Fe50Pt40Rh10
films with different thicknesses have similar magnetic properties as the previously studied

5. Measurements and Results 77
Figure 5.37.: Temperature dependence of the integrated peak intensities for the 100 nm,300 nm and 500 nm Fe50Pt40Rh10 films at the half, first and second orderreflections along the [001]- (solid symbols) and the [100]-direction (opensymbols). The lines are fits to the power law 5.19.
(100) (0012) (1200)
100nm 425K±30K 378K±0.8K 285K±5K0.21±0.09 0.2±0.01 0.18±0.03
(200nm) 414K±14K 330K±4K 252K±3K0.29±0.06 0.24±0.03 0.21±0.06
300nm 409K±12K 378K±0.9K 281K±2K0.3±0.1 0.16±0.01 0.12±0.02
500nm 402K±3K 376K±0.8K 279K±6K0.23±0.06 0.11±0.01 0.08±0.02
Table 5.6.: Transition temperatures and exponents for the Fe50Pt40Rh10 films with differ-ent thicknesses from 100 nm to 500 nm. The values of the 200 nm thick filmwere taken from the previous section.

78 5.4. Neutron Diffraction
200 nm thick film. To verify that the magnetic configurations are also similar polarizedneutron diffraction with polarization analysis has been performed exemplarily on the500 nm thick film. Since the unpolarized scans show nearly identical behavior for the100 nm, 300 nm and 500 nm thick films it can be assumed that also the magnetic config-uration is nearly identical for all films.Four reflections (002), (001), (100) and (001
2) have been analyzed at two distinct temper-
atures at T=50K and T=305K where the film is purely AF and exhibits both magneticphases (AF/FM), respectively. The (200) and (1
200) reflection can not be observed here
due to limitations in the experimental set up (Q-range of the experiment and blind spotsof the superconducting magnet used for the experiment). Additionally the influence of amagnetic field applied along the b-axis was investigated by measuring the film at 0T and1T (see Fig. 5.38 and Fig. 5.39).In the polarized neutron diffraction measurements without magnetic field the out-of-planereflections (002) and (001) exhibit identical intensities in the NSF channels with no inten-sities in the SF channel. Moreover, no changes of these behaviors can be observed withtemperature indicating a pure nuclear contribution to their intensities.The in-plane (100) reflection also shows identical intensity in both NSF channels for bothtemperatures indicating once more a nuclear contribution to the (100) peak intensity. Inthe SF channel, on the other hand, intensity can be only observed at high temperatureswhich shows that a FM order is formed with components of the magnetic moments ori-ented in the out-of-plane direction.For the (001
2) reflection the intensities in the SF and NSF channel are identical. This
behavior does not change with temperature. Only an overall decrease in the intensitiesfor higher temperatures can be observed. The identical intensities of both SF and NSFchannels show that components of the magnetic moments along the a- and b-axis con-tribute to the scattering intensity of the (001
2) reflection.
The same series of polarized measurements were carried out with an applied field of 1Talong the b-axis and is shown in Fig. 5.39. At T=50K no differences to the polar-ization analysis without magnetic field can be observed. The polarized measurements atT=305K, on the other hand, show significant differences when a magnetic field is applied.The (002) reflection has still intensity in both NSF channels but at a field of 1T a slightsplitting between both channels is now present. A more significant splitting of the NSFchannels can be seen for the (001) reflection. Here, the intensity of one channel increasesdrastically while the intensity of the other NSF channel disappears in the backgroundsignal. The splitting in the NSF channels indicates a FM order with components of themagnetic moments oriented along the in-plane direction.For the (100) reflection again the strong SF channel can be observed. The NSF channels,on the other hand, split under the application of a magnetic field. The intensity observedin the SF channel as well as the splitting of the NSF channels is a strong indication thatthe FM order possess now components of the magnetic moments which are oriented alongthe in-plane as well as the out-of-plane direction.For the (001
2) reflection the application of the magnetic field leads at T=305K to an
increase of the SF intensity while the NSF intensity decreases. Still both components ofthe magnetic moments along the a- and b-axis contribute to the AF order but now thecontribution of the components perpendicular to the applied field is much stronger.
In summary of the polarized and unpolarized neutron diffraction investigations on theinfluence of the film thickness on the magnetic behavior of the Fe50Pt40Rh10 film one can

5. Measurements and Results 79
Figure 5.38.: Polarization analysis of the 500 nm Fe50Pt40Rh10 film for the (002), (001),(100) and (001
2) reflection at T=50K and T=305K.

80 5.4. Neutron Diffraction
Figure 5.39.: Polarization analysis of the 500 nm Fe50Pt40Rh10 film for the (002), (001),(100) and (001
2) reflection at T=50K and T=305K within an applied field
of 1T.

5. Measurements and Results 81
conclude that the film thickness in the range from 100 nm to 500 nm has no significantinfluence on the magnetic order or the transition temperature. At low temperature an AForder with magnetic moments oriented in the in-plane direction can be observed in all threefilms while at high temperature a transition to a FM order with the magnetic momentsdominantly oriented in the out-of-plane direction can be found. The only difference whichcan be attributed to the thickness is a faster decay of the integrated intensities of thehalf order reflections for the thicker films indicating an AF-FM transition in a smallertemperature range. Another effect of the film thickness is a higher scattering intensity ofthe thicker films due to the increased amount of scatterer in the beam.The measurements with an applied magnetic field of 1T showed that the field has noeffect at low temperature when the films are in the AF state while at high temperature aFM order out-of-plane can be induced with the magnetic moments tilted in the in-planedirection.The results are very similar to the one for the 200 nm thick Fe50Pt40Rh10 film differingin higher transition temperatures for the half order reflections and the appearance of the(100) reflection in a smaller temperature interval. As already pointed out these differencescan be explained by slight variations of the compositions. The measurements indicatesslightly higher Rh concentrations for the films with different thicknesses.
5.5. Discussion
The neutron diffraction data together with structure factor calculations presented in theprevious sections will be used in the following to develop models of the magnetic con-figurations of the different Fe50Pt50−xRhx films. The neutron diffraction measurementsgive detailed information about the magnetic origin and the orientation of the magneticmoments in different crystallographic planes in the Fe50Pt50−xRhx films, i.e. orientation ofthe magnetic moments in the in-plane (a-b-plane) or the out-of-plane (b-c-plane) direction(for more details see section 5.4). It allows in general to support models with differentmagnetic configurations if only the qualitative information retrieved from the measure-ments is considered. Therefore structure factor calculations are necessary to distinguishbetween these different configurations providing a quantitative measure of the observedintensities which can be compared to the experimental data. By the qualitative as wellas quantitative comparison of the measured peak intensities with the structure factorcalculations the magnetic configuration can be determined which supports the observedfeatures of the neutron diffraction measurements. The calculations base on the magneticunit cell of the bct L10 structure which is shown in Fig. 5.10 and consists of 8 Fe and8 Pt/Rh atoms. For simplification it will be assumed that only the Fe atoms carry amagnetic moment. As already discussed in section 2 the Pt/Rh-atoms of FePt and FeRhalloys carry no magnetic moment in the AF phase. In the FM phase, however, an induc-tion of magnetic moments on the Pt and Rh atoms, respectively, was proposed [35, 42]and can be therefore also expected for the Fe50Pt50−xRhx films. As already pointed out insection 2.1 for the FePt film the induction can be explained by the 8 Fe nearest neighborswhich surround one Pt/Rh atom. In the FM phase the magnetic moments of Fe have thesame orientation which leads to a resulting magnetization at the Pt site and induces amagnetic moment on it. In the AF phase, on the other hand, the magnetic moments ofthe Fe atoms have opposite orientations which give a zero magnetization at the Pt site.For the development of a consistent model of the magnetic configuration it is here notmandatory to consider the induction at the Pt/Rh sites since it can be assumed that the

82 5.5. Discussion
Figure 5.40.: In-plane and out-of-plane angles of the magnetic moment (gray arrow) tothe a- and c-axis.
induced magnetic moments of the Pt/Rh atoms orient in the same direction of the Femagnetic moments. As equations 5.16 and 5.17 show the additional magnetic momentwill only reduce or increase the magnetic contribution to the scattering intensity in case ofa first or second order reflection, respectively, but does not change the principle magneticconfiguration. Taking these assumptions into account the following can be concludedusing the equations 5.15 to 5.17:
1. Half order reflections are due to an AF order with a structure factor F given by:
F = 8pFe (5.21)
2. First order reflections have a nuclear origin with a possible FM contribution:
F+ = 8(bFe − bPt/Rh) + 8pFe (5.22)
F− = 8(bFe − bPt/Rh)− 8pFe. (5.23)
3. Second order reflections have the same magnetic origin as the first order reflectionsbut in general a stronger nuclear contribution:
F+ = 8(bFe + bPt/Rh) + 8pFe (5.24)
F− = 8(bFe + bPt/Rh)− 8pFe. (5.25)
The structure factors F+ and F− for the first and second order reflections consider themagnetic moments of the neutrons being parallel or antiparallel to the FM ordered mag-netic moments of the sample. In case of unpolarized neutrons it can not be distinguishedbetween both neutron states and the integrated intensity is given by: 1
2F 2+ + 1
2F 2− while
in the case of polarized neutrons a distinction is possible and the integrated intensityis given by: F 2
+ or F 2−. For the structure factor calculations of the proposed magnetic
configurations also the angles of the magnetic moments in respect to the a- and c-axisare taken into account (see Fig. 5.40). It is assumed that all magnetic moments have ingeneral the same angles α and β due to the fourfold symmetry of the bct structure.For the determination of the magnetic configuration also the tetragonal elongation of
the crystallographic structure along the c-axis has to be considered, i.e. one has to dis-tinguish between the in-plane and out-of-plane direction of the sample. The in-plane

5. Measurements and Results 83
directions along the a- and b-axis, on the other hand, are in principle interchangeable dueto the fourfold symmetry of the crystallographic structure as long as no external force,e.g. a magnetic field in the in-plane direction, is applied which removes this symmetry.One consequence is that the in-plane symmetry supports the presence of four differentdomains of equal probability. For simplicity the discussion will be here restricted to onlyone domain. In the other three domains the prospective proposed magnetic configurationis turned in-plane by 90, 180 and 270. In the following the 90 and 270 turned domainswill be called perpendicular domains and the one in detail discussed here and the 180
turned domains will be named parallel domains. For the calculations it is assumed thatall four domains contribute equally to the scattering signal and the integrated intensitycan be calculated from the sum over all four domains. As a consequence of the differentdomains an in-plane reflection, e.g. (1
200), whose intensity is due to components of the
magnetic moments in the in-plane direction has only contributions to two of the fourdomains, i.e. contributions of the parallel or the perpendicular domains. The magneticmoments in the other two domains have the same configuration but are turned 90 or270, respectively, and contribute to the intensity of the reflections in the other in-planedirection, e.g. (01
20). Out-of-plane reflections and in-plane reflections with contributions
of out-of-plane oriented magnetic moments have, on the other hand, contributions of allfour domains to their scattering intensity.Taking all these assumptions into account a model of the magnetic configuration can bedeveloped which can be used together with the structure factor calculations and the neu-tron diffraction measurements to determine the in-plane and out-of-plane angles α and βof the magnetic moments as well as the strength of the magnetic order as will be shownin the following.As already discussed before the integrated intensity is proportional to the structure fac-tor: I ∝ F 2. The structure factor of a magnetic reflection, on the other hand, includesa magnetic scattering length which is here expressed by p(T ). This term is proportionalto the magnetic scattering length p and a temperature dependent term which takes thestrength of the magnetic order into account. For the description of the temperature de-pendence often a power law similar to equation 5.18 is used. Since the integrated intensityis proportional to p(T ) it is a measure for the strength of a magnetic order and can beused to determine this strength as will be shown later.The following discussion will be divided in two parts. In the first part a model of themagnetic configuration of the Fe50Pt50−xRhx films will be developed. Here, the temper-ature and magnetic field results will be discussed as well as the influence of the differentFe50Pt40Rh10 film thicknesses on the magnetic configuration and its evolution. The sec-ond part includes an explanation of the different magnetic configurations and transitionsusing a phenomenological model.
5.5.1. Discussion and Model (Temperature)
In this part the influence of the temperature on the magnetic properties and the magneticconfigurations of the 200 nm thick Fe50Pt50−xRhx films will be discussed.The neutron diffraction measurements showed for the films with x=5 and x=17.5 only asingle magnetic state, i.e. a FM and an AF phase, respectively, until they become PM. Thetwo films will be discussed first followed by the film with x=10 which showed a temperaturedriven transition between these two magnetic phases. The measurements of the filmwith x=25 reveal only AF order until the film becomes PM but indicate temperature

84 5.5. Discussion
Figure 5.41.: Magnetic phase diagram of the Fe50Pt50−xRhx system. The black plotteddata are the values for the bulk system while the colored bars are the resultsof the 200 nm thick films.
driven transitions between different AF configurations. The results are summarized inthe magnetic phase diagram in Fig. 5.41.
Fe50Pt45Rh5
The neutron diffraction measurements of the Fe50Pt45Rh5 film reveal only a FM order inthe in-plane direction with the magnetic moments oriented along the c-axis. These resultsallow only one possible magnetic configuration which can be verified by structure factorcalculations and is presented in Fig. 5.42.It should be noted that the structure will be the same for all four domains and thereforeonly one domain is expected to contribute to the observed intensities. The magneticconfiguration proposed here leads to the following structure factors:
F002 = 8(bFe + bPt/Rh) (5.26)
F001 = 8(bFe − bPt/Rh) (5.27)
F200 = F020 = 8(bFe + bPt/Rh ± pFe sin β) (5.28)
F100 = F010 = 8(bFe − bPt/Rh ± pFe sin β) (5.29)
F111 =2√6· 8(bFe − bPt/Rh ± pFe sin β) (5.30)
F00 1
2
= F 1
200 = F 1
2
1
2
1
2
= 0. (5.31)
The prefactor 2√6
considers the projection of the magnetic moments along the c-axis ([001]-direction in the reciprocal space) onto a plane perpendicular to the [111]-direction. The± sign denotes the neutron spins being parallel or antiparallel to the magnetic momentsof the film.The FM order of the magnetic moments pointing along the c-axis reflects the fact thatthe in-plane first and second order reflections, (100) and (200), respectively, possess amagnetic contribution to the scattering intensity while the out-of-plane reflections (001)and (002) are purely nuclear. Only if the magnetic moments would have a non-zero angle

5. Measurements and Results 85
Figure 5.42.: Magnetic spin configuration of the Fe50Pt45Rh5 film.
to the c-axis (β 6= 90) the out-of-plane first and second order reflection would also have amagnetic contribution and a temperature behavior of the integrated intensities similar tothe in-plane reflections. The structure factor calculations show that the proposed magneticconfiguration is not only responsible for the magnetic contributions to the (200), (111)and (100) peak intensities, but also that magnetic contributions to the (020) and (010)peak intensity can be expected. The principle magnetic configuration outlined in Fig.5.42 remains stable over the whole temperature range until the film becomes PM aboveT=500K. In the FM regime the strength of the magnetic order decreases as expectedwith increasing temperature due to thermal fluctuations of the magnetic moments whichis associated with the decay of the integrated intensity of the first and second orderreflections along the [100]-direction.In case of the FM ordered Fe50Pt45Rh5 film the strength of the magnetic order can be
expressed by the magnetic scattering length p(T ) which can be determined by comparisonof the integrated intensities of the pure nuclear Bragg reflection (002) and the (100)reflection whose intensity has a magnetic contribution from a FM order:
I002I100
=F 2002
F 2100
=
[8(bFe + bPt/Rh)
]2
8[(bFe − bPt/Rh)2 + p2Fe(T ))
] , (5.32)
and subsequently:
pFe(T ) =
√I100(bFe + bPt/Rh)2
I002− (bFe − bPt/Rh). (5.33)
The results of this calculation are shown in Fig. 5.43.The out-of-plane orientation of the magnetic moments also explains that in the measure-ments with polarization analysis of the Fe50Pt45Rh5 film significant intensity was onlyfound in the SF channel for the (100) reflection as well as identical intensity in both NSFchannels for the (002) reflection. The increasing flipping ratio of the (200) reflection inFig. 5.15, on the other hand, can be attributed to the decreasing FM order.

86 5.5. Discussion
It should be noted that the model developed for the Fe50Pt45Rh5 film bases on the calcula-tions of the magnetic scattering length p(T ). The values of the magnetic scattering lengthhave been calculated from the integrated intensity ratio of the (002) and (100) reflection.To show that the calculated model is not only valid for the (100) reflection the integratedintensity ratios of the (002) reflection and the (200) and (111) reflection, respectively,whose intensities include a magnetic contribution have been calculated (see Fig. 5.44).The data of the (002)/(100) ratio in Fig. 5.44 is shown only for the sake of complete-ness since here the calculated and the measured data match perfectly because the modelbases on this ratio. For the (200) and (111) reflection the calculated ratio differs fromthe measured one but still shows the same temperature behavior. The slight differencewhich is almost within the error bars can be explained by different signal to noise ratiosfor each reflection. This can lead to an overrated or underrated intensity compared to thecalculated one. The data, however, show that the model developed for the Fe50Pt45Rh5
film is not only valid for the (100) but also for the other magnetic reflections.From the interpretation of the neutron diffraction data accordingly to the model pre-sented here one can conclude that only one domain exists with the magnetic momentsdirected in the out-of-plane direction. The MOKE measurements indicate, on the otherhand, that FM domains with opposite spin direction are present in the sample at zeromagnetic field as it was observed in Co/Pt [94, 80] or Co/Pd multilayer [95]. This con-tradiction can be resolved by taking the penetration depths of the neutrons and photonsinto account. Since the laser light in the visible regime penetrates only a few nanometers(20 nm - 30 nm) into the sample [92, 93] it can be concluded that the different stripeddomains observed in the MOKE measurements are only surface effects and do not reflectthe magnetic configuration inside the film.
Fe50Pt32.5Rh17.5
In contrast to the Fe50Pt40Rh10 the Fe50Pt32.5Rh17.5 film exhibits only a strong temper-ature dependent behavior for the half order reflections which are associated with an AForder while the first and second order reflections are quasi constant. The different halforder reflections (001
2), (1
200) and (1
21212) indicate that the AF order is also present along
both the in-plane and the out-of-plane direction. The application of structure factor calcu-lations, as pointed out at the beginning of the section, leads to the model of the magneticconfiguration shown in Fig. 5.45. In the proposed magnetic configuration componentsof the magnetic moments have an out-of-plane orientation along the c-axis at which thenearest neighbors have always opposite spin directions. This configuration gives an AForder in both in-plane directions, i.e. along the a- and b-axis, respectively. The in-planecomponents of the magnetic moments along the a-axis, on the other hand, are orientedin such a way that the resulting magnetic moments of the ground and first level haveopposite sign which also leads to an AF order along the c-axis. Moreover, the compo-nents of the magnetic moments along the b-axis form an AF order along the a-axis. The
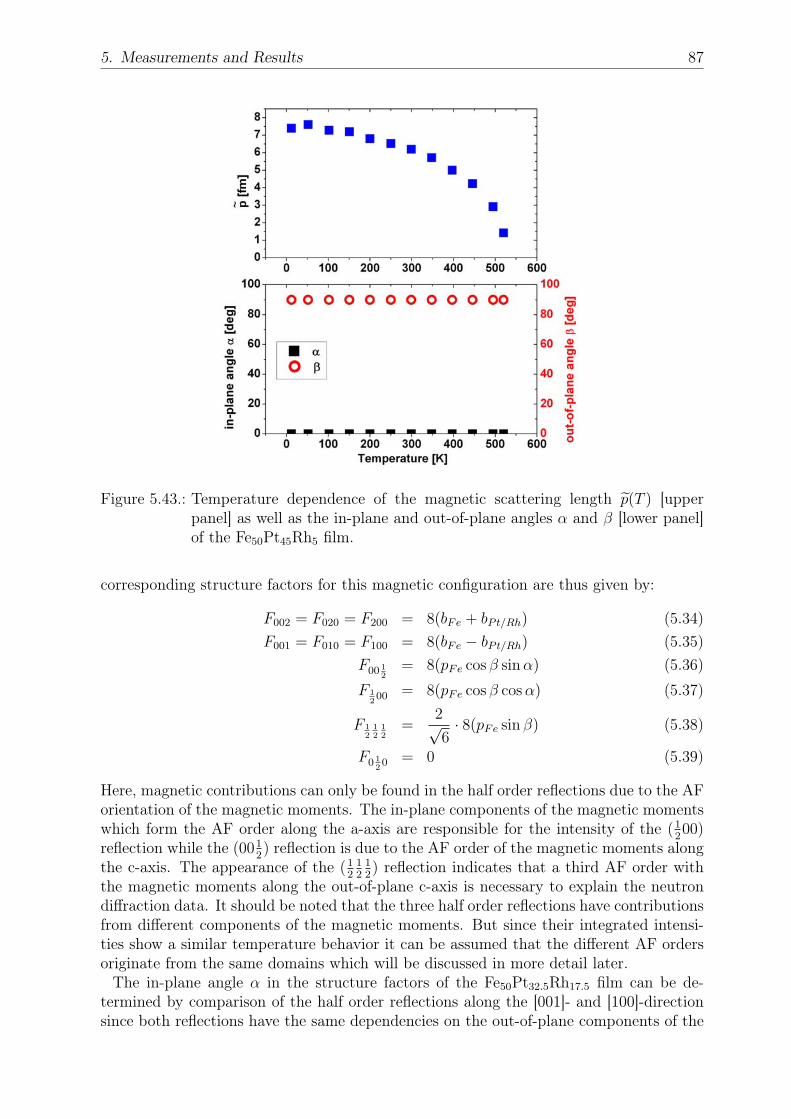
5. Measurements and Results 87
Figure 5.43.: Temperature dependence of the magnetic scattering length p(T ) [upperpanel] as well as the in-plane and out-of-plane angles α and β [lower panel]of the Fe50Pt45Rh5 film.
corresponding structure factors for this magnetic configuration are thus given by:
F002 = F020 = F200 = 8(bFe + bPt/Rh) (5.34)
F001 = F010 = F100 = 8(bFe − bPt/Rh) (5.35)
F00 1
2
= 8(pFe cos β sinα) (5.36)
F 1
200 = 8(pFe cos β cosα) (5.37)
F 1
2
1
2
1
2
=2√6· 8(pFe sin β) (5.38)
F0 1
20 = 0 (5.39)
Here, magnetic contributions can only be found in the half order reflections due to the AForientation of the magnetic moments. The in-plane components of the magnetic momentswhich form the AF order along the a-axis are responsible for the intensity of the (1
200)
reflection while the (0012) reflection is due to the AF order of the magnetic moments along
the c-axis. The appearance of the (121212) reflection indicates that a third AF order with
the magnetic moments along the out-of-plane c-axis is necessary to explain the neutrondiffraction data. It should be noted that the three half order reflections have contributionsfrom different components of the magnetic moments. But since their integrated intensi-ties show a similar temperature behavior it can be assumed that the different AF ordersoriginate from the same domains which will be discussed in more detail later.
The in-plane angle α in the structure factors of the Fe50Pt32.5Rh17.5 film can be de-termined by comparison of the half order reflections along the [001]- and [100]-directionsince both reflections have the same dependencies on the out-of-plane components of the

88 5.5. Discussion
Figure 5.44.: Integrated intensity ratios of the (002) reflection and the (200), (100) and(111) reflection for the measured data (black squares) and the ratios calcu-lated for the model of the Fe50Pt45Rh5 film (red open triangles).

5. Measurements and Results 89
Figure 5.45.: Magnetic spin configuration of the Fe50Pt32.5Rh17.5 film.
magnetic moments:
I00 1
2
I 1
200
=4F 2
00 1
2
2F 21
200
=4(8pFe(T ) cos β sinα)
2
2(8pFe(T ) cos β cosα)2= 2 tan2 α (5.40)
and solved for the in-plane angle α:
α = arctan
√I00 1
2
2I 1
200
. (5.41)
The factors 2 and 4 in the equation consider the different contributions from the par-allel and perpendicular domains to the in-plane and out-of-plane reflections as alreadydiscussed before. Only the parallel domains contribute to the scattering intensity of the(1200) reflection while all four domains contribute to the intensity of the (001
2) reflection.
The out-of-plane angle β, on the other hand, can be determined from the (121212) reflec-
tion since its integrated intensity is due to components of the magnetic moments in theout-of-plane direction:
I 1
2
1
2
1
2
I00 1
2
=F 2
1
2
1
2
1
2
F 200 1
2
=( 2√
6· 8pFe(T ) sin β)
2
(8pFe(T ) cos β sinα)2=
2
3· tan
2 β
sin2 α(5.42)
and consequently:
β = arctan
√√√√64I 1
2
1
2
1
2
sin2 α2566I00 1
2
. (5.43)
It should be noted that also the (121212) reflections has contributions from all four domains.
The calculated in-plane and out-of-plane angles are presented in Fig. 5.46 and show con-stant values for both angles over the whole temperature range (α ≈ 64, β ≈ 20). Thelower integrated intensities of the (1
200) and (1
21212) reflections compared to the one of

90 5.5. Discussion
the (0012) reflections can not be only explained by the angles. For the comparison also
the four domains and their different contributions to the reflections has to be consideredas discussed before. For the (1
21212) reflection additionally the projection of the magnetic
moments on a plane perpendicular to the [111]-direction has to be taken in to account.Since the angles of the magnetic moments are constant the observed decays of the in-tensities must be due to the decreasing strength of the AF order. As already discussedbefore it is assumed that the different AF orders of the Fe50Pt32.5Rh17.5 film are describedby the same domains. With this assumption the strength of the magnetic order can bedetermined by the comparison of the nuclear Bragg peak (002) and the (001
2) reflection
which is due to an AF order:
I002I00 1
2
=F 2002
F 200 1
2
=
[8(bFe + bPt/Rh)
]2
(8pFe(T ) cos β sinα)2, (5.44)
and solved for pFe(T ):
pFe(T ) =
√I00 1
2
(bFe + bPt/Rh)2
I002(cos β sinα)2. (5.45)
The results of the calculations are presented in Fig. 5.46 and show the decrease of theAF order.The AF orientation of the magnetic moments along the a-axis confirm that only intensityin the NSF channel can be detected in the polarization analysis of the (1
200) reflection.
The observation of equal intensity in both NSF and SF channel for the (0012) reflection
can be explained by the presence of four domains that contribute equally to the scatteringintensity of the out-of-plane half order reflection. In the parallel domains only compo-nents of the magnetic moments along the a-axis can be observed which are responsiblefor the intensity in the SF channel. In the perpendicular domains, on the other hand,the magnetic structure is turned 90 and 270, respectively, and the components of themagnetic moments are now aligned along the b-axis which leads to contributions in theNSF channel.It should be noted once more that the model presented here consists of four domains,i.e. two parallel and two perpendicular domains, which contribute equally to the scat-tering intensity of the reflections. Since all three half order reflections show a similartemperature behavior of the integrated intensity it can be assumed that the different AFconfigurations can be described by the same domain as shown in fig. 5.45. Assuming amodel with three different domains which are responsible for one of the AF reflections asit is shown in fig. 5.47 the integrated intensities of the half order reflections can be onlyexplained by different domain sizes or by different strength of the individual AF order inthe case of identical domain sizes which is very unlikely.The model developed for the Fe50Pt32.5Rh17.5 film bases on the calculations of the anglesα, β and the magnetic scattering length p(T ). In contrast to the Fe50Pt45Rh5 film theseparameters have been determined by the use of all measured magnetic reflections. Thecalculated and measured integrated intensity ratios of the (002) and (001
2), (1
200) and
(121212) reflection, respectively, match therefore perfectly and the data in Fig. 5.48 is only
shown for the sake of completeness.

5. Measurements and Results 91
Figure 5.46.: Temperature dependence of the magnetic scattering length p(T ) [upperpanel] as well as the in-plane and out-of-plane angles α and β [lower panel]of the Fe50Pt32.5Rh17.5 film.
Fe50Pt40Rh10
The discussion of the Fe50Pt50−xRhx films with x=5 and x=17.5 indicate that these filmsare in a single magnetic state and have therefore only one magnetic configuration untilthey become PM. The neutron diffraction measurements of the Fe50Pt40Rh10 film, on theother hand, reveal a temperature driven AF-FM transition indicating that at least aroundthe transition region two different magnetic configurations may coexist. The differentmagnetic configurations will be discussed in the following for selected temperature ranges.Below T<150K, the neutron diffraction data show the same features as observed forthe Fe50Pt32.5Rh17.5 film. All three half order reflections can be observed which show adecay of the integrated intensity. The first and second order reflections exhibit againno significant intensity changes indicating the absence of any FM order. Therefore themagnetic configuration will resemble the one for the film with x=17.5 (see Fig. 5.49).The only differences are slightly higher and lower values of the in-plane and out-of-planeangles α and β, respectively (see Fig. 5.50).At about T=150K the integrated intensities of the (100) and (111) reflection rise andassociated with that a FM order. The integrated intensities of the first and second orderreflection along the [001]-direction, on the other hand, are constant. Taking the structurefactor calculations and the results of the polarization analysis of the (100) reflection intoaccount which showed a SF signal, the FM order can be attributed to be a FM orderin the in-plane direction with components of the magnetic moments aligned along thec-axis. The AF configuration observed at low temperature is still present at T=150Kand the polarization analysis of the half order reflections shows similar results as forthe film with x=17.5. The intensity in the NSF channel for the (1
200) reflection can

92 5.5. Discussion
Figure 5.47.: Magnetic configuration of the Fe50Pt32.5Rh17.5 film separated in differentdomains a), b) and c). Domain a) is responsible for the AF (1
200) reflection.
Domain b) is responsible for the (0012) reflection and the intensity of the
(121212) reflection is caused by domain c).

5. Measurements and Results 93
Figure 5.48.: Integrated intensity ratios of the (002) reflection and the (0012), (1
200) and
(121212) reflection for the measured data (black squares) and the ratios calcu-
lated for the model of the Fe50Pt32.5Rh17.5 film (red open triangles).

94 5.5. Discussion
be again explained by the alignment of components of the magnetic moments along theb-axis while the intensity of the NSF and SF channel for the (001
2) reflection is due to
the parallel and perpendicular domains. In contrast to the polarization analysis of theFe50Pt32.5Rh17.5 film an intensity difference between both the NSF and the SF channel canbe observed which may indicate slightly different sizes of the parallel and perpendiculardomains. The occurrence of the FM order in the in-plane direction can be explained bythe nucleation of FM domains that replaces the AF domains. The AF and FM domainsin this model have the same magnetic configuration as for the Fe50Pt32.5Rh17.5 and theFe50Pt45Rh5 film, respectively (see Fig. 5.49). In the film with x=17.5 the parallel andperpendicular AF domains were homogeneous distributed. In the film with x=10 thepolarized neutron diffraction measurements indicate that the homogeneous distributionis disturbed. A possible explanation for this observation is that the nucleation processof the FM domains takes place in a localized region of the film, i.e. the FM domainsreplace AF domains in the perpendicular or the parallel domains, resulting in differentAF domain sizes.The AF reflections (001
2), (1
200) and (1
21212) have a similar temperature behavior as it was
observed in the Fe50Pt32.5Rh17.5 film therefore it can be again assumed that the differentAF configurations can be described by the same domains. A coexistence of the FM orderand the AF order in one domain can be excluded due to the conflict of the AF order andthe FM order in the in-plane direction which contribute to the integrated intensities ofthe (1
21212) and the (100) reflection, respectively. A coexistence of both reflections as it is
observed in the neutron diffraction measurements would not be possible. Due to theseconsiderations the further discussion of the Fe50Pt40Rh10 film will be restricted to themodel with different domains being either in the AF or FM state.In a temperature range between 150K<T<300K the integrated intensity of the (100) and
(111) reflection increases to their maxima while the intensity of the half order reflectionsdecreases until they vanish at different temperatures. The increase and decrease of theintegrated intensities, respectively, can be attributed to the decay and growth of theAF and FM domains, respectively. The different transition temperatures of the halforder reflections, on the other hand, can be explained by changes in the angles α andβ. Considering the integrated intensities of the half order reflections and the equations5.41 and 5.43 the results of the angels α and β shown in Fig. 5.50 can be derived. Itcan be seen that the magnetic moments turn in-plane with increasing temperature upto T=230K when β becomes finally zero and the (1
21212) reflection disappears. Starting
at T=230K, a further reorientation of the magnetic moments can be observed in thedirection of the a-axis. At about T=252K this process leads to an in-plane angle α of 90
and the disappearance of the (1200) reflection. Now only the AF order in the out-of-plane
direction remains with the magnetic moments aligned along the a-axis in the paralleldomains and along the b-axis in the perpendicular domains.Furthermore, at the temperature of T=300K both NSF and SF channel of the (001
2)
reflection now show nearly identical intensity which indicates that the contributions ofthe parallel and perpendicular domains are quasi equal. A very likely explanation is thatthe FM domains are now homogeneously distributed and have replaced the same sizes ofperpendicular and parallel AF domains.At about T=330K the (001
2) reflection disappears and only the (100) reflection remains
which is attributed to the complete replacement of the AF by the FM domains. TheFe50Pt40Rh10 film is now in a single domain state until it becomes PM above T=400K.The observed intensity decays of the FM reflections, in particular the (100) reflection,

5. Measurements and Results 95
Figure 5.49.: Magnetic spin configuration of the Fe50Pt40Rh10 film and its temperatureevolution.

96 5.5. Discussion
can not be explained by the domain replacement but by the decrease of the strength ofthe magnetic order. For the calculation of the magnetic scattering length p(T ) which isa measure of the strength of the magnetic order in the system, here, both the AF andthe FM domains have to be taken into account. The results are shown in Fig. 5.50 usingthe equations 5.45 and 5.33. The increase and decrease of the magnetic scattering lengthp(T ) for the FM and AF domains, respectively, can again be attributed to the growthand decrease of the domain sizes. Taking the sum of the observed magnetizations of bothdomains the magnetic strength of the whole Fe50Pt40Rh10 film remains quasi constantup to T=300K. For higher temperatures a decrease of the overall magnetic order can befound which is responsible for the observed intensity decays of the different reflections, inparticular of the (100) reflection.The model presented here of the Fe50Pt40Rh10 film bases on the angles α, β and themagnetic scattering length p(T ) which have been calculated by the use of the integratedintensities of the AF (001
2), (1
200), (1
21212) and the FM (100) reflection. The calculated and
measured ratios of the (002) reflection and these reflection match therefore perfectly as canbe seen in Fig. 5.51. The calculated ratio of the (002) and (111) reflection, on the otherhand, differs from the measured one. This can again be attributed to the different signal tonoise ratios of the individual reflections and an overrated or underrated measured intensitycompared to the calculated one. The measured and calculated data, however, show boththe same temperature dependence. Both ratios decrease with increasing temperature upto about T=300K before the ratio increases again. This behavior shows that the modeldeveloped here is not only valid for the reflections (001
2), (1
200), (1
21212) and (100) which
are the basis of the model but also for other magnetic reflections.
Fe50Pt25Rh25
The neutron diffraction data of the Fe50Pt25Rh25 film reveal similar to the film withx=10 temperature driven magnetic transitions. In contrast to the Fe50Pt40Rh10 film thesetransitions occur here between different AF orders. The different AF configurations willbe discussed in the following for selected temperature ranges.Below T=150K only the half order reflection along the [111]-direction is present and showsan intensity decay with increasing temperature. The first and second order reflections,on the other hand, are constant indicating the absence of FM order. The models of theFe50Pt32.5Rh17.5 and the Fe50Pt40Rh10 film showed that the (1
21212) reflection is due to out-
of-plane components of the magnetic moments taking this into account the same can beassumed for the (1
21212) reflection of the Fe50Pt25Rh25 film as it is shown in Fig. 5.52.
From about T=150K intensity at the (0012) and (1
200) reflection can be observed and
associated with this is the appearance of a different AF order. The integrated intensitiesof both reflections increase up to maxima at about T=300K and T=350K, respectively.The polarization analysis showed not only intensity in both the NSF and the SF channelfor the (001
2) reflection as it was found in the film with x=17.5 but also in the (1
200)
reflection. It indicates that the magnetic moments aligned along the b- and c-axis forman AF order in the in-plane direction along the a-axis and contribute to the intensity ofthe (1
200) reflection. The intensity of the (001
2) reflection, on the other hand, is due to
components of the magnetic moments along the a-axis which form an AF order in theout-of-plane direction. Considering the increase and decrease of the integrated intensitiesof the (001
2), (1
200) and (1
21212) reflections, respectively, and the coexistence of these peaks

5. Measurements and Results 97
Figure 5.50.: Temperature dependence of the magnetic scattering length p(T ) [upperpanel] and the in-plane and out-of-plane angles α and β [lower panel] ofthe Fe50Pt40Rh10 film. Note: only the angles of the AF domain are shownsince in the FM domain all magnetic moments are oriented in the out-of-plane direction (β = 90).

98 5.5. Discussion
Figure 5.51.: Integrated intensity ratios of the (002) reflection and the FM (100) and(111) reflection as well as the AF (001
2), (1
200) and (1
21212) reflections for the
measured data (black squares) and the ratios calculated for the model of theFe50Pt40Rh10 film (red open triangles).

5. Measurements and Results 99
over a temperature range between T=150K and T=300K, the presence of two differentdomains can be expected. The AF order responsible for the (1
21212) peak intensity can
be associated with one domain which will be called in the following domain I and theAF order responsible for the other half order reflections (001
2) and (1
200), respectively, is
present in a different domain named in the following domain II. The decay and increaseof the integrated intensities of the half order reflections can be thus explained by thenucleation and growth of domain II which substitutes domain I. This process is completedat about T=275K where only domain II remains in the film. It should be noted thatdomain I is a single domain while domain II represent four equivalent domains, i.e. twoparallel and two perpendicular domains, as it was already discussed before. These domainsare again responsible for the identical intensity of the SF and NSF channel of the (001
2)
reflection.Another strong indication of the presence of two different domains is the out-of-plane
component of the magnetic moments observed for the (1200) reflection. These components
form alternating FM layers along the a-axis which contribute to the peak intensity of the(1200) reflection but not to the (1
21212) reflection due to destructive interference. Since this
AF order of the (1200) reflection is in conflict with the AF order that is responsible for
the peak intensity of the (121212) reflection both AF orders can not coexist in the same
domain. The integrated intensities of the (0012) and (1
200) reflection, on the other hand,
show a similar temperature behavior and it can be assumed that their AF configurationoriginates from the same domains. Therefore the model of two different domains will beused for the further discussion of the magnetic configuration. Considering both domainsthe following structure factors can be derived:
F002 = F020 = F200 = 8(bFe + bPt/Rh) (5.46)
F001 = F010 = F100 = 8(bFe − bPt/Rh) (5.47)
F00 1
2
= 8(pFe cos β sinα) (5.48)
F 1
200 = 8(pFe cos β cosα + pFe sin β) (5.49)
F 1
2
1
2
1
2
=2√6· 8(pFe sin β) (5.50)
F0 1
20 = 0. (5.51)
The decrease and growth of the different domains is not sufficient to explain all observedtemperature features of the integrated intensities. In particular it can not explain thedifferent maxima of the half order reflections in domain II nor the change in the NSF toSF ratio of the (1
200) reflection with temperature. Therefore also a reorientation of the
magnetic moments in domain II must take place. This is reflected in the in-plane andout-of-plane angles α and β. It is important to note that the calculation of the anglesdiffers from the other films due to the out-of-plane components of the magnetic momentsthat contribute to the (1
200) peak intensity. This fraction can be determined from the
polarization analysis of the half order in-plane reflection by comparison of the NSF andthe SF intensity leading to the expression:
I00 1
2
xI 1
200
=4F 2
00 1
2
2F 21
200
=4(8pFe(T ) cos β sinα)
2
2(8pFe(T ) cos β cosα)2= 2 tan2 α, (5.52)

100 5.5. Discussion
Figure 5.52.: Magnetic spin configuration of the Fe50Pt25Rh25 film and its temperatureevolution.
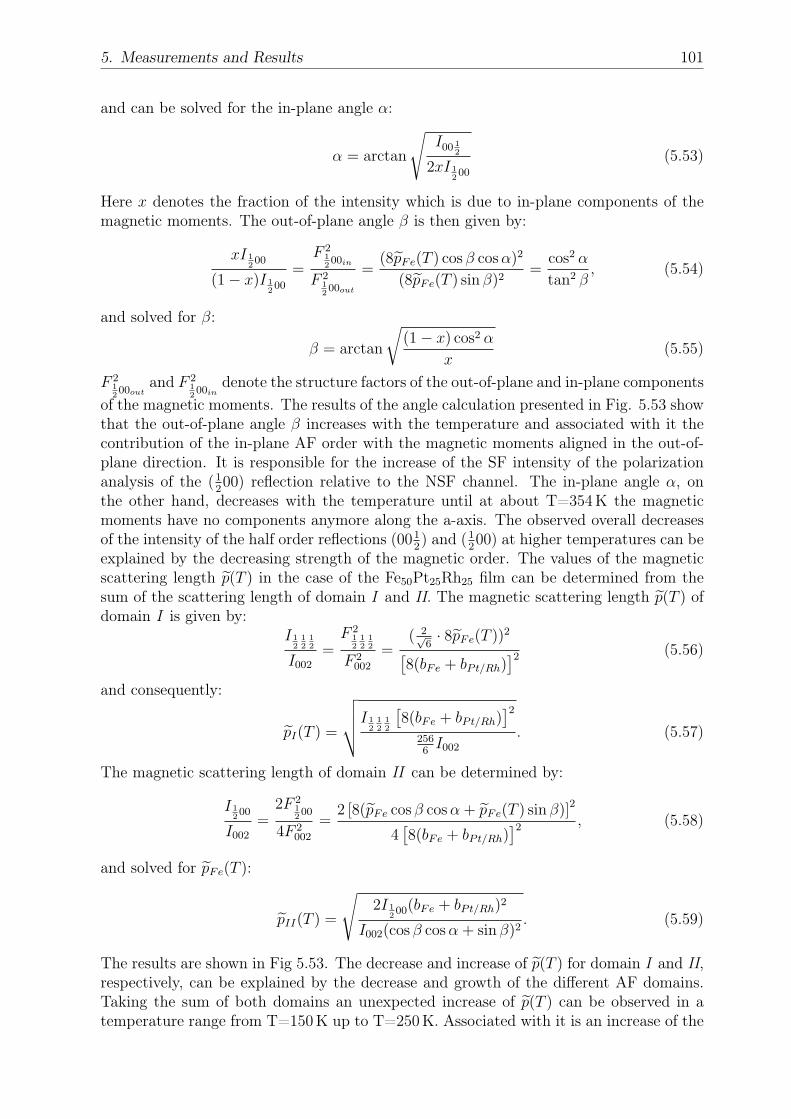
5. Measurements and Results 101
and can be solved for the in-plane angle α:
α = arctan
√I00 1
2
2xI 1
200
(5.53)
Here x denotes the fraction of the intensity which is due to in-plane components of themagnetic moments. The out-of-plane angle β is then given by:
xI 1
200
(1− x)I 1
200
=F 2
1
200in
F 21
200out
=(8pFe(T ) cos β cosα)
2
(8pFe(T ) sin β)2=
cos2 α
tan2 β, (5.54)
and solved for β:
β = arctan
√(1− x) cos2 α
x(5.55)
F 21
200out
and F 21
200in
denote the structure factors of the out-of-plane and in-plane componentsof the magnetic moments. The results of the angle calculation presented in Fig. 5.53 showthat the out-of-plane angle β increases with the temperature and associated with it thecontribution of the in-plane AF order with the magnetic moments aligned in the out-of-plane direction. It is responsible for the increase of the SF intensity of the polarizationanalysis of the (1
200) reflection relative to the NSF channel. The in-plane angle α, on
the other hand, decreases with the temperature until at about T=354K the magneticmoments have no components anymore along the a-axis. The observed overall decreasesof the intensity of the half order reflections (001
2) and (1
200) at higher temperatures can be
explained by the decreasing strength of the magnetic order. The values of the magneticscattering length p(T ) in the case of the Fe50Pt25Rh25 film can be determined from thesum of the scattering length of domain I and II. The magnetic scattering length p(T ) ofdomain I is given by:
I 1
2
1
2
1
2
I002=F 2
1
2
1
2
1
2
F 2002
=( 2√
6· 8pFe(T ))
2
[8(bFe + bPt/Rh)
]2 (5.56)
and consequently:
pI(T ) =
√√√√I 1
2
1
2
1
2
[8(bFe + bPt/Rh)
]22566I002
. (5.57)
The magnetic scattering length of domain II can be determined by:
I 1
200
I002=
2F 21
200
4F 2002
=2 [8(pFe cos β cosα + pFe(T ) sin β)]
2
4[8(bFe + bPt/Rh)
]2 , (5.58)
and solved for pFe(T ):
pII(T ) =
√2I 1
200(bFe + bPt/Rh)2
I002(cos β cosα + sin β)2. (5.59)
The results are shown in Fig 5.53. The decrease and increase of p(T ) for domain I and II,respectively, can be explained by the decrease and growth of the different AF domains.Taking the sum of both domains an unexpected increase of p(T ) can be observed in atemperature range from T=150K up to T=250K. Associated with it is an increase of the

102 5.5. Discussion
Figure 5.53.: Temperature dependence of the magnetic scattering length p(T ) [upperpanel] as well as the in-plane and out-of-plane angles α and β [lower panel]of the Fe50Pt25Rh25 film. Note: only the angles of domain II are shown sincein domain I all magnetic moments are oriented in the out-of-plane direction(β = 90).
magnetic strength. The reason for this behavior is not known at the present stage. Apossible explanation would be a different value of the magnetic moment for the differentAF configurations of domain I and II. Similar to the different magnetic moment observedin the Q1- and Q2-phase of FePt3 [34] (see section 2.1). Above T=250K the strength ofthe magnetic order decreases again which is responsible for the decay of p(T ).The model of the magnetic configuration for the Fe50Pt25Rh25 film bases on the integratedintensities of the AF reflections (001
2), (1
200) and (1
21212). These intensities have been used
to calculate the angles α, β and the magnetic scattering length p(T ). It is important tonote that in contrast to the other films the angle β has been calculated only by the use ofthe intensity of the (1
200) reflection (see equation 5.54). As a consequence the calculated
and measured (002)/(1200) ratio matches perfectly (see Fig. 5.54 ). The same is true for
the integrated intensity ratio of the (002) and (121212) reflection since all values of domain
I base on this ratio. The (002)/(0012) ratio is calculated considering both angles α, β and
the magnetic scattering length p(T ). The calculated ratio differs only slightly from themeasured one and shows that all parameters, in particular the angle β, are well definedand are able to describe the temperature behavior of the (002)/(001
2) ratio. The almost
perfect match of the data indicates here again that the magnetic configuration of theFe50Pt25Rh25 film is not only valid for the magnetic reflections used to develop the modelbut also for all other magnetic reflections.
In summary of this section one can conclude that the 200 nm thick Fe50Pt45Rh5 and theFe50Pt32.5Rh17.5 film are in a single magnetic state with only one magnetic configuration

5. Measurements and Results 103
Figure 5.54.: Integrated intensity ratios of the (002) reflection and the (0012), (1
200) and
(121212) reflection for the measured data (black squares) and the ratios calcu-
lated for the model of the Fe50Pt25Rh25 film (red open triangles).

104 5.5. Discussion
x=5 x=10 x=17.5 x=25F00 1
2
0 8pFe sinα cosβ 8pFe sinα cosβ 8pFe sinα cosβ
F0 1
20 0 0 0 0
F 1
200 0 8pFe cosα cosβ 8pFe cosα cosβ 8pFe cosα cosβ+
8pFe sinβ
F 1
2
1
2
1
2
0 16√6pFe sinβ
16√6pFe sinβ
16√6pFe sinβ
F 1
2
1
20=
F 1
20 1
2
= 0 0 0 0
F0 1
2
1
2
F001 8(bFe − bPt/Rh) 8(bFe − bPt/Rh) 8(bFe − bPt/Rh) 8(bFe − bPt/Rh)
F010= 8(bFe − bPt/Rh+ 8(bFe − bPt/Rh+ 8(bFe − bPt/Rh) 8(bFe − bPt/Rh)
F100 pFe sinβ) pFe sinβ)
F1112√6· 8(bFe− 2√
6· 8(bFe− 2√
6· 8(bFe− 2√
6· 8(bFe−
bPt/Rh) + pFe sinβ) bPt/Rh) + pFe sinβ) bPt/Rh) bPt/Rh)
Table 5.7.: Structure factors for the parallel domains of the proposed magnetic configura-tions of the different Fe50Pt50−xRhx films.
(FM for x=5 and AF for x=17.5) until they become PM. The Fe50Pt40Rh10 film shows atemperature driven transition between these two magnetic configurations. The neutrondiffraction measurements of the Fe50Pt25Rh25 film reveal also magnetic transitions buthere between different AF order. The magnetic transitions in both films can be explainedby the nucleation and growth of FM and AF domains, respectively, with temperature.The decreases of the integrated intensity of the magnetic reflections in the four filmscan be explained by temperature effects. Thermal fluctuations of the magnetic momentsreduce their correlation and associated with this the strength of the magnetic order.It should be kept in mind that the calculations of the angles α and β as well as the magneticscattering length p(T ) base on the relative integrated intensities of the different reflections.For the correction of the Q-dependence of the magnetic moment the values of Fe wasused. Therefore the actual magnetic form factor of the different Fe50Pt50−xRhx alloys candiffer from the used one and associated with that the relative integrated intensities. Theproposed magnetic configurations, however, will change only slightly as long as the valuesdiffer not too drastic from the one of Fe.The FM configuration proposed here with the magnetic moments directed out-of-planealong the c-axis that leads to the (100), (200) and (111) reflections was also theoreticallyproposed for the FePt alloy [99]. For the FeRh alloy three different AF configurations weretheoretically proposed [100]: An AF configuration where the magnetic moments of thenearest neighbors point in different directions (see fig. 5.47 domain c)), a configurationwhere the magnetic moments of the first and ground level have opposite spin directions(see fig. 5.47 domain b)) and an AF configuration of the magnetic moments along thea-axis, where the magnetic moments of the first and the ground level have the sameorientation (see fig. 5.47 domain a)). The first AF configuration is responsible for the(121212) reflection in the model presented here for the Fe50Pt50−xRhx alloys while the latter
give intensity for the (0012) and (1
200) reflections, respectively. It should be noted that
for the FeRh alloys these different configurations do not coexist in one alloy. They havedifferent energy minima and therefore different probabilities depending on the latticeconstants [100].

5. Measurements and Results 105
Figure 5.55.: Magnetic phase diagram of the different Fe50Pt50−xRhx films. The greyplotted data are the values for the bulk system while the colored bars arethe results of the 200 nm thick films with the application of an externalmagnetic field.
5.5.2. Discussion and Model (Magnetic Field)
The neutron diffraction measurements of the Fe50Pt32.5Rh17.5 and the Fe50Pt25Rh25 sampleshowed that both AF ordered films are not affected by the application of magnetic fields upto 10T and 3.5T, respectively. The neutron data of the Fe50Pt45Rh10 and the Fe50Pt45Rh5
film, on the other hand, reveal an induction of a FM out-of-plane order when the fieldis applied in-plane. The results of the magnetic field application are summarized in Fig.5.55. In the following the change of the magnetic configuration will be discussed in moredetail, taking into account the results of the structure factor calculations.
Fe50Pt45Rh5
The neutron diffraction measurements of the Fe50Pt45Rh5 film revealed that without amagnetic field the magnetic moments point along the c-axis associated with a FM contri-bution to the intensity of the (100) reflection. When a magnetic field is applied in-planealong the a-axis the integrated intensities of the (001) and (100) reflection increases anddecreases, respectively, which can be attributed to a reorientation of the magnetic mo-ments in the field direction as already discussed before (see Fig. 5.56). Since the field isdirected parallel to the scattering vector ~Q for the (100) reflection only components of themagnetic moments perpendicular to it can be detected and consequently the reorienta-tion in field direction leads to a decay of its intensity. The reorientation of the magneticmoments is also confirmed by the polarization analysis. Without an external magneticfield both NSF channels of the (002) reflection have identical intensity while under theapplication of a magnetic field a splitting of both NSF channels can be observed whichis caused by the in-plane components of the magnetic moments. The intensity in the SFchannel of the (100) reflection, on the other hand, is due to the still present out-of-planecomponents of the magnetic moments.From the neutron diffraction data it can not be distinguished between the scenario of acontinuous turning of the moments or a nucleation and growth of domains with magnetic

106 5.5. Discussion
Figure 5.56.: Magnetic configuration of the Fe50Pt45Rh5 film when a magnetic field isapplied parallel to the a-axis.
moments oriented along the field.No saturation of the Fe50Pt45Rh5 film is reached for fields up to 3.5T. For a temperatureof T=250K a saturation field of about 6T can be extrapolated from the decay of theintegrated intensity of the (100) reflection.
Fe50Pt40Rh10
The Fe50Pt40Rh10 film showed without the application of a magnetic field intensity changesof the (100) reflection and the half order reflections which were attributed to the presenceof different domains, i.e. domains with FM order and domains with an AF order. Theother peak intensities were quasi constant. The neutron diffraction measurements withan external magnetic field applied in the in-plane direction along the b-axis, show similarto the film with x=5 an intensity increase of the (001) reflection but also a slight increaseof the (100) peak intensity. This behavior can be explained by the reorientation of themagnetic moments in the in-plane direction along the applied field. In the FM domainthe reorientation is similar to the Fe50Pt45Rh5 film. The magnetic moments turn from theout-of-plane to the in-plane direction (see Fig. 5.57). In contrast to the Fe50Pt45Rh5 filmthe scattering vector ~Q for the (100) reflection is here perpendicular to the external fieldand both components of the magnetic moments can be detected. As a consequence theintegrated intensity of the peak would not be influenced by the reorientation. Thereforethe observed increase of the intensity must be associated with a change of the magneticmoments in the AF domain forming a FM order. This assumption can be confirmed by theintensity decreases of the half order reflections (001
2) and (1
200) with the magnetic field.
The neutron diffraction measurements of the half order reflection at a certain temperatureshowed that the integrated intensities of both reflections vanish at different values of themagnetic field. It indicates that the reorientation of the magnetic moments is a continuousprocess and not a nucleation of FM domains which replaces the AF order. Otherwise theintegrated intensities should disappear at the same values of the magnetic field. By thecontinuous reorientation of the magnetic moments in field direction the components alongthe b-axis form a FM order along the a- and c-axis while components of the magneticmoments along the a-axis are still AF ordered along the c-axis (see Fig. 5.58). TheFM order along the a- and c-axis leads to an additional magnetic contribution to theintensities of the (001) and (100) reflections and explains the observed intensity increaseof the (100) peak.

5. Measurements and Results 107
Figure 5.57.: Magnetic configuration of the Fe50Pt40Rh10 film in the FM domains when amagnetic field is applied parallel to the b-axis.
The comparison of the Fe50Pt40Rh10 and the Fe50Pt45Rh5 film showed that the filmwith x=5 is in a single domain state and that by the application of an external mag-netic field the magnetic moments orient in its direction. The film with x=10 exhibits twodifferent domains with AF and FM order, respectively. The magnetic moments in theFM domain behave similar to the one of the film with x=5. The magnetic moments inthe AF domains, on the other hand, orient continuously in the field direction providingan additional magnetic contribution to the first order reflections. This additional FMcontribution increases with the temperature and is responsible for the observed intensityincrease of the first order reflection with the temperature at a certain magnetic field (seeFig. 5.29).
5.5.3. Discussion and Model (Film Thickness)
The neutron diffraction measurements of the Fe50Pt40Rh10 films with thicknesses from100 nm to 500 nm show similar results for the half, first and second order reflections alongthe [001]- and [100]-direction as for the previously discussed 200 nm thick film. Thereforealso the magnetic configurations will resemble the one determined for the 200 nm thickFe50Pt40Rh10 film (see Fig. 5.49). As already discussed in the section 5.4.3 the only differ-ences are higher transition temperatures and thus the nucleation of the FM domain takesplace at higher temperatures and a smaller temperature range for the AF-FM transition.The shift of the temperature behavior can be attributed to slight differences in the Rhconcentrations of both sample series.The decay of the integrated intensities of the half order reflections indicate a slower de-crease for the thinner films as is expected for a second order transition. The slower decayis also reflected in the higher values of the critical exponents for the thinner films. Theresult is in good agreement with the investigations by Yuasa who found a first orderAF-FM transition in the bulk Fe50Pt40Rh10 system [17]. The transition temperature ofabout T=150K determined for the bulk system is also in good agreement with the nu-cleation temperature of the FM domains observed for the 200 nm thick film while the100 nm, 300 nm and 500 nm thick films have a nucleation temperature of about T=250K.Considering the magnetic phase diagram of the bulk system and the higher nucleationtemperature of the FM domains it indicates a Rh concentration of about 11% instead of

108 5.5. Discussion
Figure 5.58.: Temperature dependence of the magnetic configuration of the Fe50Pt40Rh10
film in the AF domains when a magnetic field is applied parallel to theb-axis.

5. Measurements and Results 109
10%.The polarization analysis of the 500 nm thick Fe50Pt40Rh10 film with an external appliedmagnetic field indicate similar to the 200 nm thick film a reorientation of the magneticmoments in field direction. The intensity splitting of the NSF channels of the first andsecond order reflections as well as the intensity difference between the SF and the NSFchannel of the (001
2) reflection showed that in the FM and the AF domains a reorienta-
tion of the magnetic moments in field direction takes place. In the latter case the appliedmagnetic field leads to a symmetry breaking. The effect of the magnetic field is moresignificant on the perpendicular domains than for the parallel domains due to the smallerangle of the magnetic moments to the applied field.As already discussed before a reduction of the magnetic ordering temperature with de-creasing thickness as it is observed in several FM and AF systems [101, 102] due tofinite size effects can not be observed for the Fe50Pt40Rh10 films with thicknesses down to100 nm. Even Fe50Pt50−xRhx films with thicknesses of about 6 nm studied recently withmacroscopic techniques, e.g. vibrating sample magnetometer and super conducting inter-ference device, by Hasegawe at al. [103] showed similar magnetic ordering temperaturesas observed in this work.It should be noted that the thickness of 6 nm is beyond the feasibility of neutron diffractionexperiments at today’s neutron facilities. The limit of the thickness for the Fe50Pt50−xRhx
films can be determined from the signal to noise ratio of the raw data of the (100) reflec-tions at about T=330K. This ratio decreases from 3.6 for the 500 nm thick film to 2.9 forthe 300 nm film down to 1.4 for the 100 nm thickness. This indicates a film thickness ofabout 50 nm as the limit for neutron diffraction experiments on these samples at today’sinstruments and neutron facilities.
5.5.4. Theoretical Discussion
As mentioned in the introduction the magnetic moments of the Fe atoms in FeRh systemswith equiatomic composition are oriented in the in-plane direction without any consid-erable crystallographic anisotropy. In FePt compounds, however, the magnetic momentsare oriented dominantly in the out-of-plane direction. Obviously the magnetic anisotropydepends strongly on the composition and in particular on the elements which are used inthe alloy with the Fe compound. The question arising here is what kind of anisotropy isresponsible for the observed transitions and thus leads to the magnetic configurations inthe Fe50Pt50−xRhx alloys which were observed in this work.The transition from a dominant AF order along the in-plane to the out-of-plane directionor to a dominant FM order in the in-plane direction with decreasing Rh concentrationwill be described in the following by a phenomenological model. The isotropic Heisenbergexchange model is often used to describe a magnetic structure in a system [104, 105] butit does not take into account different anisotropies. Therefore the isotropic Heisenbergmodel is not sufficient to describe the magnetic configurations in the tetragonal elongatedFe50Pt50−xRhx films with their different spin orientations, e.g. in-plane or out-of-plane,depending on the Rh concentration. Instead a bilinear anisotropic Hamiltonian with adirection-dependent exchange constant plus an one-ion anisotropy term is used for thedescription which can be written as:
H = Hex + Han. (5.60)

110 5.5. Discussion
Here, Hex is a two-ion term and Han an one-ion interaction which describe the anisotropicexchange between the spins and their orientation along the different symmetry directionsof the system, respectively. It should be noted that Hex uses a bi-linear anisotropicHamiltonian with a direction dependent exchange term. For simplification the followingassumptions are made: Only the Fe atoms carry a magnetic moment and only the nearestneighbors are taken into account. The exchange between the atoms can be described bythe exchange parameter J i
e:
J ie =
Jzex Jx
ex Jyex
Jzey Jx
ey Jyey
Jzez Jx
ez Jyez
. (5.61)
The absolute values of the matrix elements will be assumed to be in the simplified modelidentical in all three symmetry directions x, y and z. The different directions are linked tothe symmetry axis of the crystal by: x=a, y=b and z=c. Changes and extensions to over-come the simplified model if necessary will be discussed later. In the here assumed modelFM and AF order of neighboring spins can be expressed by −J i
e and +J ie, respectively.
With |J | = |J ie| the matrix can be now written as:
J = |J |
±1 ±1 ±1±1 ±1 ±1±1 ±1 ±1
(5.62)
with the appropriate and independent choice of the sign of any of the components.The two-ion term can be written as [106, 107, 108]:
Hex =∑
j,i,e
J ieS
ijS
ij+e (5.63)
with j denoting the radius-vector of any Fe ion position, i = x, y, z and e are the unitvectors of the Cartesian system. Taking into account the three directions of the crystalit can be written: Hex = Hex
x + Hexy + Hex
z . Here, every term describes the exchangebetween ions spatially arranged in the corresponding direction:
Hexx = ±J
∑
j
SzjS
zj+ex ± J
∑
j
Sxj S
xj+ex ± J
∑
j
Syj S
yj+ex
(5.64)
Hexy = ±J
∑
j
SzjS
zj+ey ± J
∑
j
Sxj S
xj+ey ± J
∑
j
Syj S
yj+ey
(5.65)
Hexz = ±J
∑
j
SzjS
zj+ez ± J
∑
j
Sxj S
xj+ez ± J
∑
j
Syj S
yj+ez
. (5.66)
The moments can be now expressed in terms of spherical system coordinates, i.e. Sj =S(sin θj cosφj, sin θj sinφj, cos θj). The spherical angles shown in Fig. 5.59 are connectedwith the previously introduced angles α and β by the relations α = φ and β = π
2− θ. In
the next step the minimum of the energy has to be determined by minimizing the threeterms of the exchange Hamiltonian. For some cases several minima can be achieved whichgive the proper magnetic order between the nearest neighbors. By the use of the one-ionanisotropy Han the orientation of the magnetic moments along the symmetry directionscan be described and it can here be used to distinguish between the different minima ofthe exchange Hamiltonian Hex. The one-ion anisotropy term Han can be expressed as

5. Measurements and Results 111
Figure 5.59.: Spherical angles of the magnetic moment (gray arrow) to the y- and z-axis.
[107, 108]:
Han =∑
j
−K1Sz2j − 1
S2(4K2S
x2j S
y2j +K3(S
z2j S
y2j + Sz2
j Sx2j )). (5.67)
The first term in this equation is the magnetic anisotropy energy (MAE) with K1 > 0denoting the easy axis anisotropy constant and describes the orientation of the spins inthe z-direction. The second term describes the fourfold anisotropy of the tetragonal case.Here, the constants K2 and K3 describe the orientation of the spins in the in-plane direc-tion (x-y-plane) and the relation to the z-direction, respectively.If the proposed magnetic configurations for the different Fe50Pt50−xRhx films and tem-
peratures are compared four principle structures can be identified. The FM and AFordered magnetic structure of the Fe50Pt45Rh5 and Fe50Pt32.5Rh17.5 films in Fig. 5.42 andFig. 5.45, respectively, and the AF configuration at low (T<150K) and high temperature(T>276K) for the Fe50Pt25Rh25 film, respectively (see Fig. 5.52). The theoretical descrip-tion of the magnetic configuration will start with the simple FM order of the Fe50Pt45Rh5
film.As mentioned before the sign + and - denote the neighboring spins being antiparallel orparallel. Subsequently, the FM order of the Fe50Pt45Rh5 film is described by the two-ionterm as follows:
Hexx = −J
∑
j
SzjS
zj+ex − J
∑
j
Sxj S
xj+ex − J
∑
j
Syi S
yj+ex
(5.68)
Hexy = −J
∑
j
SzjS
zj+ey − J
∑
j
Sxj S
xj+ey − J
∑
j
Syi S
yj+ey
(5.69)
Hexz = −J
∑
j
SzjS
zj+ez − J
∑
j
Sxj S
xj+ez − J
∑
j
Syi S
yj+ez
. (5.70)
In the case of the out-of-plane FM order of the film with x=5 the orientation of the spinscan be simply described by: Han =
∑j −K1S
z2j , with K1 > 0 and consequently the
minimum is achieved when θ1 = θ2 = θ3 = θ4 = 0. It should be noted that the indices 1to 4 denote the Fe atoms and the corresponding spins as it is shown in the magnetic unitcell in Fig. 5.60.
Considering the individual exchange parameters for the different directions the AF

112 5.5. Discussion
Figure 5.60.: Indices of the atoms and the corresponding magnetic moments used in thephenomenological model.
configuration of the Fe50Pt32.5Rh17.5 film is described by the following expressions of Hex:
Hexx = J
∑
j
SzjS
zj+ex − J
∑
j
Sxj S
xj+ex − J
∑
j
Syj S
yj+ex
(5.71)
Hexy = J
∑
j
SzjS
zj+ey + J
∑
j
Sxj S
xj+ey − J
∑
j
Syj S
yj+ey
(5.72)
Hexz = J
∑
j
SzjS
zj+ez − J
∑
j
Sxj S
xj+ez + J
∑
j
Syj S
yj+ez
. (5.73)
Since this structure is more complicated than the previously discussed FM structureseveral solutions or minima, respectively, are possible. If Hex
x is minimized two equivalentminima can be achieved:
1. |θ1 − θ2| = π, i.e. the spins of the atom 1 and 2 are perpendicular to the x-y-planeand antiparallel to each other.
2. the spins are in canted positions to the x-y-plane and are mirrored to each other,i.e. θ1 + θ2 = π, φ1 = φ2. It should be noted that the exact values of the angles areundefined.
For Hexy two equivalent minima can be found:
1. spin 1 and 3 are parallel to the z-axis and antiparallel to each other.
2. the spins of the atom 1 and 3 are canted to the x-y-plane and their projections alongthe in-plane direction are non-parallel, i.e. θ1 + θ3 = π, φ1 + φ3 = π. The exactvalues of the angles are again not defined.
For the component Hexz even three equivalent minima are possible:
1. spin 1 and 4 are parallel to the z-axis and antiparallel to each other.

5. Measurements and Results 113
2. both spins 1 and 4 are canted to the x-y-plane and their projections in the in-planedirection are non-parallel, i.e. θ1 + θ4 = π, φ1 + φ4 = 2π. The values of the angelsare again undefined.
3. the spins of the atoms 1 and 4 are canted to the x-y-plane and their projections inthe in-plane direction is parallel, i.e. θ1 + θ4 = π, φ1 + φ4 = 0.
The one-ion anisotropy term is now important to distinguish between these possible solu-tions and to define the angles. The proposed magnetic structure can be described by thefollowing relations of the different anisotropy constants: 0 < K2 < K3 and
∣∣∣K1−K2
K3−K2
∣∣∣ < 1.In such a case the minimum of expression 5.67 can be achieved when the in-plane com-ponents of the magnetic moments are aligned close to the diagonals of the bct structure,and are canted to the x-y-plane in such a way that cos 2θ = K1−K2
K3−K2
. This is equivalent to
the second solutions of the three components Hexx , Hex
y and Hexz . The spins of the nearest
neighbors of spin 1 are mirrored to it if cos 2θ1 = cos 2(π − θi).
The AF order of the Fe50Pt25Rh25 film in the out-of-plane direction at low temperature(T<150K) is again a simple structure which can be described by the following two-ionterm:
Hexx = +J
∑
j
SzjS
zj+ex + J
∑
j
Sxj S
xj+ex + J
∑
j
Syi S
yj+ex
(5.74)
Hexy = +J
∑
j
SzjS
zj+ey + J
∑
j
Sxj S
xj+ey + J
∑
j
Syi S
yj+ey
(5.75)
Hexz = +J
∑
j
SzjS
zj+ez + J
∑
j
Sxj S
xj+ez + J
∑
j
Syi S
yj+ez
. (5.76)
Similar to the film with x=5 only one minimum is derived and the out-of-plane orientationof the spins can again be described by the simple one-ion term: Han =
∑j −K1S
z2j , with
K1 > 0. In contrast to the calculations for the Fe50Pt45Rh5 film the minimum is achievedhere when θ1 = 0 and θ2 = θ3 = θ4 = π, i.e. the spins are aligned perpendicular to thex-y-plane with antiparallel orientation to each other.For a temperature T>250K a more complicated structure can be observed (see fig.5.52).Here the two ion term is given by:
Hexx = −J
∑
j
SzjS
zj+ex − J
∑
j
Sxj S
xj+ex − J
∑
j
Syi S
yj+ex
(5.77)
Hexy = +J
∑
j
SzjS
zj+ey + J
∑
j
Sxj S
xj+ey − J
∑
j
Syi S
yj+ey
(5.78)
Hexz = −J
∑
j
SzjS
zj+ez − J
∑
j
Sxj S
xj+ez + J
∑
j
Syi S
yj+ez
. (5.79)
For Hexx two minima can be found:
1. θ1 = θ2 = 0, i.e. spin 1 and 2 are parallel to the z-direction and parallel to eachother.
2. the spins of atom 1 and 2 are in canted position to the x-y-plane, i.e. θ1 = θ2 andφ1 = φ2. The values of both angles are undefined.

114 5.5. Discussion
For Hexy also two minima have to be distinguished:
1. θ1 = θ3 = π, i.e. the spins of atom 1 and 3 are perpendicular to the x-y-plane andantiparallel to each other.
2. the spins 1 and 3 are canted to the x-y-plane and their projections in the in-planedirection are non-parallel, i.e. θ1 + θ3 = π and φ1 + φ3 = π. The angles are againundefined.
For the component Hexz three equivalent minima are possible:
1. spin 1 and 4 are perpendicular to the x-y-plane and parallel to each other.
2. the spins of atom 1 and 4 are canted to the x-y-plane and their projections in thein-plane direction are non-parallel, i.e. θ1 = θ4 and φ1+φ4 = 2π. It should be notedthat the values of the angles are not defined.
3. the spins 1 and 4 are canted to the x-y-plane and their projections in the in-planedirection are parallel to each other, i.e. θ1 = θ4 and φ1 + φ4 = 0.
The one ion term needs to be used again to distinguish between these solutions. The differ-ent orientations of the spins can be described by the following relations of the anisotropyconstants: 0 < K2 < K3 and
∣∣∣K1−K2
K3−K2
∣∣∣ < 1. As described for the film with x=17.5 theminimum is reached when the x-y components of the spins align close to the diagonals ofthe bct structure and are canted in such a way that cos 2θ = K1−K2
K3−K2
which is equivalent
to the second solutions of the three components of the two-ion term Hex in x-, y- andz-direction. The nearest neighbors, however, are not mirrored to each other.
For the previous calculations a simplified model was used. It was assumed that thein-plane angles φ have values of about 45 due to the in-plane symmetry. The neutrondiffraction measurements, on the other hand, showed different results for the angles. Forsome films even a temperature dependence was found. To include these differences in thephenomenological model the expression of the one-ion anisotropy term in 5.67 has to bemodified [108]:
Han =∑
j
−K1Sz2j − 1
S2
[4K2S
x2j S
y2j +K3(S
z2j S
x2j + Sz2
j Sy2j )
]+ 16∆Sy4
j Sx4j . (5.80)
The additional term 16∆Sy4j S
x4j describes an eightfold anisotropy in the films and is
necessary to include the different in-plane angles (φ 6= 45) as well as the perpendicularand parallel domains in the phenomenological model. In the next step again the minimaof the energy have to be determined by minimizing the one-ion anisotropy term Han.Therefore the term is minimized for both angles which lead to the following argumentsfor φ:
sin2 2φ =2K2K
23
∆(K3 −K1)2(5.81)
and for θ:
cos 2θ =K1
K3
(5.82)

5. Measurements and Results 115
For∣∣∣K1
K3
∣∣∣ < 1 and 0 <2K2K2
3
∆(K3−K1)2< 1 with K3 > 0, K2 > 0 and ∆ > 0 the angles describe
an AF congiguration with out-of-plane components of the spins, e.g. the AF configurationof the Fe50Pt32.5Rh17.5 film.For
∣∣∣K1
K3
∣∣∣ > 1 two cases have to be distinguished: K1
K3
≤ −1 and K1
K3
→ 1.
For K1
K3
≤ −1 it is θ = π2
and the spins are oriented in-plane as it can be seen for theFe50Pt40Rh10 film in the AF domains above T=230K. Considering the result for θ andminimizing Han relative to φ leads to three solutions:
1. a canted in-plane state of the spins with sin2 2φ = K2
2∆is given when 0 < K2
2∆< 1.
2. a 45 orientation of the spins in-plane is given when K2
2∆> 1, this includes the
previous model where ∆ → 0.
3. the spins are directed along the x- or y-axis when K2
2∆= 0
For K1
K3
→ 1 and cos 2θ → 1, i.e. θ → 0 or θ → π an out-of-plane orientation of the spinsis realized as it was observed for the Fe50Pt45Rh5 film.
In summary of the phenomenological model for the magnetic configurations of theFe50Pt50−xRhx films one can conclude that the films with low Rh concentration whichare FM ordered in the in-plane direction have an anisotropy ratio K1
K3
> 1 and K1 > 0.With increasing Rh concentration this ratio decreases and changes to K1
K3
< 1 at aboutx=10. At this point an AF order in the out-of-plane direction becomes dominant. In theFe50Pt40Rh10 film the change from K1
K3
> 1 to K1
K3
< 1 can also be observed with increasingtemperature. An abnormal behavior from the decreasing K1
K3
-ratio can be observed in thefilm with x=25 at low temperature, where the ratio is also K1
K3
> 1. The reason for thisbehavior is not known at the present stage. Besides the decreasing K1
K3
-ratio with the Rhconcentration a similar behavior can be observed for the K2 anisotropy constant withtemperature but only in the AF domains of the films with x=10 and x=25 which showa temperature driven magnetic transition. At low temperature the magnetic momentsare canted to the x- and y-axes (φ 6= 0 and φ 6= π
2) and have an anisotropy constant of
K2 > 0. With increasing temperature the anisotropy constant decreases and changes toK2 < 0. At this state the magnetic moments orient along one of the symmetry axes x ory. To the best of the knowledge of the author, similar results as they are presented herefor the phenomenological model of the Fe50Pt50−xRhx films have not been published forother samples yet.It should be noted that the Fe50Pt50−xRhx alloys are itinerant-electron magnets. There-fore the exchange parameter J i
e can not be determined simply from the Néel or Curietemperature, respectively, by the use of the equation TN,C = 2S(S+1)
3kBJ( ~Q) which is often
applied for systems with localized spins [109, 110, 111]. The determination of the exchangeparameter in an itinerant system is in general much more complicated. Two different ap-proaches to determine the exchange parameter in a Heisenberg model are for examplethe so-called real-space approach [112, 113, 114] and the frozen-magnon approach [114].In the latter case the spin-wave energy can be calculated by employing the generalizedBloch theorem [114]. The exchange parameter J i
e can then be determined by a Fouriertransformation of the energy. In the real-space approach the exchange parameter can becalculated directly by employing the change of the energy associated with a constrainedrotation of the spin-polarization axes at different sites [112, 113, 114]. The determination

116 5.5. Discussion
of the exchange parameter is beyond the scope of this work and would require additionalmeasurements with methods as, for example, inelastic neutron scattering. The expectedsignals in such measurements are comparatively weak. The intensity of the small amountof scatterers of the Fe50Pt50−xRhx films in this work would be too low to be measured.For future work inelastic measurements are planned on thicker samples to increase theamount of scatterers.
For the magnetic configuration under the application of a magnetic field two cases haveto be distinguished: a FM and an AF order. In the case of a FM order the influenceof the magnetic field can be easily described by the use of a simple Heisenberg exchangeHamiltonian and a perpendicular external field which are in competition with the easyaxis anisotropy. The out-of-plane angle θ can then be determined by minimizing the one-ion anisotropy term Han. It should be noted that an additional Zeeman term has to betaken into account which considers the external magnetic field:
Han+Ze = −K1S2 cos2 θ −H |S| sin θ, (5.83)
where H denotes the external magnetic field. The minimum of Han+Ze is given when:
sin θ =H
2K1S. (5.84)
The saturation field can then be determined by: Hsat = 2K1S. It should be notedthat the magnetic fields applied in this work were not sufficient to saturate the samples.The anisotropy constant K1 could therefore not be determined. For future work neutrondiffraction experiments with higher magnetic field and additional super quantum intefer-ence device measurements are planned.In the case of an AF order the situation is much more complicated. Here, the externalmagnetic field is in competition with the anisotropic exchange field as well as with theone-ion anisotropy described by formula 5.67. Furthermore as discussed in the previoussection the reorientation of the magnetic moments is most likely a continuous process andtherefore the model of a spin-flop transition can not be used. Besides these difficultiesit was also shown by the neutron diffraction measurements that only the AF domains inthe film with x=10 are influenced by the field while the AF order of the other films isnot affected. This is an indication that also an influence of the FM domains on the AForder needs to be considered in a theoretical model. For the theoretical description of thebehavior the simplified model presented here is not sufficient and needs to be modified andextended. This extension should be based on a more general expression for the Hamilto-nian. First of all, the model should take into account that the in-plane and out-of-planeexchange parameters J i
e are not only different in sign but also in their absolute values, i.e.the Fe-Fe interaction in the Fe-planes should be stronger than those perpendicular to it,mediated by the Pt/Rh atoms. Furthermore, the model should give information aboutthe orientation of domains and domain walls and whether the orientations or propaga-tions, respectively, are connected to the symmetry axes [115], [116]. Moreover it is alsoimportant to explain the magnetic field behaviors of the magnetic moments in the AFdomains of the film with x=10.The model presented here takes only Fe magnetic moments into account which is in goodagreement with previous ab-initio results for FePt alloys. There it was shown that Pt-Pt interactions can be neglected and Fe-Pt interactions lead only to renormalization of

5. Measurements and Results 117
parameters in the Hamiltonian for Fe [117], [118]. The additional Rh atoms make it nec-essary to prove if these assumptions are still valid for the ternary Fe50Pt50−xRhx alloys.Previous theories use power laws to explain the temperature dependence of the magneticconfiguration [119]. For the verification a temperature dependence of the anisotropy con-stants should be included in an extended model.For future work also the long-range interactions should be included into the model, sinceit is known from FePt and FeRh ab-initio calculations that they play a significant role.For the work presented here, however, the limitation to short-range interactions were suf-ficient to explain the experimental results.

6. Conclusions and Outlook
Previous investigations on the magnetic properties of bulk Fe50Pt50−xRhx alloys by Yuasawith macroscopic measurements showed that the magnetic phases and the transition tem-peratures in the alloy can be tuned by the Rh concentration. For technological applica-tion, in particular for HDDs, thin films are preferred to reduce device sizes. Therefore theinvestigations presented in this work focus on 200 nm thick Fe50Pt50−xRhx films whosenuclear and magnetic properties have been investigated mainly by polarized and unpo-larized neutron diffraction. By the use of neutrons a probe was chosen which are able toanalyze the structural and magnetic properties on an atomic level. In contrast to otherneutron scattering methods such as neutron reflectivity or small angle neutron scatteringthe neutron diffraction measurements provide information about the magnetic and thenuclear crystalline structures of the different Fe50Pt50−xRhx films. Moreover, it allows tostudy AF order. The measurements were performed at instruments at the world leadingneutron sources. The neutron diffraction experiments carried out at these sources areeven suited to study the nuclear and magnetic structures of thin films (thicknesses downto 100 nm) with very low amount of material. In contrast to the macroscopic measure-ments the results of the neutron diffraction investigations can be used in combination withqualitative and quantitative structure factor calculations to develop a detailed model ofthe magnetic configuration of the Fe50Pt50−xRhx alloys.The dependence on the composition has been analyzed considering four 200 nm thickFe50Pt50−xRhx films with the concentrations x=5, 10, 17.5 and 25. In a second step thechanges of the magnetic configurations and properties under an external magnetic fieldhave been studied. In a last step the influence of the film thickness was investigated bystudying three Fe50Pt40Rh10 films with film thicknesses of 100 nm, 300 nm and 500 nm.Besides neutron diffraction, X-ray diffraction and MOKE measurements were carried outfor the structural and magnetic analysis of the films.The measurements presented in this work reveal for the 200 nm thick Fe50Pt50−xRhx alloyswith low Rh concentration a FM order while the films with higher Rh concentration areAF ordered. More precisely, the film with x=5 and x=17.5 are in a pure, single FM andAF state, respectively, before they become PM. In the film with x=10 a transition froman AF order at low temperature to a FM order at high temperature can be observed.The film with x=25 shows also a temperature driven magnetic transition but here theseare transitions between different AF configurations. The different magnetic orders andtransitions observed with the variation of the Rh concentrations are similar to the resultsproposed for the bulk Fe50Pt50−xRhx system. However, the Néel and Curie temperatures,respectively, of the 200 nm thick films are about T=100K lower as they were proposedfor the bulk system.The models of the magnetic configuration developed from the neutron diffraction resultsin combination with the structure factor calculations demonstrate that the 200 nm thickFe50Pt50−xRhx film with low Rh concentration (x=5) has a FM order in the in-plane di-rection with the magnetic moments aligned in the out-of-plane direction along the c-axis.The film with x=17.5, on the other hand, has a dominant AF order in the out-of-plane

6. Conclusions and Outlook 119
direction with the magnetic moments aligned dominantly in the in-plane direction anda small component directed out-of-plane. Both films are in a single magnetic state untilthey become PM and their magnetic configurations do not change with temperature onlya decrease of the strength of the magnetic order can be observed. The film with x=10possesses at low temperature an AF structure similar to the one proposed for the film withx=17.5 which changes for higher temperature to the FM configuration proposed for thefilm with x=5. In the AF ordered film with x=25 the dominant orientation of the mag-netic moments changes with increasing temperature from the out-of-plane to the in-planeand back to the out-of-plane direction. The origin of the temperature driven magnetictransitions are in both cases a nucleation and growth of domains with FM in-plane or-der and AF out-of-plane order, respectively. Besides the magnetic transitions again adecrease of the strength of the magnetic order was observed with increasing temperatureas expected.The AF ordered films with x=17.5 and x=25 remain stable for magnetic fields up to 10Tand 3.5T, respectively. The films with x=5 and x=10, on the other hand, are influencedby a magnetic field if it is applied in the in-plane direction. In both films the magneticmoments turn in the direction of the applied field leading to a resulting magnetic momentin the out-of-plane direction. For the Fe50Pt40Rh10 film the reorientation of the magneticmoments in field direction leads to a reduction of the AF-FM transition temperature.The thickness dependent measurements of the Fe50Pt40Rh10 film showed that neither theprincipal magnetic properties nor the magnetic configuration is influenced by the filmthickness in a range from 100 nm to 500 nm. The only effect observed with the filmthickness was a more rapid decay of the integrated intensities of the half order reflectionsindicating a faster AF-FM transition in the thicker films.The magnetic configurations proposed for the different Fe50Pt50−xRhx films can be de-scribed theoretically by a phenomenological model taking two terms into account. Thefirst term is a bilinear anisotropic Hamiltonian with direction dependent exchange con-stants. This term describes the orientation of neighboring magnetic moments to eachother. The second term includes the easy axis anisotropy as well as the fourfold tetrag-onal anisotropy and describes the orientation of the magnetic moments along the threesymmetry axes of the crystal. The phenomenological model indicates that the magneticconfiguration of the Fe50Pt50−xRhx alloys with low Rh concentration (x≤10) is dominantlydetermined by the easy axis anisotropy while for high Rh concentration (x>10) the influ-ence of the fourfold anisotropy is more prominent.
In summary it has been shown that neutron diffraction measurements in combinationwith structure factor calculations are ideally suited to determine the magnetic structureof thin Fe50Pt50−xRhx films in great detail. Based on this data it was possible to developfor the first time a detailed model of the magnetic configurations of Fe50Pt50−xRhx alloyswith thicknesses down to 100 nm.
The detailed knowledge of the magnetic configurations of the Fe50Pt50−xRhx alloys canbe used to fabricate multilayers with appropriate magnetic properties and configuration.For example, multilayers with FM and AF ordered Fe50Pt50−xRhx alloys can be grownto study exchange bias effects or exchange spring effects. The advantage of the differ-ent Fe50Pt50−xRhx films compared to FeRh/FePt layers is the good lattice match whichreduces lattice strains between the different materials. Besides the physical interest thethin films and multilayers are also promising candidates for technological applications.

120
The addition of Rh to the FePt alloys reduces the Curie temperature which reduces ther-mal stresses and the magnetic write field which makes the film attractive for HAMRmedia. The composition range about x=10 with its AF-FM transition is interesting forapplications as soft underlayer. Here, the FM phase would help by the reversion of themagnetization of the recording media during the writing process while the AF order sta-bilizes the system during the data storage. Furthermore a combined recording system canbe grown, consisting of a FM ordered Fe50Pt50−xRhx alloy with x<10 used as recordingmedia with reduced Curie temperature and a film with x≈ 10 used as soft underlayer forthe further reduction of the write field.For technological applications a further reduction of the film thickness below 100 nm ispreferable to reduce the size of the devices and the production costs. First measurementson 6 nm thin Fe50Pt50−xRhx films with macroscopic techniques, e.g. vibrating sample mag-netometer and superconducting quantum interference device, by Hasegawe et al. showedsimilar magnetic properties as proposed for the 200 nm films in this work [103]. To analyzethe magnetic structure of such small films with neutrons a higher flux is essential. Sincetoday’s continuous neutron facilities reached almost their flux maxima new developmentsare necessary. One possible solution to study very small amount of material with highenough flux are spallation sources like the SNS or in the near future the ESS.

Bibliography
[1] D. L. Smith. Thin-film deposition: Principles and practice. MacGraw-Hill, 1995.
[2] H. S. Nalwa, editor. Handbook of thin film materials. Academic Press, 2002.
[3] S.N. Piramanayagam. Perpendicular recording media for hard disk drives. J. Appl.Phys., 102(011301), 2007.
[4] D. A. Thompson and J. S. Best. The future of magnetic data storage technology.IBM J. Res. Develop., 44(3).
[5] D. Weller, A. Moser, L. Folks, M. E. Best, W. Lee, M. F. Toney, M. Schwickert,J.-U. Thiele, and M. F. Doerner. High Ku materials approach to 100Gbits/in2.IEEE Trans. Magn., 36(1).
[6] T. Klemmer, D. Hoydick, H. Okumura, B. Zhang, and W. A. Soffa. Magnetichardening and coercivity mechansims in L10 ordered FePd ferromagnets. ScriptaMetallurgica et Materialia, 33(10/11).
[7] Y. Kanai, R. Matsubara, H. Watanabe, H. Muraoka, and Y. Nakamura. RecordingField Analysis of Narrow-Track SPT Head With Side Shields,Tapered Main Pole,and Tapered Return Path for 1 Tbit/in2. IEEE Trans. Magn., 39(4).
[8] K. Matsumoto, A. Inomata, and S. ya Hasegawa. Thermally Assisted MagneticRecording. FUJITSU Sci. Tech. J., (42):158–167, 2006.
[9] J. Zhao, B. Cui, Z. Zhang, B. Ma, and Q. Y. Jin. Ultrafast heating effect ontransient magnetic properties of L10-FePt thin films with perpendicular anisotropy.Thin Solid Films, 518:2830–2833, 2010.
[10] J. U. Thiele, K. R. Coffey, M. F. Toney, J. A. Hedstrom, and A. J. Kellock. Tem-perature dependent magnetic properties of highly chemically ordered Fe55−xNixPt45L10 films. J. Appl. Phys., 91(10), 2002.
[11] S. Khizroev and D. Litvinov. Perpendicular magnetic recording: Writing process.J. Appl. Phys., 95(9), 2004.
[12] J.-U. Thiele, S. Maat, L. Robertson, and E. E. Fullerton. Magnetic and struc-tural properties of FePt-FeRh exchange spring films for thermally assisted magneticrecording media. IEEE Trans. Magn., 40(4):2537, 2004.
[13] S. Inoue, H. Y. Y. Ko, and T. Suzuki. Magnetic properties of single crystallineFeRh alloy thin films. IEEE Trans. Magn., 44:2875–2878, 2009.
[14] E. M. Hofer and P. Cucka. Magnetic properties of Rh-rich FeRh alloy. J. Phys.Chem. Solids., 27:1552–1555, 1966.

122 Bibliography
[15] J. S. Kouvel and C. C. Hartelius. Anomalous magnetic moments and tansformationsin the ordered alloy FeRh. J. App. Phys., 33(3), 1962.
[16] K.Yu. Guslienko, O. Chubykalo-Fesenko, O. Mryasov, R. Chantrell, and D. Weller.Magnetization reversal via perpendicular exchange spring in FePt/FeRh bilayerfilms. Phys. Rev. B, 70(104405), 2004.
[17] S. Yuasa, H. Miyajima, and Y. Otani. Magneto-volume and tetragonal elongationeffects on magnetic phase transitions of body-centered tetragonal FeRh1−xPtx. J.Phys. Soc. Jpn., 63(8):3129–3144, 1994.
[18] S. Yuasa, T. Akiyama, H. Miyajima, and Y. Otani. Change in the resistivity of bccand bct FeRh alloys at first-order magnetic phase transitions. J. Phys. Soc. Jpn.,64(10):3978–3985, 1995.
[19] P.A. Algarabel, M.R. Ibarra, C. Marquina, S. Yuasa, H. Miyajima, and Y. Otani.Magnetostriction and thermal expansion measurements on FeRh1−xPtx alloys. J.App. Phys., 79(8):4659, 1996.
[20] M. R. Fitzsimmons, S. D. Bader, J. A. Borchers, G. P. Felcher, J. K. Furdyna,A. Hoffmann, J. B. Kortright, I. K. Schuller, T. C. Schulthess, S. K. Sinha, M. F.Toney, D. Weller, and S. Wolf. Neutron scattering studies of nanomagnetism andartificially structured materials. J. Magn. Magn. Mater., 271:103–146, 2004.
[21] T. Suzuki, T. Kiya, N. Honda, and K. Ouchi. High density recording on ultra-thinFePt perpendicular composite media. IEEE Trans. Magn., 36:2417–2419, 2000.
[22] Y. K. Takahashi, K. Hono, T. Shima, and K. Takanashi. Microstructure and mag-netic properties of FePt thin films epitaxially grown on MgO (001) substrates. J.Magn. Magn. Mater., 267:248–255, 2003.
[23] N.H. Luong, D.M. Hong, N. Chau, N.D. Linh, M. Kurisu, D.T.K. Anh, andG. Nakamoto. High-coercivity FePt sputtered films. J. Magn. Magn. Mater., 290-291:559–561, 2005.
[24] B. Rellinghaus, S. Stappert, M. Acet, and E. F. Wassermann. Magnetic propertiesof FePt nanoparticles. J. Magn. Magn. Mater., 266:142–1554, 2003.
[25] R. A. Ristau, K. Barmak, L. H. Lewis, K. R. Coffey, and J. K. Howard. On therealtionship of high coercivity and L10 ordered phase in CoPt and FePt thin films.J. Appl. Phys., 86(4527), 1999.
[26] P. T. L. Minh, N. P. Thuy, N. D. Van, and N. T. N. Chan. Structure and magneticproperties of thin FePt alloy films. J. Magn. Magn. Mater., 239:335–337, 2002.
[27] S. C. Chen, P. C. Kuo, C. L. Shen, G. P. Lin, K. T. Huang, S. L. Ou, and W. H.Hong. Effect of capped layer on microstructure and magnetic properties of FePtfilms. Materials and Design, 31:1742–1745, 2010.
[28] W. K. Shen, J. H. Judy, and J.-P. Wang. In situ epitaxial growth of ordered FePt(001) films with ultra small and uniform grain size using a RuAl underlayer. J.Appl. Phys., 97(10H301), 2005.

Bibliography 123
[29] Y. F. Ding, J. S. Chen, and E. Liu. Structural and magnetic properties of nanos-tructured FePt/MgO granular films. Thin Solid Films, 474:141–145, 2005.
[30] S. Maat, G. Zeltzer, E. E. Fullerton, G. J. Mankey, M. L. Crow, and J. L. Robertson.Antiferromagnetic structure of FePt3 films studied by neutron scattering. Phys. Rev.B, 63(134426), 2001.
[31] K. Sumiyama and G. M. Graham. Magneto-volume effect in ordered Pt3Fe alloy.Solid State Comm., 19:241–243, 1976.
[32] S. Maat, A. J. Kellock, D. Weller ans J. E. E. Baglin, and E. E. Fullerton. Ferro-magnetism of FePt3 films induced by ion-beam irradiation. J. Magn. Magn. Mater.,265:1–6, 2003.
[33] Y. Tsunada, D. Tsuchiya, and Y. Higashiyama. Crossover of spin correlations inPt100−xFex (16 ≤ x ≤ 25) alloys. J. Phys. Soc. Jpn., 72(3):713–717, 2003.
[34] G. E. Bacon and J. Crangle. Chemical and magnetic order in platinum-rich Pt+Fealloys. Proc. R. Soc., A272(387), 1963.
[35] I. V. Solovyev, P. H. Dederichs, and I. Mertig. Origin of orbital magnetiza-tion and magnetocrystalline anisotropy in TX ordered alloys (where T=Fe,Co andX=Pd,Pt). Phys Rev. B, 52(18), 1995.
[36] Julia Vladimirovna Lyubina. Nanocrystalline Fe-Pt alloys: phase transformations,structure and magnetism. PhD thesis, Technische Universität Dresden, 2006.
[37] http://cst www.nrl.navy.mil/lattice/struk/index.html.
[38] K.-W. Lin, J.-Y. Guo, C. Y. Liu, H. Ouyang, J. van Lierop, N. N. Phuoc, andT. Suzuki. Exchange coupling in FePt-FePt3 nanocomposite films. Phys. Stat. sol.,(204):3991–3994, 2007.
[39] T. Saerbeck, F. Klose, D. Lott, G. J. Mankey, Z. Lu, P. R. LeClair, W. Schmidt,A. P. J. Stampfl, S. Danilkin, M. Yethiraj, and A. Schreyer. Artificially modulatedchemical order in thin films: A different approach to create ferro/antiferromagneticinterfaces. Phys Rev. B, 82(134409), 2010.
[40] K. Barmak, J. Kim, L. H. Lewis, K. R. Coffey, M. F. Toney, A. J. Kellock, and J.-U.Thiele. On the relationship of magnetocrystalline anisotropy and stoichiometry inepitaxial L10 CoPt (001) and FePt (001) thin films. J. App. Phys., 98(033904),2005.
[41] C. Paduani. Magnetic properties of Fe-Rh alloys. J. App. Phys., 90(12), 2001.
[42] G. Shirane, C. W. Chen, P. A. Flinn, and R. Nathans. Hyperfine fields and magneticmoments in the Fe-Rh system. J. App. Phys., 34:1044, 1963.
[43] S. Maat, J.-U. Thiele, and E. E. Fullerton. Temperature and field hysteresis of theantiferroamgnetic-to-ferromagnetic phase transition in epitaxial FeRh films. Phys.Rev. B, 72(214432), 2005.
[44] Y. Ohtani and I. Hatakeyama. Features of broad magnetic transition in FeRh thinfilm. J. Magn. Magn. Mater., 131:339–344, 1994.

124 Bibliography
[45] I. Radu, C. Stamm, N. Pontius, T. Kachel, P. Ramm, J.-U. Thiele, H. A. Dürr,and C. H. Back. Laser-induced generation and quenching of magnetization onFeRh studied with time-resolved x-ray magnetic circular dichroism. Phys. Rev.B, 81(104415), 2010.
[46] E. Kren, L. Pal, and P. Szabo. Neutron diffraction investigation of theantiferromagnetic-ferromagnetic transformation in the FeRh alloy. Phys. Lett.,9(4):297, 1964.
[47] F. Garcia-Sanchez, O. Chubykalo-Fesenko, O. N. Mryasov, R. W. Chantrell, andK. Yu. Guslienko. Multiscale versus micromagnetic calculations of the switchingfield reduction in FePt/FeRh bilayers with perpendicular exchange spring. J. App.Phys., 87(10J101), 2005.
[48] J.-U. Thiele, S. Maat, and E. E. Fullerton. FeRh/FePt exchange spring films forthermally assisted magnetic recording media. App. Phys. Lett., 82(17):2859, 2003.
[49] D. Suess, T. Schrefl, S. Fähler, M. Kirschner, G. Hrkac, F. Dorfbauer, and J. Fidler.Exchange spring media for perpendicular recording. App. Phys. Lett., 87(012504),2005.
[50] R. V. P. Montsouka, J. Arabski, A. Derory, J. Faerber, G. Schmerber, andV. Pierron-Bohnes. Structural and magnetic study of thin films based on anisotropicternary alloys FeNiPt2. Mater. Sci. and Eng. B, 126:236–239, 2006.
[51] W. Y. Zhang, H. Shima, F. Takano, H. Akinaga, X. Z. Yu, T. Hara, W. Z. Zhang,K. Kimoto, Y. Matsui, and S. Nimori. Enhancement in ordering of Fe50Pt50 filmcaused by Cr and Cu additives. J. Appl. Phys, 106(033907), 2009.
[52] D. C. Berry and K. Barmak. Effect of alloy composition on the thremodynamic andkinetic parameters of the A1 to L10 transformation in FePt, FeNiPt, and FeCuPtfilms. J. Appl. Phys., 102(024912), 2007.
[53] M. L. Yan, Y. F. Xu, X. Z. Li, and D. J. Sellmyer. Highly (001)-oriented Ni-dopedL10 FePt films and their magnetic properties. J. Appl. Phys., 97(10H309), 2005.
[54] N. V. Baranov and E. A. Barabanova. Electrical resistivity and magnetic phasetransitions in modified FeRh compounds. J. Alloys Compd., 219:139–148, 1995.
[55] N. V. Baranov, P.E. Markin, S.V. Zemlyanski, H. Michor, and G. Hilscher. Giantmagnetoresistance in antiferromagnetically ordered FeRh and Mn2Sb based alloys.J. Magn. Magn. Mater., 157/158:401–402, 1996.
[56] P. Kushwaha, A. Lakhani, R. Rawat, and P. Chaddah. Low-temperature study offield-induced antiferromagnetic-ferromagnetic transition in Pd-doped Fe-Rh. Phys.Rev. B, 80(174413), 2009.
[57] P. H. Walter. Exchange inversion in ternary modifications of iron rhodium. J. App.Phys., 35(3 (Part2)), 1964.
[58] K. Takizawa, T. Ono, and H. Miyajima. Magnetic phase transitions for body-centered tetragonal FeRh1−xPtx system. J. Magn. Magn. Mater., 226-230:572–573,2001.

Bibliography 125
[59] S. Yuasa and H. Miyajima. Magnetic properties and phase transition in bctFeRh1−xPtx alloys. NIM B, 76:71–73, 1993.
[60] W. Lu, N. T. Nam, and T. Suzuki. First-order magnetic phase transition in FeRh-Ptthin films. J. Appl. Phys, 105(07A904), 2009.
[61] W. Lu, N. T. Nam, and T. Suzuki. Magnetic properties and phase transition kineticsof Fe50(Rh1−xPtx)50. IEEE Trans. Magn., 45:4011–4014, 2009.
[62] W. Lu, B. Yan, and T. Suzuki. Magnetic phase transition and magneto-optical prop-erties in epitaxial FeRh0.95Pt0.05 (001) single-crystal thin films. Scripta Materialia,64:851–854, 2009.
[63] D. Richter. Scattering Techniques: Neutron Diffraction, in: Magnetism goes nano.FZ Jülich GmbH, 2005.
[64] A. D. Krawitz. Introduction to diffraction in materials science and engineering.John Wiley & sons, INC., 2001.
[65] J. M. Cowley. Diffraction physics (Sec. Rev. Ed.). North Holland Personal Library,1986.
[66] L. H. Schwartz and J. B. Cohen. Diffraction from materials. Academic Press, Inc.,1977.
[67] W. Nolting. Grundkurs: Theoretische Physik Quantenmechanik Teil 2: Methodenund Anwendungen. Verlag Zimmermann-Neufang, 1994.
[68] A. Schreyer. Spin polarized neutron reflectometry and x-ray scattering on exchangecoupled superlattices. PhD thesis, Ruhr-Universität Bochum, 1994.
[69] T. Brückel. Scattering Techniques II: Magnetic X-Ray Scattering, in: Magnetismgoes nano. FZ Jülich GmbH, 2005.
[70] A. Schreyer. Physical Properties of Photons and Neutrons, in: Neutrons and Syn-chrotron Radiation in Engineering Materials Science. Wiley-VCH, 2008.
[71] G. Shirane, S. M. Shapiro, and J. M. Tranquada. Neutron Scattering with a Triple-Axis Spectrometer Basic Techniques. Cambridge University Press, 2002.
[72] J. Bienlein and R. Wiesendanger. Einführung in die Struktur der Materie. B. G.Teubner, 2003.
[73] B. E. Warren. X-Ray Diffraction. Dover Publications, 1990.
[74] R. Siebrecht. Untersuchung magnetischer Fe1−xCrx/Cr-Übergitter mit dem Neutro-nenreflektometer ADAM. PhD thesis, Ruhr-Universität Bochum, 2000.
[75] W. Treimer. Imaging, in: Neutrons and Synchrotron Radiation in EngineeringMaterials Science. Wiley-VCH, 2008.
[76] Prakash Mani. Probing spin ordering in Fe-Pt based antiferromagnetic films usingneutron diffraction. PhD thesis, The University of Alabama, 2006.

126 Bibliography
[77] http://www.umms.sav.sk/index.php?ID=415.
[78] R. Allmann and A. Kern. Röntgenpulverdiffraktometrie. Springer, 2003.
[79] http://institut2a.physik.rwth-aachen.de/de/lehre/praktikum/Anleitungen/FK05MOKE.pdf.
[80] H. Stillrich. Magnetische Nanostrukturen basierend auf Co/Pt-Multilagen,hergestellt mittels selbstorganisierter Masken aus Blockpolymer-Micellen. PhD the-sis, Universität Hamburg, 2007.
[81] R. Böttger, H. Friedrich, and H. Janßen. The PTB thermal neutron reference fieldat GeNF. Neutronenphysik PTB-N-47, 2004.
[82] V. Wagner, H. Friedrich, and P. Wille. Higher-order suppression by a mechanicalvelocity selector. Physica B, (213&214):963–965, 1995.
[83] http://www.ill.eu/instruments-support/sample environment/equipment/.
[84] G. Cicognani. The Yello Book 2005 Guide to Neutron Research Facilities. InstitutLaue-Langevin, 2005.
[85] P. J. Brown. Magnetic Form Factors, in: Neutron Data Booklet. Old City Publish-ing, 2003.
[86] A. B. Shick, V. Drchal, J. Kudrnovsky, and P. Weinberger. Electronic structureand mangetic properties of random alloys: Fully relativistic spin polarized linearmuffin-tin-orbital method. Phys Rev. B, 54(3), 1996.
[87] J. U. Thiele, L. Folks, M. F. Toney, and D. K. Weller. Perpendicular magneticanisotropy and mangetic domain structure in sputtered epitaxial FePt (001) L10films. J. Appl. Phys., 84(5686), 1998.
[88] T. Takasugi, M. Takazawa, and O. Izumi. Atomistic defect structures of Co3Ticontaining boron, carbon and beryllium. J. Mater. Sci., 25:4226, 1990.
[89] B. D. Cullity and S. R. Stock. Elements of X-ray Diffraction. Prentice Hall, PearsonEducation International, 2001.
[90] C. Suryanarayana and M. Grant Norton. X-ray Diffraction A Pratical Approach.Plenum Press, New York and London, 1998.
[91] A. Singh and A. H. King. Tables of coincidence orientations for ordered tetragonalL10 alloys for a range of axial ratios. Acta Cryst., B49:266–272, 1993.
[92] C. L. Zha, R. K. Dumas, Y. Y. Fang, V. Bonanni, J. Nogués, and J. Akerman.Continuously graded anisotropy in single (Fe53Pt47)100−xCux films. Appl. Phys.Lett., 97(182504), 2010.
[93] Y. M. Hu, J. C. A. Huang, S. Y. Huang, and T. W. Wu. Kerr effect of ordered anddisordered Fe1−xPtx(001) alloy films. IEEE Trans. Magn., 37(4).

Bibliography 127
[94] O. Hellwig, G. P. Denbeaux, J. B. Kortright, and E. E. Fullerton. X-ray studies ofaligned magnetic stripe domains in perpendicular multilayers. Physica B, 336:136,2003.
[95] J. R. Barnes, S. J. O’Shea, M. E. Welland, J.-Y. Kim, E. Evetts, and R. E. Somekh.Magnetic force microscopy of Co-Pd multilayers with perpendicular anisotropy. J.Appl. Phys., 76(2974), 1994.
[96] G. A. Baker. Application of the Pade approximant method to the investigation ofsome magnetic properties of the sing model. Phys. Rev., 124(3), 1961.
[97] J. W. Essam and M. E. Fisher. Pade approximant studies of the lattice gas andIsing ferromagnet below the critical point. J. Chem. Phys., 38(802), 1963.
[98] G. K. Wertheim, H. J. Guggenheim, and D. N. E. Buchanan. Sublattice magneti-zation in FeF3 near the critical point. Phys. Rev., 169(2), 1968.
[99] Z. Lu, R. V. Chepulskii, and W. H. Butler. First-principles study of magneticproperties of L10-ordered MnPt and FeRh alloys. Phys. Rev. B, 81(094437), 2010.
[100] H. Yamada, H. Shimizu, K. Yamamoto, and K. Uebayashi. Structure and magnetismof 3d and 4d transition-metal alloys TT’ (T=Mn, Fe and T’=Rh, Pd) with CuAu-Itype ordered structure. J. Alloys Compd., 415:31–37, 2006.
[101] E. Weschke, H. Ott, C. Schüßler-Langeheine, D. V. Vyalikh, G. Kaindl, V. Leiner,M. Ay, T. Schmitte, H. Zabel, and P. J. Jensen. Finite-size effect on magneticordering temperatures in long-period antiferromagnets: Holmium thin films. Phys.Rev. Lett., 93(15), 2004.
[102] E. L. Lee, P. E. Bolduc, and C. E. Violet. Magnetic ordering and critical thicknessof ultrathin iron films. Phys. Rev. Lett., 13(800), 1964.
[103] T. Hasegawa, J. Miyahara, T. Narisawa, S. Ishio, H. Yamane, Y. Kondo, J. Ari-ake, S. Mitani, Y. Sakuraba, and K. Takanashi. Study of ferro-antiferromagnetictransition in [001]-oriented L10 FePt1−xRhx film. J. Appl. Phys., 106(103928), 2009.
[104] A. Bringer. Heisenberg Model - Magnetic Interactions, in: Magnetism goes nano.FZ Jülich GmbH, 2005.
[105] S. Blundell. Magnetism in Condensed Matter. Oxford University Press, 2004.
[106] E. L. Nagaev. Anomalous magnetic structure and phase transitions in non-Heisenberg magnetic materials. Sov. Phys. Usp., 25(1), 1982.
[107] M. Getzlaff. Fundamentals of Magnetism. Springer, 2008.
[108] R. Skomski. Simple Models of Magnetism. Oxford Graduates Texts, 2008.
[109] G. Bihlmayer. Non-Collinear Magnetism: Exchange Parameter and TC, in: Compu-tational Nanoscience: Do it Yourself ! John von Neumann Institute for Computing,2006.
[110] G. Bihlmayer. Density- functional Theory of Magnetism, in: Handbook of Mag-netism and Advanced Magnetic Materials 1. Wiley, 2007.

128 Bibliography
[111] I. S. Lyubutin, P. G. Naumov, and B. V. Mill. Magnetic transition and spin rotationin a new multiferroic Ba3TaFe3Si2O14 observed by the Mössbauer spectroscopy.Europhys. Lett., 90(67005), 2010.
[112] A. I. Liechtenstein, M. I. Katsnelson, V. P. Antropov, and V. A. Gubanov. Localspin density approach to the theory of exchange interactions in ferromagnetic metalsand alloys. J. Magn. Magn. Mater., 67:65–74, year=1987,.
[113] S. Polesya, S. Mankovsky, O. Sipr, W. Meindl, C. Strunk, and H. Ebert. Finite-temperature magnetism of FexPd1−x and CoxPt1−x alloys. Phys Rev. B, 82(214409),2010.
[114] M. Pajda, J.Kudrnovsky, I. Turek, V. Drchal, and P. Bruno. Ab initio calculationsof exchange interactions, spin-wave stiffness constants, and Curie temperatures ofFe, Co, and Ni. Phys Rev. B, 82(214409), 2010.
[115] D. Hinzke, U. Nowak, O. N. Mryasov, and R. W. Chantrell. Orientation and temper-ature dependence of domain wall properties in FePt. Appl. Phys. Lett., 90(082507),2007.
[116] D. Hinzke, N. Kazantseva, U. Nowak, O. N. Mryasov, P. Asselin, and R. W.Chantrell. Domain wall properties of FePt: From Bloch to linear walls. PhysRev. B, 77(094407), 2008.
[117] N. Kazantseva, D. Hinzke, U. Nowak, R. W. Chantrell, U. Atxitia, andO. Chubykalo-Fesenko. Towards multiscale modeling of magnetic materials: Simu-lations of FePt. Phys Rev. B, 77(184428), 2008.
[118] O. N. Mryasov, U. Nowak, K. Y. Guslienko, and R. W. Chantrell. Temperature-dependent magnetic properties of FePt: Effective spin Hamiltonian model. Euro-phys. Lett., 69(5):805–811, 2005.
[119] R. Skomski, O. N. Mryasov, J. Zhou, and D. J. Sellmyer. Finite-temperatureanisotropy of magnetic alloy. J. Appl. Phys., 99(08E916), 2006.

A. Debye-Waller factor
In section 5.4.3 it was mentioned that the integrated intensities of the second orderreflections (002) and (200) of the Fe50Pt40Rh10 films with different thicknesses show anonmagnetic temperature behavior. The observed decay of the integrated intensities isexemplarily shown for the 500 nm thick Fe50Pt40Rh10 film in Fig. A.1. The origin of thedecay are thermal fluctuations. A magnetic origin can be excluded since the polarizationanalysis of the second order reflection (002) showed no splitting of the NSF channels ora SF signal which should be observable if a magnetic contribution to the peak intensityexists. Systematic errors due to failures during the measurements can be also excludedsince these failures should also be observed in the integrated intensities of the other reflec-tions, in particular in the first order reflections. The decay of the integrated intensity canbe explained by thermal lattice vibrations which increase with the temperature and canbe expressed by the so-called Debye-Waller factor (DW). The DW-factor fDW dependson the temperature and on the Q-position in the reciprocal space [64]:
fDW = e−2B sin2 θ
λ2 = e−2B Q2
8π2 . (A.1)
The factor B can be written as B = 8/3π < u2 >, with< u2 > the mean square oscillation.The mean square oscillation < u2 > is defined by:
< u2 >=3kBT
Mω2=
3kBT
C, (A.2)
where kB denotes the Boltzmann constant, M the atomic mass and ω the oscillationfrequency. By the use of these definitions the above equation A.1 can be written as:
fDW = e−Q2kBT
C . (A.3)
The influence of the lattice vibrations on the integrated intensity is plotted in Fig. A.2together with the Q-dependence. The Q-dependence is the reason why the second orderreflections are more affected by the thermal vibration than the first order or half orderpeaks (see Fig. A.2). It should be noted that for the correction the constant C was deter-mined from the data of the second order reflection (002) since no magnetic contributionsare expected to its intensity. The Debye-Waller corrections are exemplarily shown in Fig.A.1 for the 500 nm film.

130
Figure A.1.: Temperature dependence of the integrated peak intensities for the 500 nmFe50Pt40Rh10 film at the half, first and second order reflections along the[001]- (solid symbols) and the [100]-direction (open symbols). The lines arefits to the power law 5.19. The left graphs show the measurements withoutthe Debye-Waller correction.

A. Debye-Waller factor 131
Figure A.2.: Normalized temperature dependence of the Debye-Waller factor for differentQ-values. The constant C was set to 1.


Acknowledgements
First I would like to thank my supervisor Prof. Dr. Andreas Schreyer for the opportunityto work in a very interesting research field at the Helmholtz-Zentrum Geesthacht. I alsowould like to thank him for the support during this work.
Dieter Lott I would like to thank for the support and help during the whole time ofthis work, for spending a lot of time for discussions and for the corrections of my writingsand editorial advices.
I am also deeply grateful to Gary Mankey and his co-workers for spending a lot of timeto prepare Fe50Pt50−xRhx samples of excellent quality. Without these samples this workwould not have been possible.
Another very helpful collaboration was with Elena Tartakovskaya. Her past and on-going work to develop a theoretical model of the proposed magnetic spin configurationswas a great help.
Thanks go also to Frank Klose and Annemieke Mulders for the discussions about thetheoretical model.
The instrument responsibles of IN12 and D23, Karin Schmalzl and Wolfgang SchmidtI would like to thank for their support during my neutron diffraction measurements atthe ILL.
My gratitude to Simon Heße for the help with the MOKE measurements.
I also would like to thank Prof. Dr. H. P. Oepen for being the second reviewer of my thesis.
Special thanks go to my colleagues from Helmholtz-Zentrum Geesthacht for a wonder-ful working atmosphere, their support during this thesis and the ongoing work and inparticular for the delicious cakes.
I also would like to thank my former colleagues Alexander Grünwald and Wolfgang Kreuz-paintner for their help and the discussions.
Finally I would like to thank my family and friends for their support.