unaudited financial statements of - bsm...
TRANSCRIPT
Interim Consolidated Financial Statements (Unaudited) of
BSM TECHNOLOGIES INC.
Third quarter results June 30, 2011 and 2010
NOTICE OF NO AUDITOR REVIEW OF INTERIM FINANCIAL STATEMENTS
UNDER NATIONAL INSTRUMENT 51-102, PART 4, SUBSECTION 4.3 (3) (A), IF AN AUDITOR HAS NOT PERFORMED A REVIEW OF THE INTERIM FINANCIAL STATEMENTS, THEY MUST BE ACCOMPANIED BY A NOTICE INDICATING THAT THE FINANCIAL STATEMENTS HAVE NOT BEEN REVIEWED BY AN AUDITOR. THE ACCOMPANYING UNAUDITED FINANCIAL STATEMENTS OF THE COMPANY HAVE BEEN PREPARED BY AND ARE THE RESPONSIBILITY OF THE COMPANY’S MANAGEMENT. THE COMPANY’S INDEPENDENT AUDITOR HAS NOT PERFORMED A REVIEW OF THESE FINANCIAL STATEMENTS IN ACCORDANCE WITH STANDARDS ESTABLISHED BY THE CANADIAN INSTITUTE OF CHARTERED ACCOUNTANTS FOR A REVIEW OF INTERIM FINANCIAL STATEMENTS BY AN ENTITY’S AUDITOR.
BSM TECHNOLOGIES INC.
Table of Contents
Three and Nine months ended June 30, 2011 and 2010
Page
Interim Consolidated Balance Sheets - Unaudited 1
Interim Consolidated Statements of Operations and Deficit - Unaudited 2
Interim Consolidated Statements of Comprehensive Income - Unaudited 3
Interim Consolidated Statements of Cash Flows - Unaudited 4
Notes to the Interim Consolidated Financial Statements - Unaudited 5
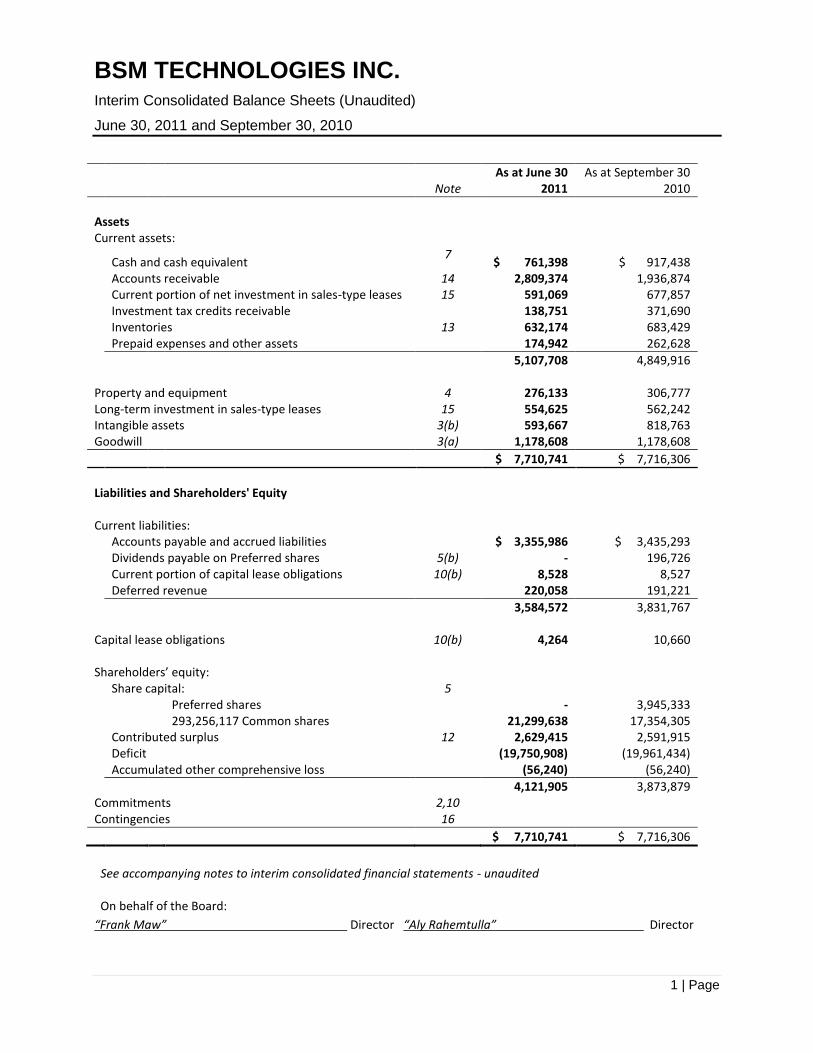
BSM TECHNOLOGIES INC. Interim Consolidated Balance Sheets (Unaudited)
June 30, 2011 and September 30, 2010
1 | Page
Note As at June 30
2011 As at September 30
2010
Assets Current assets:
Cash and cash equivalent 7
$ 761,398 $ 917,438 Accounts receivable 14 2,809,374 1,936,874 Current portion of net investment in sales-type leases 15 591,069 677,857 Investment tax credits receivable 138,751 371,690 Inventories 13 632,174 683,429 Prepaid expenses and other assets 174,942 262,628
5,107,708 4,849,916 Property and equipment 4 276,133 306,777 Long-term investment in sales-type leases 15 554,625 562,242 Intangible assets 3(b) 593,667 818,763 Goodwill 3(a) 1,178,608 1,178,608
$ 7,710,741 $ 7,716,306
Liabilities and Shareholders' Equity Current liabilities: Accounts payable and accrued liabilities $ 3,355,986 $ 3,435,293 Dividends payable on Preferred shares 5(b) - 196,726 Current portion of capital lease obligations 10(b) 8,528 8,527 Deferred revenue 220,058 191,221
3,584,572 3,831,767 Capital lease obligations 10(b) 4,264 10,660 Shareholders’ equity:
Share capital: 5
Preferred shares - 3,945,333 293,256,117 Common shares 21,299,638 17,354,305 Contributed surplus 12 2,629,415 2,591,915 Deficit (19,750,908) (19,961,434) Accumulated other comprehensive loss (56,240) (56,240)
4,121,905 3,873,879 Commitments 2,10 Contingencies 16
$ 7,710,741 $ 7,716,306
See accompanying notes to interim consolidated financial statements - unaudited On behalf of the Board:
“Frank Maw” Director “Aly Rahemtulla” Director
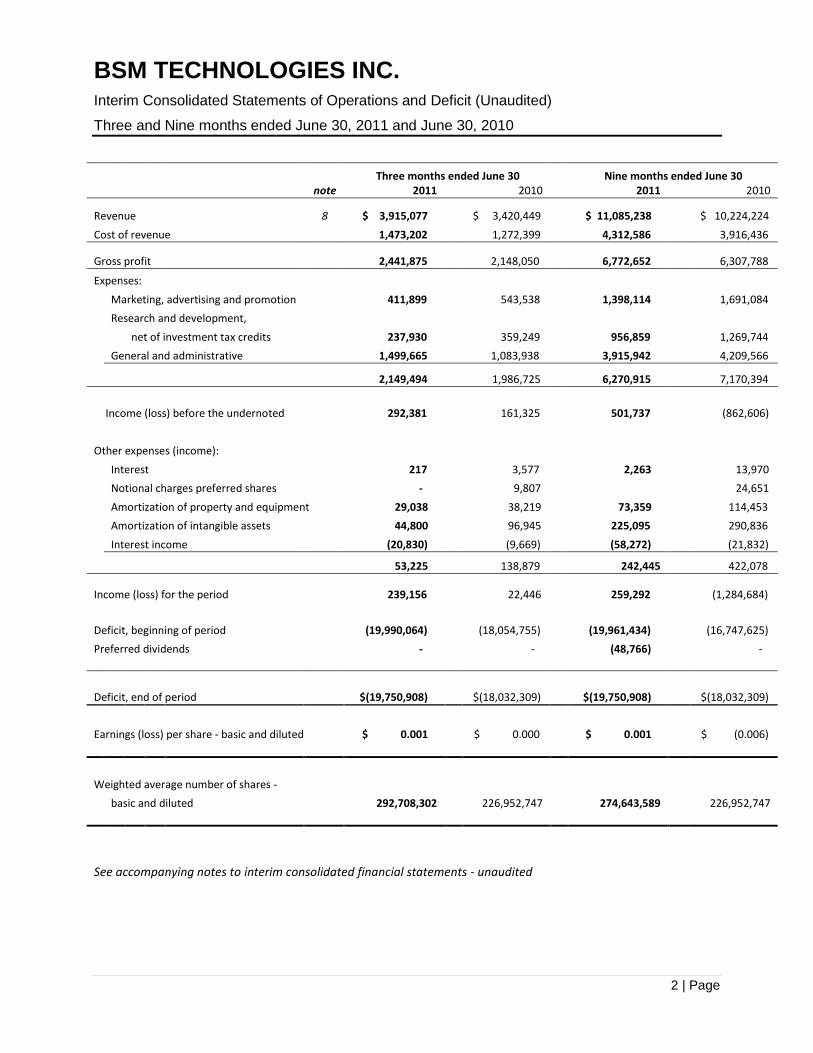
BSM TECHNOLOGIES INC. Interim Consolidated Statements of Operations and Deficit (Unaudited)
Three and Nine months ended June 30, 2011 and June 30, 2010
2 | Page
Three months ended June 30 Nine months ended June 30 note 2011 2010 2011 2010
Revenue
8 $ 3,915,077
$ 3,420,449
$ 11,085,238
$ 10,224,224
Cost of revenue 1,473,202 1,272,399 4,312,586 3,916,436
Gross profit
2,441,875
2,148,050
6,772,652
6,307,788
Expenses:
Marketing, advertising and promotion
411,899
543,538
1,398,114
1,691,084
Research and development,
net of investment tax credits
237,930
359,249
956,859
1,269,744
General and administrative
1,499,665
1,083,938
3,915,942
4,209,566
2,149,494 1,986,725 6,270,915 7,170,394
Income (loss) before the undernoted
292,381
161,325
501,737
(862,606)
Other expenses (income):
Interest
217
3,577
2,263
13,970
Notional charges preferred shares
-
9,807
24,651
Amortization of property and equipment 29,038
38,219
73,359
114,453
Amortization of intangible assets
44,800
96,945
225,095
290,836
Interest income (20,830) (9,669) (58,272) (21,832)
53,225 138,879 242,445 422,078
Income (loss) for the period
239,156
22,446
259,292
(1,284,684)
Deficit, beginning of period
(19,990,064)
(18,054,755)
(19,961,434)
(16,747,625)
Preferred dividends
-
-
(48,766)
-
Deficit, end of period $(19,750,908) $(18,032,309) $(19,750,908) $(18,032,309)
Earnings (loss) per share - basic and diluted $ 0.001
$ 0.000
$ 0.001
$ (0.006)
Weighted average number of shares -
basic and diluted
292,708,302
226,952,747
274,643,589
226,952,747
See accompanying notes to interim consolidated financial statements - unaudited

BSM TECHNOLOGIES INC. Interim Consolidated Statements of Comprehensive Income (Loss) (Unaudited)
Three and Nine months ended June 30, 2011 and June 30, 2010
3 | Page
Three months ended June 30 Nine months ended June 30
2011 2010 2011 2010
Income (loss) for the period
$ 239,156 $ 22,446
$ 259,292 $ (1,284,684)
Other comprehensive income (loss):
Unrealized translation gains (losses) on
self-sustaining operations - (11,270)
- (20,191)
Comprehensive loss $ 239,156 $ 11,176 $ 259,292 $ (1,304,875)
Interim Consolidated Statements of Accumulated Other Comprehensive Income (Loss) (Unaudited)
Three and Nine months ended June 30, 2011 and 2010
Three months ended June 30 Nine months ended June 30 2011 2010 2011 2010
Balance, beginning of period $ (56,240) $ (65,161)
$ (56,240) $ (56,240)
Other Comprehensive income (loss), net of income taxes:
Unrealized translation gains (losses) on
self-sustaining operations - (11,270)
- (20,191)
Balance, end of period $ (56,240) $ (76,431) $ (56,240) $ (76,431)
See accompanying notes to interim consolidated financial statements – unaudited

BSM TECHNOLOGIES INC. Interim Consolidated Statements of Cash Flows (Unaudited)
Three and Nine months ended June 30, 2011 and June 30, 2010
4 | P a g e
Three months ended June 30 Nine months ended June 30
note 2011 2010 2011 2010
Cash provided by (used in):
Operating activities:
Income (loss) for the period
$ 239,156 $ 22,446 $ 259,292 $ (1,284,684)
Items not involving cash:
Amortization of property and equipment 29,038 38,219 73,359 114,453
Amortization of intangible assets
44,800 96,945 225,095 290,836
Notional charges preferred shares
- 9,807 - 24,651
Stock-based compensation expense 12 12,500 23,217 37,500 49,862
Change in non-cash operating working capital 6 (32,864) (406,178) (457,150) (754,625)
Net cash provided by (used in) operating activities 292,630 (215,544) 138,096 (1,559,507)
Financing activities:
Dividends on preferred shares
- - (245,492) (69,359)
Long-term debt
- (21,799) - (18,781)
Capital lease payments (2,132) (12,093) (5,931) (69,425)
Net cash used in financing activities (2,132) (33,892) (251,423) (157,565)
Investing activities:
Acquisition of property and equipment, net (22,197) (762) (42,713) (5,885)
Net cash provided by (used in) investing activities (22,197) (762) (42,713) (5,885)
Net increase (decrease) in
cash and cash equivalents during the period 268,301 (250,198) (156,040) (1,722,957)
Cash and cash equivalents, beginning of period 493,097 1,024,429 917,438 2,497,188
Cash and cash equivalents, end of period $ 761,398 $ 774,231 $ 761,398 $ 774,231
See accompanying notes to interim consolidated financial statements – unaudited

BSM TECHNOLOGIES INC. Notes to Interim Consolidated Financial Statements – Unaudited Three and Nine months ended June 30, 2011 and 2010
5 | P a g e
BSM Technologies Inc. (the "Company") designs and develops Global Positioning System ("GPS") based hardware and software solutions that are integrated with anti-theft and Automatic Vehicle Location ("AVL") functions. The manufacturing of the hardware products is subcontracted to third party suppliers, generally located in China and South Asia.
Using technologies such as digital mapping, GPS and wireless communications, the Company designs, develops and integrates AVL systems that enable its customers to monitor assets and/or exchange mission-critical information with mobile units in real time. Its proprietary software and customizable hardware product offers seamless, wireless communications over radio, cellular or satellite networks, geo-fencing and self-monitoring. The Company provides wireless solutions to fleet management, law enforcement agencies, transportation and private customers.
1. Significant accounting policies:
The disclosures contained in these unaudited interim consolidated financial statements (the "Statements") have been made in accordance with the generally accepted accounting principles (“GAAP”) applicable to interim financial statements. These Statements should be read in conjunction with the annual audited consolidated financial statements for the year ended September 30, 2010.
(a) Recent Canadian accounting pronouncements:
(i) International Financial Reporting Standards:
In February 2008, the Canadian Accounting Standards Board ("AcSB") confirmed that the
changeover to International Financial Reporting Standards ("IFRS") from GAAP will be required
for both interim and annual financial statements for profit-oriented publicly accountable entities
for fiscal years beginning on or after January 1, 2011. The AcSB stated in their exposure draft
that early adoption is permitted. The Company's first annual IFRS financial statements will be for
the year ending September 30, 2012 and will include the comparative period of 2011. Starting in
the first quarter of 2012, the Company will provide unaudited consolidated financial information
in accordance with IFRS, including comparative figures for 2011.
The Company has completed a preliminary assessment of the accounting and reporting
differences under IFRS as compared to Canadian GAAP; however, management has not yet
finalized its determination of the impact of these differences on the consolidated financial
statements. The Company has developed a project plan, which includes the project structure
and governance, resourcing and training, an analysis of key GAAP differences and a phased plan
to assess accounting policies under IFRS, as well as potential IFRS 1 First-time Adoption of
International Financial Reporting Standards exemptions. The Company's project includes a
timetable for assessing the impact on data systems, internal controls over financial reporting,
and business activities, such as financing and compensation arrangements, and is on schedule in
the implementation process. The Company has made progress in determining the financial
statement presentation and impacts of the key differences between the Company’s current
accounting policies under Canadian GAAP and those it expects to apply in preparing IFRS-
compliant financial statements.

BSM TECHNOLOGIES INC. Notes to Interim Consolidated Financial Statements – Unaudited (continued) Three and Nine months ended June 30, 2011 and 2010
6 | P a g e
1. Significant accounting policies (continued):
The Company continues to ensure key staff members attend IFRS update and training sessions as required.
In the period leading up to the changeover, the AcSB will continue to issue accounting standards
that are converged with IFRS, thus mitigating the impact of adopting IFRS at the changeover
date. The International Accounting Standards Board will also continue to issue new accounting
standards during the conversion period and, as a result, the final impact of IFRS on the
Company's consolidated financial statements will only be measured once all the IFRS's applicable
at the conversion date are known.
(ii) Business combinations, consolidated financial statements and non-controlling interests:
In January 2009, the CICA issued Handbook Section 1582, Business Combinations ("Section
1582") concurrently with Handbook Sections 1601, Consolidated Financial Statements ("Section
1601"), and 1602, Non-Controlling Interests ("Section 1602"). Section 1582, which replaces
Handbook Section 1581, Business Combinations, establishes standards for the measurement of
a business combination, and the recognition and measurement of assets acquired and liabilities
assumed. Section 1602 establishes standards for the treatment of non-controlling interests
subsequent to acquisition through a business combination. Section 1601, which replaces
Handbook Section 1600, carries forward the existing Canadian guidance on aspects of the
preparation of consolidated financial statements subsequent to acquisition other than non-
controlling interests. These new standards are applied prospectively to business combinations
with acquisition dates on or after January 1, 2011. Earlier adoption is permitted. Section 1601
and 1602 will apply to the Company’s interim and annual consolidated financial statements
beginning October 1, 2011.
(iii) Multiple deliverable revenue arrangements:
In December 2009, the EIC issued a new abstract concerning multiple deliverable revenue
arrangements, EIC Abstract No. 175, Multiple Deliverable Revenue Arrangements ("EIC-175"),
which amended EIC Abstract No. 142, Revenue Arrangements with Multiple Deliverables ("EIC-
142"). These amendments require a vendor to allocate arrangement consideration at the
inception of the arrangement to all deliverables using the relative selling price method, thereby
eliminating the use of the residual value method. The amendments also change the level of
evidence of the standalone selling price required to separate deliverables when more objective
evidence of the selling price is not available.
EIC-175 should be adopted prospectively for revenue arrangements entered into or materially
modified in the first annual fiscal period beginning on or after January 1, 2011, with early
adoption permitted. EIC-142 continues to be effective until that date. Management does not
expect this new Abstract to have a material effect on the Company's consolidated financial
statements.

BSM TECHNOLOGIES INC. Notes to Interim Consolidated Financial Statements – Unaudited (continued) Three and Nine months ended June 30, 2011 and 2010
7 | P a g e
2. Business combinations:
On September 25, 2009, the Company acquired all the outstanding shares of Datacom Wireless Corporation ("Datacom"), a Montreal-based company. Datacom is a telematics service provider that supplies strategic-data acquisition, transmission, organization, distribution and integration services for various business sectors, especially in the sectors of transportation, industrial inventory management and public utility services.
Datacom was established in 1999 and offers a range of products and services for commercial and
consumer markets. Datacom provides high-quality fleet and vehicle management services and products
for the commercial market. Fleet managers use the MobicomTM product line on a 24/7 basis to track
vehicle positions in real time on a computerized map and to acquire important management
information.
As consideration for the acquisition, the Company: (i) issued 118,571,871 common shares of the
Company, valued at $4,150,015; and (ii) issued 4,533,921 options valued at $243,003 to acquire common
shares in exchange for 1,068,791 outstanding Datacom options. The acquisition costs related to this
acquisition were $390,235 and are included in accounts payable and accrued liabilities at September 30,
2009.
The weighted average value of each option granted is estimated on the date of the grant being the
acquisition date of September 25, 2009, using the Black-Scholes option pricing model with the following
weighted average assumptions:
2009
Risk-free rate 1.27% Expected volatility 125% Expected life in years 7.91 Expected dividend yield –
The acquisition was accounted for under the purchase method of accounting and the results of
operations have been included in these consolidated financial statements from the date of acquisition. During the year ended September 30, 2010, the Company finalized the purchase price allocation. This
resulted in an increase in intangible assets of $896,000, a decrease in accounts receivable of $94,990, a
decrease in net investment in sales-type leases of $30,917 and a decrease in goodwill of $770,093.
The adjustments had the following effects on the purchase price allocation from the amounts recorded
and disclosed in the 2009 consolidated financial statements:
BSM TECHNOLOGIES INC. Notes to Interim Consolidated Financial Statements – Unaudited (continued) Three and Nine months ended June 30, 2011 and 2010
8 | P a g e
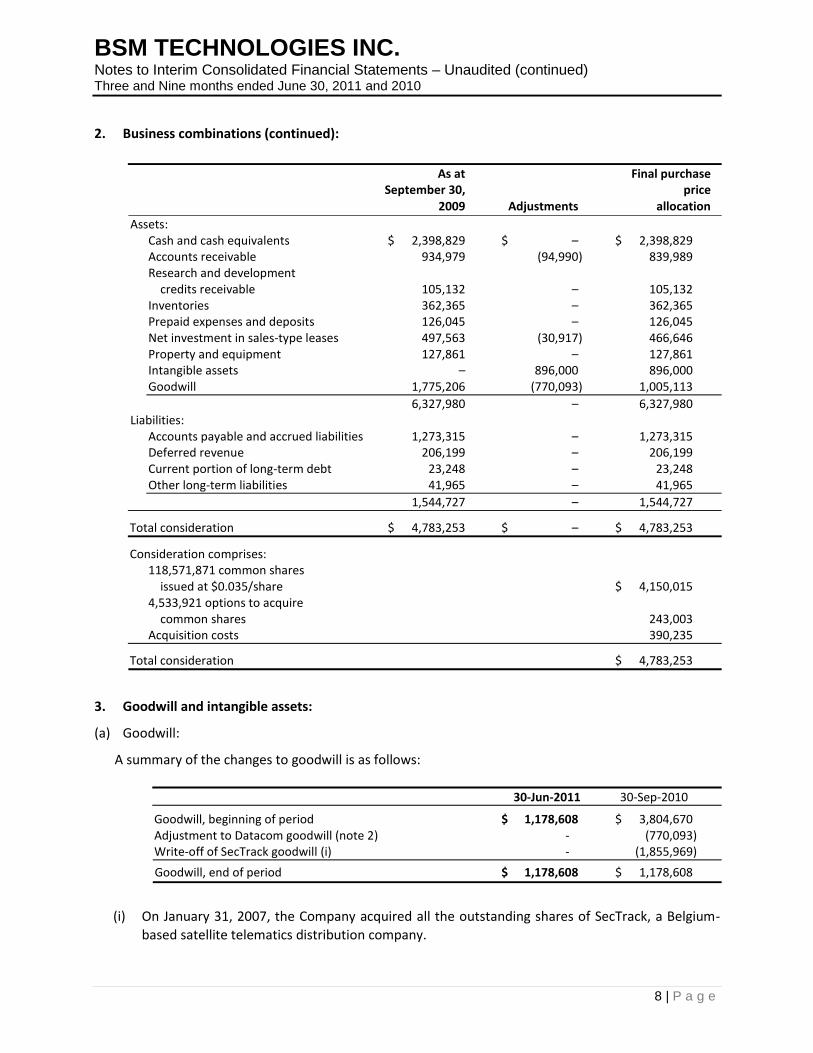
2. Business combinations (continued):
As at Final purchase September 30, price 2009 Adjustments allocation
Assets: Cash and cash equivalents $ 2,398,829 $ – $ 2,398,829 Accounts receivable 934,979 (94,990) 839,989 Research and development
credits receivable 105,132 – 105,132 Inventories 362,365 – 362,365 Prepaid expenses and deposits 126,045 – 126,045 Net investment in sales-type leases 497,563 (30,917) 466,646 Property and equipment 127,861 – 127,861 Intangible assets – 896,000 896,000 Goodwill 1,775,206 (770,093) 1,005,113
6,327,980 – 6,327,980 Liabilities:
Accounts payable and accrued liabilities 1,273,315 – 1,273,315 Deferred revenue 206,199 – 206,199 Current portion of long-term debt 23,248 – 23,248 Other long-term liabilities 41,965 – 41,965
1,544,727 – 1,544,727
Total consideration $ 4,783,253 $ – $ 4,783,253
Consideration comprises: 118,571,871 common shares
issued at $0.035/share $ 4,150,015 4,533,921 options to acquire
common shares 243,003 Acquisition costs 390,235
Total consideration $ 4,783,253
3. Goodwill and intangible assets:
(a) Goodwill:
A summary of the changes to goodwill is as follows:
30-Jun-2011 30-Sep-2010
Goodwill, beginning of period $ 1,178,608 $ 3,804,670 Adjustment to Datacom goodwill (note 2) - (770,093) Write-off of SecTrack goodwill (i) - (1,855,969)
Goodwill, end of period $ 1,178,608 $ 1,178,608
(i) On January 31, 2007, the Company acquired all the outstanding shares of SecTrack, a Belgium-
based satellite telematics distribution company.
BSM TECHNOLOGIES INC. Notes to Interim Consolidated Financial Statements – Unaudited (continued) Three and Nine months ended June 30, 2011 and 2010
9 | P a g e
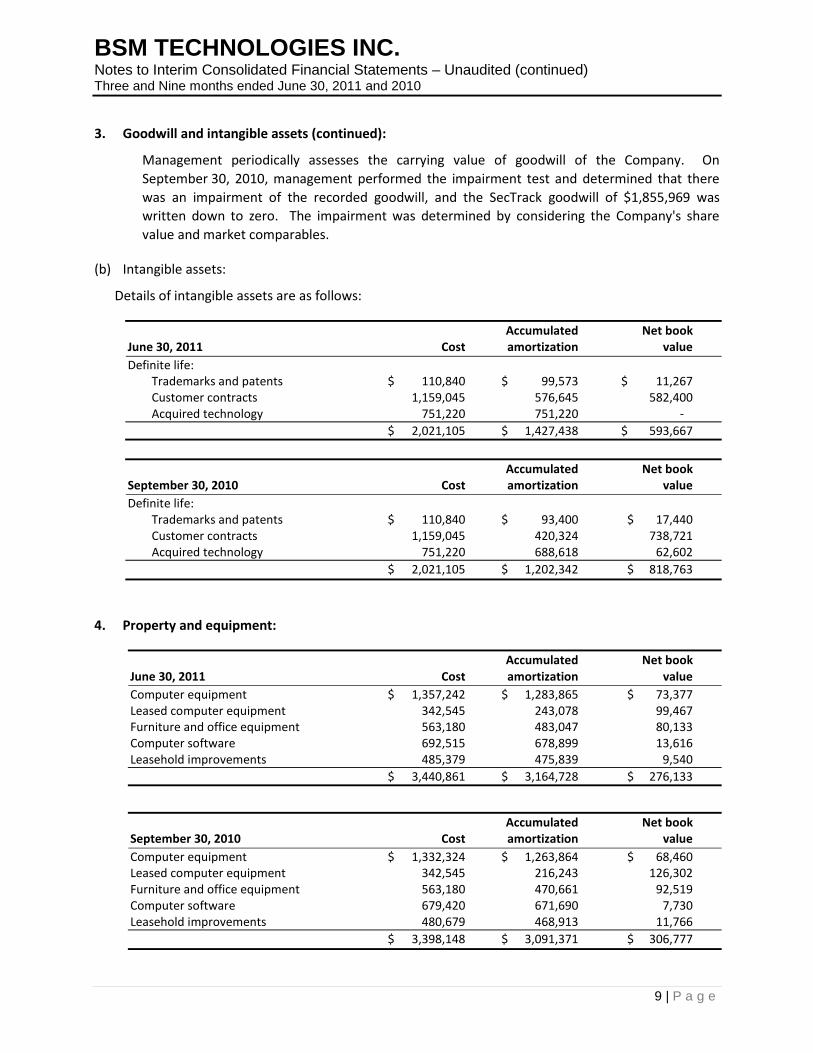
3. Goodwill and intangible assets (continued):
Management periodically assesses the carrying value of goodwill of the Company. On
September 30, 2010, management performed the impairment test and determined that there
was an impairment of the recorded goodwill, and the SecTrack goodwill of $1,855,969 was
written down to zero. The impairment was determined by considering the Company's share
value and market comparables.
(b) Intangible assets:
Details of intangible assets are as follows:
Accumulated Net book June 30, 2011 Cost amortization value
Definite life: Trademarks and patents $ 110,840 $ 99,573 $ 11,267 Customer contracts 1,159,045 576,645 582,400 Acquired technology 751,220 751,220 -
$ 2,021,105 $ 1,427,438 $ 593,667
Accumulated Net book September 30, 2010 Cost amortization value
Definite life: Trademarks and patents $ 110,840 $ 93,400 $ 17,440 Customer contracts 1,159,045 420,324 738,721 Acquired technology 751,220 688,618 62,602
$ 2,021,105 $ 1,202,342 $ 818,763
4. Property and equipment:
Accumulated Net book June 30, 2011 Cost amortization value
Computer equipment $ 1,357,242 $ 1,283,865 $ 73,377 Leased computer equipment 342,545 243,078 99,467 Furniture and office equipment 563,180 483,047 80,133 Computer software 692,515 678,899 13,616 Leasehold improvements 485,379 475,839 9,540
$ 3,440,861 $ 3,164,728 $ 276,133
Accumulated Net book September 30, 2010 Cost amortization value
Computer equipment $ 1,332,324 $ 1,263,864 $ 68,460 Leased computer equipment 342,545 216,243 126,302 Furniture and office equipment 563,180 470,661 92,519 Computer software 679,420 671,690 7,730 Leasehold improvements 480,679 468,913 11,766
$ 3,398,148 $ 3,091,371 $ 306,777

BSM TECHNOLOGIES INC. Notes to Interim Consolidated Financial Statements – Unaudited (continued) Three and Nine months ended June 30, 2011 and 2010
10 | P a g e
5. Share capital:
(a) Common shares:
Authorized: Unlimited common shares
(b) Preferred shares:
Authorized:
Unlimited first and second preferred shares issuable in series. The directors are authorized to fix the
number of shares in each series and to determine the designation, rights, privileges, restrictions and
conditions attached to the shares of each series.
Issued and outstanding:
65,755,556 non-cumulative 8% first preferred shares issued and outstanding as on September 30,
2010. On December 15, 2010, the first preferred shares were converted into 65,755,556 common
shares. As a result, there are no first preferred shares outstanding as at June 30, 2011. There were
no second preferred shares issued and outstanding at June 30, 2011.
30-Jun-2011 30-Sep-2010 Number Amount Number Amount
Balance, beginning of period 65,755,556 $ 3,945,333 65,755,556 $ 3,945,333 Common shares issued in
exchange for $3,945,333 first preferred shares (65,755,556) (3,945,333) - -
Balance, end of period - $ - 65,755,556 $ 3,945,333
On September 25, 2009, 65,755,556 first preferred shares were issued in exchange for an aggregate
principal amount of convertible debentures of $3,287,778. Each preferred share is convertible into
one common share (i) at any time based on the written request of the holder of a preferred share;
or (ii) at the Company's request after July 1, 2010. On December 15, 2010, the first preferred shares
were converted into 65,755,555 common shares.
The preferred shareholders had pre-emptive rights to participate pro rata in any equity or debt
financings. While any preferred shares are outstanding, the Company is prohibited from incurring
senior debt, other than debt from a Schedule 1 or Schedule 2 bank for the purpose of inventory and
accounts receivable financing. These preferred shares were issued pursuant to a condition of the
business combination with Datacom, which required the 2008 Convertible Debentures to be
converted into preferred shares of the Company. The fair value of the consideration paid was
determined as follows:
30-Jun-2011 30-Sep-2010
Preferred shares (i) $ - $ 3,945,333 Dividends payable on preferred shares (ii) - 196,726
$ - $ 4,142,059
BSM TECHNOLOGIES INC. Notes to Interim Consolidated Financial Statements – Unaudited (continued) Three and Nine months ended June 30, 2011 and 2010
11 | P a g e
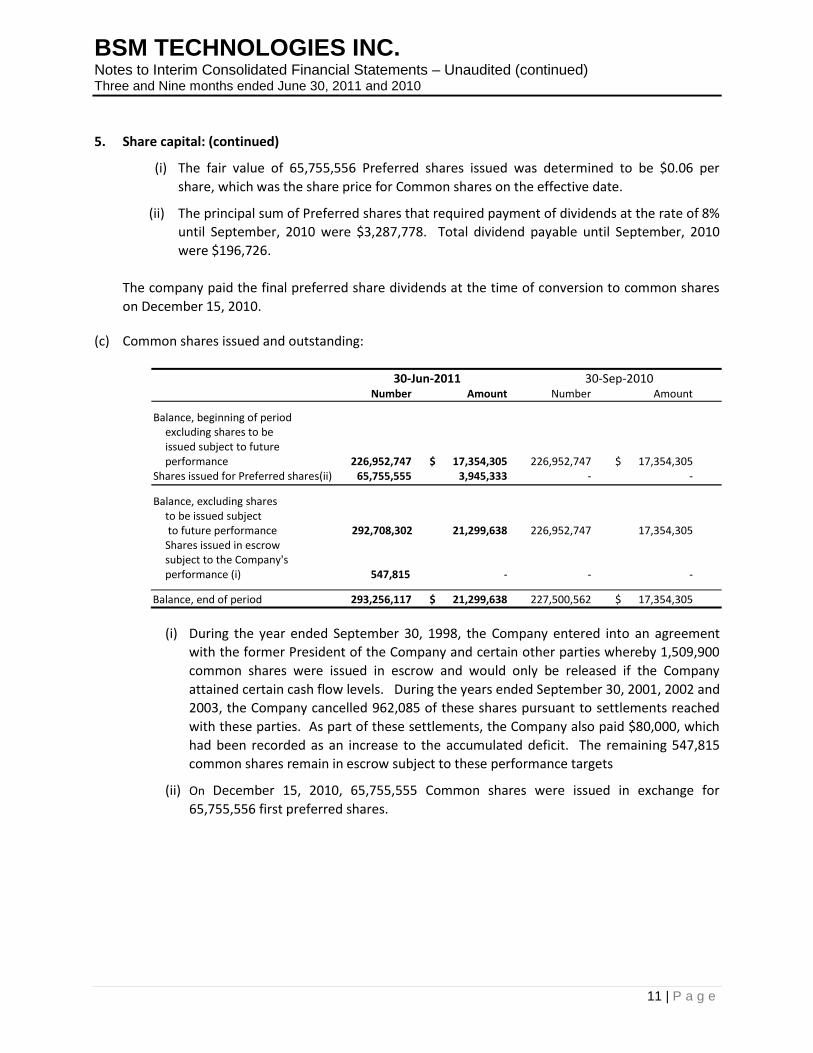
5. Share capital: (continued)
(i) The fair value of 65,755,556 Preferred shares issued was determined to be $0.06 per
share, which was the share price for Common shares on the effective date.
(ii) The principal sum of Preferred shares that required payment of dividends at the rate of 8%
until September, 2010 were $3,287,778. Total dividend payable until September, 2010
were $196,726.
The company paid the final preferred share dividends at the time of conversion to common shares
on December 15, 2010.
(c) Common shares issued and outstanding:
30-Jun-2011 30-Sep-2010 Number Amount Number Amount
Balance, beginning of period excluding shares to be issued subject to future performance 226,952,747 $ 17,354,305 226,952,747 $ 17,354,305
Shares issued for Preferred shares(ii) 65,755,555 3,945,333 - -
Balance, excluding shares to be issued subject to future performance 292,708,302 21,299,638 226,952,747 17,354,305 Shares issued in escrow subject to the Company's performance (i) 547,815 - - -
Balance, end of period 293,256,117 $ 21,299,638 227,500,562 $ 17,354,305
(i) During the year ended September 30, 1998, the Company entered into an agreement
with the former President of the Company and certain other parties whereby 1,509,900
common shares were issued in escrow and would only be released if the Company
attained certain cash flow levels. During the years ended September 30, 2001, 2002 and
2003, the Company cancelled 962,085 of these shares pursuant to settlements reached
with these parties. As part of these settlements, the Company also paid $80,000, which
had been recorded as an increase to the accumulated deficit. The remaining 547,815
common shares remain in escrow subject to these performance targets
(ii) On December 15, 2010, 65,755,555 Common shares were issued in exchange for
65,755,556 first preferred shares.
BSM TECHNOLOGIES INC. Notes to Interim Consolidated Financial Statements – Unaudited (continued) Three and Nine months ended June 30, 2011 and 2010
12 | P a g e
5. Share capital: (continued)
(d) Stock options:
The February 26, 2006 stock option plan (the "2006 Stock Option Plan") provides for 6,790,475
common shares as a maximum number of common shares in the capital of the Company that are
reserved for issuance under the 2006 Stock Option Plan. Any options granted subject to the 2006
Stock Option Plan that are cancelled or terminated without having been exercised shall again be
available to be granted under the 2006 Stock Option Plan. Options granted under the 2006 Stock
Option Plan may be exercised during a period not exceeding five years from the date of grant. The
vesting period is set by the Board of Directors.
On June 10, 2008, the shareholders passed a resolution, increasing the number of shares under the
2006 Stock Option Plan by 6,484,456 common shares to an aggregate of 12,755,788 common shares,
by replacing 519,143 common shares issued on the exercise of stock options and adding an additional
5,965,313 common shares to the 2006 Stock Option Plan for a total of 12,755,788 common shares
reserved under the 2006 Stock Option Plan.
In October 2008, December 2008, and October 2009, 200,000 options, 1,376,133 options, and
280,000 options, respectively, to acquire common shares at a weighted average exercise price of
$0.20 per share expired unexercised.
During Fiscal 2010 and 2011, 1,797,983 and 1,787,335 options, respectively, issued to Datacom
employees to acquire common shares at a weighted average price of $0.11 per share were forfeited
upon the termination of employment.
On January 14, 2010, the Company’s Board of Directors approved amendments to the 2006 Stock
Option Plan. The principal amendments were:
(i) to increase the maximum number of common shares issuable upon exercise of the options
granted to key employees, officers, directors and consultants of the Company pursuant to the
2006 Stock Option Plan from 12,755,788 to 22,500,000, representing less than 10% of the
total number of shares currently issued and outstanding; and
(ii) to increase the exercise period of stock options to a maximum of 10 years.
On April 6, 2010, the Company granted 3,711,725 options to its directors and employees with an
exercise price of $0.10 per common share, expiring February 24, 2014. One fourth of these options
vested on the date of the grant, and the remaining options vest equally at the half yearly anniversary
of the date of the grant. 200,000 of these options were granted to the Chairman of the board;
2,161,695 of these options were granted to seven other directors; and the balance of 1,350,000
options was granted to the employees.

BSM TECHNOLOGIES INC. Notes to Interim Consolidated Financial Statements – Unaudited (continued) Three and Nine months ended June 30, 2011 and 2010
13 | P a g e
5. Share capital: (continued)
On February 24, 2009, the Company granted 5,895,000 options to four of its directors with an
exercise price of $0.10 per common share, expiring February 24, 2014. One fourth of these options
vested on the date of the grant, and the remaining options vest equally at the half yearly anniversary
of the date of the grant. 4,295,000 of these options were granted to the President and CEO in his
capacity as President and CEO; 800,000 of these options were granted to the Chairman of the board
in his capacity as Chairman and board member; and the other two independent directors were
granted 400,000 options each in their capacity as board members.
The weighted average value of each option granted is estimated on the date of the grant using the
Black-Scholes option pricing model with the following weighted average assumptions:
30-Sep-2010
Risk-free rate 2.72% Expected volatility 115% Expected life in years 3.89 Expected dividend yield –
A summary of the Company's stock options is presented below:
30-Jun-2011 30-Sep-2010
Weighted Weighted average average Number of exercise Number of exercise options price options price
Balance, beginning of period 11,392,633 $ 0.11 10,708,921 $ 0.11 Cancelled/expired - - (280,000) 0.20 Forfeited (1,787,335) 0.09 (2,748,013) 0.11 Issued - - 3,711,725 0.10
Balance, end of period 9,605,298 0.11 11,392,633 0.11
The following table summarizes information about stock options outstanding and exercisable as at
June 30, 2011:
Outstanding Exercisable Remaining Remaining Exercise Number contractual Vested contractual price (i) outstanding life (years) options life (years)
$0.1000 8,656,695 2.66 6,585,431 2.66 $0.0943 459,348 6.18 459,348 6.18 $0.1768 93,327 5.98 93,327 5.98 $0.1977 395,928 4.86 395,928 4.86
9,605,298 3.51 7,534,034 3.05
BSM TECHNOLOGIES INC. Notes to Interim Consolidated Financial Statements – Unaudited (continued) Three and Nine months ended June 30, 2011 and 2010
14 | P a g e
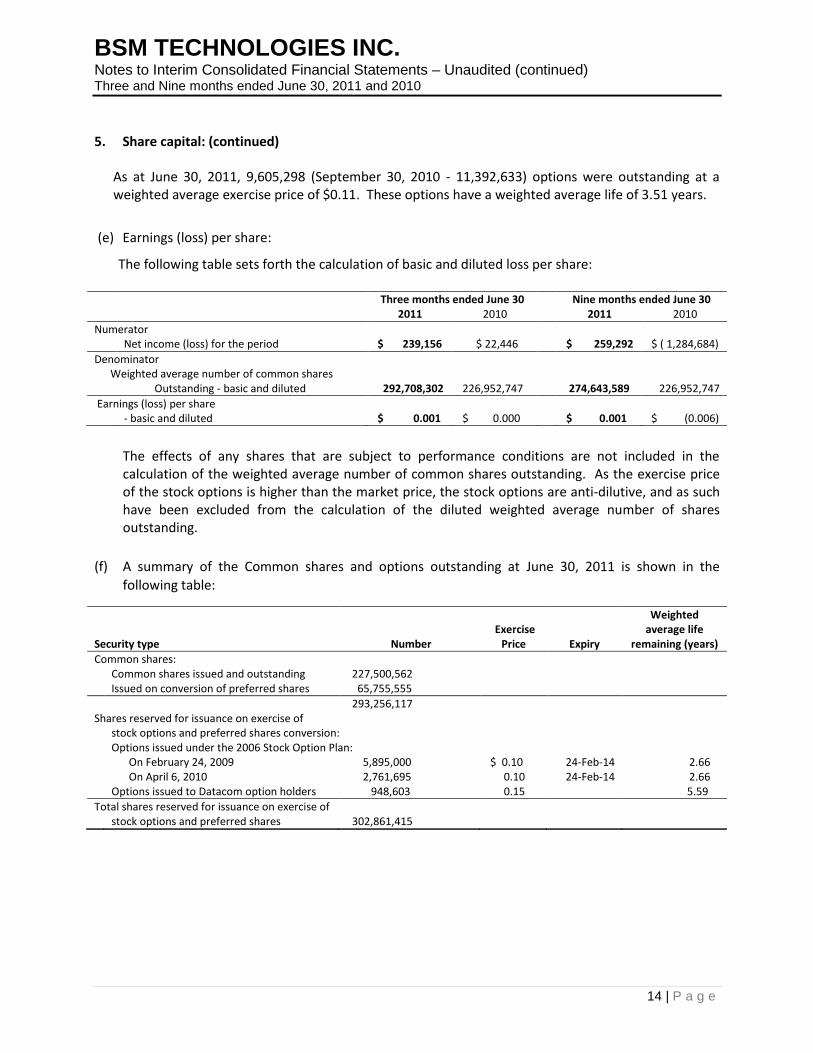
5. Share capital: (continued) As at June 30, 2011, 9,605,298 (September 30, 2010 - 11,392,633) options were outstanding at a weighted average exercise price of $0.11. These options have a weighted average life of 3.51 years.
(e) Earnings (loss) per share:
The following table sets forth the calculation of basic and diluted loss per share:
Three months ended June 30 Nine months ended June 30 2011 2010 2011 2010
Numerator Net income (loss) for the period $ 239,156 $ 22,446 $ 259,292 $ ( 1,284,684)
Denominator Weighted average number of common shares Outstanding - basic and diluted 292,708,302 226,952,747 274,643,589 226,952,747
Earnings (loss) per share - basic and diluted $ 0.001 $ 0.000 $ 0.001 $ (0.006)
The effects of any shares that are subject to performance conditions are not included in the calculation of the weighted average number of common shares outstanding. As the exercise price of the stock options is higher than the market price, the stock options are anti-dilutive, and as such have been excluded from the calculation of the diluted weighted average number of shares outstanding.
(f) A summary of the Common shares and options outstanding at June 30, 2011 is shown in the
following table:
Security type Number Exercise
Price Expiry
Weighted average life
remaining (years)
Common shares: Common shares issued and outstanding 227,500,562 Issued on conversion of preferred shares 65,755,555
293,256,117 Shares reserved for issuance on exercise of stock options and preferred shares conversion: Options issued under the 2006 Stock Option Plan: On February 24, 2009 5,895,000 $ 0.10 24-Feb-14 2.66 On April 6, 2010 2,761,695 0.10 24-Feb-14 2.66 Options issued to Datacom option holders 948,603 0.15 5.59
Total shares reserved for issuance on exercise of stock options and preferred shares 302,861,415

BSM TECHNOLOGIES INC. Notes to Interim Consolidated Financial Statements – Unaudited (continued) Three and Nine months ended June 30, 2011 and 2010
15 | P a g e
6. Cash flow statement:
Change in non-cash operating working capital:
Three months ended June 30 Nine months ended June 30 2011 2010 2011 2010
Accounts receivable $ (297,537) $ 11,968 $ (872,500) $ 149,821 Net investment in sales-type leases - including long term portion (7,785) (113,802) 94,405 (453,563) Investment tax credits receivable 232,939 (42,002) 232,939 (42,002) Inventories (77,653) (98,293) 51,255 (138,095) Prepaid expenses and other assets 52,689 62,942 87,222 28,925 Accounts payable and accrued liabilities (92,804) (243,368)
(79,308) (206,512)
Deferred revenue 157,287 16,377 28,837 (93,199)
$ (32,864) $ (406,178) $ (457,150) $ (754,625)
7. Cash and cash equivalents:
30-Jun-2011 30-Sep-2010
Cash $ 756,398 $ 912,438 Short-term investments 5,000 5,000
$ 761,398 $ 917,438
8. Segmented information:
(a) Revenue by geographic segment, based upon customer location, is as follows:
Three months ended June 30 Nine months ended June 30
2011 2010 2011 2010
Canada $2,980,721 $2,336,987 $8,000,139 $7,454,609
United States of America 488,182 661,710 1,762,355 1,330,538
International 446,174 421,752 1,322,744 1,439,077
$3,915,077 $3,420,449 $11,085,238 $10,224,224
(b) Revenue by category is as follows:
Three months ended June 30 Nine months ended June 30
2011 2010 2011 2010
Recurring service revenue $ 2,438,941 $ 2,030,270 $ 6,955,064 $ 6,023,804
Hardware & software revenue 1,476,136 1,390,179 4,130,174 4,200,420
$ 3,915,077 $ 3,420,449 $11,085,238 $10,224,224

BSM TECHNOLOGIES INC. Notes to Interim Consolidated Financial Statements – Unaudited (continued) Three and Nine months ended June 30, 2011 and 2010
16 | P a g e
8. Segmented information (continued):
(c) Assets:
30-Jun-2011 30-Sep-2010
Canada $ 7,681,749 $ 7,283,412 Belgium 28,992 432,894
$ 7,710,741 $ 7,716,306
9. Related party transactions:
(a) The Company had previously identified Nick Cirella, a director and former President and CEO of the
Company, Applied Innovations Group Inc. and other companies under Mr. Cirella's control as
related parties. The related parties are considered to have significant influence over the Company
as defined under CICA Handbook Section 3840, Related Party Transactions. During the three
months and nine months ended June 30, 2011, the Company paid $2,500 and $57,500 respectively,
(Three months and nine months ended June 30, 2010 - $25,000 and $55,000 respectively) to a
company under Mr. Cirella's control as consulting fees under a management contract between the
Company and Mr. Cirella.
(b) The Company has also identified (i) Onbelay Partners Ltd., a company controlled by Mr. John Bell, a
director and Mr. Aly Rahemtulla, director and CEO of the Company, (ii) Onbelay Capital Inc., a
company controlled by Mr. John Bell, and (iii) ANR Solutions Inc., a company controlled by Mr. Aly
Rahemtulla, as related parties. During the three and nine months ended June 30, 2011, the
company paid $Nil and $46,745 respectively to these related parties as preference dividends. (Three
and nine months ended June 30, 2010, $Nil and $12,892, respectively).
(c) During the three and nine months ended June 30, 2011, for board compensation, the Company paid
$5,000 and $30,250, respectively (Three months and nine months ended June 30, 2010 - $8,250 and
$15,250, respectively) for Mr. John Bell, a director of the board.
10. Commitments:
(a) Operating leases:
The Company has entered into leases for premises with the following total minimum annual
payments:
2011 (3 months) $ 52,786 2012 225,147 2013 383,810 2014 409,476 2015 and subsequent years 1,957,310
$ 3,028,529
BSM TECHNOLOGIES INC. Notes to Interim Consolidated Financial Statements – Unaudited (continued) Three and Nine months ended June 30, 2011 and 2010
17 | P a g e
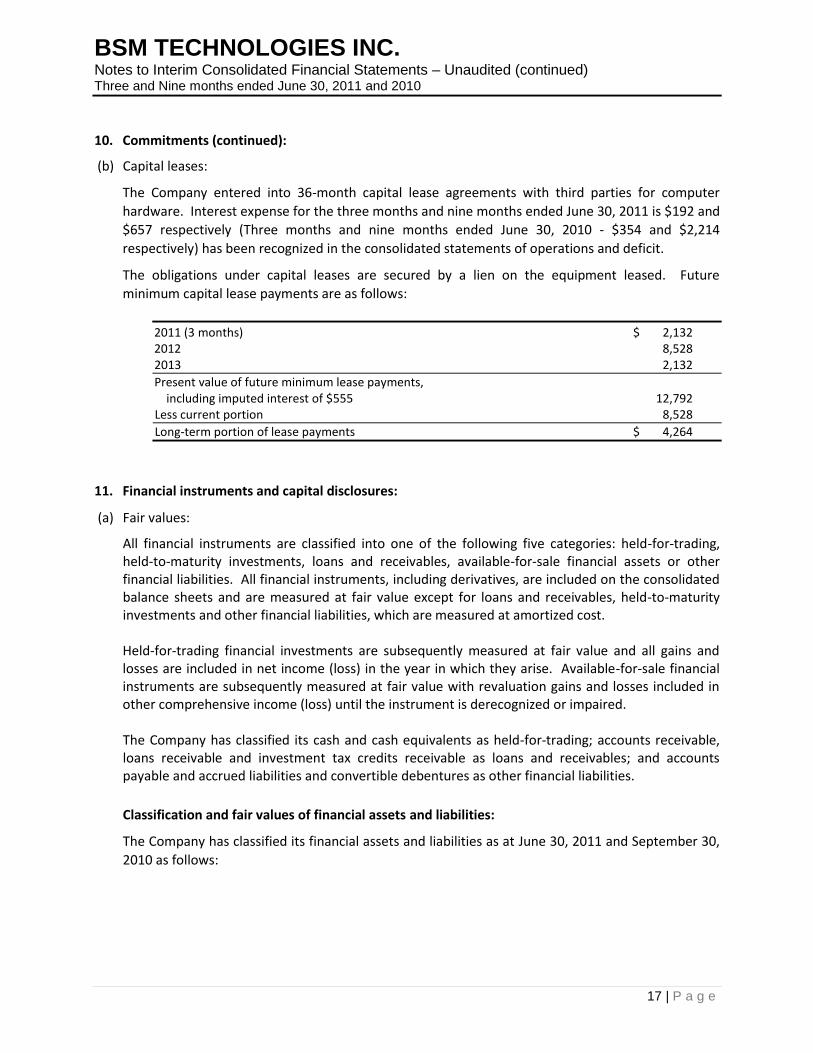
10. Commitments (continued):
(b) Capital leases:
The Company entered into 36-month capital lease agreements with third parties for computer
hardware. Interest expense for the three months and nine months ended June 30, 2011 is $192 and
$657 respectively (Three months and nine months ended June 30, 2010 - $354 and $2,214
respectively) has been recognized in the consolidated statements of operations and deficit.
The obligations under capital leases are secured by a lien on the equipment leased. Future
minimum capital lease payments are as follows:
2011 (3 months) $ 2,132 2012 8,528 2013 2,132
Present value of future minimum lease payments, including imputed interest of $555 12,792
Less current portion 8,528
Long-term portion of lease payments $ 4,264
11. Financial instruments and capital disclosures:
(a) Fair values:
All financial instruments are classified into one of the following five categories: held-for-trading, held-to-maturity investments, loans and receivables, available-for-sale financial assets or other financial liabilities. All financial instruments, including derivatives, are included on the consolidated balance sheets and are measured at fair value except for loans and receivables, held-to-maturity investments and other financial liabilities, which are measured at amortized cost. Held-for-trading financial investments are subsequently measured at fair value and all gains and losses are included in net income (loss) in the year in which they arise. Available-for-sale financial instruments are subsequently measured at fair value with revaluation gains and losses included in other comprehensive income (loss) until the instrument is derecognized or impaired. The Company has classified its cash and cash equivalents as held-for-trading; accounts receivable, loans receivable and investment tax credits receivable as loans and receivables; and accounts payable and accrued liabilities and convertible debentures as other financial liabilities.
Classification and fair values of financial assets and liabilities:
The Company has classified its financial assets and liabilities as at June 30, 2011 and September 30,
2010 as follows:
BSM TECHNOLOGIES INC. Notes to Interim Consolidated Financial Statements – Unaudited (continued) Three and Nine months ended June 30, 2011 and 2010
18 | P a g e
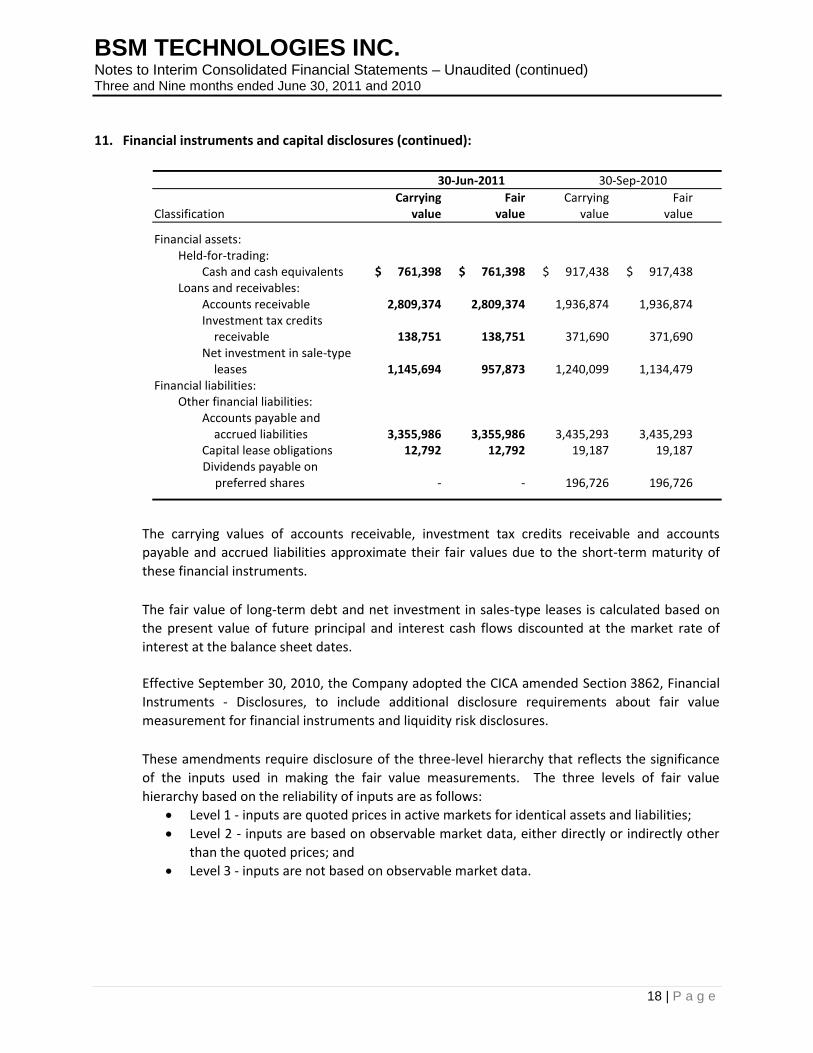
11. Financial instruments and capital disclosures (continued):
30-Jun-2011 30-Sep-2010
Carrying Fair Carrying Fair Classification value value value value
Financial assets: Held-for-trading:
Cash and cash equivalents $ 761,398 $ 761,398 $ 917,438 $ 917,438 Loans and receivables:
Accounts receivable 2,809,374 2,809,374 1,936,874 1,936,874 Investment tax credits
receivable 138,751 138,751 371,690 371,690 Net investment in sale-type
leases 1,145,694 957,873 1,240,099 1,134,479 Financial liabilities:
Other financial liabilities: Accounts payable and
accrued liabilities 3,355,986 3,355,986 3,435,293 3,435,293 Capital lease obligations 12,792 12,792 19,187 19,187 Dividends payable on
preferred shares - - 196,726 196,726
The carrying values of accounts receivable, investment tax credits receivable and accounts
payable and accrued liabilities approximate their fair values due to the short-term maturity of
these financial instruments.
The fair value of long-term debt and net investment in sales-type leases is calculated based on
the present value of future principal and interest cash flows discounted at the market rate of
interest at the balance sheet dates.
Effective September 30, 2010, the Company adopted the CICA amended Section 3862, Financial
Instruments - Disclosures, to include additional disclosure requirements about fair value
measurement for financial instruments and liquidity risk disclosures.
These amendments require disclosure of the three-level hierarchy that reflects the significance
of the inputs used in making the fair value measurements. The three levels of fair value
hierarchy based on the reliability of inputs are as follows:
Level 1 - inputs are quoted prices in active markets for identical assets and liabilities;
Level 2 - inputs are based on observable market data, either directly or indirectly other
than the quoted prices; and
Level 3 - inputs are not based on observable market data.

BSM TECHNOLOGIES INC. Notes to Interim Consolidated Financial Statements – Unaudited (continued) Three and Nine months ended June 30, 2011 and 2010
19 | P a g e
11. Financial instruments and capital disclosures (continued):
In the table below, the Company has segregated all financial assets and financial liabilities that are
measured at fair value into the most appropriate level within the fair value hierarchy, based on the
inputs used to determine the fair value at the measurement date. The Company has no financial
assets or financial liabilities measured using level 2 or level 3 inputs.
Financial assets measured at fair value as at September 30, 2010 and 2009 in the consolidated
financial statements are summarized below. The Company has no financial liabilities measured at
fair value.
30-Jun-2011 Level 1 Level 2 Level 3 Total
Cash and cash equivalents $ 761,398 $ – $ – $ 761,398
30-Sep-2010 Level 1 Level 2 Level 3 Total
Cash and cash equivalents $ 917,438 $ – $ – $ 917,438
(b) Credit risk:
Financial instruments that potentially subject the Company to concentrations of credit risk are
primarily accounts receivable. The Company performs ongoing credit evaluations of its customers'
financial condition and generally requires no collateral from its customers. Additionally, the
Company is not subject to any significant credit risk in view of the Company's large and diversified
client base.
(c) Foreign exchange risk:
The Company transacts business in multiple currencies, the most significant of which are the
Canadian dollar, the U.S. dollar and the Euro. The Company, through its subsidiary, generates
significant revenue in major foreign currencies, primarily U.S. dollars, which exceed the natural
hedge provided by purchases of goods and services in those currencies. Currently, the Company
does not enter into foreign exchange contracts to manage this exposure, but may do so in the
future. As a result, the Company has foreign currency exposure with respect to items denominated
in foreign currencies. Foreign currency-based earnings are translated into Canadian dollars using
the average exchange rate each year. As a result, fluctuations in the value of the Canadian dollar
relative to these other currencies will impact reported net loss. Foreign currency risks arising from
the translation of assets and liabilities of foreign operations into the Company's functional currency
are generally not hedged; however, the Company may decide to hedge this risk under certain
circumstances.

BSM TECHNOLOGIES INC. Notes to Interim Consolidated Financial Statements – Unaudited (continued) Three and Nine months ended June 30, 2011 and 2010
20 | P a g e
11. Financial instruments and capital disclosures (continued):
(d) Liquidity risk:
Liquidity risk is the risk that the Company is not able to meet its financial obligations as they fall due
or can do so only at excessive cost. The Company's growth is financed through a combination of the
cash flows from operations, the issuance of debt and the issuance of equity. One of management's
primary goals is to maintain an optimal level of liquidity through the active management of the
assets and liabilities as well as the cash flows.
On November 15, 2010, the Company obtained a secured revolving, demand facility with a Canadian
chartered bank, which allows for a borrowing limit of up to $1,500,000, subject to certain
conditions. The facility is secured by a first ranking security interest over all personal property of
the Company. In addition, the facility contains certain covenants that the Company is required to
comply with.
(e) Capital disclosure:
The Company considers its share capital and contributed surplus as capital, the total book value of
which is $23,929,053 as at June 30, 2011.
The Company manages its capital structure with the objective of providing sufficient resources to
meet day-to-day operating requirements; to allow it to enhance existing product offerings as well as
develop new ones; and to have the financial ability to expand the size of its operations by taking on
new customers.
In managing its capital structure, the Company takes into consideration various factors, including
the growth of its business and related infrastructure and the up-front cost of taking on new
customers. The Company's officers and senior management are responsible for managing the
Company's capital and do so through quarterly meetings and regular review of financial
information. The Company's Board of Directors is responsible for overseeing this process. The
Company manages its capital to ensure that there are adequate capital resources while maximizing
the return to shareholders through the optimization of the debt and equity balance.
Pursuant to the terms of the preferred shares, there are certain covenants of the Company in favour
of the preferred shareholders, including the pre-emptive rights to participate pro rata in any equity
or debt financings. While any preferred shares are outstanding, the Company is prohibited from
incurring senior debt, other than debt from a Schedule 1 or Schedule 2 bank for the purpose of
inventory and accounts receivable financing.
The Company is not subject to any externally imposed capital requirements.

BSM TECHNOLOGIES INC. Notes to Interim Consolidated Financial Statements – Unaudited (continued) Three and Nine months ended June 30, 2011 and 2010
21 | P a g e
12. Contributed surplus:
30-Jun-2011 30-Sep-2010
Balance, beginning of period $ 2,591,915 $ 2,497,637 Stock-based compensation expense 37,500 94,278
Balance, end of period $ 2,629,415 $ 2,591,915
13. Inventories:
During the three and nine months ended June 30, 2011, the Company recorded product cost of revenue
of $893,684 and $2,515,263 respectively (Three and nine months ended June 30, 2010 - $626,825 and
$1,767,547 respectively) related to the sale of inventories. There were no reversals of prior year
inventory write-downs during the year.
30-Jun-2011 30-Sep-2010
Finished goods $ 118,364 $ 80,760 Raw materials 534,210 706,069 Provision for obsolescence (20,400) (103,400)
$ 632,174 $ 683,429
14. Accounts receivable:
For the three and nine months ended June 30, 2011, general and administrative expenses includes bad
debts of $75,967 and $208,743, respectively (Three and nine months ended June 30, 2010 - $73,191 and
$326,087 respectively).
30-Jun-2011 30-Sep-2010
Accounts receivable $ 3,040,522 $ 2,125,026 Allowance for doubtful accounts (231,148) (188,152)
$ 2,809,374 $ 1,936,874
15. Net investment in sales-type leases:
The Company's net investment in sales-type leases includes the following:
30-Jun-2011 30-Sep-2010
Total minimum sales-type lease payments receivable $ 1,303,470 $ 1,426,517 Less amount representing interest 157,776 186,418
1,145,694 1,240,099 Less current portion of net investment in sales-type leases 591,069 677,857
$ 554,625 $ 562,242

BSM TECHNOLOGIES INC. Notes to Interim Consolidated Financial Statements – Unaudited (continued) Three and Nine months ended June 30, 2011 and 2010
22 | P a g e
15. Net investment in sales-type leases (continued):
Future minimum lease payments receivable under the sales-type leases are as follows:
2011 (3 months) $ 154,490 2012 666,457 2013 372,809 2014 109,714
$ 1,303,470
16. Contingencies:
In the normal course of its operations, the Company becomes involved in various legal claims and
lawsuits. The Company intends to vigorously defend these claims. While the final outcome with respect
to any actions outstanding or pending at June 30, 2011 cannot be predicted with certainty, it is the
opinion of management that the outstanding actions will not have a material adverse effect on the
Company's financial position.