uncertainty analysis of thunderstorm nowcasts for
TRANSCRIPT
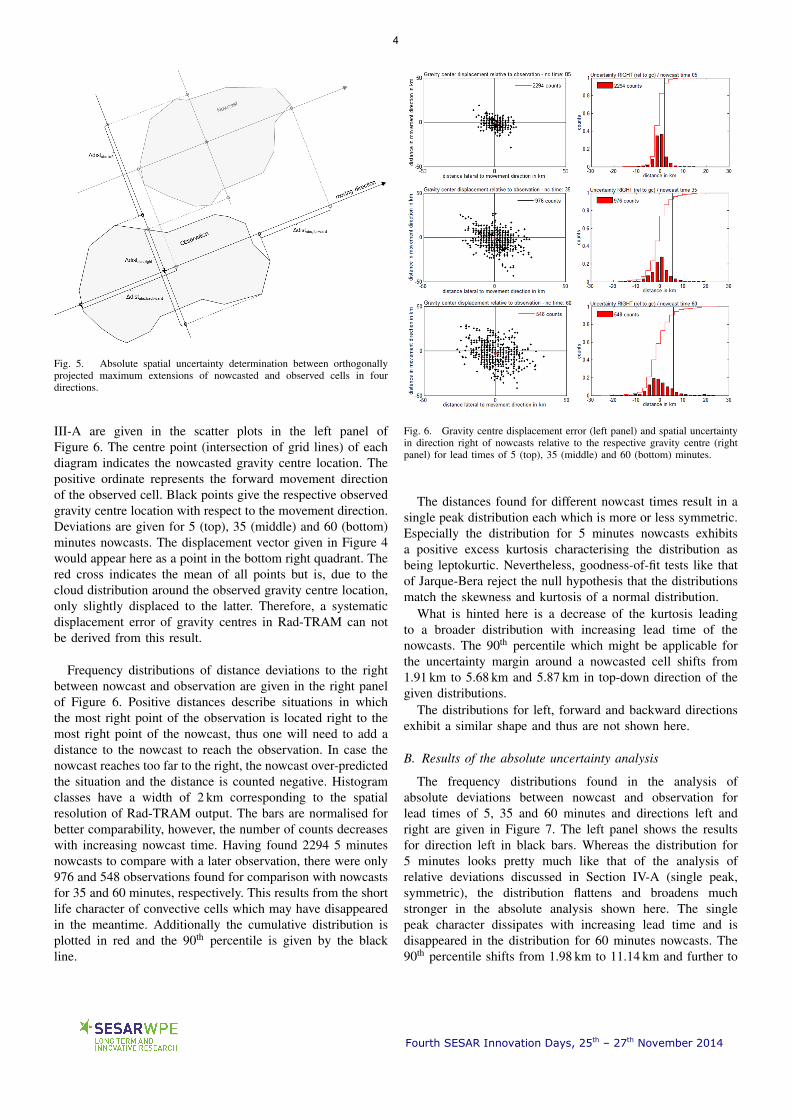
Fourth SESAR Innovation Days, 25th – 27th November 2014
Uncertainty Analysis of Thunderstorm Nowcasts forUtilization in Aircraft Routing
Manuela Sauer and Thomas HaufInstitute of Meteorology and Climatology
Leibniz Universitat HannoverHannover, Germany
Email: [email protected]
Caroline ForsterInstitute of Physics of the Atmosphere
Deutsches Zentrum fur Luft- und Raumfahrt (DLR)Oberpfaffenhofen, Germany
Email: [email protected]
Abstract—Weather related uncertainty is a major disturbingfactor in accurate aviation route planning. Adverse weather itselfimpacts the planning process but that might be mitigated ifweather forecasts or nowcasts are used. Knowing that no forecastis perfect, the forecast for a certain time will always differfrom the real weather at that time. Assuming that the forecastrepresents the best knowledge about the future development,deviations from it can be interpreted as the current inherentuncertainty of the forecast. We focus on thunderstorm nowcastsfor the next hour using the DLR Rad-TRAM nowcast system. Weanalyse the nowcast error, respectively the increasing uncertaintywith nowcast time by determining the spatial deviations ofnowcast and observed thunderstorm extension. An intuitivelyexpected increase of uncertainty with nowcast time is confirmedand quantified by the study results. A potential application ofthe uncertainty will be presented.
I. INTRODUCTION
Uncertainty is a major issue in air traffic very often causedby adverse weather affecting single flights or airports. Delaysof flights may accumulate and disturb the whole system. As in-troduced in the ComplexWorld Position Paper [2] uncertaintyis defined as being a condition of limited knowledge aboutthe current state or a future outcome. In the atmosphere someprocesses or at least their onset exhibit an inherent uncertaintythat prevent an accurate forecast [1].
Thunderstorms formed by convection emerging from atmo-spheric instabilities are one of such phenomena. On a spatialscale of several kilometres the lifetime of mid-size thunder-storms is 20 minutes to one hour. The onset of convection isa stochastic event in the spatially intense varying atmosphere.A minimum distortion may lead to only fair weather clouds oreven a much larger scale response which definitely has to beavoided by aircraft. The ability of weather forecast, regardlessof whether it is deterministic or probabilistic (the latter aretypically provided by an ensemble of slightly differing modelruns) to accurately predict a potential for deep convection islimited especially due to stochastic onset of thunderstorms andtheir small scale characteristics.
Once the stochastic event of convection has started, theevent becomes visible and its further development can bededuced based on observations. This is done by so callednowcast systems as Rad-TRAM that provide deterministicshort term forecasts, so called nowcasts, for up to one orseveral hours.
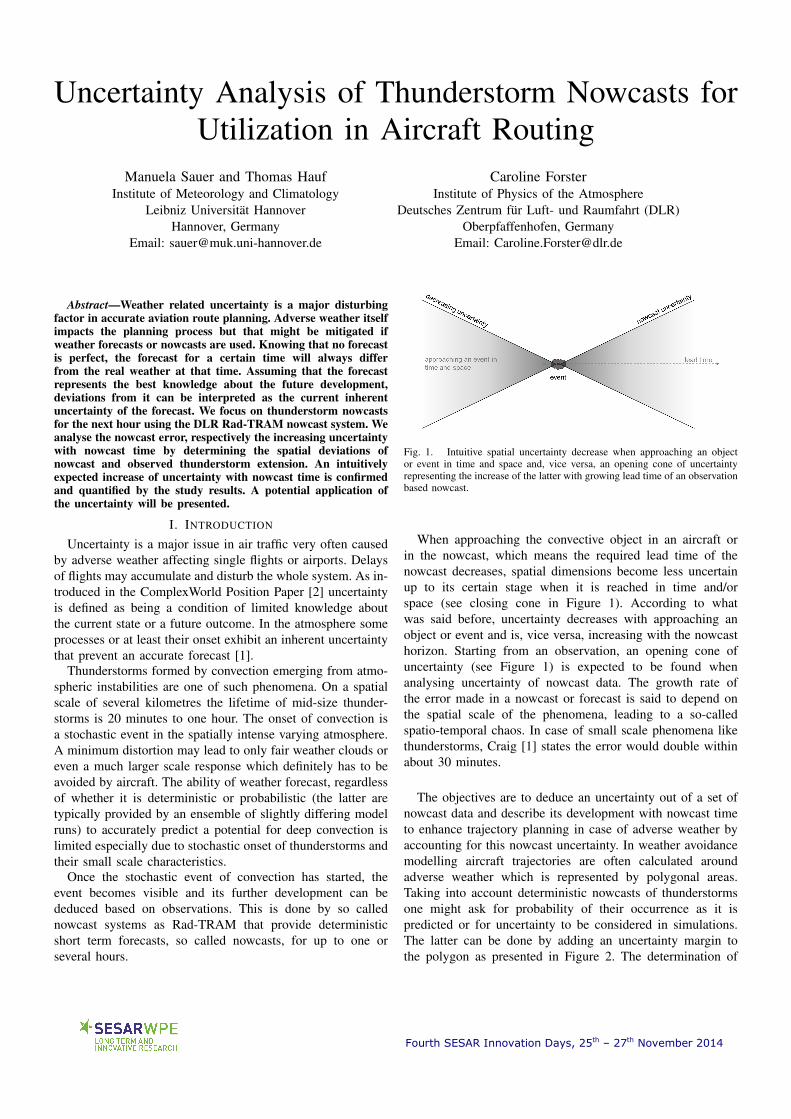
Fig. 1. Intuitive spatial uncertainty decrease when approaching an objector event in time and space and, vice versa, an opening cone of uncertaintyrepresenting the increase of the latter with growing lead time of an observationbased nowcast.
When approaching the convective object in an aircraft orin the nowcast, which means the required lead time of thenowcast decreases, spatial dimensions become less uncertainup to its certain stage when it is reached in time and/orspace (see closing cone in Figure 1). According to whatwas said before, uncertainty decreases with approaching anobject or event and is, vice versa, increasing with the nowcasthorizon. Starting from an observation, an opening cone ofuncertainty (see Figure 1) is expected to be found whenanalysing uncertainty of nowcast data. The growth rate ofthe error made in a nowcast or forecast is said to depend onthe spatial scale of the phenomena, leading to a so-calledspatio-temporal chaos. In case of small scale phenomena likethunderstorms, Craig [1] states the error would double withinabout 30 minutes.
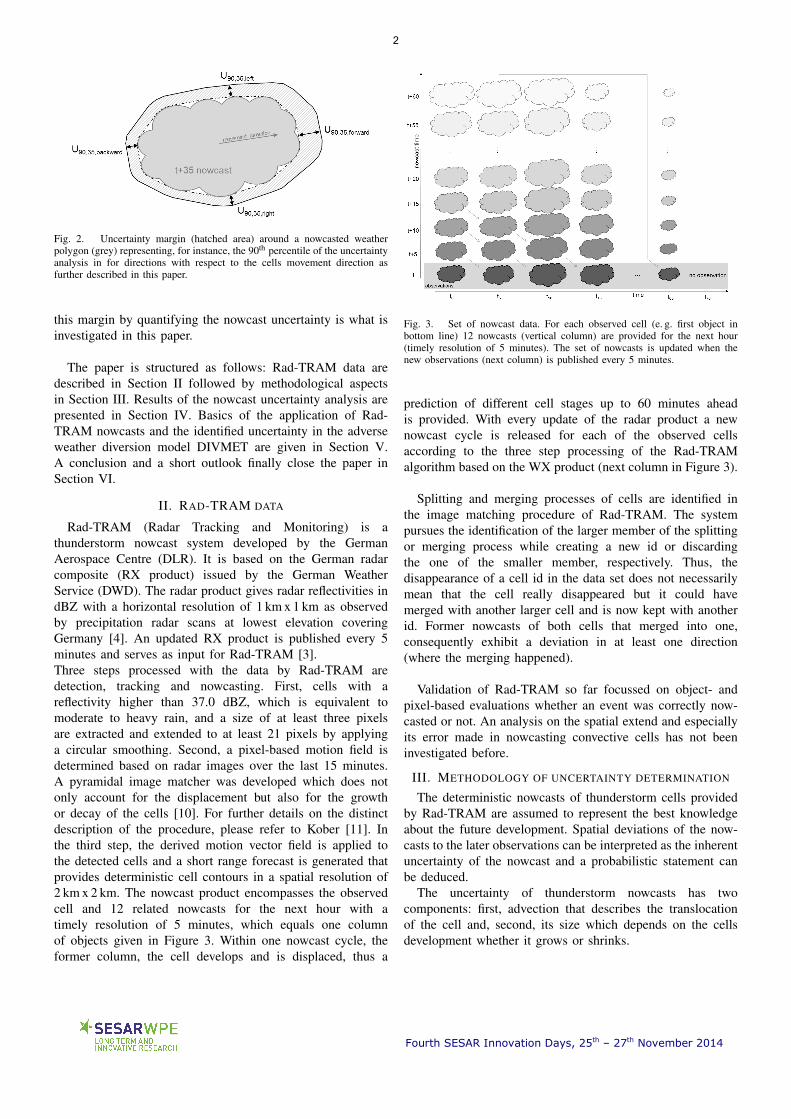
The objectives are to deduce an uncertainty out of a set ofnowcast data and describe its development with nowcast timeto enhance trajectory planning in case of adverse weather byaccounting for this nowcast uncertainty. In weather avoidancemodelling aircraft trajectories are often calculated aroundadverse weather which is represented by polygonal areas.Taking into account deterministic nowcasts of thunderstormsone might ask for probability of their occurrence as it ispredicted or for uncertainty to be considered in simulations.The latter can be done by adding an uncertainty margin tothe polygon as presented in Figure 2. The determination of
Fourth SESAR Innovation Days, 25th – 27th November 2014
Fig. 2. Uncertainty margin (hatched area) around a nowcasted weatherpolygon (grey) representing, for instance, the 90th percentile of the uncertaintyanalysis in for directions with respect to the cells movement direction asfurther described in this paper.
this margin by quantifying the nowcast uncertainty is what isinvestigated in this paper.
The paper is structured as follows: Rad-TRAM data aredescribed in Section II followed by methodological aspectsin Section III. Results of the nowcast uncertainty analysis arepresented in Section IV. Basics of the application of Rad-TRAM nowcasts and the identified uncertainty in the adverseweather diversion model DIVMET are given in Section V.A conclusion and a short outlook finally close the paper inSection VI.
II. RAD-TRAM DATA
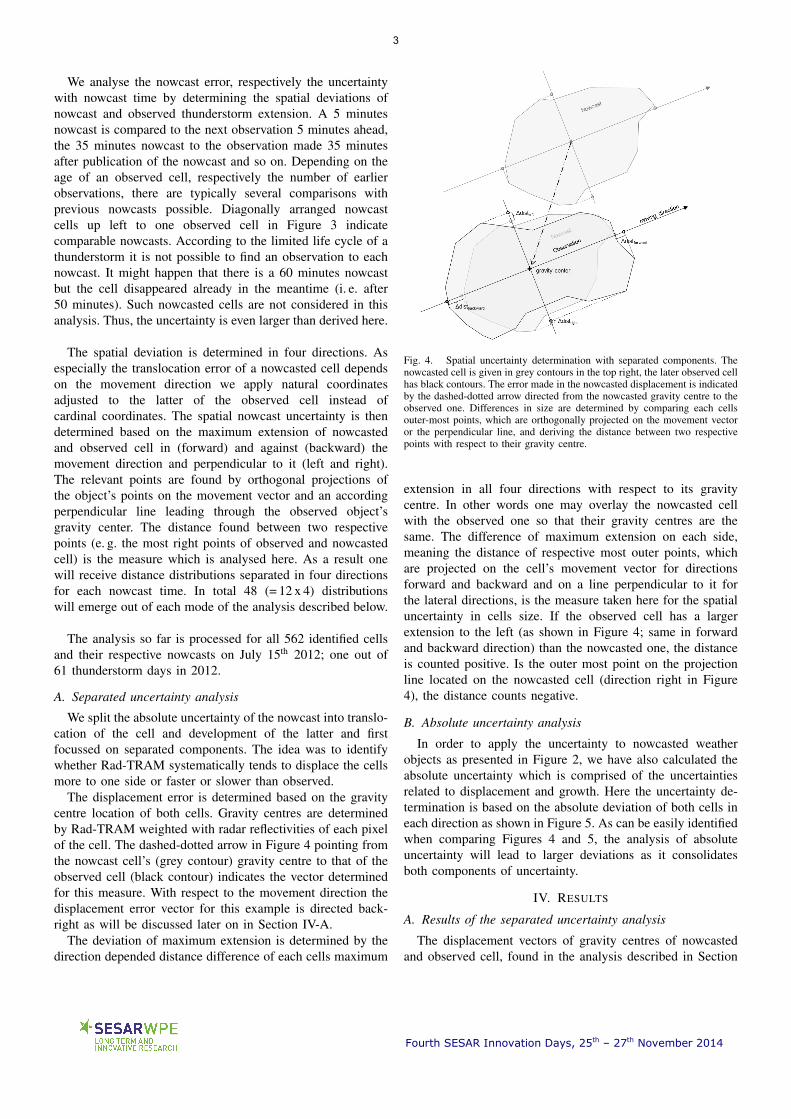
Rad-TRAM (Radar Tracking and Monitoring) is athunderstorm nowcast system developed by the GermanAerospace Centre (DLR). It is based on the German radarcomposite (RX product) issued by the German WeatherService (DWD). The radar product gives radar reflectivities indBZ with a horizontal resolution of 1 km x 1 km as observedby precipitation radar scans at lowest elevation coveringGermany [4]. An updated RX product is published every 5minutes and serves as input for Rad-TRAM [3].Three steps processed with the data by Rad-TRAM aredetection, tracking and nowcasting. First, cells with areflectivity higher than 37.0 dBZ, which is equivalent tomoderate to heavy rain, and a size of at least three pixelsare extracted and extended to at least 21 pixels by applyinga circular smoothing. Second, a pixel-based motion field isdetermined based on radar images over the last 15 minutes.A pyramidal image matcher was developed which does notonly account for the displacement but also for the growthor decay of the cells [10]. For further details on the distinctdescription of the procedure, please refer to Kober [11]. Inthe third step, the derived motion vector field is applied tothe detected cells and a short range forecast is generated thatprovides deterministic cell contours in a spatial resolution of2 km x 2 km. The nowcast product encompasses the observedcell and 12 related nowcasts for the next hour with atimely resolution of 5 minutes, which equals one columnof objects given in Figure 3. Within one nowcast cycle, theformer column, the cell develops and is displaced, thus a
Fig. 3. Set of nowcast data. For each observed cell (e. g. first object inbottom line) 12 nowcasts (vertical column) are provided for the next hour(timely resolution of 5 minutes). The set of nowcasts is updated when thenew observations (next column) is published every 5 minutes.
prediction of different cell stages up to 60 minutes aheadis provided. With every update of the radar product a newnowcast cycle is released for each of the observed cellsaccording to the three step processing of the Rad-TRAMalgorithm based on the WX product (next column in Figure 3).
Splitting and merging processes of cells are identified inthe image matching procedure of Rad-TRAM. The systempursues the identification of the larger member of the splittingor merging process while creating a new id or discardingthe one of the smaller member, respectively. Thus, thedisappearance of a cell id in the data set does not necessarilymean that the cell really disappeared but it could havemerged with another larger cell and is now kept with anotherid. Former nowcasts of both cells that merged into one,consequently exhibit a deviation in at least one direction(where the merging happened).
Validation of Rad-TRAM so far focussed on object- andpixel-based evaluations whether an event was correctly now-casted or not. An analysis on the spatial extend and especiallyits error made in nowcasting convective cells has not beeninvestigated before.
III. METHODOLOGY OF UNCERTAINTY DETERMINATION
The deterministic nowcasts of thunderstorm cells providedby Rad-TRAM are assumed to represent the best knowledgeabout the future development. Spatial deviations of the now-casts to the later observations can be interpreted as the inherentuncertainty of the nowcast and a probabilistic statement canbe deduced.
The uncertainty of thunderstorm nowcasts has twocomponents: first, advection that describes the translocationof the cell and, second, its size which depends on the cellsdevelopment whether it grows or shrinks.
2
Fourth SESAR Innovation Days, 25th – 27th November 2014
We analyse the nowcast error, respectively the uncertaintywith nowcast time by determining the spatial deviations ofnowcast and observed thunderstorm extension. A 5 minutesnowcast is compared to the next observation 5 minutes ahead,the 35 minutes nowcast to the observation made 35 minutesafter publication of the nowcast and so on. Depending on theage of an observed cell, respectively the number of earlierobservations, there are typically several comparisons withprevious nowcasts possible. Diagonally arranged nowcastcells up left to one observed cell in Figure 3 indicatecomparable nowcasts. According to the limited life cycle of athunderstorm it is not possible to find an observation to eachnowcast. It might happen that there is a 60 minutes nowcastbut the cell disappeared already in the meantime (i. e. after50 minutes). Such nowcasted cells are not considered in thisanalysis. Thus, the uncertainty is even larger than derived here.
The spatial deviation is determined in four directions. Asespecially the translocation error of a nowcasted cell dependson the movement direction we apply natural coordinatesadjusted to the latter of the observed cell instead ofcardinal coordinates. The spatial nowcast uncertainty is thendetermined based on the maximum extension of nowcastedand observed cell in (forward) and against (backward) themovement direction and perpendicular to it (left and right).The relevant points are found by orthogonal projections ofthe object’s points on the movement vector and an accordingperpendicular line leading through the observed object’sgravity center. The distance found between two respectivepoints (e. g. the most right points of observed and nowcastedcell) is the measure which is analysed here. As a result onewill receive distance distributions separated in four directionsfor each nowcast time. In total 48 (= 12 x 4) distributionswill emerge out of each mode of the analysis described below.
The analysis so far is processed for all 562 identified cellsand their respective nowcasts on July 15th 2012; one out of61 thunderstorm days in 2012.
A. Separated uncertainty analysis
We split the absolute uncertainty of the nowcast into translo-cation of the cell and development of the latter and firstfocussed on separated components. The idea was to identifywhether Rad-TRAM systematically tends to displace the cellsmore to one side or faster or slower than observed.
The displacement error is determined based on the gravitycentre location of both cells. Gravity centres are determinedby Rad-TRAM weighted with radar reflectivities of each pixelof the cell. The dashed-dotted arrow in Figure 4 pointing fromthe nowcast cell’s (grey contour) gravity centre to that of theobserved cell (black contour) indicates the vector determinedfor this measure. With respect to the movement direction thedisplacement error vector for this example is directed back-right as will be discussed later on in Section IV-A.
The deviation of maximum extension is determined by thedirection depended distance difference of each cells maximum
Fig. 4. Spatial uncertainty determination with separated components. Thenowcasted cell is given in grey contours in the top right, the later observed cellhas black contours. The error made in the nowcasted displacement is indicatedby the dashed-dotted arrow directed from the nowcasted gravity centre to theobserved one. Differences in size are determined by comparing each cellsouter-most points, which are orthogonally projected on the movement vectoror the perpendicular line, and deriving the distance between two respectivepoints with respect to their gravity centre.
extension in all four directions with respect to its gravitycentre. In other words one may overlay the nowcasted cellwith the observed one so that their gravity centres are thesame. The difference of maximum extension on each side,meaning the distance of respective most outer points, whichare projected on the cell’s movement vector for directionsforward and backward and on a line perpendicular to it forthe lateral directions, is the measure taken here for the spatialuncertainty in cells size. If the observed cell has a largerextension to the left (as shown in Figure 4; same in forwardand backward direction) than the nowcasted one, the distanceis counted positive. Is the outer most point on the projectionline located on the nowcasted cell (direction right in Figure4), the distance counts negative.
B. Absolute uncertainty analysis
In order to apply the uncertainty to nowcasted weatherobjects as presented in Figure 2, we have also calculated theabsolute uncertainty which is comprised of the uncertaintiesrelated to displacement and growth. Here the uncertainty de-termination is based on the absolute deviation of both cells ineach direction as shown in Figure 5. As can be easily identifiedwhen comparing Figures 4 and 5, the analysis of absoluteuncertainty will lead to larger deviations as it consolidatesboth components of uncertainty.
IV. RESULTS
A. Results of the separated uncertainty analysis
The displacement vectors of gravity centres of nowcastedand observed cell, found in the analysis described in Section
3
Fourth SESAR Innovation Days, 25th – 27th November 2014
Fig. 5. Absolute spatial uncertainty determination between orthogonallyprojected maximum extensions of nowcasted and observed cells in fourdirections.
III-A are given in the scatter plots in the left panel ofFigure 6. The centre point (intersection of grid lines) of eachdiagram indicates the nowcasted gravity centre location. Thepositive ordinate represents the forward movement directionof the observed cell. Black points give the respective observedgravity centre location with respect to the movement direction.Deviations are given for 5 (top), 35 (middle) and 60 (bottom)minutes nowcasts. The displacement vector given in Figure 4would appear here as a point in the bottom right quadrant. Thered cross indicates the mean of all points but is, due to thecloud distribution around the observed gravity centre location,only slightly displaced to the latter. Therefore, a systematicdisplacement error of gravity centres in Rad-TRAM can notbe derived from this result.
Frequency distributions of distance deviations to the rightbetween nowcast and observation are given in the right panelof Figure 6. Positive distances describe situations in whichthe most right point of the observation is located right to themost right point of the nowcast, thus one will need to add adistance to the nowcast to reach the observation. In case thenowcast reaches too far to the right, the nowcast over-predictedthe situation and the distance is counted negative. Histogramclasses have a width of 2 km corresponding to the spatialresolution of Rad-TRAM output. The bars are normalised forbetter comparability, however, the number of counts decreaseswith increasing nowcast time. Having found 2294 5 minutesnowcasts to compare with a later observation, there were only976 and 548 observations found for comparison with nowcastsfor 35 and 60 minutes, respectively. This results from the shortlife character of convective cells which may have disappearedin the meantime. Additionally the cumulative distribution isplotted in red and the 90th percentile is given by the blackline.
Fig. 6. Gravity centre displacement error (left panel) and spatial uncertaintyin direction right of nowcasts relative to the respective gravity centre (rightpanel) for lead times of 5 (top), 35 (middle) and 60 (bottom) minutes.
The distances found for different nowcast times result in asingle peak distribution each which is more or less symmetric.Especially the distribution for 5 minutes nowcasts exhibitsa positive excess kurtosis characterising the distribution asbeing leptokurtic. Nevertheless, goodness-of-fit tests like thatof Jarque-Bera reject the null hypothesis that the distributionsmatch the skewness and kurtosis of a normal distribution.
What is hinted here is a decrease of the kurtosis leadingto a broader distribution with increasing lead time of thenowcasts. The 90th percentile which might be applicable forthe uncertainty margin around a nowcasted cell shifts from1.91 km to 5.68 km and 5.87 km in top-down direction of thegiven distributions.
The distributions for left, forward and backward directionsexhibit a similar shape and thus are not shown here.
B. Results of the absolute uncertainty analysis
The frequency distributions found in the analysis ofabsolute deviations between nowcast and observation forlead times of 5, 35 and 60 minutes and directions left andright are given in Figure 7. The left panel shows the resultsfor direction left in black bars. Whereas the distribution for5 minutes looks pretty much like that of the analysis ofrelative deviations discussed in Section IV-A (single peak,symmetric), the distribution flattens and broadens muchstronger in the absolute analysis shown here. The singlepeak character dissipates with increasing lead time and isdisappeared in the distribution for 60 minutes nowcasts. The90th percentile shifts from 1.98 km to 11.14 km and further to
4
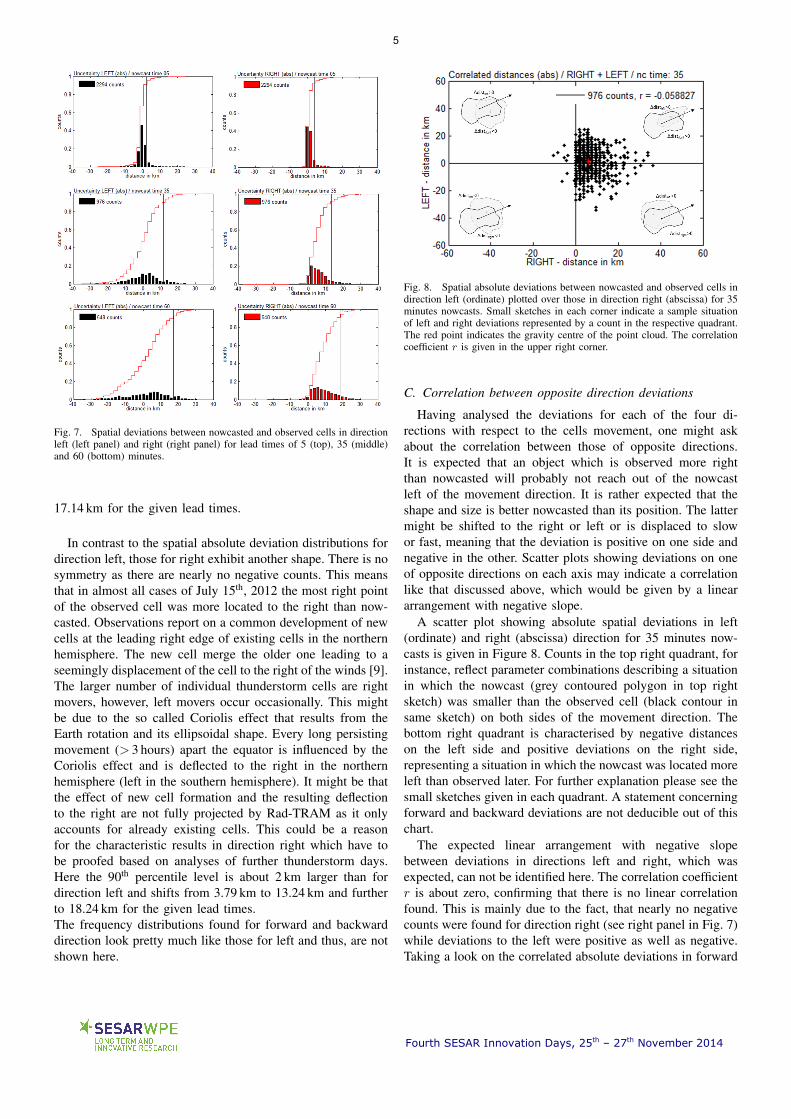
Fourth SESAR Innovation Days, 25th – 27th November 2014
Fig. 7. Spatial deviations between nowcasted and observed cells in directionleft (left panel) and right (right panel) for lead times of 5 (top), 35 (middle)and 60 (bottom) minutes.
17.14 km for the given lead times.
In contrast to the spatial absolute deviation distributions fordirection left, those for right exhibit another shape. There is nosymmetry as there are nearly no negative counts. This meansthat in almost all cases of July 15th, 2012 the most right pointof the observed cell was more located to the right than now-casted. Observations report on a common development of newcells at the leading right edge of existing cells in the northernhemisphere. The new cell merge the older one leading to aseemingly displacement of the cell to the right of the winds [9].The larger number of individual thunderstorm cells are rightmovers, however, left movers occur occasionally. This mightbe due to the so called Coriolis effect that results from theEarth rotation and its ellipsoidal shape. Every long persistingmovement (> 3 hours) apart the equator is influenced by theCoriolis effect and is deflected to the right in the northernhemisphere (left in the southern hemisphere). It might be thatthe effect of new cell formation and the resulting deflectionto the right are not fully projected by Rad-TRAM as it onlyaccounts for already existing cells. This could be a reasonfor the characteristic results in direction right which have tobe proofed based on analyses of further thunderstorm days.Here the 90th percentile level is about 2 km larger than fordirection left and shifts from 3.79 km to 13.24 km and furtherto 18.24 km for the given lead times.The frequency distributions found for forward and backwarddirection look pretty much like those for left and thus, are notshown here.
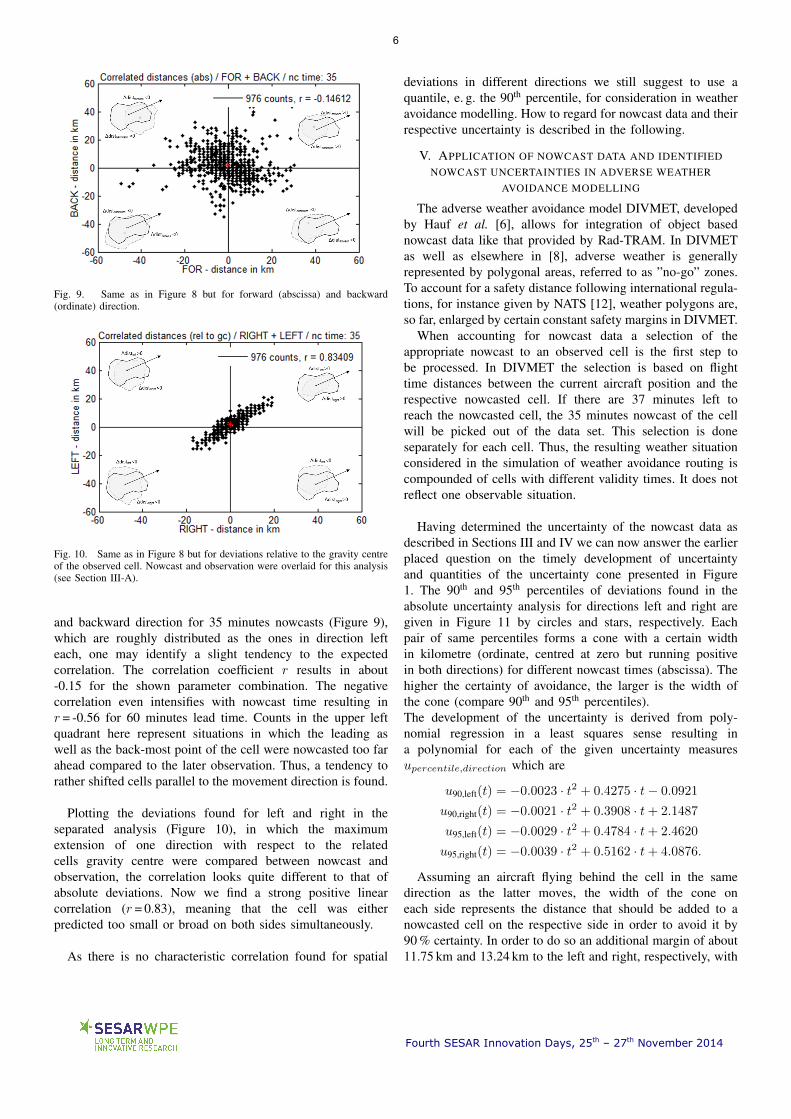
Fig. 8. Spatial absolute deviations between nowcasted and observed cells indirection left (ordinate) plotted over those in direction right (abscissa) for 35minutes nowcasts. Small sketches in each corner indicate a sample situationof left and right deviations represented by a count in the respective quadrant.The red point indicates the gravity centre of the point cloud. The correlationcoefficient r is given in the upper right corner.
C. Correlation between opposite direction deviations
Having analysed the deviations for each of the four di-rections with respect to the cells movement, one might askabout the correlation between those of opposite directions.It is expected that an object which is observed more rightthan nowcasted will probably not reach out of the nowcastleft of the movement direction. It is rather expected that theshape and size is better nowcasted than its position. The lattermight be shifted to the right or left or is displaced to slowor fast, meaning that the deviation is positive on one side andnegative in the other. Scatter plots showing deviations on oneof opposite directions on each axis may indicate a correlationlike that discussed above, which would be given by a lineararrangement with negative slope.
A scatter plot showing absolute spatial deviations in left(ordinate) and right (abscissa) direction for 35 minutes now-casts is given in Figure 8. Counts in the top right quadrant, forinstance, reflect parameter combinations describing a situationin which the nowcast (grey contoured polygon in top rightsketch) was smaller than the observed cell (black contour insame sketch) on both sides of the movement direction. Thebottom right quadrant is characterised by negative distanceson the left side and positive deviations on the right side,representing a situation in which the nowcast was located moreleft than observed later. For further explanation please see thesmall sketches given in each quadrant. A statement concerningforward and backward deviations are not deducible out of thischart.
The expected linear arrangement with negative slopebetween deviations in directions left and right, which wasexpected, can not be identified here. The correlation coefficientr is about zero, confirming that there is no linear correlationfound. This is mainly due to the fact, that nearly no negativecounts were found for direction right (see right panel in Fig. 7)while deviations to the left were positive as well as negative.Taking a look on the correlated absolute deviations in forward
5
Fourth SESAR Innovation Days, 25th – 27th November 2014
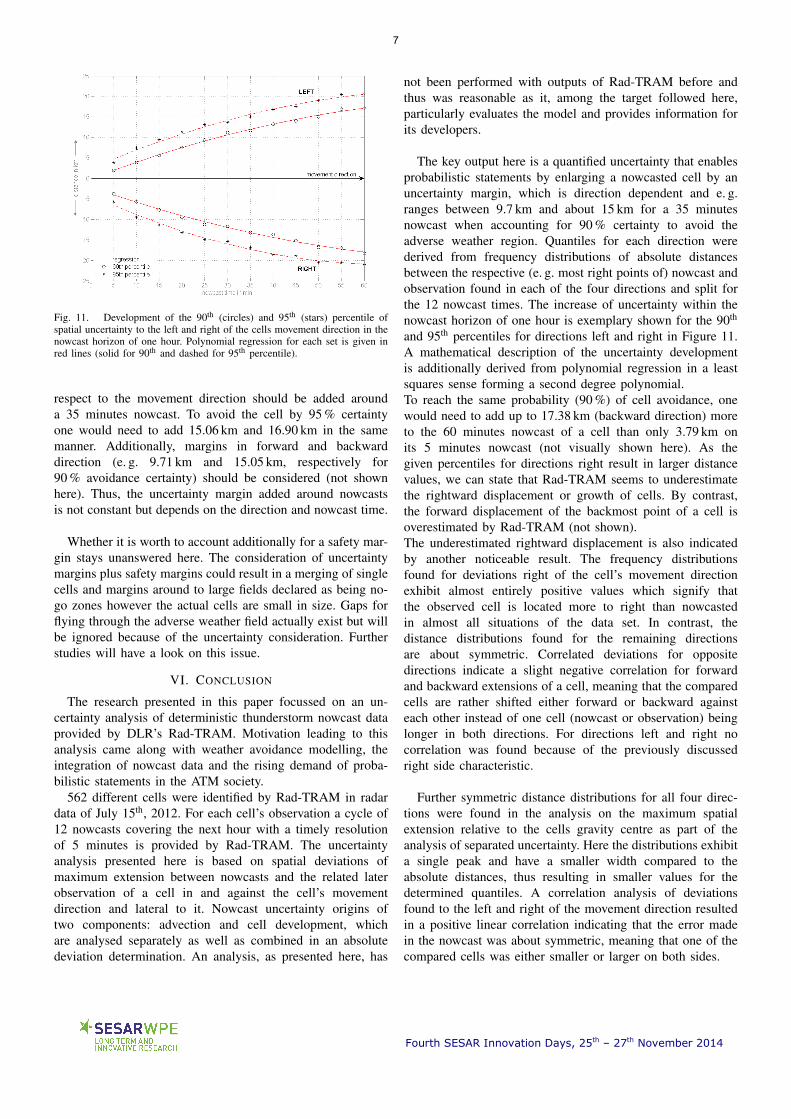
Fig. 9. Same as in Figure 8 but for forward (abscissa) and backward(ordinate) direction.
Fig. 10. Same as in Figure 8 but for deviations relative to the gravity centreof the observed cell. Nowcast and observation were overlaid for this analysis(see Section III-A).
and backward direction for 35 minutes nowcasts (Figure 9),which are roughly distributed as the ones in direction lefteach, one may identify a slight tendency to the expectedcorrelation. The correlation coefficient r results in about-0.15 for the shown parameter combination. The negativecorrelation even intensifies with nowcast time resulting inr = -0.56 for 60 minutes lead time. Counts in the upper leftquadrant here represent situations in which the leading aswell as the back-most point of the cell were nowcasted too farahead compared to the later observation. Thus, a tendency torather shifted cells parallel to the movement direction is found.
Plotting the deviations found for left and right in theseparated analysis (Figure 10), in which the maximumextension of one direction with respect to the relatedcells gravity centre were compared between nowcast andobservation, the correlation looks quite different to that ofabsolute deviations. Now we find a strong positive linearcorrelation (r = 0.83), meaning that the cell was eitherpredicted too small or broad on both sides simultaneously.
As there is no characteristic correlation found for spatial
deviations in different directions we still suggest to use aquantile, e. g. the 90th percentile, for consideration in weatheravoidance modelling. How to regard for nowcast data and theirrespective uncertainty is described in the following.
V. APPLICATION OF NOWCAST DATA AND IDENTIFIEDNOWCAST UNCERTAINTIES IN ADVERSE WEATHER
AVOIDANCE MODELLING
The adverse weather avoidance model DIVMET, developedby Hauf et al. [6], allows for integration of object basednowcast data like that provided by Rad-TRAM. In DIVMETas well as elsewhere in [8], adverse weather is generallyrepresented by polygonal areas, referred to as ”no-go” zones.To account for a safety distance following international regula-tions, for instance given by NATS [12], weather polygons are,so far, enlarged by certain constant safety margins in DIVMET.
When accounting for nowcast data a selection of theappropriate nowcast to an observed cell is the first step tobe processed. In DIVMET the selection is based on flighttime distances between the current aircraft position and therespective nowcasted cell. If there are 37 minutes left toreach the nowcasted cell, the 35 minutes nowcast of the cellwill be picked out of the data set. This selection is doneseparately for each cell. Thus, the resulting weather situationconsidered in the simulation of weather avoidance routing iscompounded of cells with different validity times. It does notreflect one observable situation.
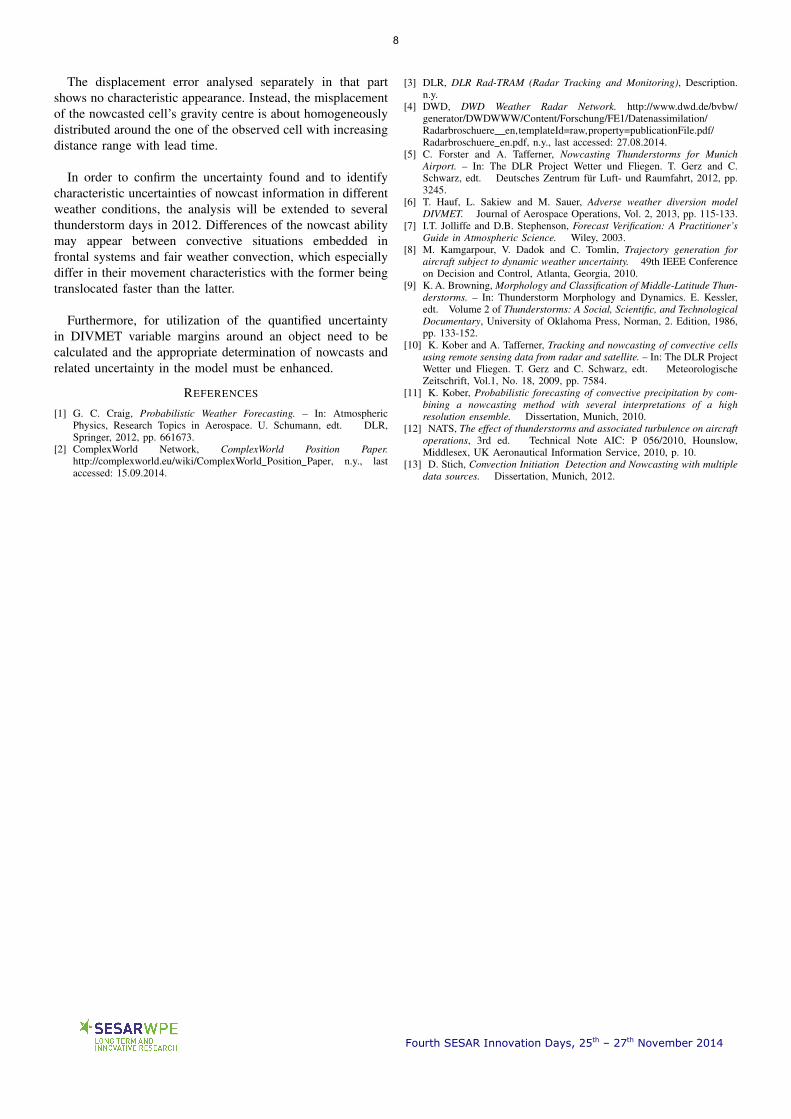
Having determined the uncertainty of the nowcast data asdescribed in Sections III and IV we can now answer the earlierplaced question on the timely development of uncertaintyand quantities of the uncertainty cone presented in Figure1. The 90th and 95th percentiles of deviations found in theabsolute uncertainty analysis for directions left and right aregiven in Figure 11 by circles and stars, respectively. Eachpair of same percentiles forms a cone with a certain widthin kilometre (ordinate, centred at zero but running positivein both directions) for different nowcast times (abscissa). Thehigher the certainty of avoidance, the larger is the width ofthe cone (compare 90th and 95th percentiles).The development of the uncertainty is derived from poly-nomial regression in a least squares sense resulting ina polynomial for each of the given uncertainty measuresupercentile,direction which are
u90,left(t) = −0.0023 · t2 + 0.4275 · t− 0.0921
u90,right(t) = −0.0021 · t2 + 0.3908 · t+ 2.1487
u95,left(t) = −0.0029 · t2 + 0.4784 · t+ 2.4620
u95,right(t) = −0.0039 · t2 + 0.5162 · t+ 4.0876.
Assuming an aircraft flying behind the cell in the samedirection as the latter moves, the width of the cone oneach side represents the distance that should be added to anowcasted cell on the respective side in order to avoid it by90 % certainty. In order to do so an additional margin of about11.75 km and 13.24 km to the left and right, respectively, with
6
Fourth SESAR Innovation Days, 25th – 27th November 2014
Fig. 11. Development of the 90th (circles) and 95th (stars) percentile ofspatial uncertainty to the left and right of the cells movement direction in thenowcast horizon of one hour. Polynomial regression for each set is given inred lines (solid for 90th and dashed for 95th percentile).
respect to the movement direction should be added arounda 35 minutes nowcast. To avoid the cell by 95 % certaintyone would need to add 15.06 km and 16.90 km in the samemanner. Additionally, margins in forward and backwarddirection (e. g. 9.71 km and 15.05 km, respectively for90 % avoidance certainty) should be considered (not shownhere). Thus, the uncertainty margin added around nowcastsis not constant but depends on the direction and nowcast time.
Whether it is worth to account additionally for a safety mar-gin stays unanswered here. The consideration of uncertaintymargins plus safety margins could result in a merging of singlecells and margins around to large fields declared as being no-go zones however the actual cells are small in size. Gaps forflying through the adverse weather field actually exist but willbe ignored because of the uncertainty consideration. Furtherstudies will have a look on this issue.
VI. CONCLUSION
The research presented in this paper focussed on an un-certainty analysis of deterministic thunderstorm nowcast dataprovided by DLR’s Rad-TRAM. Motivation leading to thisanalysis came along with weather avoidance modelling, theintegration of nowcast data and the rising demand of proba-bilistic statements in the ATM society.
562 different cells were identified by Rad-TRAM in radardata of July 15th, 2012. For each cell’s observation a cycle of12 nowcasts covering the next hour with a timely resolutionof 5 minutes is provided by Rad-TRAM. The uncertaintyanalysis presented here is based on spatial deviations ofmaximum extension between nowcasts and the related laterobservation of a cell in and against the cell’s movementdirection and lateral to it. Nowcast uncertainty origins oftwo components: advection and cell development, whichare analysed separately as well as combined in an absolutedeviation determination. An analysis, as presented here, has
not been performed with outputs of Rad-TRAM before andthus was reasonable as it, among the target followed here,particularly evaluates the model and provides information forits developers.
The key output here is a quantified uncertainty that enablesprobabilistic statements by enlarging a nowcasted cell by anuncertainty margin, which is direction dependent and e. g.ranges between 9.7 km and about 15 km for a 35 minutesnowcast when accounting for 90 % certainty to avoid theadverse weather region. Quantiles for each direction werederived from frequency distributions of absolute distancesbetween the respective (e. g. most right points of) nowcast andobservation found in each of the four directions and split forthe 12 nowcast times. The increase of uncertainty within thenowcast horizon of one hour is exemplary shown for the 90th
and 95th percentiles for directions left and right in Figure 11.A mathematical description of the uncertainty developmentis additionally derived from polynomial regression in a leastsquares sense forming a second degree polynomial.To reach the same probability (90 %) of cell avoidance, onewould need to add up to 17.38 km (backward direction) moreto the 60 minutes nowcast of a cell than only 3.79 km onits 5 minutes nowcast (not visually shown here). As thegiven percentiles for directions right result in larger distancevalues, we can state that Rad-TRAM seems to underestimatethe rightward displacement or growth of cells. By contrast,the forward displacement of the backmost point of a cell isoverestimated by Rad-TRAM (not shown).The underestimated rightward displacement is also indicatedby another noticeable result. The frequency distributionsfound for deviations right of the cell’s movement directionexhibit almost entirely positive values which signify thatthe observed cell is located more to right than nowcastedin almost all situations of the data set. In contrast, thedistance distributions found for the remaining directionsare about symmetric. Correlated deviations for oppositedirections indicate a slight negative correlation for forwardand backward extensions of a cell, meaning that the comparedcells are rather shifted either forward or backward againsteach other instead of one cell (nowcast or observation) beinglonger in both directions. For directions left and right nocorrelation was found because of the previously discussedright side characteristic.
Further symmetric distance distributions for all four direc-tions were found in the analysis on the maximum spatialextension relative to the cells gravity centre as part of theanalysis of separated uncertainty. Here the distributions exhibita single peak and have a smaller width compared to theabsolute distances, thus resulting in smaller values for thedetermined quantiles. A correlation analysis of deviationsfound to the left and right of the movement direction resultedin a positive linear correlation indicating that the error madein the nowcast was about symmetric, meaning that one of thecompared cells was either smaller or larger on both sides.
7
Fourth SESAR Innovation Days, 25th – 27th November 2014
The displacement error analysed separately in that partshows no characteristic appearance. Instead, the misplacementof the nowcasted cell’s gravity centre is about homogeneouslydistributed around the one of the observed cell with increasingdistance range with lead time.
In order to confirm the uncertainty found and to identifycharacteristic uncertainties of nowcast information in differentweather conditions, the analysis will be extended to severalthunderstorm days in 2012. Differences of the nowcast abilitymay appear between convective situations embedded infrontal systems and fair weather convection, which especiallydiffer in their movement characteristics with the former beingtranslocated faster than the latter.
Furthermore, for utilization of the quantified uncertaintyin DIVMET variable margins around an object need to becalculated and the appropriate determination of nowcasts andrelated uncertainty in the model must be enhanced.
REFERENCES
[1] G. C. Craig, Probabilistic Weather Forecasting. – In: AtmosphericPhysics, Research Topics in Aerospace. U. Schumann, edt. DLR,Springer, 2012, pp. 661673.
[2] ComplexWorld Network, ComplexWorld Position Paper.http://complexworld.eu/wiki/ComplexWorld Position Paper, n.y., lastaccessed: 15.09.2014.
[3] DLR, DLR Rad-TRAM (Radar Tracking and Monitoring), Description.n.y.
[4] DWD, DWD Weather Radar Network. http://www.dwd.de/bvbw/generator/DWDWWW/Content/Forschung/FE1/Datenassimilation/Radarbroschuere en,templateId=raw,property=publicationFile.pdf/Radarbroschuere en.pdf, n.y., last accessed: 27.08.2014.
[5] C. Forster and A. Tafferner, Nowcasting Thunderstorms for MunichAirport. – In: The DLR Project Wetter und Fliegen. T. Gerz and C.Schwarz, edt. Deutsches Zentrum fur Luft- und Raumfahrt, 2012, pp.3245.
[6] T. Hauf, L. Sakiew and M. Sauer, Adverse weather diversion modelDIVMET. Journal of Aerospace Operations, Vol. 2, 2013, pp. 115-133.
[7] I.T. Jolliffe and D.B. Stephenson, Forecast Verification: A Practitioner’sGuide in Atmospheric Science. Wiley, 2003.
[8] M. Kamgarpour, V. Dadok and C. Tomlin, Trajectory generation foraircraft subject to dynamic weather uncertainty. 49th IEEE Conferenceon Decision and Control, Atlanta, Georgia, 2010.
[9] K. A. Browning, Morphology and Classification of Middle-Latitude Thun-derstorms. – In: Thunderstorm Morphology and Dynamics. E. Kessler,edt. Volume 2 of Thunderstorms: A Social, Scientific, and TechnologicalDocumentary, University of Oklahoma Press, Norman, 2. Edition, 1986,pp. 133-152.
[10] K. Kober and A. Tafferner, Tracking and nowcasting of convective cellsusing remote sensing data from radar and satellite. – In: The DLR ProjectWetter und Fliegen. T. Gerz and C. Schwarz, edt. MeteorologischeZeitschrift, Vol.1, No. 18, 2009, pp. 7584.
[11] K. Kober, Probabilistic forecasting of convective precipitation by com-bining a nowcasting method with several interpretations of a highresolution ensemble. Dissertation, Munich, 2010.
[12] NATS, The effect of thunderstorms and associated turbulence on aircraftoperations, 3rd ed. Technical Note AIC: P 056/2010, Hounslow,Middlesex, UK Aeronautical Information Service, 2010, p. 10.
[13] D. Stich, Convection Initiation Detection and Nowcasting with multipledata sources. Dissertation, Munich, 2012.
8