uncertainty model for the online uncertainty calculator ... · uncertainty model for the online...
TRANSCRIPT

Uncertainty model for the
online uncertainty calculator
for gas flow metering stations
March 2014
NORWEGIAN SOCIETY FOR OIL AND GAS MEASUREMENT

BERGEN - 19.03.2014 Ref. No.: CMR-14-A10099-RA-1 Rev.: 00
REPORT
Uncertainty model for the online uncertainty calculator for gas flow metering stations
Client Authors
Norwegian Society for Oil and Gas Measurement
Kjell-Eivind Frøysa, Gaute Øverås Lied


Ref. no.: CMR-14-A10099-RA-1 Rev.: 00 Date: 19.03.2014 Page 4 of 93
Uncertainty model for the online uncertainty calculator for gas flow metering stations Report
© Christian Michelsen Research AS.
Table of Contents
Disclaimer ............................................................................................................................................... 7
1 Introduction ................................................................................................................................ 8
2 Description of metering stations ........................................................................................... 10
3 Gas measurement uncertainties ............................................................................................ 11
3.1 Temperature measurement ....................................................................................................... 11
3.2 Pressure measurement ............................................................................................................. 12
3.3 Differential pressure measurement ........................................................................................... 13
3.4 Densitometer measurement ...................................................................................................... 14
3.5 Gas composition measurement ................................................................................................. 16
3.5.1 Gas chromatography measurement ......................................................................... 17
3.5.2 Spot sampling and laboratory analysis ..................................................................... 17
3.6 Gas quality parameters uncertainty........................................................................................... 18
3.6.1 Functional relationship .............................................................................................. 18
3.6.2 Uncertainty model ..................................................................................................... 19
4 Orifice fiscal metering stations .............................................................................................. 22
4.1 Description of metering station .................................................................................................. 22
4.2 Functional relationship .............................................................................................................. 22
4.2.1 General expressions ................................................................................................. 22
4.2.2 Expressions when densitometer is used .................................................................. 23
4.2.3 Expressions when densitometer is not used ............................................................ 24
4.3 Uncertainty model ..................................................................................................................... 24
4.3.1 When densitometer is used ...................................................................................... 24
4.3.2 When densitometer is not used ................................................................................ 25
4.4 Two flow meters in parallel ........................................................................................................ 26
4.4.1 Correlation classification ........................................................................................... 26
4.4.2 Specific uncertainty models, when densitometer is in use ....................................... 27
4.4.3 Specific uncertainty models, when densitometer is not in use ................................. 29
5 Coriolis fiscal metering station .............................................................................................. 31
5.1 Description of metering station .................................................................................................. 31
5.2 Functional relationship .............................................................................................................. 31
5.2.1 Mass flow rate, flow calibrated Coriolis meter .......................................................... 31
5.2.2 Standard volumetric flow rate and energy flow rate, flow calibrated Coriolis meter . 32
5.3 Uncertainty model, mass flow rate ............................................................................................ 32
5.3.1 Calibration uncertainty .............................................................................................. 32
5.3.2 Field uncertainty ........................................................................................................ 33
5.3.3 Total uncertainty in mass flow rate, one flow meter ................................................. 34
Uncertainty model for the online uncertainty calculator for gas flow metering stations Report
Ref. no.: CMR-14-A10099-RA-1 Rev.: 00 Date: 19.03.2014 Page 5 of 93
© Christian Michelsen Research AS.
5.4 Uncertainty model, standard volume and energy flow rate........................................................ 34
5.5 Two flow meters in parallel ........................................................................................................ 35
5.5.1 Correlation classification ............................................................................................ 35
5.5.2 Specific uncertainty models ....................................................................................... 35
5.6 Two flow meters in series........................................................................................................... 37
5.6.1 Correlation classification ............................................................................................ 38
5.6.2 Specific uncertainty models ....................................................................................... 38
6 USM fiscal metering stations .................................................................................................. 41
6.1 Description of metering station .................................................................................................. 41
6.2 Functional relationship ............................................................................................................... 41
6.2.1 Actual volume flow rate, flow calibrated USM meter ................................................. 41
6.2.2 Mass, standard volume and energy flow rate, flow calibrated USM meter ............... 42
6.3 Uncertainty model, actual volume flow rate ............................................................................... 43
6.3.1 Calibration uncertainty ............................................................................................... 43
6.3.2 Field uncertainty ........................................................................................................ 44
6.3.3 Total uncertainty in actual volume flow rate, one flow meter .................................... 45
6.4 Uncertainty model, mass, standard volume and energy flow rate ............................................. 45
6.4.1 Densitometer in use ................................................................................................... 46
6.4.2 Densitometer not in use ............................................................................................. 46
6.5 Two flow meters in parallel ........................................................................................................ 47
6.5.1 Correlation classification ............................................................................................ 47
6.5.2 Specific uncertainty model, densitometer in use ....................................................... 47
6.5.3 Specific uncertainty model, densitometer not in use ................................................. 50
6.6 Two flow meters in series........................................................................................................... 52
6.6.1 Correlation classification ............................................................................................ 52
6.6.2 Specific uncertainty model, densitometer in use ....................................................... 53
6.6.3 Specific uncertainty model, densitometer not in use ................................................. 55
7 Program .................................................................................................................................... 59
7.1 Software platform ....................................................................................................................... 59
7.2 Installation and use .................................................................................................................... 59
7.3 Program overview ...................................................................................................................... 59
7.3.1 Specify metering station template ............................................................................. 60
7.3.2 Conditions Page ........................................................................................................ 62
7.3.3 Gas Analysis Page .................................................................................................... 64
7.3.4 Flow Measurement Page ........................................................................................... 67
7.3.5 Uncertainty Calculation Results Page ....................................................................... 69
7.3.6 Uncertainty Budget Charts Page ............................................................................... 71
7.3.7 Uncertainty Range Plots Page .................................................................................. 72

Ref. no.: CMR-14-A10099-RA-1 Rev.: 00 Date: 19.03.2014 Page 6 of 93
Uncertainty model for the online uncertainty calculator for gas flow metering stations Report
© Christian Michelsen Research AS.
7.3.8 Uncertainty Report Page........................................................................................... 72
7.3.9 Note about “Save” and “Open” functionality ............................................................. 74
7.3.10 Note about “opening” an uncertainty analysis file ..................................................... 74
8 Summary .................................................................................................................................. 75
9 References ............................................................................................................................... 76
Appendix A Detailed formulas for uncertainty of correction factor after flow calibration .... 78
A 1 Functional relationship .............................................................................................................. 78
A 2 Uncertainty model ..................................................................................................................... 80
Appendix B Uncertainty model for two flow meters in parallel or in series ........................... 84
B 1 Generic uncertainty model for one flow meter .......................................................................... 84
B 2 Two flow meters in parallel ........................................................................................................ 85
B 3 Two flow meters in series .......................................................................................................... 87
Appendix C USM field uncertainty, detailed level ..................................................................... 91
Appendix D List of symbols......................................................................................................... 92
Uncertainty model for the online uncertainty calculator for gas flow metering stations Report
Ref. no.: CMR-14-A10099-RA-1 Rev.: 00 Date: 19.03.2014 Page 7 of 93
© Christian Michelsen Research AS.
Disclaimer
CMR is not liable in any form or manner for the actual use of the documents, software or other results made available for or resulting from a project and does not warrant or assume any liability or responsibility for the completeness or usefulness of any information unless not specifically agreed otherwise in the tender and resulting contract document.

Ref. no.: CMR-14-A10099-RA-1 Rev.: 00 Date: 19.03.2014 Page 8 of 93
Uncertainty model for the online uncertainty calculator for gas flow metering stations Report
© Christian Michelsen Research AS.
1 Introduction
Documentation of uncertainty of flow rates measured by fiscal flow metering stations is essential as part of the evaluation of the condition of such metering stations. Authorities have requirements with respect to maximum uncertainty in order to secure the national interests. The partners selling the gas have interests in the uncertainty to secure their incomes. Finally, buyers of gas have interest in ensuring that they are not getting a lower amount of gas than what they pay for. In order to get all parties to accept an uncertainty analysis, it is important to obtain standardized ways of carrying out such analyses. The ISO Guide to the expression of uncertainty in measurement, [ISO GUM] provides general methodology for carrying out uncertainty analyses. This methodology can also be applied in uncertainty analysis of fiscal gas metering stations. However, the ISO GUM does not give detailed methods for the specific uncertainty analyses for such metering stations (or other applications). Therefore models have to be developed based on the ISO GUM methodology. Similarly the ISO 5168 provides general procedures for evaluation of uncertainty for the measurement of fluid flow. Also the procedures in this standard have to be developed further in order to approach the uncertainty evaluation of a specific metering station. The Norwegian Society for Oil and Gas Measurement (NFOGM) in cooperation with the Norwegian Petroleum Directorate (NPD) and The Norwegian Society of Graduate Technical and Scientific Professionals (Tekna) have earlier issued Handbooks with uncertainty models for a fiscal ultrasonic gas metering station [Lunde et al, 2002] and a fiscal orifice gas metering station [Dahl et al, 2003]. These works are in agreement with the ISO GUM methodology, and were based on a previous version of the ISO GUM from 1995. The calculation of the uncertainty have in these works been based on an Excel spread sheet that can be downloaded for free from www.nfogm.no. In addition, uncertainty models for fiscal turbine oil metering stations [Dahl et al, 2003] and fiscal ultrasonic oil metering stations [Lunde et al, 2010] have been established. The present work is a further development of the uncertainty models for fiscal gas metering stations in [Lunde et al, 2002] and [Dahl et al, 2003]. The intention of this work was to establish an uncertainty analysis model covering the most common fiscal gas metering station configurations in use on the Norwegian Sector. The intention was also to make a tool in which a complete uncertainty analysis for a gas metering station can be performed within one tool in a minimum of time. This is achieved as the tool calculates all necessary parameters from a minimum of inputs, having reasonable default values, having default input values for uncertainty in accordance with requirements in the Norwegian measurement regulations and NORSOK and by making it easy to define the most common metering station configurations in the tool. The uncertainty model has been made more flexible, allowing gas chromatographs and also gas sampling. In addition to orifice and ultrasonic flow metering stations also Coriolis flow metering stations are covered. Two meters in parallel are covered, and for ultrasonic and Coriolis flow meters also two flow meters in series are covered. The uncertainty model is implemented on a web-based Microsoft Silverlight technology. This can be accessed for free from www.nfogm.no. This report is a documentation of the uncertainty models developed and the web-based calculation tool. It should be noted that the example input values in that calculation tool are just examples, and should not be regarded as recommended values by NFOGM, CMR, NPD or any other party. Chapter 2 of this report describes on an overview level the metering stations covered in the report. In Chapter 3, uncertainties related to secondary instrumentation like temperature pressure, differential pressure, density and gas composition in addition to gas parameters calculated from the gas composition, are covered. Chapter 4 documents the uncertainty model for orifice flow metering stations, Chapter 5 documents the uncertainty model for Coriolis flow metering stations and Chapter 6 documents the uncertainty model for ultrasonic flow metering stations. Chapter 7 documents the web based program, and Chapter 8 includes a brief summary of the report.

Uncertainty model for the online uncertainty calculator for gas flow metering stations Report
Ref. no.: CMR-14-A10099-RA-1 Rev.: 00 Date: 19.03.2014 Page 9 of 93
© Christian Michelsen Research AS.
Appendix A contains some details with respect to the uncertainty model related to adjustments of a flow meter after flow calibration. Appendix B contains the uncertainty model for two flow meters in parallel and series, based on the uncertainty model for a metering station with just one flow meter. Appendix C provides the detailed link between this report and the previous work [Lunde et al, 2002] that the uncertainty model for the ultrasonic flow meters is based on. Appendix D contains a list of symbols. The uncertainty models presented here are based on the ISO GUM uncertainty methodology. The measurement regulations by the Norwegian Petroleum Directorate and the NORSOK standard I-104 on fiscal measurement systems for hydrocarbon gas [NORSOK I-104] have been important references with respect to layout of the meter stations and requirements to the uncertainty of individual instruments and the operation of the metering station as a whole. A series of ISO and other international standards and reports have also been essential in this work. The details are covered in the relevant sections of the report. It is also referred to the reference list in Chapter9. The present work has been carried out for Norwegian Society for Oil and Gas Measurement (NFOGM) with financial support also from Norwegian Petroleum Directorate and Tekna. A reference group consisting of the following members has followed the work:
Dag Flølo, Statoil and NFOGM
Rune Andersen, Norwegian Environment Agency
Sidsel Corneliussen, BP
Leif Einar Falnes, Shell
Endre Jacobsen, Statoil
Pål Jaghø, Talisman Energy
Svein Neumann, Conoco Phillips
Anfinn Paulsen, Gassco
Reidar Sakariassen, MetroPartner
Bjarne Syre, DONG Energy
Steinar Vervik, Norwegian Petroleum Directorate
Kjell Arne Ulvund, Statoil Dag Flølo has been especially involved with regular project meetings and discussions throughout the project.
Ref. no.: CMR-14-A10099-RA-1 Rev.: 00 Date: 19.03.2014 Page 10 of 93
Uncertainty model for the online uncertainty calculator for gas flow metering stations Report
© Christian Michelsen Research AS.
2 Description of metering stations
In the present Handbook, several metering configurations of metering stations are covered. These include
Orifice plate metering stations
Coriolis metering stations
Ultrasonic flow metering stations The following three configurations are addressed:
One flow meter (orifice, ultrasonic or Coriolis)
Two flow meters in parallel (orifice, ultrasonic or Coriolis)
Two flow meters in series (ultrasonic or Coriolis) With respect to gas quality, three configurations are covered:
Densitometer (in addition to a “nominal” gas composition)
Online gas chromatography
Gas sampling and laboratory analysis at regular time intervals
When the orifice metering station is selected, no flow calibration is involved. The uncertainty analysis of the orifice metering station follows the ISO 5167 as for the previous handbook [Dahl et al, 2003]. The Coriolis flow meter is assumed to be flow calibrated. The uncertainty model for this type of meter will not focus on flow meter technology details, but will be kept on an overall level. ISO 10970, including the amendment, is the recognized international standard for Coriolis fiscal gas metering. The ultrasonic flow meter is also assumed to be flow calibrated. The uncertainty model is similar to the model in the previous handbook [Lunde et al, 2002], but with necessary generalizations due to metering station setup. ISO 17089-1 is the recognized international standard for ultrasonic fiscal gas metering.
Uncertainty model for the online uncertainty calculator for gas flow metering stations Report
Ref. no.: CMR-14-A10099-RA-1 Rev.: 00 Date: 19.03.2014 Page 11 of 93
© Christian Michelsen Research AS.
3 Gas measurement uncertainties
This chapter will address the uncertainty models for the measurements of temperature (Section 3.1), pressure (Section 3.2), differential pressure (Section 3.3), density (Section 3.4) and gas compositions (Section 3.5), in addition to the uncertainty of standard density, calorific value and CO2 emission factor, as calculated from a gas composition (Section 3.6).
3.1 Temperature measurement
The uncertainty model for the temperature measurement follows the similar model in [Lunde et al, 2002] and [Dahl et al, 2003]. The uncertainty in the measured temperature can be specified in two ways:
Overall level
Detailed level In case of the overall level, the absolute uncertainty in the measured temperature is specified directly by the user of the uncertainty calculation program. In case of the detailed level, the following uncertainty model is used:
,22
,
2
22
,
2
,
2
miscelemstabtemp
RFItransmstabtransmelem
TuTuTu
TuTuTuTu
(3.1)
where
transmelemTu , : standard uncertainty of the temperature element and temperature transmitter, calibrated
as a unit. Typically found either in product specifications or in calibration certificates.
transmstabTu , : standard uncertainty related to the stability of the temperature transmitter, with respect
to drift in readings over time. Typically found in product specifications.
RFITu : standard uncertainty due to radio-frequency interference (RFI) effects on the
temperature transmitter.
tempTu : standard uncertainty of the effect of temperature on the temperature transmitter, for
change of gas temperature relative to the temperature at calibration. Typically found in product specifications.
elemstabTu , : standard uncertainty related to the stability of the temperature element. Instability may
relate e.g. to drift during operation, as well as instability and hysteresis effects due to oxidation and moisture inside the encapsulation, and mechanical stress during operation. Typically found in product specifications.
miscTu : standard uncertainty of other (miscellaneous) effects on the temperature transmitter.
This uncertainty model is quite generic, and can be used on a series of industrial products. In cases where this model does not fit with the product specifications, the miscellaneous uncertainty contributions can be used for specification of other uncertainty contributions. Alternatively, the uncertainty of the temperature measurements can be calculated manually, and the result can be given to the program using the overall input level.
Ref. no.: CMR-14-A10099-RA-1 Rev.: 00 Date: 19.03.2014 Page 12 of 93
Uncertainty model for the online uncertainty calculator for gas flow metering stations Report
© Christian Michelsen Research AS.
When the average of two temperature measurements is used, it is assumed that the two temperature measurements are uncorrelated. The reason for this assumption is that often the two probes are not calibrated at the same time. This means that even if they are calibrated using the same procedure, the time difference generates an uncorrelated drifting term, both in the reference and in the temperature measurement itself. This means that the uncertainty in the average of two temperature measurements is assumed to be equal to the uncertainty for one measurement, divided by the square root of two.
3.2 Pressure measurement
The uncertainty model for the pressure measurement follows the similar model in [Lunde et al, 2002] and [Dahl et al, 2003]. The uncertainty in the measured pressure can be specified in two ways:
Overall level
Detailed level In case of the overall level, the relative uncertainty in the measured pressure is specified directly by the user of the uncertainty calculation program. In case of the detailed level, the following uncertainty model is used:
,222
2222
miscatmtemp
RFIstabilityrtransmitte
PuPuPu
PuPuPuPu
(3.2)
where
rtransmittePu : standard uncertainty of the pressure transmitter, including hysteresis, terminal-based
linearity, repeatability and the standard uncertainty of the pressure calibration laboratory.
stabilityPu : standard uncertainty of the stability of the pressure transmitter, with respect to drift in
readings over time.
RFIPu : standard uncertainty due to radio-frequency interference (RFI) effects on the pressure
transmitter.
tempPu : standard uncertainty of the effect of ambient gas temperature on the pressure
transmitter, for change of ambient temperature relative to the temperature at calibration.
atmPu : standard uncertainty of the atmospheric pressure, relative to 1 atm. = 1.01325 bar, due
to local meteorological effects. This effect is of relevance for units measuring gauge pressure.
miscPu : standard uncertainty due to other (miscellaneous) effects on the pressure transmitter,
such as mounting effects, etc. This uncertainty model is quite generic, and can be used on a series of industrial products. In cases where this model does not fit with the product specifications, the miscellaneous uncertainty contributions can be used for specification of other uncertainty contributions. Alternatively, the uncertainty of the pressure measurements can be calculated manually, and the result can be given to the program using the overall input level.
Uncertainty model for the online uncertainty calculator for gas flow metering stations Report
Ref. no.: CMR-14-A10099-RA-1 Rev.: 00 Date: 19.03.2014 Page 13 of 93
© Christian Michelsen Research AS.
When the average of two pressure measurements is used, it is assumed that the two pressure measurements are uncorrelated. The reason for this assumption is that often the two probes are not calibrated at the same time. This means that even if they are calibrated using the same procedure, the time difference generates an uncorrelated drifting term, both in the reference and in the pressure measurement itself. This means that the uncertainty in the average of two pressure measurements is assumed to be equal to the uncertainty for one measurement, divided by the square root of two.
3.3 Differential pressure measurement
The uncertainty model for the differential pressure measurement follows the similar model in [Dahl et al, 2003]. The uncertainty in the measured differential pressure can be specified in two ways:
Overall level
Detailed level In case of the overall level, the absolute uncertainty in the measured differential pressure is specified directly by the user of the uncertainty calculation program. In case of the detailed level, the following uncertainty model is used:
,22
2222
misctemp
RFIstabilityrtransmitte
PuPu
PuPuPuPu
(3.3)
where
rtransmittePu : standard uncertainty of the differential pressure transmitter, including hysteresis,
terminal-based linearity, repeatability and the standard uncertainty of the differential pressure calibration laboratory.
stabilityPu : standard uncertainty of the stability of the differential pressure transmitter, with respect
to drift in readings over time.
RFIPu : standard uncertainty due to radio-frequency interference (RFI) effects on the differential
pressure transmitter.
tempPu : standard uncertainty of the effect of ambient gas temperature on the differential
pressure transmitter, for change of ambient temperature relative to the temperature at calibration.
miscPu : standard uncertainty due to other (miscellaneous) effects on the differential pressure
transmitter, such as mounting effects, etc. This uncertainty model is quite generic, and can be used on a series of industrial products. In cases where this model does not fit with the product specifications, the miscellaneous uncertainty contributions can be used for specification of other uncertainty contributions. Alternatively, the uncertainty of the differential pressure measurements can be calculated manually, and the result can be given to the program using the overall input level.

Ref. no.: CMR-14-A10099-RA-1 Rev.: 00 Date: 19.03.2014 Page 14 of 93
Uncertainty model for the online uncertainty calculator for gas flow metering stations Report
© Christian Michelsen Research AS.
3.4 Densitometer measurement
The uncertainty model for the density measurement follows the similar model in [Lunde et al, 2002] and [Dahl et al, 2003]. The uncertainty in the measured density can be specified in two ways:
Overall level
Detailed level In case of the overall level, the relative uncertainty in the measured density is specified directly by the user of the uncertainty calculation program. In case of the detailed level, the uncertainty model is more complicated than for the temperature, pressure and differential pressure measurements above. The density measurement consists of several steps:
Measurement of an uncorrected density from the period measurement of a vibrating string.
Corrections based on temperature difference between calibration and measurement.
Velocity of sound corrections.
Corrections for pressure and temperature differences from the densitometer to the line conditions.
This will in total form the functional relationship for the density measurement, in agreement with ISO 15970, as follows:
.1
1
1
1
12
2
1918
Z
Z
PPT
T
c
K
c
K
TTKTTK d
d
d
d
d
c
d
cdcdu
(3.4)
In this equation subscript “d” means densitometer conditions and subscript “c” means calibration conditions. The following variables are used in this equation:
u: indicated (uncorrected) density, in density transducer [kg/m3]. K18 , K19 : constants from the calibration certificate.
Td: gas temperature in density transducer [].
Tc: calibration temperature [].
Kd: transducer constant [m] (square root of constant Kd in ISO 15970). cc: VOS for the calibration gas, at calibration temperature and pressure conditions [m/s]. cd: VOS for the measured gas, in the density transducer [m/s].
periodic time (inverse of the resonance frequency, output from the densitometer) [s]. T: gas temperature in the pipe, at the flow meter location (line conditions) [K]. P gas pressure in the pipe, at the flow meter location (line conditions) [bara]. ΔPd: pressure difference between the line and densitometer pressures (usually negative) [bara]. Zd: gas compressibility factor for the gas in the density transducer. Z: gas compressibility factor for the gas in the pipe, at orifice location (line conditions). By using the general uncertainty model approach in ISO GUM [ISO GUM, 2008], the uncertainty model will be

Uncertainty model for the online uncertainty calculator for gas flow metering stations Report
Ref. no.: CMR-14-A10099-RA-1 Rev.: 00 Date: 19.03.2014 Page 15 of 93
© Christian Michelsen Research AS.
),()()()(
)()()()(
)()()()()()(
2222
,
22
,
22
,
22
,
22
,
22
,
22
,
22
,
22
,
2222
misctempcPdP
dcccdK
cTdTcTreptuc
uuPusPus
cuscususKus
TusTusTusuusu
d
dcd
cdu
(3.5)
where
)( uu : standard uncertainty of the indicated (uncorrected) density estimate, u , including the
calibration laboratory uncertainty, the reading error during calibration, and hysteresis.
)( reptu : standard uncertainty of the repeatability of the indicated (uncorrected) density estimate,
u .
)(Tu : standard uncertainty of the line temperature estimate, T.
)( dTu : standard uncertainty of the gas temperature estimate in the densitometer, dT .
)( cTu : standard uncertainty of the densitometer calibration temperature estimate, cT .
)( dKu : standard uncertainty of the VOS correction densitometer constant estimate, dK .
)(u : standard uncertainty of the periodic time estimate, .
)( ccu : standard uncertainty of the calibration gas VOS estimate, cc .
)( dcu : standard uncertainty of the densitometer gas VOS estimate, dc .
)( dPu : standard uncertainty of assuming that dP = P , due to possible deviation of gas pressure
from densitometer to line conditions.
)(Pu : standard uncertainty of the line pressure estimate, P.
)( tempu : standard uncertainty of the temperature correction factor for the density estimate,
(represents the model uncertainty of the temperature correction model used,
cdcdu TTKTTK 19181 ).
)( miscu : standard uncertainty of the density estimate, accounting for miscellaneous uncertainty
contributions, such as due to: - stability (drift, shift between calibrations), - reading error during measurement (for digital display instruments), - possible deposits on the vibrating element, - possible corrosion of the vibrating element, - possible liquid condensation on the vibrating element, - mechanical (structural) vibrations on the gas line, - variations in power supply, - self-induced heat, - flow in the bypass density line, - possible gas viscosity effects, - neglecting possible pressure dependency in calculation of the uncorrected density
from the periodic time, - model uncertainty of the VOS correction model, - other possible effects.
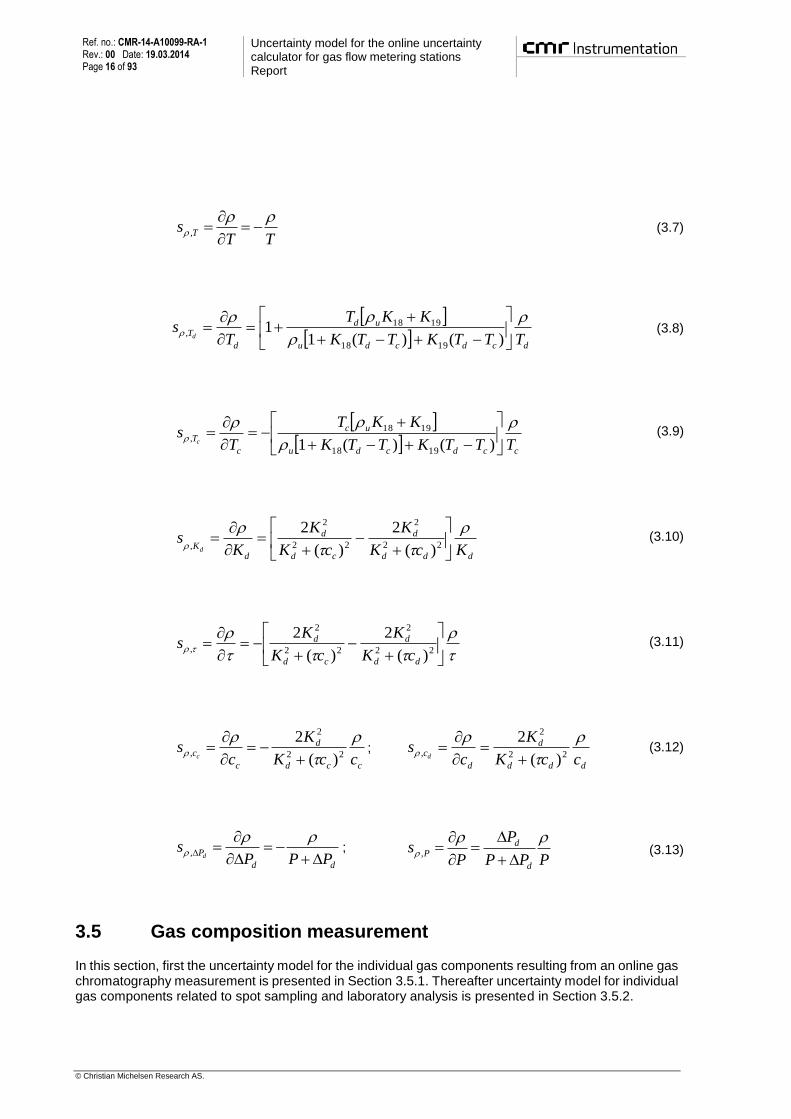
The sensitivity coefficients in Eq. (3.5) can be calculated from the functional relationship Eq. (3.4) by use of the ISO GUM methodology:
)()(1
)(1
1918
18
cdcdu
cd
u TTKTTK
TTKs
u
(3.6)
Ref. no.: CMR-14-A10099-RA-1 Rev.: 00 Date: 19.03.2014 Page 16 of 93
Uncertainty model for the online uncertainty calculator for gas flow metering stations Report
© Christian Michelsen Research AS.
TTs T
, (3.7)
dcdcdu
ud
d
TTTTKTTK
KKT
Ts
d
)()(11
1918
1918, (3.8)
ccdcdu
uc
c
TTTTKTTK
KKT
Ts
c
)()(1 1918
1918,
(3.9)
ddd
d
cd
d
dK KcK
K
cK
K
Ks
d
22
2
22
2
, )(
2
)(
2
(3.10)
22
2
22
2
,)(
2
)(
2
dd
d
cd
d
cK
K
cK
Ks
(3.11)
ccd
d
c
cccK
K
cs
c
22
2
,)(
2
;
ddd
d
d
cccK
K
cs
d
22
2
,)(
2
(3.12)
dd
PPPP
sd
, ;
PPP
P
Ps
d
dP
,
(3.13)
3.5 Gas composition measurement
In this section, first the uncertainty model for the individual gas components resulting from an online gas chromatography measurement is presented in Section 3.5.1. Thereafter uncertainty model for individual gas components related to spot sampling and laboratory analysis is presented in Section 3.5.2.
Uncertainty model for the online uncertainty calculator for gas flow metering stations Report
Ref. no.: CMR-14-A10099-RA-1 Rev.: 00 Date: 19.03.2014 Page 17 of 93
© Christian Michelsen Research AS.
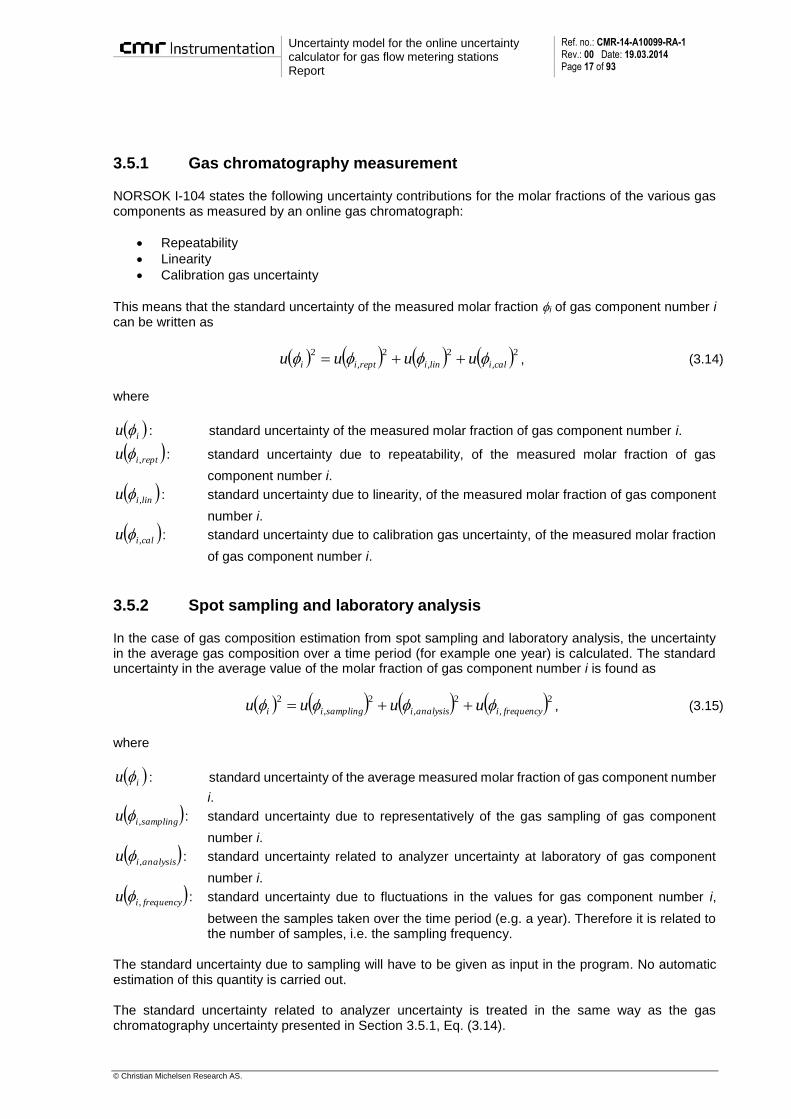
3.5.1 Gas chromatography measurement
NORSOK I-104 states the following uncertainty contributions for the molar fractions of the various gas components as measured by an online gas chromatograph:
Repeatability
Linearity
Calibration gas uncertainty
This means that the standard uncertainty of the measured molar fraction i of gas component number i can be written as
2,
2
,
2
,
2
calilinireptii uuuu , (3.14)
where
iu : standard uncertainty of the measured molar fraction of gas component number i.
reptiu , : standard uncertainty due to repeatability, of the measured molar fraction of gas
component number i.
liniu , : standard uncertainty due to linearity, of the measured molar fraction of gas component
number i.
caliu , : standard uncertainty due to calibration gas uncertainty, of the measured molar fraction
of gas component number i.
3.5.2 Spot sampling and laboratory analysis
In the case of gas composition estimation from spot sampling and laboratory analysis, the uncertainty in the average gas composition over a time period (for example one year) is calculated. The standard uncertainty in the average value of the molar fraction of gas component number i is found as
2,
2
,
2
,
2
frequencyianalysisisamplingii uuuu , (3.15)
where
iu : standard uncertainty of the average measured molar fraction of gas component number
i.
samplingiu , : standard uncertainty due to representatively of the gas sampling of gas component
number i.
analysisiu , : standard uncertainty related to analyzer uncertainty at laboratory of gas component
number i.
frequencyiu , : standard uncertainty due to fluctuations in the values for gas component number i,
between the samples taken over the time period (e.g. a year). Therefore it is related to the number of samples, i.e. the sampling frequency.
The standard uncertainty due to sampling will have to be given as input in the program. No automatic estimation of this quantity is carried out. The standard uncertainty related to analyzer uncertainty is treated in the same way as the gas chromatography uncertainty presented in Section 3.5.1, Eq. (3.14).

Ref. no.: CMR-14-A10099-RA-1 Rev.: 00 Date: 19.03.2014 Page 18 of 93
Uncertainty model for the online uncertainty calculator for gas flow metering stations Report
© Christian Michelsen Research AS.
The standard uncertainty related to sampling frequency is calculated as
N
Tu i
frequencyi2
,
, (3.16)
where N: number of gas samples T: Student-T parameter for 95 % confidence level (T.INV.2T(0.05;N-1) in Excel)
i : standard deviation over the gas samples of molar fractions measured for gas
component number i
3.6 Gas quality parameters uncertainty
This section described the general approach for uncertainty analysis of gas quality parameters. Section 3.6.1 covers the functional relationships, and Section 3.6.2 the uncertainty model.
3.6.1 Functional relationship
In general, the functional relationship for a gas parameter, X, can be written
),,,,,( 21 TPfX n , (3.17)
where n ,,, 21 are un-normalized molar fractions for each gas component. Note that in the function
calculating the gas parameter, a normalization of the gas composition is included (i.e. to divide each of the molar fractions by the sum of all molar fractions to ensure that the sum of all molar fractions then will be equal to 1). A series of gas quality parameters can be calculated from the gas composition alone using the algorithms in ISO 6976. This includes e.g. molar mass (m), compressibility factor at standard conditions (Z0), mass based superior calorific value (Hs,m) and mass based inferior calorific value (HI,m). The compressibility factor at line conditions (Z) can be calculated from the gas composition in combination with the pressure and temperature by use of the algorithms in AGA 8. The CO2 emission factor can also be calculated from the gas composition. There are no recognized international standard for this parameter. X can represent each of these gas parameters, and also combinations (like ratios and products etc.) of them. The CO2 emission factor is calculated using the following formulas: Mass based CO2 emission factor (kg/kg):
n
i
ii
n
i
ii
COm
m
n
mC
1
12
, (3.18)

Uncertainty model for the online uncertainty calculator for gas flow metering stations Report
Ref. no.: CMR-14-A10099-RA-1 Rev.: 00 Date: 19.03.2014 Page 19 of 93
© Christian Michelsen Research AS.
where mCO2 is the molar mass of CO2, ni is the number of carbon atoms in the molecule for gas component number i and mi is the molar mass of gas component number i.
Volume based CO2 emission factor (kg/Sm3):
0mv CC , (3.19)
where 0 is the density at standard conditions, calculated from the gas composition by use of ISO 6976.
Energy based CO2 emission factor (tonnes/TJ):
mIme HCC ,/1000 , (3.20)
where HI,m is the mass based inferior calorific value (MJ/kg) , calculated from the gas composition by use of ISO 6976.
3.6.2 Uncertainty model
Uncertainty in the gas components and in pressure and temperature will generate uncertainty in the gas parameters. The standard uncertainty of each gas parameter X can now be found as
.)()()(
)()()(
2
22
22
2
2
2
1
1
2
modelXuTuT
fPu
P
f
uf
uf
uf
Xu n
n
(3.21)
The last term in this uncertainty model represents a possible model uncertainty due to approximations and inaccuracies in Eq. (3.17). Some of the functional relationships, Eq. (3.17), are quite complex, and analytic calculation of the partial derivatives is complicated. Therefore, the partial derivatives are calculated numerically as
,
2
,,,,,,,,,,,,,,,,,, 11211121
i
niiiiniiii
i
TPfTPff
(3.22)
where i is a small perturbation of the molar fraction for gas component number i. Note that a new
normalization of the molar fractions is needed when such a perturbation is carried out. Similarly, the partial derivatives with respect to pressure and temperature are calculated as
P
TPPfTPPf
P
f nn
2
,,,,,,,,,, 2121
(3.23)
and
T
TTPfTTPf
T
f nn
2
,,,,,,,,,, 2121
. (3.24)
The model uncertainty will vary depending on the actual gas parameter in question.
Ref. no.: CMR-14-A10099-RA-1 Rev.: 00 Date: 19.03.2014 Page 20 of 93
Uncertainty model for the online uncertainty calculator for gas flow metering stations Report
© Christian Michelsen Research AS.
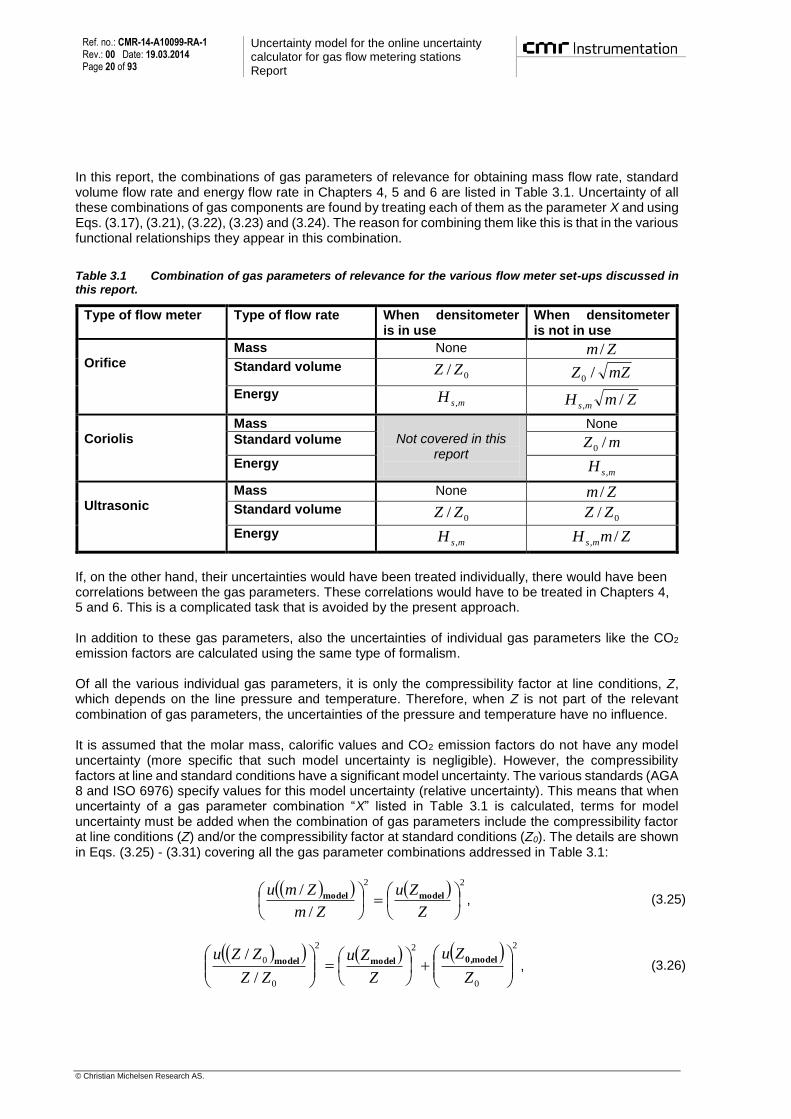
In this report, the combinations of gas parameters of relevance for obtaining mass flow rate, standard volume flow rate and energy flow rate in Chapters 4, 5 and 6 are listed in Table 3.1. Uncertainty of all these combinations of gas components are found by treating each of them as the parameter X and using Eqs. (3.17), (3.21), (3.22), (3.23) and (3.24). The reason for combining them like this is that in the various functional relationships they appear in this combination.
Table 3.1 Combination of gas parameters of relevance for the various flow meter set-ups discussed in this report.
Type of flow meter Type of flow rate When densitometer is in use
When densitometer is not in use
Orifice
Mass None Zm /
Standard volume 0/ ZZ mZZ /0
Energy msH , ZmH ms /,
Coriolis
Mass Not covered in this
report
None
Standard volume mZ /0
Energy msH ,
Ultrasonic
Mass None Zm /
Standard volume 0/ ZZ 0/ ZZ
Energy msH , ZmH ms /,
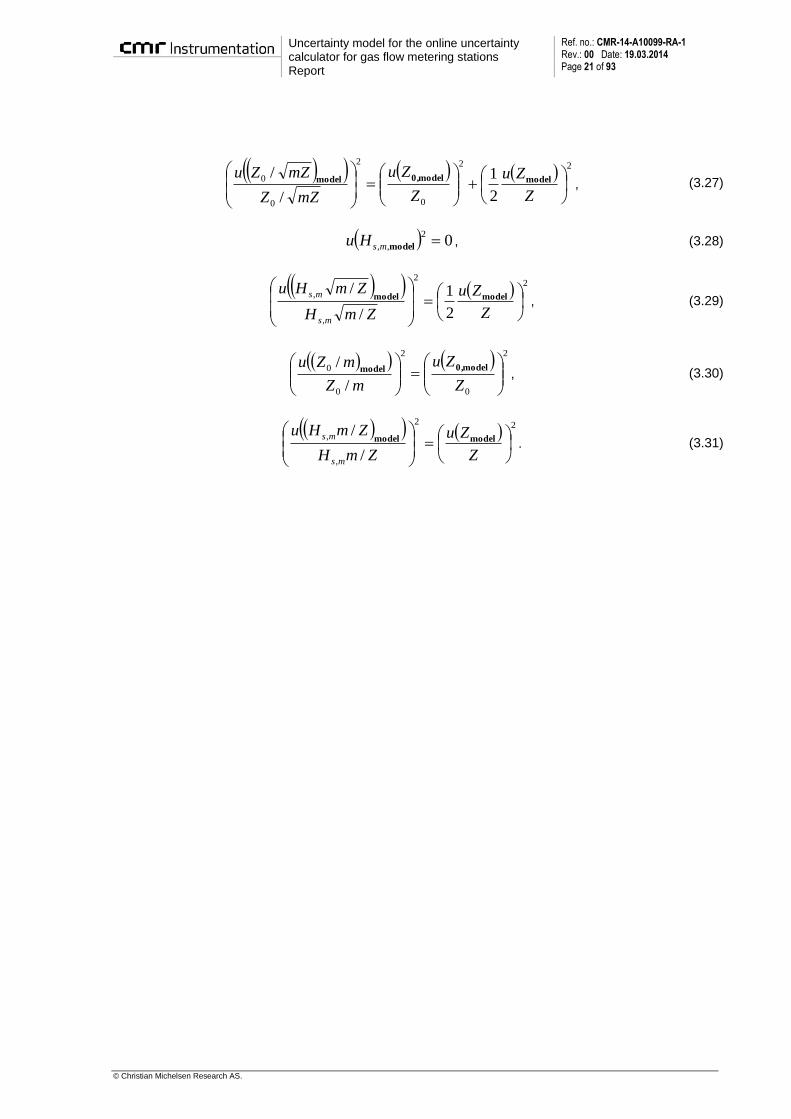
If, on the other hand, their uncertainties would have been treated individually, there would have been correlations between the gas parameters. These correlations would have to be treated in Chapters 4, 5 and 6. This is a complicated task that is avoided by the present approach. In addition to these gas parameters, also the uncertainties of individual gas parameters like the CO2 emission factors are calculated using the same type of formalism. Of all the various individual gas parameters, it is only the compressibility factor at line conditions, Z, which depends on the line pressure and temperature. Therefore, when Z is not part of the relevant combination of gas parameters, the uncertainties of the pressure and temperature have no influence. It is assumed that the molar mass, calorific values and CO2 emission factors do not have any model uncertainty (more specific that such model uncertainty is negligible). However, the compressibility factors at line and standard conditions have a significant model uncertainty. The various standards (AGA 8 and ISO 6976) specify values for this model uncertainty (relative uncertainty). This means that when uncertainty of a gas parameter combination “X” listed in Table 3.1 is calculated, terms for model uncertainty must be added when the combination of gas parameters include the compressibility factor at line conditions (Z) and/or the compressibility factor at standard conditions (Z0). The details are shown in Eqs. (3.25) - (3.31) covering all the gas parameter combinations addressed in Table 3.1:
22
/
/
Z
Zu
Zm
Zmu modelmodel , (3.25)
2
0
22
0
0
/
/
Z
Zu
Z
Zu
ZZ
ZZu model0,modelmodel, (3.26)
Uncertainty model for the online uncertainty calculator for gas flow metering stations Report
Ref. no.: CMR-14-A10099-RA-1 Rev.: 00 Date: 19.03.2014 Page 21 of 93
© Christian Michelsen Research AS.
22
0
2
0
0
2
1
/
/
Z
Zu
Z
Zu
mZZ
mZZumodelmodel0,model , (3.27)
02
,, modelmsHu , (3.28)
22
,
,
2
1
/
/
Z
Zu
ZmH
ZmHu
ms
ms modelmodel , (3.29)
2
0
2
0
0
/
/
Z
Zu
mZ
mZu model0,model, (3.30)
22
,
,
/
/
Z
Zu
ZmH
ZmHu
ms
ms modelmodel . (3.31)
Ref. no.: CMR-14-A10099-RA-1 Rev.: 00 Date: 19.03.2014 Page 22 of 93
Uncertainty model for the online uncertainty calculator for gas flow metering stations Report
© Christian Michelsen Research AS.
4 Orifice fiscal metering stations
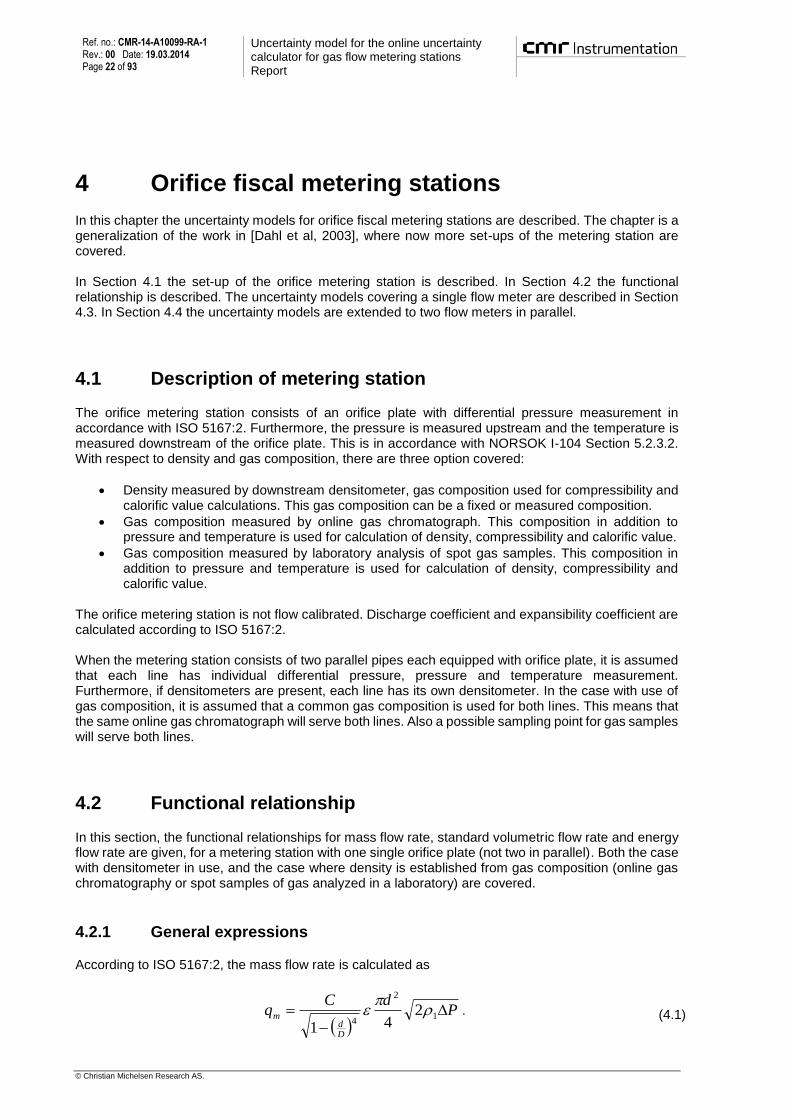
In this chapter the uncertainty models for orifice fiscal metering stations are described. The chapter is a generalization of the work in [Dahl et al, 2003], where now more set-ups of the metering station are covered. In Section 4.1 the set-up of the orifice metering station is described. In Section 4.2 the functional relationship is described. The uncertainty models covering a single flow meter are described in Section 4.3. In Section 4.4 the uncertainty models are extended to two flow meters in parallel.
4.1 Description of metering station
The orifice metering station consists of an orifice plate with differential pressure measurement in accordance with ISO 5167:2. Furthermore, the pressure is measured upstream and the temperature is measured downstream of the orifice plate. This is in accordance with NORSOK I-104 Section 5.2.3.2. With respect to density and gas composition, there are three option covered:
Density measured by downstream densitometer, gas composition used for compressibility and calorific value calculations. This gas composition can be a fixed or measured composition.
Gas composition measured by online gas chromatograph. This composition in addition to pressure and temperature is used for calculation of density, compressibility and calorific value.
Gas composition measured by laboratory analysis of spot gas samples. This composition in addition to pressure and temperature is used for calculation of density, compressibility and calorific value.
The orifice metering station is not flow calibrated. Discharge coefficient and expansibility coefficient are calculated according to ISO 5167:2. When the metering station consists of two parallel pipes each equipped with orifice plate, it is assumed that each line has individual differential pressure, pressure and temperature measurement. Furthermore, if densitometers are present, each line has its own densitometer. In the case with use of gas composition, it is assumed that a common gas composition is used for both lines. This means that the same online gas chromatograph will serve both lines. Also a possible sampling point for gas samples will serve both lines.
4.2 Functional relationship
In this section, the functional relationships for mass flow rate, standard volumetric flow rate and energy flow rate are given, for a metering station with one single orifice plate (not two in parallel). Both the case with densitometer in use, and the case where density is established from gas composition (online gas chromatography or spot samples of gas analyzed in a laboratory) are covered.
4.2.1 General expressions
According to ISO 5167:2, the mass flow rate is calculated as
P
dCq
Dd
m
1
2
42
41
. (4.1)

Uncertainty model for the online uncertainty calculator for gas flow metering stations Report
Ref. no.: CMR-14-A10099-RA-1 Rev.: 00 Date: 19.03.2014 Page 23 of 93
© Christian Michelsen Research AS.
For definition of symbols it is referred to Appendix D. By using the equation of state, the standard volumetric flow rate can be found as
1
2
4110
001
1110
001
0
2
41
PdC
ZTP
ZTPq
ZTP
ZTPq
Dd
mv
. (4.2)
Similarly, the energy flow rate can be found as
P
dCHqHq
Dd
ms
mmse
1
2
4
,
, 241
. (4.3)
These three expressions will now be used to establish the functional relationship both for the case when a densitometer is in use and for the case when a densitometer is not in use.
4.2.2 Expressions when densitometer is used
In the case of a downstream densitometer, the density has to be converted from downstream to upstream conditions. With pressure measured upstream, and temperature downstream, and based on Eq. (4.1), the mass flow rate will be
.
/1
12
41
241
1
2
21
12
2
4
1
2
2
2
1
12
2
4
PZ
Z
TTPP
PdC
PZ
Z
TT
T
PP
PdCq
Dd
Dd
m
(4.4)
Similarly, based on Eq. (4.2), the standard volumetric flow rate will be
./12
41
241
2
12
12
1
2
4110
001
2
1
2
2
12
1
2
4110
0010
PZ
ZTT
P
PPdC
ZTP
ZTP
PZ
Z
T
TT
P
PPdC
ZTP
ZTPq
Dd
Dd
v
(4.5)
In addition, based on Eq.(4.3), the energy flow rate will be
.
/1
12
41
241
1
2
21
12
2
4
,
1
2
2
2
1
12
2
4
,
PZ
Z
TTPP
PdCH
PZ
Z
TT
T
PP
PdCHq
Dd
ms
Dd
ms
e
(4.6)
In the calculations carried out in the uncertainty program, for getting the relations between flow rate and differential pressure, the temperature difference over the orifice plate is neglected. This approximation will not be important for the uncertainty model and calculations carried out here.
Ref. no.: CMR-14-A10099-RA-1 Rev.: 00 Date: 19.03.2014 Page 24 of 93
Uncertainty model for the online uncertainty calculator for gas flow metering stations Report
© Christian Michelsen Research AS.
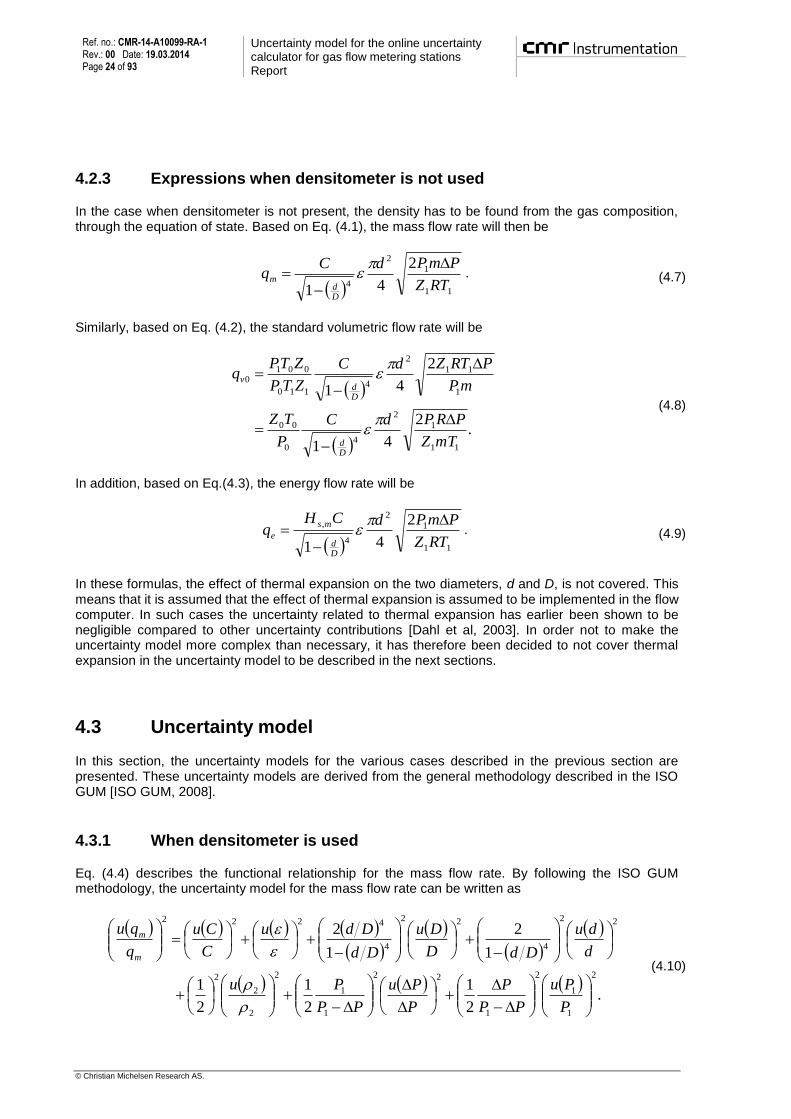
4.2.3 Expressions when densitometer is not used
In the case when densitometer is not present, the density has to be found from the gas composition, through the equation of state. Based on Eq. (4.1), the mass flow rate will then be
11
1
2
4
2
41 RTZ
PmPdCq
Dd
m
. (4.7)
Similarly, based on Eq. (4.2), the standard volumetric flow rate will be
.
2
41
2
41
11
1
2
40
00
1
11
2
4110
0010
mTZ
PRPdC
P
TZ
mP
PRTZdC
ZTP
ZTPq
Dd
Dd
v
(4.8)
In addition, based on Eq.(4.3), the energy flow rate will be
11
1
2
4
, 2
41 RTZ
PmPdCHq
Dd
ms
e
. (4.9)
In these formulas, the effect of thermal expansion on the two diameters, d and D, is not covered. This means that it is assumed that the effect of thermal expansion is assumed to be implemented in the flow computer. In such cases the uncertainty related to thermal expansion has earlier been shown to be negligible compared to other uncertainty contributions [Dahl et al, 2003]. In order not to make the uncertainty model more complex than necessary, it has therefore been decided to not cover thermal expansion in the uncertainty model to be described in the next sections.
4.3 Uncertainty model
In this section, the uncertainty models for the various cases described in the previous section are presented. These uncertainty models are derived from the general methodology described in the ISO GUM [ISO GUM, 2008].
4.3.1 When densitometer is used
Eq. (4.4) describes the functional relationship for the mass flow rate. By following the ISO GUM methodology, the uncertainty model for the mass flow rate can be written as
.
2
1
2
1
2
1
1
2
1
2
2
1
1
2
1
22
1
1
2
2
2
2
22
4
22
4
4222
P
Pu
PP
P
P
Pu
PP
Pu
d
du
DdD
Du
Dd
Ddu
C
Cu
q
qu
m
m
(4.10)

Uncertainty model for the online uncertainty calculator for gas flow metering stations Report
Ref. no.: CMR-14-A10099-RA-1 Rev.: 00 Date: 19.03.2014 Page 25 of 93
© Christian Michelsen Research AS.
Eq. (4.5) describes the functional relationship for the standard volumetric flow rate. The compressibility factors at standard and line conditions depend both on the gas composition, and in order to avoid correlations, their uncertainties are treated together in the uncertainty model. By following the ISO GUM methodology, the uncertainty model for the standard volumetric flow rate can be written as
.
22
2
2
1
1
2
1
2
22
2
22
1
1
2
2
2
222
4
22
4
4
222
01
01
2
1
1
2
1
1
2
1
1
2
0
0
P
Pu
PP
PP
u
d
du
DdD
Du
Dd
Dd
u
C
Cu
ZZ
ZZu
T
Tu
P
Pu
PP
PP
q
qu
v
v
(4.11)
Eq. (4.6) describes the functional relationship for the energy flow rate. By following the ISO GUM methodology, the uncertainty model for the energy flow rate can be written as
.
2
1
2
1
2
1
1
2
1
2
2
1
1
2
1
22
1
1
2
2
2
2
22
4
22
4
4
222
,
,
2
P
Pu
PP
P
P
Pu
PP
Pu
d
du
DdD
Du
Dd
Dd
u
C
Cu
H
Hu
q
qu
ms
ms
e
e
(4.12)
4.3.2 When densitometer is not used
Eq. (4.7) describes the functional relationship for the mass flow rate. The molar mass and the compressibility factor at line conditions depend both on the gas composition, and in order to avoid correlations, their uncertainties are treated together in the uncertainty model. By following the ISO GUM methodology, the uncertainty model for the mass flow rate can be written as
.
2
1
2
1
2
1
2
1
1
2
1
2
2
1
1
22
1
1
22
1
1
222
22
4
22
4
4222
T
Tu
Zm
Zmu
P
Pu
P
Pu
d
du
DdD
Du
Dd
Ddu
C
Cu
q
qu
m
m
(4.13)
Eq. (4.8) describes the functional relationship for the standard volume flow rate. The molar mass and the compressibility factors at standard and line conditions depend all on the gas composition, and in order to avoid correlations, their uncertainties are treated together in the uncertainty model. By following the ISO GUM methodology, the uncertainty model for the standard volumetric flow rate can be written as

Ref. no.: CMR-14-A10099-RA-1 Rev.: 00 Date: 19.03.2014 Page 26 of 93
Uncertainty model for the online uncertainty calculator for gas flow metering stations Report
© Christian Michelsen Research AS.
.
2
1
2
1
2
1
1
2
1
2
2
1
1
22
10
10
2
1
1
222
22
4
22
4
4222
0
0
T
Tu
mZZ
mZZu
P
Pu
P
Pu
d
du
DdD
Du
Dd
Ddu
C
Cu
q
qu
v
v
(4.14)
Eq. (4.9) describes the functional relationship for the energy flow rate. The calorific value, molar mass and the compressibility factor at line conditions depend all on the gas composition, and in order to avoid correlations, their uncertainties are treated together in the uncertainty model. By following the ISO GUM methodology, the uncertainty model for the energy flow rate then can be written as
.
2
1
2
1
2
1
1
2
1
2
2
1
1
22
1,
1,
2
1
1
222
22
4
22
4
4222
T
Tu
ZmH
ZmHu
P
Pu
P
Pu
d
du
DdD
Du
Dd
Ddu
C
Cu
q
qu
ms
ms
e
e
(4.15)
4.4 Two flow meters in parallel
4.4.1 Correlation classification
The generic uncertainty model for two flow meters in parallel is given in Appendix B. The uncertainty model is developed under the assumption that the flow rate is about the same in both pipes. Based on the results of the uncertainty model development in Appendix B, it is necessary to classify all uncertainty contributions as either correlated or uncorrelated between the two flow meters. The following assumptions and evaluations have been made in order to classify the correlations:
Discharge coefficient: This uncertainty is assumed to be uncorrelated between pipe A and B. This coefficient is related to the flow profile thus the inlet pipe work to the metering station. This will never be identical in the two pipes.
Expansibility factor: This uncertainty is assumed to be uncorrelated between pipe A and B. The uncertainty in this factor is partly due to the flow profile and partly to the gas properties. There are good reasons both for classifying the uncertainty as correlated and uncorrelated. However, as this usually is a negligible uncertainty contribution, a brief classification as uncorrelated can be made.
Pipe diameter: This uncertainty is assumed to be correlated. This is because it is expected that the pipe work in the two pipes is delivered from the same vendor and produced under the same batch. Therefore, correlations can be expected.
Orifice diameter: This uncertainty is assumed to be correlated. This is because it is expected that the orifice plates in the two pipes are delivered from the same vendor and dimensions are measured at the same time and using the same equipment. Therefore, correlations can be expected.
Differential pressure: This uncertainty is assumed to be uncorrelated. This is because two different differential pressure instruments are used. Even if they are of the same type, they may not be calibrated at the same time. It is therefore expected that the uncertainty mainly is uncorrelated.
Uncertainty model for the online uncertainty calculator for gas flow metering stations Report
Ref. no.: CMR-14-A10099-RA-1 Rev.: 00 Date: 19.03.2014 Page 27 of 93
© Christian Michelsen Research AS.
Measured density: This uncertainty is assumed to be uncorrelated. This is because two different densitometers are used (one in each run). Even if they are of the same type, they may not be calibrated at the same time. It is therefore expected that the uncertainty mainly is uncorrelated.
Pressure: This uncertainty is assumed to be uncorrelated. This is because different pressure instruments are used in each run. Even if they are of the same type, they may not be calibrated at the same time. It is therefore expected that the uncertainty mainly is uncorrelated.
Temperature: This uncertainty is assumed to be uncorrelated. This is because different temperature instruments are used. Even if they are of the same type, they may not be calibrated at the same time. It is therefore expected that the uncertainty mainly is uncorrelated.
Gas quality parameters: This uncertainty is assumed to be correlated. It covers compressibility, molar mass and calorific value, either isolated or combined through products, ratios and powers. It is assumed that there will be a common gas chromatograph for both lines (not individual gas chromatograph for each line). Therefore, the calculation of these gas parameters is based on the same gas composition in each pipe. Therefore correlations have to be expected. In the case of gas composition based on gas sampling it is assumed a common sampling point for the two lines. Therefore, also in this case correlations have to be expected.
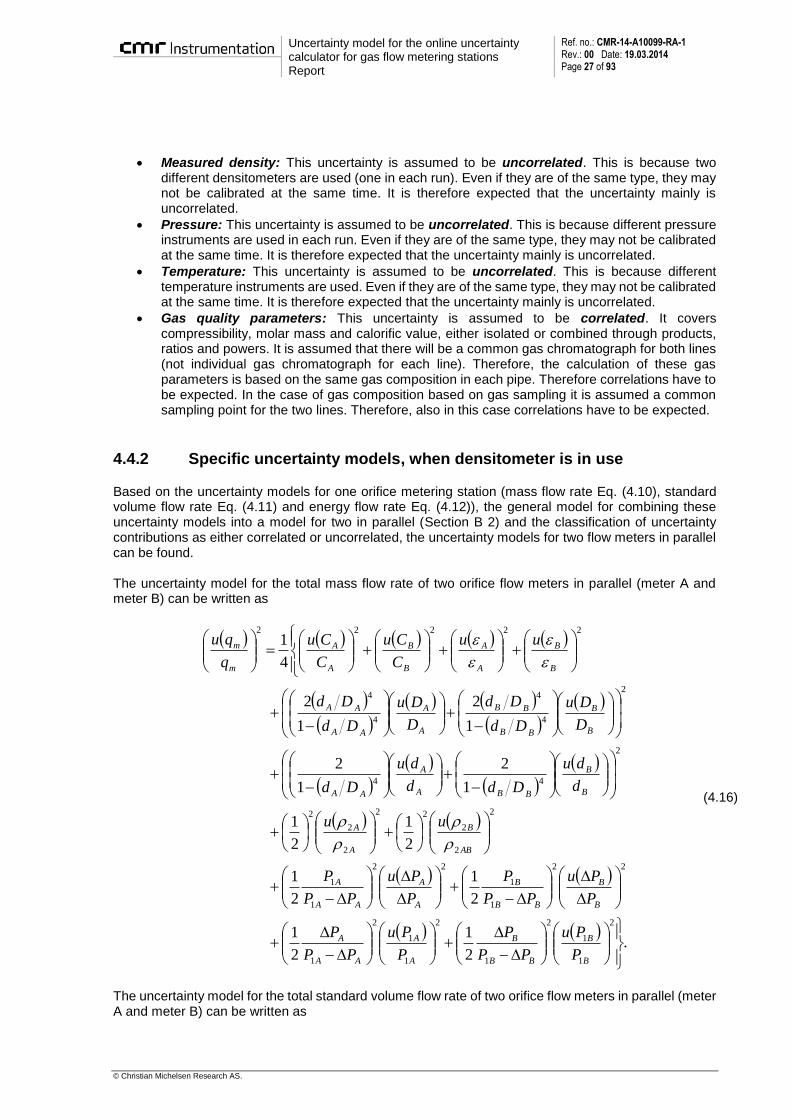
4.4.2 Specific uncertainty models, when densitometer is in use
Based on the uncertainty models for one orifice metering station (mass flow rate Eq. (4.10), standard volume flow rate Eq. (4.11) and energy flow rate Eq. (4.12)), the general model for combining these uncertainty models into a model for two in parallel (Section B 2) and the classification of uncertainty contributions as either correlated or uncorrelated, the uncertainty models for two flow meters in parallel can be found. The uncertainty model for the total mass flow rate of two orifice flow meters in parallel (meter A and meter B) can be written as
.
2
1
2
1
2
1
2
1
2
1
2
1
1
2
1
2
1
2
1
2
4
1
2
1
1
2
1
2
1
1
2
1
22
1
1
22
1
1
2
2
2
22
2
2
2
2
44
2
4
4
4
4
22222
B
B
BB
B
A
A
AA
A
B
B
BB
B
A
A
AA
A
AB
B
A
A
B
B
BBA
A
AA
B
B
BB
BB
A
A
AA
AA
B
B
A
A
B
B
A
A
m
m
P
Pu
PP
P
P
Pu
PP
P
P
Pu
PP
P
P
Pu
PP
P
uu
d
du
Ddd
du
Dd
D
Du
Dd
Dd
D
Du
Dd
Dd
uu
C
Cu
C
Cu
q
qu
(4.16)
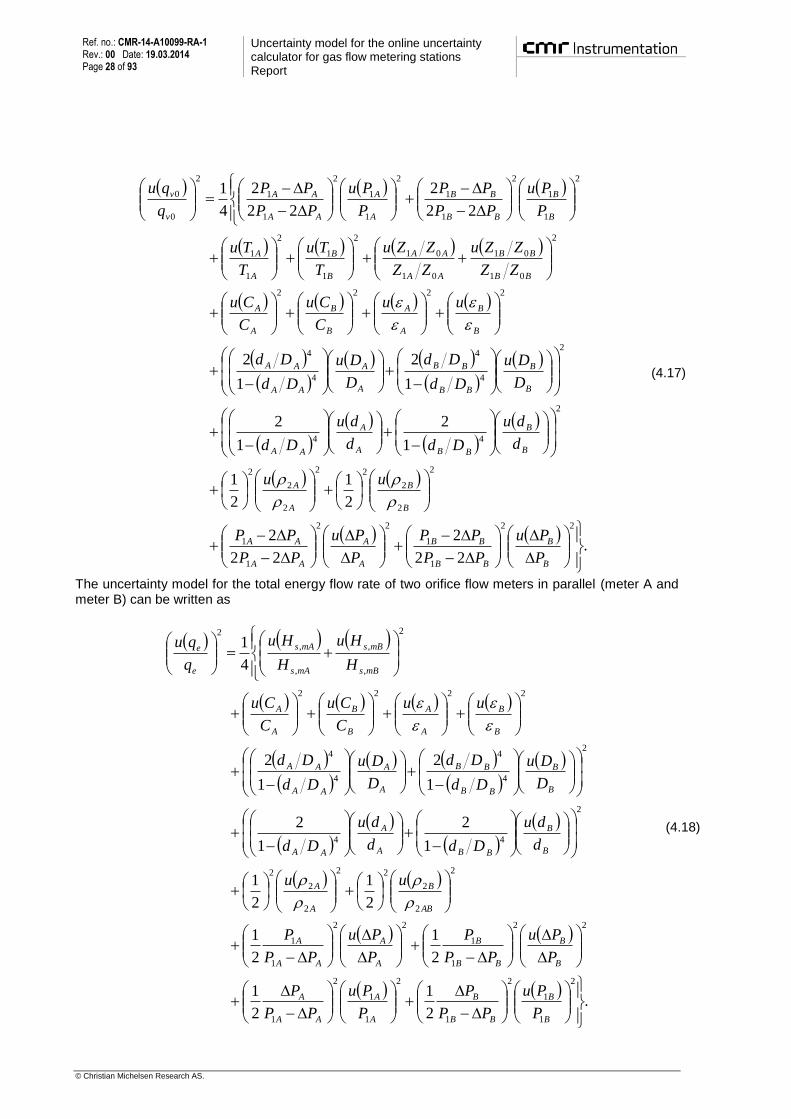
The uncertainty model for the total standard volume flow rate of two orifice flow meters in parallel (meter A and meter B) can be written as
Ref. no.: CMR-14-A10099-RA-1 Rev.: 00 Date: 19.03.2014 Page 28 of 93
Uncertainty model for the online uncertainty calculator for gas flow metering stations Report
© Christian Michelsen Research AS.
.
22
2
22
2
2
1
2
1
1
2
1
2
1
2
1
2
22
2
22
2
4
1
22
1
1
22
1
1
2
2
2
22
2
2
2
2
44
2
4
4
4
4
2222
2
01
01
01
01
2
1
1
2
1
1
2
1
1
2
1
1
2
1
1
2
1
1
2
0
0
B
B
BB
BB
A
A
AA
AA
B
B
A
A
B
B
BBA
A
AA
B
B
BB
BB
A
A
AA
AA
B
B
A
A
B
B
A
A
BB
BB
AA
AA
B
B
A
A
B
B
BB
BB
A
A
AA
AA
v
v
P
Pu
PP
PP
P
Pu
PP
PP
uu
d
du
Ddd
du
Dd
D
Du
Dd
Dd
D
Du
Dd
Dd
uu
C
Cu
C
Cu
ZZ
ZZu
ZZ
ZZu
T
Tu
T
Tu
P
Pu
PP
PP
P
Pu
PP
PP
q
qu
(4.17)
The uncertainty model for the total energy flow rate of two orifice flow meters in parallel (meter A and meter B) can be written as
.
2
1
2
1
2
1
2
1
2
1
2
1
1
2
1
2
1
2
1
2
4
1
2
1
1
2
1
2
1
1
2
1
22
1
1
22
1
1
2
2
2
22
2
2
2
2
44
2
4
4
4
4
2222
2
,
,
,
,
2
B
B
BB
B
A
A
AA
A
B
B
BB
B
A
A
AA
A
AB
B
A
A
B
B
BBA
A
AA
B
B
BB
BB
A
A
AA
AA
B
B
A
A
B
B
A
A
mBs
mBs
mAs
mAs
e
e
P
Pu
PP
P
P
Pu
PP
P
P
Pu
PP
P
P
Pu
PP
P
uu
d
du
Ddd
du
Dd
D
Du
Dd
Dd
D
Du
Dd
Dd
uu
C
Cu
C
Cu
H
Hu
H
Hu
q
qu
(4.18)

Uncertainty model for the online uncertainty calculator for gas flow metering stations Report
Ref. no.: CMR-14-A10099-RA-1 Rev.: 00 Date: 19.03.2014 Page 29 of 93
© Christian Michelsen Research AS.
4.4.3 Specific uncertainty models, when densitometer is not in use
Based on the uncertainty models for one orifice metering station (mass flow rate Eq. (4.13), standard volume flow rate Eq. (4.14) and energy flow rate Eq. (4.15)), the general model for combining these uncertainty models into a model for two in parallel (Section B 2) and the classification of uncertainty contributions as either correlated or uncorrelated, the uncertainty models for two flow meters in parallel can be found. The uncertainty model for the total mass flow rate of two orifice flow meters in parallel (meter A and meter B) can be written as
.
2
1
2
1
2
1
2
1
2
1
2
1
2
1
2
1
1
2
1
2
1
2
1
2
4
1
2
1
1
22
1
1
2
2
1
1
1
1
2
1
1
22
1
1
2
2222
2
44
2
4
4
4
4
22222
B
B
A
A
BB
BB
AA
AA
B
B
A
A
B
B
A
A
B
B
BBA
A
AA
B
B
BB
BB
A
A
AA
AA
B
B
A
A
B
B
A
A
m
m
T
Tu
T
Tu
Zm
Zmu
Zm
Zmu
P
Pu
P
Pu
P
Pu
P
Pu
d
du
Ddd
du
Dd
D
Du
Dd
Dd
D
Du
Dd
Dd
uu
C
Cu
C
Cu
q
qu
(4.19)
The uncertainty model for the total standard volume flow rate of two orifice flow meters in parallel (meter A and meter B) can be written as

Ref. no.: CMR-14-A10099-RA-1 Rev.: 00 Date: 19.03.2014 Page 30 of 93
Uncertainty model for the online uncertainty calculator for gas flow metering stations Report
© Christian Michelsen Research AS.
.
2
1
2
1
2
1
2
1
2
1
2
1
1
2
1
2
1
2
1
2
4
1
2
1
1
22
1
1
2
2
10
10
10
10
2
1
1
22
1
1
2
2222
2
44
2
4
4
4
4
22222
0
0
B
B
A
A
BBB
BBB
AAA
AAA
B
B
A
A
B
B
A
A
B
B
BBA
A
AA
B
B
BB
BB
A
A
AA
AA
B
B
A
A
B
B
A
A
v
v
T
Tu
T
Tu
ZmZ
ZmZu
ZmZ
ZmZu
P
Pu
P
Pu
P
Pu
P
Pu
d
du
Ddd
du
Dd
D
Du
Dd
Dd
D
Du
Dd
Dd
uu
C
Cu
C
Cu
q
qu
(4.20)
The uncertainty model for the total energy flow rate of two orifice flow meters in parallel (meter A and meter B) can be written as
.
2
1
2
1
2
1
2
1
2
1
2
1
1
2
1
2
1
2
1
2
4
1
2
1
1
22
1
1
2
2
1,
1,
1,
1,
2
1
1
22
1
1
2
2222
2
44
2
4
4
4
4
22222
B
B
A
A
BBmBs
BBmBs
AAmAs
AAmAs
B
B
A
A
B
B
A
A
B
B
BBA
A
AA
B
B
BB
BB
A
A
AA
AA
B
B
A
A
B
B
A
A
e
e
T
Tu
T
Tu
ZmH
ZmHu
ZmH
ZmHu
P
Pu
P
Pu
P
Pu
P
Pu
d
du
Ddd
du
Dd
D
Du
Dd
Dd
D
Du
Dd
Dd
uu
C
Cu
C
Cu
q
qu
(4.21)
Uncertainty model for the online uncertainty calculator for gas flow metering stations Report
Ref. no.: CMR-14-A10099-RA-1 Rev.: 00 Date: 19.03.2014 Page 31 of 93
© Christian Michelsen Research AS.
5 Coriolis fiscal metering station
In this chapter, uncertainty models for mass flow rate, standard volume flow rate and energy flow rate for a Coriolis flow metering station are presented. In Section 5.1 the set-up of the metering station is given. In Section 5.2 the functional relationship for the mass flow rate, standard volume flow rate and energy flow rate for a metering station with one Coriolis flow meter is presented. Section 5.3 gives the uncertainty model for the mass flow rate for a single Coriolis flow meter. In Section 5.4 this is extended to uncertainty models also for standard volume flow rate and energy flow rate. Section 5.5 gives the uncertainty model for the total flow rates from two Coriolis flow meters in parallel, and Section 5.6 for the average flow rates from two Coriolis flow meters in series.
5.1 Description of metering station
The Coriolis metering station consists of a Coriolis mass flow meter. In addition, pressure and temperature is measured. It is assumed that density, compressibility and calorific value are calculated based on a gas composition. There are three option covered:
A given, fixed composition.
Gas composition measured by online gas chromatograph.
Gas composition measured by laboratory analysis of spot gas samples. In addition the cases of two flow meters in parallel and two flow meters in series are covered. It is assumed that the same gas composition is used for both flow meters
5.2 Functional relationship
5.2.1 Mass flow rate, flow calibrated Coriolis meter
The Coriolis flow meter measures the mass flow rate as its primary output. Typically, the Coriolis flow meter will be flow calibrated. Thus, an adjustment of the flow meter may be carried out. The flow calibration is carried by comparing the mass flow rate output from the Coriolis flow meter with the similar reading from a reference measurement. This is carried out at a set of N different flow rates. The details are covered in Appendix A, where “x” is replaced by “m” and “Meter” is replaced by “Coriolis” in the index of the flow rate q in the formulas. Three different ways of correcting the flow meter are covered:
(i) no correction, (ii) a constant percentage correction, (iii) linear interpolation.
Appendix A describes the percentage deviation that is corrected (“p”) in all these three cases, and how this is converted to a correction factor K. It should, however, be commented that the third case (linear interpolation) provides a correction such that the flow meter’s flow rate will be corrected to the reference meter flow rate, when the flow rate is equal to any of the flow rates used in the flow calibration. This case is therefore in agreement with the Norwegian Petroleum Directorate Measurement Regulations [NPD], where one requirement in Section

Ref. no.: CMR-14-A10099-RA-1 Rev.: 00 Date: 19.03.2014 Page 32 of 93
Uncertainty model for the online uncertainty calculator for gas flow metering stations Report
© Christian Michelsen Research AS.
8 is that “The measurement system shall be designed so that systematic measurement errors are avoided or compensated for”. Using case (i) and (ii) is not in agreement with this requirement.
5.2.2 Standard volumetric flow rate and energy flow rate, flow calibrated Coriolis meter
In the previous subsection it is described how the mass flow rate from a flow calibrated Coriolis flow meter is found. The standard volumetric flow rate can now be found by using a gas composition coming from either an online gas chromatograph, from spot sampling, or from a fixed composition. In all three cases, the standard volumetric flow rate can be written as
mv qmP
RTZq
0
00
0 . (5.1)
Similarly, the energy flow rate can be found as
mmse qHq , . (5.2)
5.3 Uncertainty model, mass flow rate
The uncertainty of the mass flow rate of a flow calibrated Coriolis meter consists of two general uncertainty contributions
Calibration uncertainty
Field uncertainty Formally, this can be written as
2
,
2
,
2
m
fieldm
m
calm
m
m
q
qu
q
qu
q
qu. (5.3)
These two contributions will now be discussed more in detail.
5.3.1 Calibration uncertainty
The calibration uncertainty consists of the following three contributions:
Uncertainty of the correction factor estimate (the adjustment after deviations between flow meter and reference measurement at the flow laboratory are established).
Uncertainty of the reference measurement at the flow laboratory.
Repeatability, including both the Coriolis flow meter to be calibrated and the reference measurement.
This can be written as

Uncertainty model for the online uncertainty calculator for gas flow metering stations Report
Ref. no.: CMR-14-A10099-RA-1 Rev.: 00 Date: 19.03.2014 Page 33 of 93
© Christian Michelsen Research AS.
2
,,
2
,,
2
,,
2
,
m
reptcalm
m
refcalm
m
devcalm
m
calm
q
qu
q
qu
q
qu
q
qu. (5.4)
These three terms will now be discussed more in detail. Uncertainty of the correction factor estimate: This uncertainty contribution is described in Appendix A, where, where “x” is replaced by “m” and “Meter” is replaced by “Coriolis” in the index of the flow rate q in the formulas. It is calculated from the deviation between the Coriolis flow meter mass flow rate and the mass flow rate measured by the reference meter, at a series of mass flow rates. Three adjustment methods for the Coriolis flow meter are discussed:
(i) no correction, (ii) a constant percentage correction, (iii) linear interpolation.
For each of these methods, the actual expression is given in Appendix A for any uncorrected percentage
deviation, p , of the flow meter after adjustment of the Coriolis flow meter.
As described in Appendix A, the relative standard uncertainty of the correction factor estimate can be written as
p
ppu
K
p
KK
Ku
q
qu
m
devcalm
100
3)(
1,, . (5.5)
Uncertainty of the reference measurement: This term depends on the metering equipment at the flow laboratory. This number is usually found in the calibration certificate. It can depend on the flow rate. Therefore, for mass flow rates between the ones used in the flow calibration, a linear interpolation based on the values of this uncertainty at the mass flow rates used in flow calibration is used. The relative uncertainty at the highest calibrated flow rate will be used for flow rates above this highest calibrated flow rate. The relative uncertainty at the lowest calibrated flow rate will be used for flow rates below this lowest calibrated flow rate. Repeatability: This term covers both the repeatability of the Coriolis flow meter to be calibrated and the reference measurement. It can vary with mass flow rate. Therefore, for mass flow rates between the ones used in the flow calibration, a linear interpolation based on the values of this repeatability at the mass flow rates used in flow calibration is used. The repeatability at the highest calibrated flow rate will be used for flow rates above this highest calibrated flow rate. The repeatability at the lowest calibrated flow rate will be used for flow rates below this lowest calibrated flow rate.
5.3.2 Field uncertainty
The field uncertainty will consist of the following two contributions
Repeatability of the flow meter under field operation
Uncertainty due to changes of conditions from flow calibration to field operation This can be written as
2
,,
2
,,
2
,
m
condfieldm
m
reptfieldm
m
fieldm
q
qu
q
qu
q
qu. (5.6)
These two terms will now be discussed more in detail.
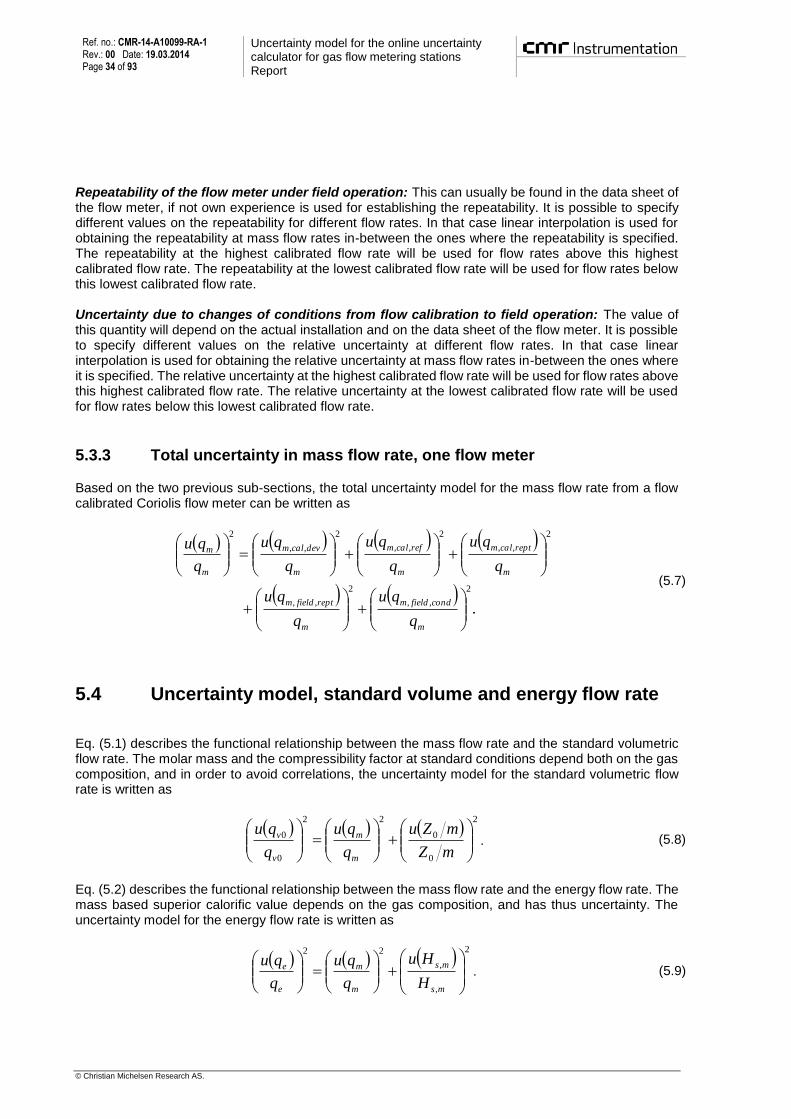
Ref. no.: CMR-14-A10099-RA-1 Rev.: 00 Date: 19.03.2014 Page 34 of 93
Uncertainty model for the online uncertainty calculator for gas flow metering stations Report
© Christian Michelsen Research AS.
Repeatability of the flow meter under field operation: This can usually be found in the data sheet of the flow meter, if not own experience is used for establishing the repeatability. It is possible to specify different values on the repeatability for different flow rates. In that case linear interpolation is used for obtaining the repeatability at mass flow rates in-between the ones where the repeatability is specified. The repeatability at the highest calibrated flow rate will be used for flow rates above this highest calibrated flow rate. The repeatability at the lowest calibrated flow rate will be used for flow rates below this lowest calibrated flow rate. Uncertainty due to changes of conditions from flow calibration to field operation: The value of this quantity will depend on the actual installation and on the data sheet of the flow meter. It is possible to specify different values on the relative uncertainty at different flow rates. In that case linear interpolation is used for obtaining the relative uncertainty at mass flow rates in-between the ones where it is specified. The relative uncertainty at the highest calibrated flow rate will be used for flow rates above this highest calibrated flow rate. The relative uncertainty at the lowest calibrated flow rate will be used for flow rates below this lowest calibrated flow rate.
5.3.3 Total uncertainty in mass flow rate, one flow meter
Based on the two previous sub-sections, the total uncertainty model for the mass flow rate from a flow calibrated Coriolis flow meter can be written as
.
2
,,
2
,,
2
,,
2
,,
2
,,
2
m
condfieldm
m
reptfieldm
m
reptcalm
m
refcalm
m
devcalm
m
m
q
qu
q
qu
q
qu
q
qu
q
qu
q
qu
(5.7)
5.4 Uncertainty model, standard volume and energy flow rate
Eq. (5.1) describes the functional relationship between the mass flow rate and the standard volumetric flow rate. The molar mass and the compressibility factor at standard conditions depend both on the gas composition, and in order to avoid correlations, the uncertainty model for the standard volumetric flow rate is written as
2
0
0
22
0
0
mZ
mZu
q
qu
q
qu
m
m
v
v. (5.8)
Eq. (5.2) describes the functional relationship between the mass flow rate and the energy flow rate. The mass based superior calorific value depends on the gas composition, and has thus uncertainty. The uncertainty model for the energy flow rate is written as
2
,
,
22
ms
ms
m
m
e
e
H
Hu
q
qu
q
qu. (5.9)

Uncertainty model for the online uncertainty calculator for gas flow metering stations Report
Ref. no.: CMR-14-A10099-RA-1 Rev.: 00 Date: 19.03.2014 Page 35 of 93
© Christian Michelsen Research AS.
5.5 Two flow meters in parallel
5.5.1 Correlation classification
The generic uncertainty model for two flow meters in parallel is given in Appendix B. The uncertainty model is developed under the assumption that the flow rate is about the same in both pipes. Based on the results of the uncertainty model development in Appendix B, it is necessary to classify all uncertainty contributions as either correlated or uncorrelated between the two flow meters. The following assumptions and evaluations have been made in order to classify the correlations:
Calibration uncertainty o Uncertainty of the correction factor estimate (the adjustment after deviations between
flow meter and reference measurement at the flow laboratory are established): It is assumed that this uncertainty contribution in uncorrelated as each meter will have its own deviation curve, and possible errors due to linear interpolation in such a deviation curve are not likely to repeat between different meters.
o Uncertainty of the reference measurement at the flow laboratory: If the two flow meters are calibrated at the same time at the same location, it is likely that this uncertainty contribution is correlated, as the flow meters are compared to the same reference. In other cases it is likely that it is uncorrelated. In the uncertainty program it is possible to specify whether the flow meters are calibrated at the same time and location or not.
o Repeatability, including both the Coriolis flow meter to be calibrated and the reference measurement: This represents random variations, and will thus be uncorrelated between the two flow meters.
Field uncertainty o Repeatability of the flow meter under field operation: this represents random variations,
and will thus be uncorrelated between the two flow meters. o Uncertainty due to changes of conditions from flow calibration to field operation: It is
here assumed that this is uncorrelated. This is because the flow conditions will never be identical in two different pipes, and therefore it is likely that they may be affected differently by changed conditions from calibration to field.
Gas parameters o The uncertainty of the fraction of standard compressibility to molar mass is used in the
uncertainty model for standard volume flow rate. As it is assumed that the same gas composition is used for both flow meters, this parameter is correlated.
o The uncertainty of the mass based superior calorific value is used in the uncertainty model for energy flow rate. As it is assumed that the same gas composition is used for both flow meters, this parameter is correlated.
5.5.2 Specific uncertainty models
Based on the uncertainty models for one flow calibrated Coriolis meter (mass flow rate Eq. (5.7), standard volume flow rate Eq. (5.8) and energy flow rate Eq. (5.9)), the general model for combining these uncertainty models into a model for two in parallel (Section B 2) and the classification of uncertainty contributions as either correlated or uncorrelated, the uncertainty models for two flow meters in parallel can be found. If the two flow meters are calibrated at the same time and location: The uncertainty model for the total mass flow rate of two flow calibrated Coriolis flow meters in parallel (meter A and meter B) can be written as

Ref. no.: CMR-14-A10099-RA-1 Rev.: 00 Date: 19.03.2014 Page 36 of 93
Uncertainty model for the online uncertainty calculator for gas flow metering stations Report
© Christian Michelsen Research AS.
.
4
1
2
,,
2
,,
2
,,
2
,,
2
,,
2
,,
2
,,,,
2
,,
2
,,
2
mA
condAfieldm
mA
condAfieldm
mB
reptBfieldm
mA
reptAfieldm
mb
reptBcalm
mA
reptAcalm
mB
refBcalm
mA
refAcalm
mB
devBcalm
mA
devAcalm
m
m
q
qu
q
qu
q
qu
q
qu
q
qu
q
qu
q
qu
q
qu
q
qu
q
qu
q
qu
(5.10)
The uncertainty model for the total standard volume flow rate of two flow calibrated Coriolis flow meters in parallel can be written as
.
4
1
2
0
0
0
0
2
,,
2
,,
2
,,
2
,,
2
,,
2
,,
2
,,,,
2
,,
2
,,
2
0
0
BB
BB
AA
AA
mA
condAfieldm
mA
condAfieldm
mB
reptBfieldm
mA
reptAfieldm
mb
reptBcalm
mA
reptAcalm
mB
refBcalm
mA
refAcalm
mB
devBcalm
mA
devAcalm
v
v
mZ
mZu
mZ
mZu
q
qu
q
qu
q
qu
q
qu
q
qu
q
qu
q
qu
q
qu
q
qu
q
qu
q
qu
(5.11)
The uncertainty model for the total energy flow rate of two flow calibrated Coriolis flow meters in parallel can be written as
.
4
1
2
,
,
,
,
2
,,
2
,,
2
,,
2
,,
2
,,
2
,,
2
,,,,
2
,,
2
,,
2
mBs
mBs
mAs
mAs
mA
condAfieldm
mA
condAfieldm
mB
reptBfieldm
mA
reptAfieldm
mb
reptBcalm
mA
reptAcalm
mB
refBcalm
mA
refAcalm
mB
devBcalm
mA
devAcalm
e
e
H
Hu
H
Hu
q
qu
q
qu
q
qu
q
qu
q
qu
q
qu
q
qu
q
qu
q
qu
q
qu
q
qu
(5.12)
If the two flow meters are not calibrated at the same time and location: The uncertainty model for the total mass flow rate of two flow calibrated Coriolis flow meters in parallel (meter A and meter B) can be written as

Uncertainty model for the online uncertainty calculator for gas flow metering stations Report
Ref. no.: CMR-14-A10099-RA-1 Rev.: 00 Date: 19.03.2014 Page 37 of 93
© Christian Michelsen Research AS.
.
4
1
2
,,
2
,,
2
,,
2
,,
2
,,
2
,,
2
,,
2
,,
2
,,
2
,,
2
mA
condAfieldm
mA
condAfieldm
mB
reptBfieldm
mA
reptAfieldm
mb
reptBcalm
mA
reptAcalm
mB
refBcalm
mA
refAcalm
mB
devBcalm
mA
devAcalm
m
m
q
qu
q
qu
q
qu
q
qu
q
qu
q
qu
q
qu
q
qu
q
qu
q
qu
q
qu
(5.13)
The uncertainty model for the total standard volume flow rate of two flow calibrated Coriolis flow meters in parallel can be written as
.
4
1
2
0
0
0
0
2
,,
2
,,
2
,,
2
,,
2
,,
2
,,
2
,,
2
,,
2
,,
2
,,
2
0
0
BB
BB
AA
AA
mA
condAfieldm
mA
condAfieldm
mB
reptBfieldm
mA
reptAfieldm
mb
reptBcalm
mA
reptAcalm
mB
refBcalm
mA
refAcalm
mB
devBcalm
mA
devAcalm
v
v
mZ
mZu
mZ
mZu
q
qu
q
qu
q
qu
q
qu
q
qu
q
qu
q
qu
q
qu
q
qu
q
qu
q
qu
(5.14)
The uncertainty model for the total energy flow rate of two flow calibrated Coriolis flow meters in parallel can be written as
.
4
1
2
,
,
,
,
2
,,
2
,,
2
,,
2
,,
2
,,
2
,,
2
,,
2
,,
2
,,
2
,,
2
mBs
mBs
mAs
mAs
mA
condAfieldm
mA
condAfieldm
mB
reptBfieldm
mA
reptAfieldm
mb
reptBcalm
mA
reptAcalm
mB
refBcalm
mA
refAcalm
mB
devBcalm
mA
devAcalm
e
e
H
Hu
H
Hu
q
qu
q
qu
q
qu
q
qu
q
qu
q
qu
q
qu
q
qu
q
qu
q
qu
q
qu
(5.15)
5.6 Two flow meters in series
When two Coriolis flow meters are installed in series, the operator can either use one as master and the other just as a check for quality assurance purposes. In that case the uncertainty analysis for one flow meter alone will be the valid one. This section covers the case when the average flow rate from the two meters is to be used.

Ref. no.: CMR-14-A10099-RA-1 Rev.: 00 Date: 19.03.2014 Page 38 of 93
Uncertainty model for the online uncertainty calculator for gas flow metering stations Report
© Christian Michelsen Research AS.
5.6.1 Correlation classification
The generic uncertainty model for two flow meters in series is given in Section B 3. Based on the results of the uncertainty model development in Appendix B, it is necessary to classify all uncertainty contributions as either correlated or uncorrelated between the two flow meters. The following assumptions and evaluations have been made in order to classify the correlations:
Calibration uncertainty o Uncertainty of the correction factor estimate (the adjustment after deviations between
flow meter and reference measurement at the flow laboratory are established): It is assumed that this uncertainty contribution in uncorrelated as each meter will have its own deviation curve, and possible errors due to linear interpolation in such a deviation curve are not likely to repeat between different meters.
o Uncertainty of the reference measurement at the flow laboratory: If the two flow meters are calibrated at the same time at the same location, it is likely that this uncertainty contribution is correlated, as the flow meters are compared to the same reference. In other cases it is likely that it is uncorrelated. In the uncertainty program it is possible to specify whether the flow meters are calibrated at the same time and location or not.
o Repeatability, including both the Coriolis flow meter to be calibrated and the reference measurement: This represents random variations, and will thus be uncorrelated between the two flow meters.
Field uncertainty o Repeatability of the flow meter under field operation: this represents random variations,
and will thus be uncorrelated between the two flow meters. o Uncertainty due to changes of conditions from flow calibration to field operation: It is
here assumed that this is uncorrelated. This is because the upstream of the two meters will affect the flow conditions of the downstream meter. Therefore it is likely that they may be affected differently by changed conditions from calibration to field.
Gas parameters o The uncertainty of the fraction of standard compressibility to molar mass is used in the
uncertainty model for standard volume flow rate. As it is assumed that the same gas composition is used for both flow meters, this parameter is correlated.
o The uncertainty of the mass based superior calorific value is used in the uncertainty model for energy flow rate. As it is assumed that the same gas composition is used for both flow meters, this parameter is correlated.
5.6.2 Specific uncertainty models
Based on the uncertainty models for one flow calibrated Coriolis meter (mass flow rate Eq. (5.7), standard volume flow rate Eq. (5.8) and energy flow rate Eq. (5.9)), the general model for combining these uncertainty models into a model for two in series (Section B 3) and the classification of uncertainty contributions as either correlated or uncorrelated, the uncertainty models for two flow meters in parallel can be found. If the two flow meters are calibrated at the same time and location: The uncertainty model for the average mass flow rate of two flow calibrated Coriolis flow meters in series (meter A and meter B) can be written as

Uncertainty model for the online uncertainty calculator for gas flow metering stations Report
Ref. no.: CMR-14-A10099-RA-1 Rev.: 00 Date: 19.03.2014 Page 39 of 93
© Christian Michelsen Research AS.
.
4
1
2
,,
2
,,
2
,,
2
,,
2
,,
2
,,
2
,,,,
2
,,
2
,,
2
mA
condAfieldm
mA
condAfieldm
mB
reptBfieldm
mA
reptAfieldm
mb
reptBcalm
mA
reptAcalm
mB
refBcalm
mA
refAcalm
mB
devBcalm
mA
devAcalm
m
m
q
qu
q
qu
q
qu
q
qu
q
qu
q
qu
q
qu
q
qu
q
qu
q
qu
q
qu
(5.16)
The uncertainty model for the average standard volume flow rate of two flow calibrated Coriolis flow meters in series can be written as
.
4
1
2
0
0
0
0
2
,,
2
,,
2
,,
2
,,
2
,,
2
,,
2
,,,,
2
,,
2
,,
2
0
0
BB
BB
AA
AA
mA
condAfieldm
mA
condAfieldm
mB
reptBfieldm
mA
reptAfieldm
mb
reptBcalm
mA
reptAcalm
mB
refBcalm
mA
refAcalm
mB
devBcalm
mA
devAcalm
v
v
mZ
mZu
mZ
mZu
q
qu
q
qu
q
qu
q
qu
q
qu
q
qu
q
qu
q
qu
q
qu
q
qu
q
qu
(5.17)
The uncertainty model for the average energy flow rate of two flow calibrated Coriolis flow meters in series can be written as
.
4
1
2
,
,
,
,
2
,,
2
,,
2
,,
2
,,
2
,,
2
,,
2
,,,,
2
,,
2
,,
2
mBs
mBs
mAs
mAs
mA
condAfieldm
mA
condAfieldm
mB
reptBfieldm
mA
reptAfieldm
mb
reptBcalm
mA
reptAcalm
mB
refBcalm
mA
refAcalm
mB
devBcalm
mA
devAcalm
e
e
H
Hu
H
Hu
q
qu
q
qu
q
qu
q
qu
q
qu
q
qu
q
qu
q
qu
q
qu
q
qu
q
qu
(5.18)
If the two flow meters are not calibrated at the same time and location: The uncertainty model for the average mass flow rate of two flow calibrated Coriolis flow meters in series (meter A and meter B) can be written as
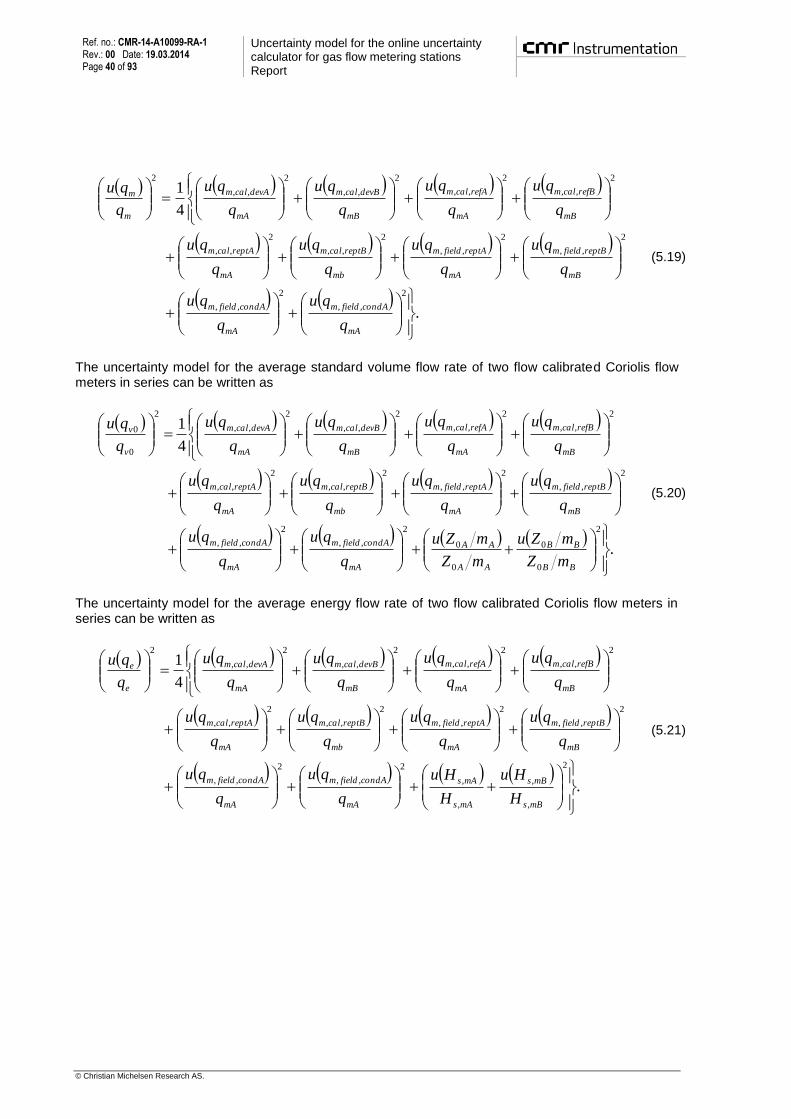
Ref. no.: CMR-14-A10099-RA-1 Rev.: 00 Date: 19.03.2014 Page 40 of 93
Uncertainty model for the online uncertainty calculator for gas flow metering stations Report
© Christian Michelsen Research AS.
.
4
1
2
,,
2
,,
2
,,
2
,,
2
,,
2
,,
2
,,
2
,,
2
,,
2
,,
2
mA
condAfieldm
mA
condAfieldm
mB
reptBfieldm
mA
reptAfieldm
mb
reptBcalm
mA
reptAcalm
mB
refBcalm
mA
refAcalm
mB
devBcalm
mA
devAcalm
m
m
q
qu
q
qu
q
qu
q
qu
q
qu
q
qu
q
qu
q
qu
q
qu
q
qu
q
qu
(5.19)
The uncertainty model for the average standard volume flow rate of two flow calibrated Coriolis flow meters in series can be written as
.
4
1
2
0
0
0
0
2
,,
2
,,
2
,,
2
,,
2
,,
2
,,
2
,,
2
,,
2
,,
2
,,
2
0
0
BB
BB
AA
AA
mA
condAfieldm
mA
condAfieldm
mB
reptBfieldm
mA
reptAfieldm
mb
reptBcalm
mA
reptAcalm
mB
refBcalm
mA
refAcalm
mB
devBcalm
mA
devAcalm
v
v
mZ
mZu
mZ
mZu
q
qu
q
qu
q
qu
q
qu
q
qu
q
qu
q
qu
q
qu
q
qu
q
qu
q
qu
(5.20)
The uncertainty model for the average energy flow rate of two flow calibrated Coriolis flow meters in series can be written as
.
4
1
2
,
,
,
,
2
,,
2
,,
2
,,
2
,,
2
,,
2
,,
2
,,
2
,,
2
,,
2
,,
2
mBs
mBs
mAs
mAs
mA
condAfieldm
mA
condAfieldm
mB
reptBfieldm
mA
reptAfieldm
mb
reptBcalm
mA
reptAcalm
mB
refBcalm
mA
refAcalm
mB
devBcalm
mA
devAcalm
e
e
H
Hu
H
Hu
q
qu
q
qu
q
qu
q
qu
q
qu
q
qu
q
qu
q
qu
q
qu
q
qu
q
qu
(5.21)

Uncertainty model for the online uncertainty calculator for gas flow metering stations Report
Ref. no.: CMR-14-A10099-RA-1 Rev.: 00 Date: 19.03.2014 Page 41 of 93
© Christian Michelsen Research AS.
6 USM fiscal metering stations
In this chapter, uncertainty models for mass flow rate, standard volume flow rate and energy flow rate for an ultrasonic multipath flow metering station are presented. The work is a generalization of the work in [Lunde et al, 2002], where now more set-ups of the metering station are covered. In Section 6.1 the set-up of the metering station is given. In Section 6.2 the functional relationship for the actual volume flow rate, mass flow rate, standard volume flow rate and energy flow rate for a metering station with one ultrasonic flow meter is presented. Section 6.3 gives the uncertainty model for the actual volume flow rate for a single ultrasonic flow meter. In Section 6.4 this is extended to uncertainty models also for mass flow rate, standard volume flow rate and energy flow rate. Section 6.5 gives the uncertainty model for the total flow rates from two ultrasonic flow meters in parallel, and Section 6.6 for the average flow rates from two ultrasonic flow meters in series.
6.1 Description of metering station
The ultrasonic metering station consists of an ultrasonic multipath flow meter (giving primarily the actual volume flow rate). In addition, pressure and temperature is measured. Density is either measured by a densitometer or calculated based on a gas composition. Furthermore, compressibility and calorific value are calculated based on a gas composition. There are three option covered for the gas composition:
A given, fixed composition.
Gas composition measured by online gas chromatograph.
Gas composition measured by laboratory analysis of spot gas samples. In addition the cases of two flow meters in parallel and two flow meters in series are covered. In that case each meter has its own pressure and temperature measurements, and when densitometers are in use, each meter has its own dedicated densitometer. It is assumed that the same gas composition is used for both flow meters.
6.2 Functional relationship
6.2.1 Actual volume flow rate, flow calibrated USM meter
The ultrasonic multipath flow meter measures the actual volume flow rate as its primary output. Typically, the ultrasonic flow meter will be flow calibrated. Thus, an adjustment of the flow meter may be carried out. The flow calibration is carried by comparing the actual volume flow rate as output from the ultrasonic flow meter with the similar reading from a reference measurement. This is carried out at a set of N different flow rates. The details are covered in Appendix A, where “x” is replaced by “v” and “Meter” is replaced by “USM” in the index of the flow rate q in the formulas. Three different ways of correcting the flow meter are covered:
(i) no correction, (ii) a constant percentage correction, (iii) linear interpolation.

Ref. no.: CMR-14-A10099-RA-1 Rev.: 00 Date: 19.03.2014 Page 42 of 93
Uncertainty model for the online uncertainty calculator for gas flow metering stations Report
© Christian Michelsen Research AS.
Appendix A describes the percentage deviation that is corrected (“p”) in all these three cases, and how this is converted to a correction factor K. It should, however, be commented that the third case (linear interpolation) provides a correction such that the flow meter’s flow rate will be corrected to the reference meter flow rate, when the flow rate is equal to any of the flow rates used in the flow calibration. This case is therefore in agreement with the Norwegian Petroleum Directorate Measurement Regulations [NPD], where one requirement in Section 8 is that “The measurement system shall be designed so that systematic measurement errors are avoided or compensated for”. Using case (i) and (ii) is not in agreement with this requirement.
6.2.2 Mass, standard volume and energy flow rate, flow calibrated USM meter
In the previous subsection it is described how the actual volume flow rate from a flow calibrated ultrasonic flow meter is found. It will here be shown how the mass, standard volume and energy flow rates are found. These calculations are different depending on the set-up of the metering station. First the case where a densitometer is in used will be presented. Thereafter the case where a densitometer is not in use will be presented. Densitometer in use: The mass flow rate is found by multiplication of the actual volume flow rate with the measured density (at line conditions):
vm qq . (6.1)
In order to find the standard volume flow rate, a pressure and temperature correction of the actual volume flow rate must be carried out. In addition, the change in compressibility between line and standard condition must be adjusted for. This gives the following expression:
vv qZTP
TPZq
0
000 . (6.2)
In order to find the compressibility factors, a gas composition is needed, either measured or calculated. The energy flow rate is obtained by multiplying the mass flow rate by the mass based superior calorific value. This gives the following expression:
vmse qHq , . (6.3)
It should be commented here that it is also possible to obtain the energy flow rate by multiplying the standard volume flow rate with the volume based superior calorific value. This will not give the same answer because in that case the measured density from the densitometer will not be used. The uncertainty will also be different. However, that way of establishing the energy flow rate can be analyzed using the option that densitometer is not in use, as the output energy flow rate will be identical to the one described for the case of densitometer not in use. Densitometer not in use: In this case, all gas parameters are calculated from the gas composition that must be known either from online gas chromatography, laboratory analysis of gas samples or in other ways.
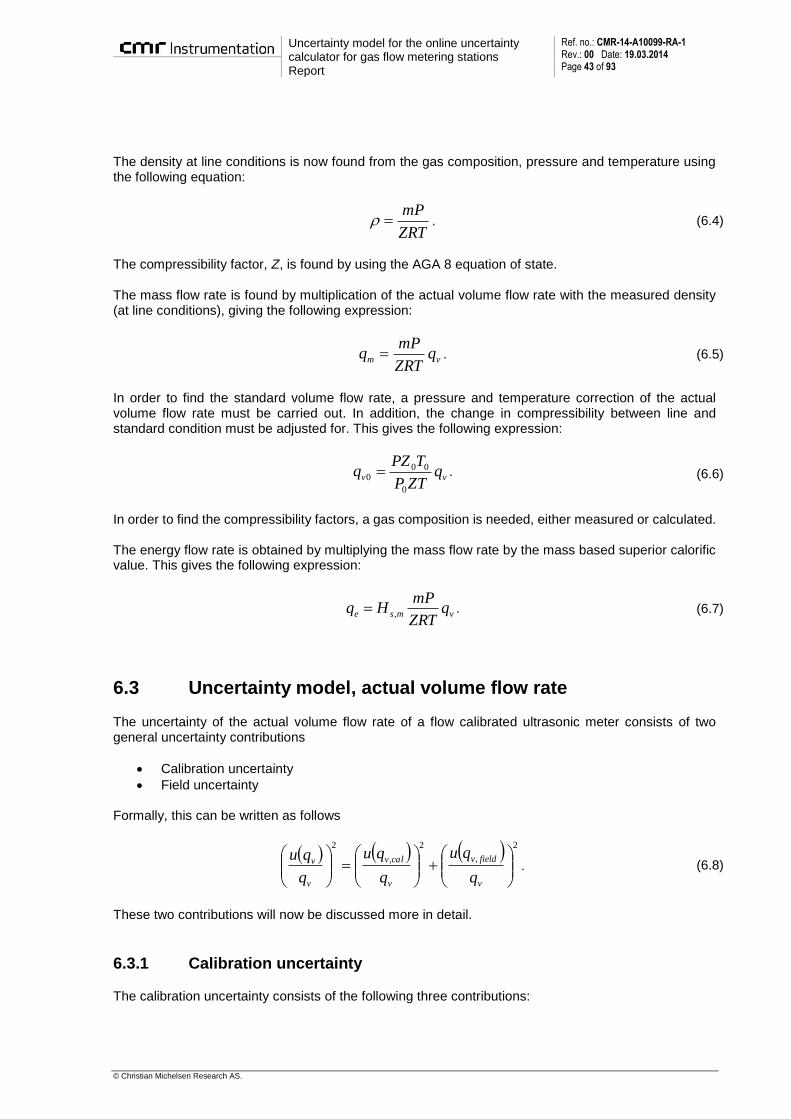
Uncertainty model for the online uncertainty calculator for gas flow metering stations Report
Ref. no.: CMR-14-A10099-RA-1 Rev.: 00 Date: 19.03.2014 Page 43 of 93
© Christian Michelsen Research AS.
The density at line conditions is now found from the gas composition, pressure and temperature using the following equation:
ZRT
mP . (6.4)
The compressibility factor, Z, is found by using the AGA 8 equation of state. The mass flow rate is found by multiplication of the actual volume flow rate with the measured density (at line conditions), giving the following expression:
vm qZRT
mPq . (6.5)
In order to find the standard volume flow rate, a pressure and temperature correction of the actual volume flow rate must be carried out. In addition, the change in compressibility between line and standard condition must be adjusted for. This gives the following expression:
vv qZTP
TPZq
0
000 . (6.6)
In order to find the compressibility factors, a gas composition is needed, either measured or calculated. The energy flow rate is obtained by multiplying the mass flow rate by the mass based superior calorific value. This gives the following expression:
vmse qZRT
mPHq , . (6.7)
6.3 Uncertainty model, actual volume flow rate
The uncertainty of the actual volume flow rate of a flow calibrated ultrasonic meter consists of two general uncertainty contributions
Calibration uncertainty
Field uncertainty Formally, this can be written as follows
2
,
2
,
2
v
fieldv
v
calv
v
v
q
qu
q
qu
q
qu. (6.8)
These two contributions will now be discussed more in detail.
6.3.1 Calibration uncertainty
The calibration uncertainty consists of the following three contributions:
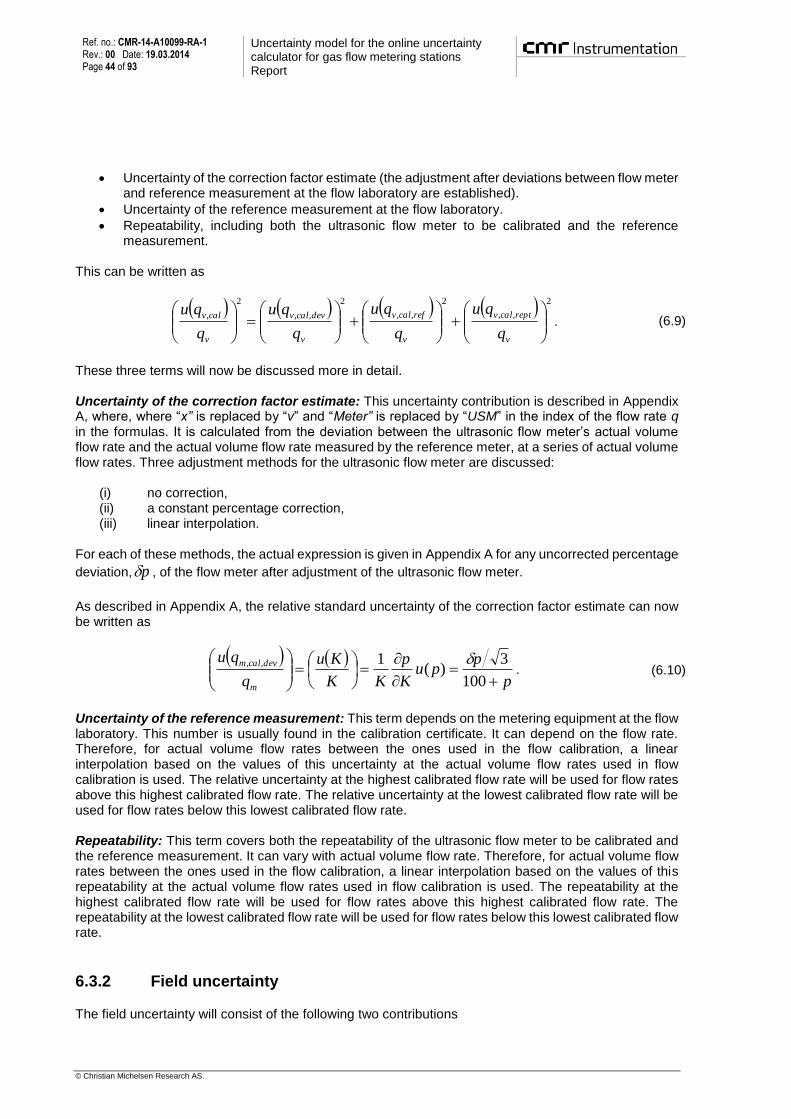
Ref. no.: CMR-14-A10099-RA-1 Rev.: 00 Date: 19.03.2014 Page 44 of 93
Uncertainty model for the online uncertainty calculator for gas flow metering stations Report
© Christian Michelsen Research AS.
Uncertainty of the correction factor estimate (the adjustment after deviations between flow meter and reference measurement at the flow laboratory are established).
Uncertainty of the reference measurement at the flow laboratory.
Repeatability, including both the ultrasonic flow meter to be calibrated and the reference measurement.
This can be written as
2
,,
2
,,
2
,,
2
,
v
reptcalv
v
refcalv
v
devcalv
v
calv
q
qu
q
qu
q
qu
q
qu. (6.9)
These three terms will now be discussed more in detail. Uncertainty of the correction factor estimate: This uncertainty contribution is described in Appendix A, where, where “x” is replaced by “v” and “Meter” is replaced by “USM” in the index of the flow rate q in the formulas. It is calculated from the deviation between the ultrasonic flow meter’s actual volume flow rate and the actual volume flow rate measured by the reference meter, at a series of actual volume flow rates. Three adjustment methods for the ultrasonic flow meter are discussed:
(i) no correction, (ii) a constant percentage correction, (iii) linear interpolation.
For each of these methods, the actual expression is given in Appendix A for any uncorrected percentage
deviation, p , of the flow meter after adjustment of the ultrasonic flow meter.
As described in Appendix A, the relative standard uncertainty of the correction factor estimate can now be written as
p
ppu
K
p
KK
Ku
q
qu
m
devcalm
100
3)(
1,, . (6.10)
Uncertainty of the reference measurement: This term depends on the metering equipment at the flow laboratory. This number is usually found in the calibration certificate. It can depend on the flow rate. Therefore, for actual volume flow rates between the ones used in the flow calibration, a linear interpolation based on the values of this uncertainty at the actual volume flow rates used in flow calibration is used. The relative uncertainty at the highest calibrated flow rate will be used for flow rates above this highest calibrated flow rate. The relative uncertainty at the lowest calibrated flow rate will be used for flow rates below this lowest calibrated flow rate. Repeatability: This term covers both the repeatability of the ultrasonic flow meter to be calibrated and the reference measurement. It can vary with actual volume flow rate. Therefore, for actual volume flow rates between the ones used in the flow calibration, a linear interpolation based on the values of this repeatability at the actual volume flow rates used in flow calibration is used. The repeatability at the highest calibrated flow rate will be used for flow rates above this highest calibrated flow rate. The repeatability at the lowest calibrated flow rate will be used for flow rates below this lowest calibrated flow rate.
6.3.2 Field uncertainty
The field uncertainty will consist of the following two contributions

Uncertainty model for the online uncertainty calculator for gas flow metering stations Report
Ref. no.: CMR-14-A10099-RA-1 Rev.: 00 Date: 19.03.2014 Page 45 of 93
© Christian Michelsen Research AS.
Repeatability of the flow meter under field operation
Uncertainty due to changes of conditions from flow calibration to field operation This can be written as
2
,,
2
,,
2
,
v
condfieldv
v
reptfieldv
v
fieldv
q
qu
q
qu
q
qu. (6.11)
These two terms will now be discussed more in detail. Repeatability of the flow meter under field operation: This can usually be found in the data sheet of the flow meter, if not own experience is used for establishing the repeatability. It is possible to specify different values on the repeatability for different flow rates. In that case linear interpolation is used for obtaining the repeatability at actual volume flow rates in-between the ones where the repeatability is specified. The repeatability at the highest calibrated flow rate will be used for flow rates above this highest calibrated flow rate. The repeatability at the lowest calibrated flow rate will be used for flow rates below this lowest calibrated flow rate. Uncertainty due to changes of conditions from flow calibration to field operation: The value of this quantity will depend on the actual installation and on the data sheet of the flow meter. In the program this uncertainty contribution can either be specified directly (overall level) or can be calculated based on more detailed uncertainty input. The latter case is based on the results of [Lunde et al, 2002]. The connection to that work is described in Appendix C. When overall level is specified, it is possible to specify different values on the relative uncertainty at different flow rates. In that case linear interpolation is used for obtaining the relative uncertainty at actual volume flow rates in-between the ones where it is specified. The relative uncertainty at the highest calibrated flow rate will be used for flow rates above this highest calibrated flow rate. The relative uncertainty at the lowest calibrated flow rate will be used for flow rates below this lowest calibrated flow rate. When detailed level is specified, this uncertainty term is calculated from the specified input.
6.3.3 Total uncertainty in actual volume flow rate, one flow meter
Based on the two previous sub-sections, the total uncertainty model for the actual volume flow rate from a flow calibrated ultrasonic flow meter can be written as
.
2
,,
2
,,
2
,,
2
,,
2
,,
2
v
condfieldv
v
reptfieldv
v
reptcalv
v
refcalv
v
devcalv
v
v
q
qu
q
qu
q
qu
q
qu
q
qu
q
qu
(6.12)
6.4 Uncertainty model, mass, standard volume and energy flow rate
The uncertainty models for the mass, standard volume and energy flow rate depend on whether a densitometer is in use or not. Both cases will be covered.
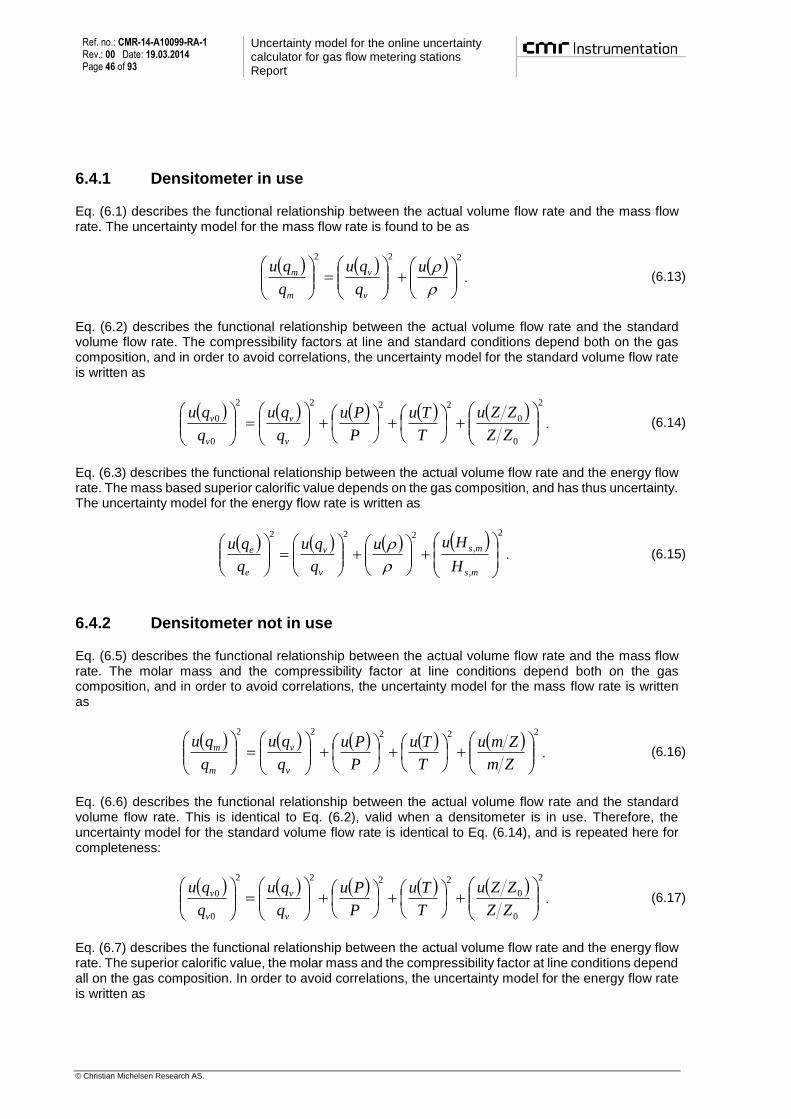
Ref. no.: CMR-14-A10099-RA-1 Rev.: 00 Date: 19.03.2014 Page 46 of 93
Uncertainty model for the online uncertainty calculator for gas flow metering stations Report
© Christian Michelsen Research AS.
6.4.1 Densitometer in use
Eq. (6.1) describes the functional relationship between the actual volume flow rate and the mass flow rate. The uncertainty model for the mass flow rate is found to be as
222
u
q
qu
q
qu
v
v
m
m. (6.13)
Eq. (6.2) describes the functional relationship between the actual volume flow rate and the standard volume flow rate. The compressibility factors at line and standard conditions depend both on the gas composition, and in order to avoid correlations, the uncertainty model for the standard volume flow rate is written as
2
0
0
2222
0
0
ZZ
ZZu
T
Tu
P
Pu
q
qu
q
qu
v
v
v
v. (6.14)
Eq. (6.3) describes the functional relationship between the actual volume flow rate and the energy flow rate. The mass based superior calorific value depends on the gas composition, and has thus uncertainty. The uncertainty model for the energy flow rate is written as
2
,
,
222
ms
ms
v
v
e
e
H
Huu
q
qu
q
qu
. (6.15)
6.4.2 Densitometer not in use
Eq. (6.5) describes the functional relationship between the actual volume flow rate and the mass flow rate. The molar mass and the compressibility factor at line conditions depend both on the gas composition, and in order to avoid correlations, the uncertainty model for the mass flow rate is written as
22222
Zm
Zmu
T
Tu
P
Pu
q
qu
q
qu
v
v
m
m. (6.16)
Eq. (6.6) describes the functional relationship between the actual volume flow rate and the standard volume flow rate. This is identical to Eq. (6.2), valid when a densitometer is in use. Therefore, the uncertainty model for the standard volume flow rate is identical to Eq. (6.14), and is repeated here for completeness:
2
0
0
2222
0
0
ZZ
ZZu
T
Tu
P
Pu
q
qu
q
qu
v
v
v
v. (6.17)
Eq. (6.7) describes the functional relationship between the actual volume flow rate and the energy flow rate. The superior calorific value, the molar mass and the compressibility factor at line conditions depend all on the gas composition. In order to avoid correlations, the uncertainty model for the energy flow rate is written as
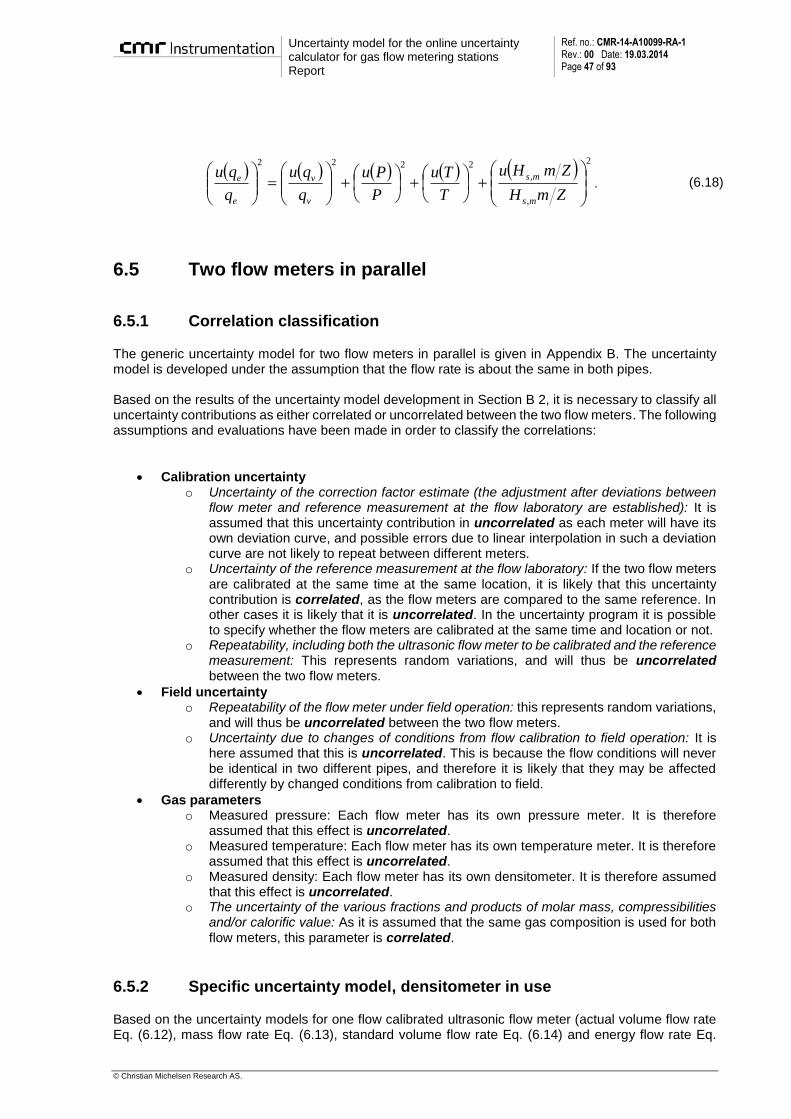
Uncertainty model for the online uncertainty calculator for gas flow metering stations Report
Ref. no.: CMR-14-A10099-RA-1 Rev.: 00 Date: 19.03.2014 Page 47 of 93
© Christian Michelsen Research AS.
2
,
,
2222
ZmH
ZmHu
T
Tu
P
Pu
q
qu
q
qu
ms
ms
v
v
e
e. (6.18)
6.5 Two flow meters in parallel
6.5.1 Correlation classification
The generic uncertainty model for two flow meters in parallel is given in Appendix B. The uncertainty model is developed under the assumption that the flow rate is about the same in both pipes. Based on the results of the uncertainty model development in Section B 2, it is necessary to classify all uncertainty contributions as either correlated or uncorrelated between the two flow meters. The following assumptions and evaluations have been made in order to classify the correlations:
Calibration uncertainty o Uncertainty of the correction factor estimate (the adjustment after deviations between
flow meter and reference measurement at the flow laboratory are established): It is assumed that this uncertainty contribution in uncorrelated as each meter will have its own deviation curve, and possible errors due to linear interpolation in such a deviation curve are not likely to repeat between different meters.
o Uncertainty of the reference measurement at the flow laboratory: If the two flow meters are calibrated at the same time at the same location, it is likely that this uncertainty contribution is correlated, as the flow meters are compared to the same reference. In other cases it is likely that it is uncorrelated. In the uncertainty program it is possible to specify whether the flow meters are calibrated at the same time and location or not.
o Repeatability, including both the ultrasonic flow meter to be calibrated and the reference measurement: This represents random variations, and will thus be uncorrelated between the two flow meters.
Field uncertainty o Repeatability of the flow meter under field operation: this represents random variations,
and will thus be uncorrelated between the two flow meters. o Uncertainty due to changes of conditions from flow calibration to field operation: It is
here assumed that this is uncorrelated. This is because the flow conditions will never be identical in two different pipes, and therefore it is likely that they may be affected differently by changed conditions from calibration to field.
Gas parameters o Measured pressure: Each flow meter has its own pressure meter. It is therefore
assumed that this effect is uncorrelated. o Measured temperature: Each flow meter has its own temperature meter. It is therefore
assumed that this effect is uncorrelated. o Measured density: Each flow meter has its own densitometer. It is therefore assumed
that this effect is uncorrelated. o The uncertainty of the various fractions and products of molar mass, compressibilities
and/or calorific value: As it is assumed that the same gas composition is used for both flow meters, this parameter is correlated.
6.5.2 Specific uncertainty model, densitometer in use
Based on the uncertainty models for one flow calibrated ultrasonic flow meter (actual volume flow rate Eq. (6.12), mass flow rate Eq. (6.13), standard volume flow rate Eq. (6.14) and energy flow rate Eq.

Ref. no.: CMR-14-A10099-RA-1 Rev.: 00 Date: 19.03.2014 Page 48 of 93
Uncertainty model for the online uncertainty calculator for gas flow metering stations Report
© Christian Michelsen Research AS.
(6.15)), the general model for combining these uncertainty models into a model for two in parallel (Appendix B) and the classification of uncertainty contributions as either correlated or uncorrelated, the uncertainty models for two flow meters in parallel can be found. If the two flow meters are calibrated at the same time and location: The uncertainty model for the total mass flow rate of two flow calibrated ultrasonic flow meters in parallel (meter A and meter B) can be written as
.
4
1
222
,,
2
,,
2
,,
2
,,
2
,,
2
,,
2
,,,,
2
,,
2
,,
2
B
B
A
A
vB
condBfieldv
vA
conAfieldv
vB
reptBfieldv
vA
reptAfieldv
vB
reptBcalv
vA
reptAcalv
vB
refBcalv
vA
refAcalv
vB
devBcalv
vA
devAcalv
m
m
uu
q
qu
q
qu
q
qu
q
qu
q
qu
q
qu
q
qu
q
qu
q
qu
q
qu
q
qu
(6.19)
The uncertainty model for the total standard volume flow rate of two flow calibrated ultrasonic flow meters in parallel (meter A and meter B) can be written as
.
4
1
2
0
0
0
0
22
222
,,
2
,,
2
,,
2
,,
2
,,
2
,,
2
,,,,
2
,,
2
,,
2
0
0
BB
BB
AA
AA
B
B
A
A
B
B
A
A
vB
condBfieldv
vA
conAfieldv
vB
reptBfieldv
vA
reptAfieldv
vB
reptBcalv
vA
reptAcalv
vB
refBcalv
vA
refAcalv
vB
devBcalv
vA
devAcalv
v
v
ZZ
ZZu
ZZ
ZZu
T
Tu
T
Tu
P
Pu
P
Pu
q
qu
q
qu
q
qu
q
qu
q
qu
q
qu
q
qu
q
qu
q
qu
q
qu
q
qu
(6.20)
The uncertainty model for the total energy flow rate of two flow calibrated ultrasonic flow meters in parallel (meter A and meter B) can be written as
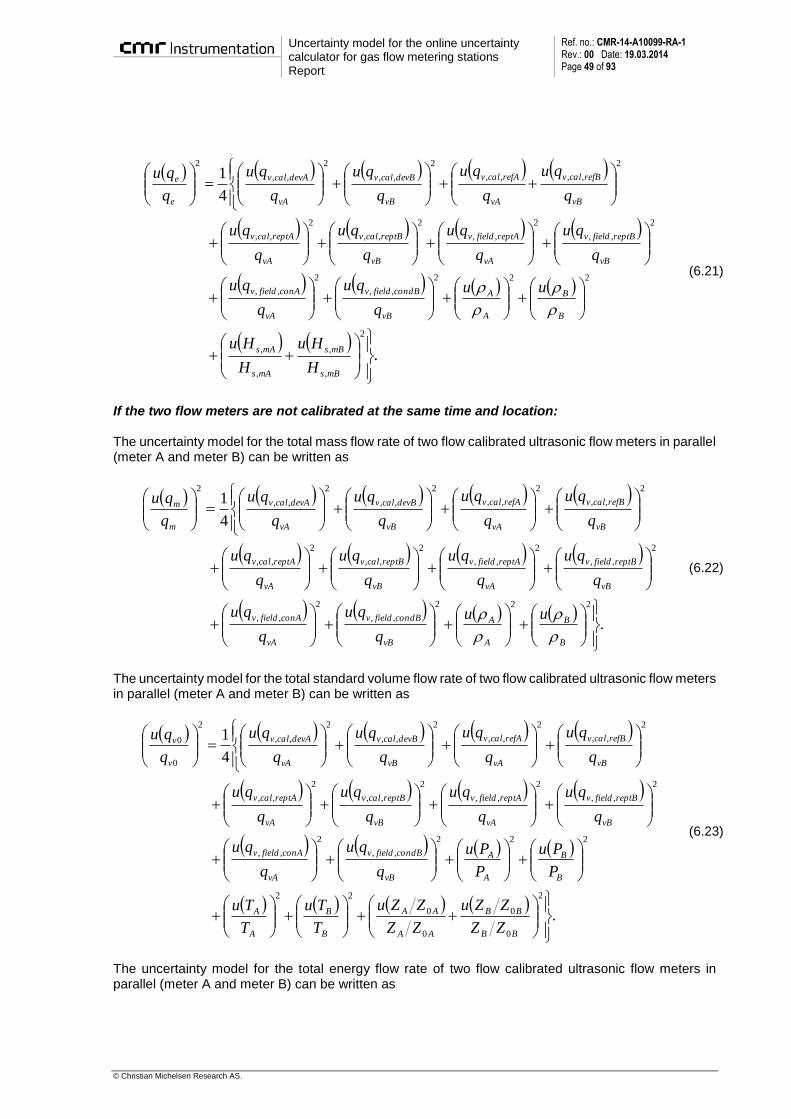
Uncertainty model for the online uncertainty calculator for gas flow metering stations Report
Ref. no.: CMR-14-A10099-RA-1 Rev.: 00 Date: 19.03.2014 Page 49 of 93
© Christian Michelsen Research AS.
.
4
1
2
,
,
,
,
222
,,
2
,,
2
,,
2
,,
2
,,
2
,,
2
,,,,
2
,,
2
,,
2
mBs
mBs
mAs
mAs
B
B
A
A
vB
condBfieldv
vA
conAfieldv
vB
reptBfieldv
vA
reptAfieldv
vB
reptBcalv
vA
reptAcalv
vB
refBcalv
vA
refAcalv
vB
devBcalv
vA
devAcalv
e
e
H
Hu
H
Hu
uu
q
qu
q
qu
q
qu
q
qu
q
qu
q
qu
q
qu
q
qu
q
qu
q
qu
q
qu
(6.21)
If the two flow meters are not calibrated at the same time and location: The uncertainty model for the total mass flow rate of two flow calibrated ultrasonic flow meters in parallel (meter A and meter B) can be written as
.
4
1
222
,,
2
,,
2
,,
2
,,
2
,,
2
,,
2
,,
2
,,
2
,,
2
,,
2
B
B
A
A
vB
condBfieldv
vA
conAfieldv
vB
reptBfieldv
vA
reptAfieldv
vB
reptBcalv
vA
reptAcalv
vB
refBcalv
vA
refAcalv
vB
devBcalv
vA
devAcalv
m
m
uu
q
qu
q
qu
q
qu
q
qu
q
qu
q
qu
q
qu
q
qu
q
qu
q
qu
q
qu
(6.22)
The uncertainty model for the total standard volume flow rate of two flow calibrated ultrasonic flow meters in parallel (meter A and meter B) can be written as
.
4
1
2
0
0
0
0
22
222
,,
2
,,
2
,,
2
,,
2
,,
2
,,
2
,,
2
,,
2
,,
2
,,
2
0
0
BB
BB
AA
AA
B
B
A
A
B
B
A
A
vB
condBfieldv
vA
conAfieldv
vB
reptBfieldv
vA
reptAfieldv
vB
reptBcalv
vA
reptAcalv
vB
refBcalv
vA
refAcalv
vB
devBcalv
vA
devAcalv
v
v
ZZ
ZZu
ZZ
ZZu
T
Tu
T
Tu
P
Pu
P
Pu
q
qu
q
qu
q
qu
q
qu
q
qu
q
qu
q
qu
q
qu
q
qu
q
qu
q
qu
(6.23)
The uncertainty model for the total energy flow rate of two flow calibrated ultrasonic flow meters in parallel (meter A and meter B) can be written as
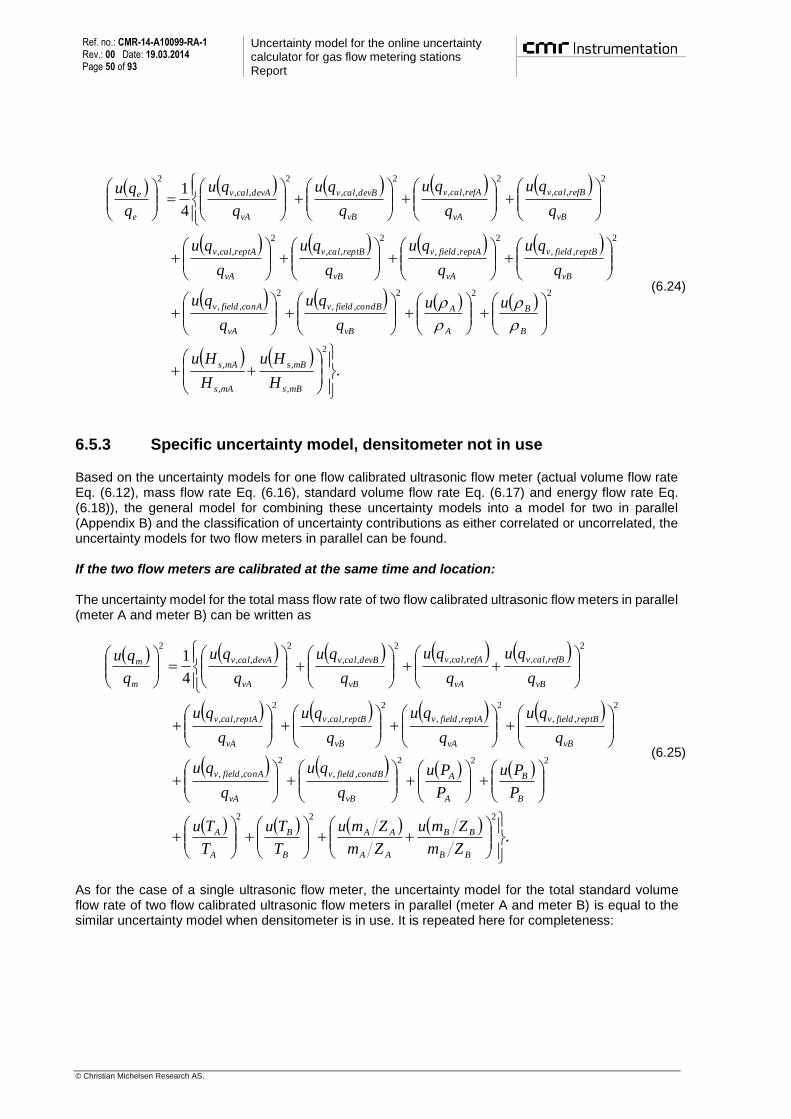
Ref. no.: CMR-14-A10099-RA-1 Rev.: 00 Date: 19.03.2014 Page 50 of 93
Uncertainty model for the online uncertainty calculator for gas flow metering stations Report
© Christian Michelsen Research AS.
.
4
1
2
,
,
,
,
222
,,
2
,,
2
,,
2
,,
2
,,
2
,,
2
,,
2
,,
2
,,
2
,,
2
mBs
mBs
mAs
mAs
B
B
A
A
vB
condBfieldv
vA
conAfieldv
vB
reptBfieldv
vA
reptAfieldv
vB
reptBcalv
vA
reptAcalv
vB
refBcalv
vA
refAcalv
vB
devBcalv
vA
devAcalv
e
e
H
Hu
H
Hu
uu
q
qu
q
qu
q
qu
q
qu
q
qu
q
qu
q
qu
q
qu
q
qu
q
qu
q
qu
(6.24)
6.5.3 Specific uncertainty model, densitometer not in use
Based on the uncertainty models for one flow calibrated ultrasonic flow meter (actual volume flow rate Eq. (6.12), mass flow rate Eq. (6.16), standard volume flow rate Eq. (6.17) and energy flow rate Eq. (6.18)), the general model for combining these uncertainty models into a model for two in parallel (Appendix B) and the classification of uncertainty contributions as either correlated or uncorrelated, the uncertainty models for two flow meters in parallel can be found. If the two flow meters are calibrated at the same time and location: The uncertainty model for the total mass flow rate of two flow calibrated ultrasonic flow meters in parallel (meter A and meter B) can be written as
.
4
1
222
222
,,
2
,,
2
,,
2
,,
2
,,
2
,,
2
,,,,
2
,,
2
,,
2
BB
BB
AA
AA
B
B
A
A
B
B
A
A
vB
condBfieldv
vA
conAfieldv
vB
reptBfieldv
vA
reptAfieldv
vB
reptBcalv
vA
reptAcalv
vB
refBcalv
vA
refAcalv
vB
devBcalv
vA
devAcalv
m
m
Zm
Zmu
Zm
Zmu
T
Tu
T
Tu
P
Pu
P
Pu
q
qu
q
qu
q
qu
q
qu
q
qu
q
qu
q
qu
q
qu
q
qu
q
qu
q
qu
(6.25)
As for the case of a single ultrasonic flow meter, the uncertainty model for the total standard volume flow rate of two flow calibrated ultrasonic flow meters in parallel (meter A and meter B) is equal to the similar uncertainty model when densitometer is in use. It is repeated here for completeness:

Uncertainty model for the online uncertainty calculator for gas flow metering stations Report
Ref. no.: CMR-14-A10099-RA-1 Rev.: 00 Date: 19.03.2014 Page 51 of 93
© Christian Michelsen Research AS.
.
4
1
2
0
0
0
0
22
222
,,
2
,,
2
,,
2
,,
2
,,
2
,,
2
,,,,
2
,,
2
,,
2
0
0
BB
BB
AA
AA
B
B
A
A
B
B
A
A
vB
condBfieldv
vA
conAfieldv
vB
reptBfieldv
vA
reptAfieldv
vB
reptBcalv
vA
reptAcalv
vB
refBcalv
vA
refAcalv
vB
devBcalv
vA
devAcalv
v
v
ZZ
ZZu
ZZ
ZZu
T
Tu
T
Tu
P
Pu
P
Pu
q
qu
q
qu
q
qu
q
qu
q
qu
q
qu
q
qu
q
qu
q
qu
q
qu
q
qu
(6.26)
The uncertainty model for the total energy flow rate of two flow calibrated ultrasonic flow meters in parallel (meter A and meter B) can be written as
.
4
1
2
,
,
,
,
22
222
,,
2
,,
2
,,
2
,,
2
,,
2
,,
2
,,,,
2
,,
2
,,
2
BBmBs
BBmBs
AAmAs
AAmAs
B
B
A
A
B
B
A
A
vB
condBfieldv
vA
conAfieldv
vB
reptBfieldv
vA
reptAfieldv
vB
reptBcalv
vA
reptAcalv
vB
refBcalv
vA
refAcalv
vB
devBcalv
vA
devAcalv
e
e
ZmH
ZmHu
ZmH
ZmHu
T
Tu
T
Tu
P
Pu
P
Pu
q
qu
q
qu
q
qu
q
qu
q
qu
q
qu
q
qu
q
qu
q
qu
q
qu
q
qu
(6.27)
If the two flow meters are not calibrated at the same time and location: The uncertainty model for the total mass flow rate of two flow calibrated ultrasonic flow meters in parallel (meter A and meter B) can be written as
.
4
1
222
222
,,
2
,,
2
,,
2
,,
2
,,
2
,,
2
,,
2
,,
2
,,
2
,,
2
BB
BB
AA
AA
B
B
A
A
B
B
A
A
vB
condBfieldv
vA
conAfieldv
vB
reptBfieldv
vA
reptAfieldv
vB
reptBcalv
vA
reptAcalv
vB
refBcalv
vA
refAcalv
vB
devBcalv
vA
devAcalv
m
m
Zm
Zmu
Zm
Zmu
T
Tu
T
Tu
P
Pu
P
Pu
q
qu
q
qu
q
qu
q
qu
q
qu
q
qu
q
qu
q
qu
q
qu
q
qu
q
qu
(6.28)
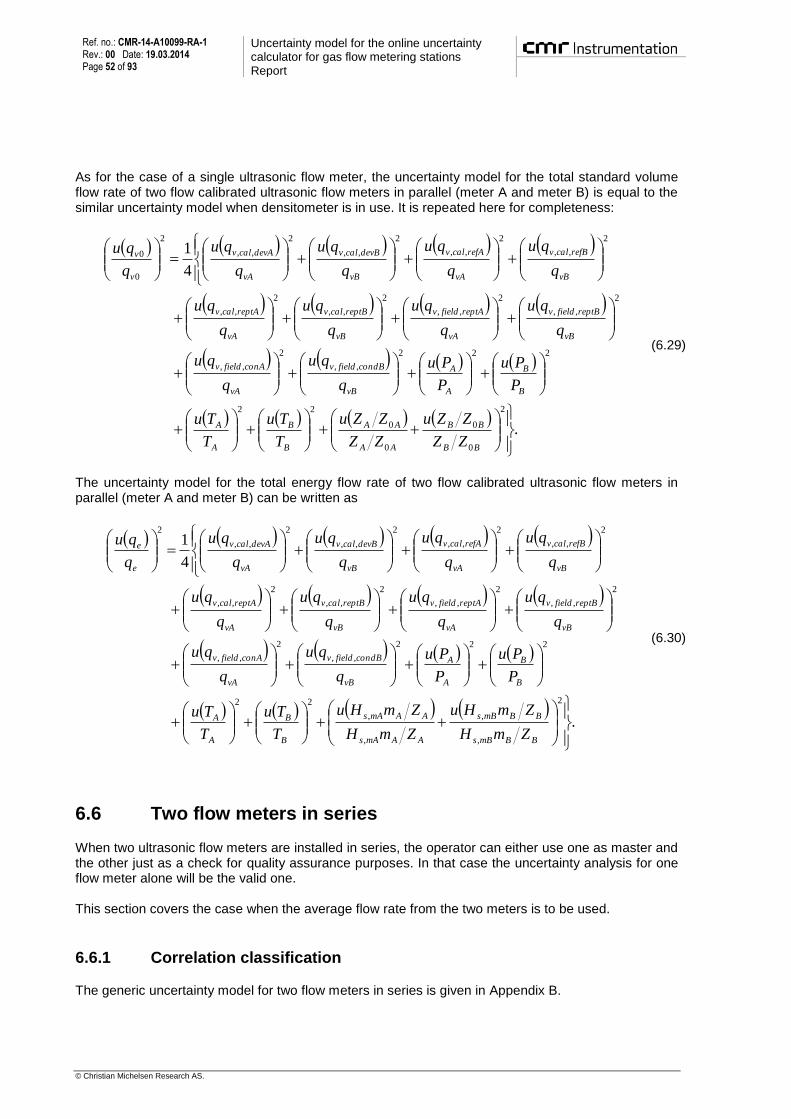
Ref. no.: CMR-14-A10099-RA-1 Rev.: 00 Date: 19.03.2014 Page 52 of 93
Uncertainty model for the online uncertainty calculator for gas flow metering stations Report
© Christian Michelsen Research AS.
As for the case of a single ultrasonic flow meter, the uncertainty model for the total standard volume flow rate of two flow calibrated ultrasonic flow meters in parallel (meter A and meter B) is equal to the similar uncertainty model when densitometer is in use. It is repeated here for completeness:
.
4
1
2
0
0
0
0
22
222
,,
2
,,
2
,,
2
,,
2
,,
2
,,
2
,,
2
,,
2
,,
2
,,
2
0
0
BB
BB
AA
AA
B
B
A
A
B
B
A
A
vB
condBfieldv
vA
conAfieldv
vB
reptBfieldv
vA
reptAfieldv
vB
reptBcalv
vA
reptAcalv
vB
refBcalv
vA
refAcalv
vB
devBcalv
vA
devAcalv
v
v
ZZ
ZZu
ZZ
ZZu
T
Tu
T
Tu
P
Pu
P
Pu
q
qu
q
qu
q
qu
q
qu
q
qu
q
qu
q
qu
q
qu
q
qu
q
qu
q
qu
(6.29)
The uncertainty model for the total energy flow rate of two flow calibrated ultrasonic flow meters in parallel (meter A and meter B) can be written as
.
4
1
2
,
,
,
,
22
222
,,
2
,,
2
,,
2
,,
2
,,
2
,,
2
,,
2
,,
2
,,
2
,,
2
BBmBs
BBmBs
AAmAs
AAmAs
B
B
A
A
B
B
A
A
vB
condBfieldv
vA
conAfieldv
vB
reptBfieldv
vA
reptAfieldv
vB
reptBcalv
vA
reptAcalv
vB
refBcalv
vA
refAcalv
vB
devBcalv
vA
devAcalv
e
e
ZmH
ZmHu
ZmH
ZmHu
T
Tu
T
Tu
P
Pu
P
Pu
q
qu
q
qu
q
qu
q
qu
q
qu
q
qu
q
qu
q
qu
q
qu
q
qu
q
qu
(6.30)
6.6 Two flow meters in series
When two ultrasonic flow meters are installed in series, the operator can either use one as master and the other just as a check for quality assurance purposes. In that case the uncertainty analysis for one flow meter alone will be the valid one. This section covers the case when the average flow rate from the two meters is to be used.
6.6.1 Correlation classification
The generic uncertainty model for two flow meters in series is given in Appendix B.

Uncertainty model for the online uncertainty calculator for gas flow metering stations Report
Ref. no.: CMR-14-A10099-RA-1 Rev.: 00 Date: 19.03.2014 Page 53 of 93
© Christian Michelsen Research AS.
Based on the results of the uncertainty model development in Section B 3, it is necessary to classify all uncertainty contributions as either correlated or uncorrelated between the two flow meters. The following assumptions and evaluations have been made in order to classify the correlations:
Calibration uncertainty o Uncertainty of the correction factor estimate (the adjustment after deviations between
flow meter and reference measurement at the flow laboratory are established): It is assumed that this uncertainty contribution in uncorrelated as each meter will have its own deviation curve, and possible errors due to linear interpolation in such a deviation curve are not likely to repeat between different meters.
o Uncertainty of the reference measurement at the flow laboratory: If the two flow meters are calibrated at the same time at the same location, it is likely that this uncertainty contribution is correlated, as the flow meters are compared to the same reference. In other cases it is likely that it is uncorrelated. In the uncertainty program it is possible to specify whether the flow meters are calibrated at the same time and location or not.
o Repeatability, including both the ultrasonic flow meter to be calibrated and the reference measurement: This represents random variations, and will thus be uncorrelated between the two flow meters.
Field uncertainty o Repeatability of the flow meter under field operation: this represents random variations,
and will thus be uncorrelated between the two flow meters. o Uncertainty due to changes of conditions from flow calibration to field operation: It is
here assumed that this is uncorrelated. This is because the flow conditions will never be identical due to different straight upstream length for the two meters, and also because the transducer ports of the upstream flow meter may affect the downstream flow meter. Therefore it is likely that they may be affected differently by changed conditions from calibration to field.
Gas parameters o Measured pressure: Each flow meter has its own pressure meter. It is therefore
assumed that this effect is uncorrelated. o Measured temperature: Each flow meter has its own temperature meter. It is therefore
assumed that this effect is uncorrelated. o Measured density: Each flow meter has its own densitometer. It is therefore assumed
that this effect is uncorrelated. o The uncertainty of the various fractions and products of molar mass, compressibilities
and/or calorific value: As it is assumed that the same gas composition is used for both flow meters, this parameter is correlated.
6.6.2 Specific uncertainty model, densitometer in use
Based on the uncertainty models for one flow calibrated ultrasonic flow meter (actual volume flow rate Eq. (6.12), mass flow rate Eq. (6.13), standard volume flow rate Eq. (6.14) and energy flow rate Eq. (6.15)), the general model for combining these uncertainty models into a model for the average flow rate measured by two ultrasonic flow meters in series (Section B 3) and the classification of uncertainty contributions as either correlated or uncorrelated, the uncertainty models for two flow meters in series can be found. If the two flow meters are calibrated at the same time and location: The uncertainty model for the average mass flow rate of two flow calibrated ultrasonic flow meters in series (meter A and meter B) can be written as

Ref. no.: CMR-14-A10099-RA-1 Rev.: 00 Date: 19.03.2014 Page 54 of 93
Uncertainty model for the online uncertainty calculator for gas flow metering stations Report
© Christian Michelsen Research AS.
.
4
1
222
,,
2
,,
2
,,
2
,,
2
,,
2
,,
2
,,,,
2
,,
2
,,
2
B
B
A
A
vB
condBfieldv
vA
conAfieldv
vB
reptBfieldv
vA
reptAfieldv
vB
reptBcalv
vA
reptAcalv
vB
refBcalv
vA
refAcalv
vB
devBcalv
vA
devAcalv
m
m
uu
q
qu
q
qu
q
qu
q
qu
q
qu
q
qu
q
qu
q
qu
q
qu
q
qu
q
qu
(6.31)
The uncertainty model for the average standard volume flow rate of two flow calibrated ultrasonic flow meters in series (meter A and meter B) can be written as
.
4
1
2
0
0
0
0
22
222
,,
2
,,
2
,,
2
,,
2
,,
2
,,
2
,,,,
2
,,
2
,,
2
0
0
BB
BB
AA
AA
B
B
A
A
B
B
A
A
vB
condBfieldv
vA
conAfieldv
vB
reptBfieldv
vA
reptAfieldv
vB
reptBcalv
vA
reptAcalv
vB
refBcalv
vA
refAcalv
vB
devBcalv
vA
devAcalv
v
v
ZZ
ZZu
ZZ
ZZu
T
Tu
T
Tu
P
Pu
P
Pu
q
qu
q
qu
q
qu
q
qu
q
qu
q
qu
q
qu
q
qu
q
qu
q
qu
q
qu
(6.32)
The uncertainty model for the average energy flow rate of two flow calibrated ultrasonic flow meters in series (meter A and meter B) can be written as
.
4
1
2
,
,
,
,
222
,,
2
,,
2
,,
2
,,
2
,,
2
,,
2
,,,,
2
,,
2
,,
2
mBs
mBs
mAs
mAs
B
B
A
A
vB
condBfieldv
vA
conAfieldv
vB
reptBfieldv
vA
reptAfieldv
vB
reptBcalv
vA
reptAcalv
vB
refBcalv
vA
refAcalv
vB
devBcalv
vA
devAcalv
e
e
H
Hu
H
Hu
uu
q
qu
q
qu
q
qu
q
qu
q
qu
q
qu
q
qu
q
qu
q
qu
q
qu
q
qu
(6.33)
If the two flow meters are not calibrated at the same time and location: The uncertainty model for the average mass flow rate of two flow calibrated ultrasonic flow meters in series (meter A and meter B) can be written as
Uncertainty model for the online uncertainty calculator for gas flow metering stations Report
Ref. no.: CMR-14-A10099-RA-1 Rev.: 00 Date: 19.03.2014 Page 55 of 93
© Christian Michelsen Research AS.
.
4
1
222
,,
2
,,
2
,,
2
,,
2
,,
2
,,
2
,,
2
,,
2
,,
2
,,
2
B
B
A
A
vB
condBfieldv
vA
conAfieldv
vB
reptBfieldv
vA
reptAfieldv
vB
reptBcalv
vA
reptAcalv
vB
refBcalv
vA
refAcalv
vB
devBcalv
vA
devAcalv
m
m
uu
q
qu
q
qu
q
qu
q
qu
q
qu
q
qu
q
qu
q
qu
q
qu
q
qu
q
qu
(6.34)
The uncertainty model for the average standard volume flow rate of two flow calibrated ultrasonic flow meters in series (meter A and meter B) can be written as
.
4
1
2
0
0
0
0
22
222
,,
2
,,
2
,,
2
,,
2
,,
2
,,
2
,,
2
,,
2
,,
2
,,
2
0
0
BB
BB
AA
AA
B
B
A
A
B
B
A
A
vB
condBfieldv
vA
conAfieldv
vB
reptBfieldv
vA
reptAfieldv
vB
reptBcalv
vA
reptAcalv
vB
refBcalv
vA
refAcalv
vB
devBcalv
vA
devAcalv
v
v
ZZ
ZZu
ZZ
ZZu
T
Tu
T
Tu
P
Pu
P
Pu
q
qu
q
qu
q
qu
q
qu
q
qu
q
qu
q
qu
q
qu
q
qu
q
qu
q
qu
(6.35)
The uncertainty model for the average energy flow rate of two flow calibrated ultrasonic flow meters in series (meter A and meter B) can be written as
.
4
1
2
,
,
,
,
222
,,
2
,,
2
,,
2
,,
2
,,
2
,,
2
,,
2
,,
2
,,
2
,,
2
mBs
mBs
mAs
mAs
B
B
A
A
vB
condBfieldv
vA
conAfieldv
vB
reptBfieldv
vA
reptAfieldv
vB
reptBcalv
vA
reptAcalv
vB
refBcalv
vA
refAcalv
vB
devBcalv
vA
devAcalv
e
e
H
Hu
H
Hu
uu
q
qu
q
qu
q
qu
q
qu
q
qu
q
qu
q
qu
q
qu
q
qu
q
qu
q
qu
(6.36)
6.6.3 Specific uncertainty model, densitometer not in use
Based on the uncertainty models for one flow calibrated ultrasonic flow meter (actual volume flow rate Eq. (6.12), mass flow rate Eq. (6.16), standard volume flow rate Eq. (6.17) and energy flow rate Eq. (6.18)), the general model for combining these uncertainty models into a model for the average flow rate measured by two ultrasonic flow meters in series (Appendix B) and the classification of uncertainty

Ref. no.: CMR-14-A10099-RA-1 Rev.: 00 Date: 19.03.2014 Page 56 of 93
Uncertainty model for the online uncertainty calculator for gas flow metering stations Report
© Christian Michelsen Research AS.
contributions as either correlated or uncorrelated, the uncertainty models for two flow meters in parallel can be found. If the two flow meters are calibrated at the same time and location: The uncertainty model for the average mass flow rate of two flow calibrated ultrasonic flow meters in series (meter A and meter B) can be written as
.
4
1
222
222
,,
2
,,
2
,,
2
,,
2
,,
2
,,
2
,,,,
2
,,
2
,,
2
BB
BB
AA
AA
B
B
A
A
B
B
A
A
vB
condBfieldv
vA
conAfieldv
vB
reptBfieldv
vA
reptAfieldv
vB
reptBcalv
vA
reptAcalv
vB
refBcalv
vA
refAcalv
vB
devBcalv
vA
devAcalv
m
m
Zm
Zmu
Zm
Zmu
T
Tu
T
Tu
P
Pu
P
Pu
q
qu
q
qu
q
qu
q
qu
q
qu
q
qu
q
qu
q
qu
q
qu
q
qu
q
qu
(6.37)
As for the case of a single ultrasonic flow meter and two ultrasonic flow meters in parallel, the uncertainty model for the average standard volume flow rate of two flow calibrated ultrasonic flow meters in series (meter A and meter B) is equal to the similar uncertainty model when densitometer is in use. It is repeated here for completeness:
.
4
1
2
0
0
0
0
22
222
,,
2
,,
2
,,
2
,,
2
,,
2
,,
2
,,,,
2
,,
2
,,
2
0
0
BB
BB
AA
AA
B
B
A
A
B
B
A
A
vB
condBfieldv
vA
conAfieldv
vB
reptBfieldv
vA
reptAfieldv
vB
reptBcalv
vA
reptAcalv
vB
refBcalv
vA
refAcalv
vB
devBcalv
vA
devAcalv
v
v
ZZ
ZZu
ZZ
ZZu
T
Tu
T
Tu
P
Pu
P
Pu
q
qu
q
qu
q
qu
q
qu
q
qu
q
qu
q
qu
q
qu
q
qu
q
qu
q
qu
(6.38)
The uncertainty model for the average energy flow rate of two flow calibrated ultrasonic flow meters in series (meter A and meter B) can be written as
Uncertainty model for the online uncertainty calculator for gas flow metering stations Report
Ref. no.: CMR-14-A10099-RA-1 Rev.: 00 Date: 19.03.2014 Page 57 of 93
© Christian Michelsen Research AS.
.
4
1
2
,
,
,
,
22
222
,,
2
,,
2
,,
2
,,
2
,,
2
,,
2
,,,,
2
,,
2
,,
2
BBmBs
BBmBs
AAmAs
AAmAs
B
B
A
A
B
B
A
A
vB
condBfieldv
vA
conAfieldv
vB
reptBfieldv
vA
reptAfieldv
vB
reptBcalv
vA
reptAcalv
vB
refBcalv
vA
refAcalv
vB
devBcalv
vA
devAcalv
e
e
ZmH
ZmHu
ZmH
ZmHu
T
Tu
T
Tu
P
Pu
P
Pu
q
qu
q
qu
q
qu
q
qu
q
qu
q
qu
q
qu
q
qu
q
qu
q
qu
q
qu
(6.39)
If the two flow meters are not calibrated at the same time and location: The uncertainty model for the average mass flow rate of two flow calibrated ultrasonic flow meters in series (meter A and meter B) can be written as
.
4
1
222
222
,,
2
,,
2
,,
2
,,
2
,,
2
,,
2
,,
2
,,
2
,,
2
,,
2
BB
BB
AA
AA
B
B
A
A
B
B
A
A
vB
condBfieldv
vA
conAfieldv
vB
reptBfieldv
vA
reptAfieldv
vB
reptBcalv
vA
reptAcalv
vB
refBcalv
vA
refAcalv
vB
devBcalv
vA
devAcalv
m
m
Zm
Zmu
Zm
Zmu
T
Tu
T
Tu
P
Pu
P
Pu
q
qu
q
qu
q
qu
q
qu
q
qu
q
qu
q
qu
q
qu
q
qu
q
qu
q
qu
(6.40)
As for the case of a single ultrasonic flow meter and two ultrasonic flow meters in parallel, the uncertainty model for the average standard volume flow rate of two flow calibrated ultrasonic flow meters in series (meter A and meter B) is equal to the similar uncertainty model when densitometer is in use. It is repeated here for completeness:
.
4
1
2
0
0
0
0
22
222
,,
2
,,
2
,,
2
,,
2
,,
2
,,
2
,,
2
,,
2
,,
2
,,
2
0
0
BB
BB
AA
AA
B
B
A
A
B
B
A
A
vB
condBfieldv
vA
conAfieldv
vB
reptBfieldv
vA
reptAfieldv
vB
reptBcalv
vA
reptAcalv
vB
refBcalv
vA
refAcalv
vB
devBcalv
vA
devAcalv
v
v
ZZ
ZZu
ZZ
ZZu
T
Tu
T
Tu
P
Pu
P
Pu
q
qu
q
qu
q
qu
q
qu
q
qu
q
qu
q
qu
q
qu
q
qu
q
qu
q
qu
(6.41)

Ref. no.: CMR-14-A10099-RA-1 Rev.: 00 Date: 19.03.2014 Page 58 of 93
Uncertainty model for the online uncertainty calculator for gas flow metering stations Report
© Christian Michelsen Research AS.
The uncertainty model for the average energy flow rate of two flow calibrated ultrasonic flow meters in series (meter A and meter B) can be written as
.
4
1
2
,
,
,
,
22
222
,,
2
,,
2
,,
2
,,
2
,,
2
,,
2
,,
2
,,
2
,,
2
,,
2
BBmBs
BBmBs
AAmAs
AAmAs
B
B
A
A
B
B
A
A
vB
condBfieldv
vA
conAfieldv
vB
reptBfieldv
vA
reptAfieldv
vB
reptBcalv
vA
reptAcalv
vB
refBcalv
vA
refAcalv
vB
devBcalv
vA
devAcalv
e
e
ZmH
ZmHu
ZmH
ZmHu
T
Tu
T
Tu
P
Pu
P
Pu
q
qu
q
qu
q
qu
q
qu
q
qu
q
qu
q
qu
q
qu
q
qu
q
qu
q
qu
(6.42)

Uncertainty model for the online uncertainty calculator for gas flow metering stations Report
Ref. no.: CMR-14-A10099-RA-1 Rev.: 00 Date: 19.03.2014 Page 59 of 93
© Christian Michelsen Research AS.
7 Program
This Chapter documents the web-based computer program for carrying out uncertainty analyses based on the uncertainty models described in this report. It should here be emphasised that this report is a documentation of the uncertainty models and the corresponding web-based calculation tool. Therefore the example input values in that calculation tool are just examples, and should not be regarded as recommended values by NFOGM, CMR, NPD or any other party.
7.1 Software platform
The «Gasmetering» application is implemented in the “Microsoft Silverlight 5” framework, a subset of “Microsoft .Net” that can be installed in a web browser. This framework facilitates running applications with rich functionality in the web browser, without need for installation and with high security. When the user visits a web page the complete application will be downloaded and run securely without need for any further communication with the web server. The application is stored in the web browser cache and will only be downloaded again if there is a new version available. The choice of Silverlight was based on the available implementation language (C#) and reuse of existing source code base. It could be feasible to implement the application on other platforms in the future. Microsoft Silverlight 5 is available for Windows and Mac OSX, and will be supported and updated at least until October 2021 (for detailed support lifecycle policy, see http://support.microsoft.com/gp/lifean45).
7.2 Installation and use
The web address for the application will be published on http://NFOGM.no. By visiting the published address the complete application will be downloaded and run. The download is about 1 MB and will only be downloaded again if there is a newer version available. If the client PC does not have “Microsoft Silverlight 5” framework installed, the user will be redirected to a web page on Microsoft.com that offers to install Silverlight on the client machine. This is a less than 7 MB download and should install in a couple of seconds.
7.3 Program overview
The “Gasmetering” application uses input consisting of
Metering station template (the general type of instruments and layout of these)
Process conditions, including the actual gas composition
Properties for the different equipment included in the template
From this input the application then can
1. Compute and visualize the resulting uncertainty in flow measurement values 2. Compute additional relevant properties of the gas composition and process conditions 3. Generate a report and print the report 4. Save work in a file for future use and reference

Ref. no.: CMR-14-A10099-RA-1 Rev.: 00 Date: 19.03.2014 Page 60 of 93
Uncertainty model for the online uncertainty calculator for gas flow metering stations Report
© Christian Michelsen Research AS.
The following sections describe the functionality in more detail and uses screenshots from the application to illustrate.
7.3.1 Specify metering station template
The start page of the application (Figure 7.1) is also the page where the user specifies the metering station template, meaning the general type of instruments and the layout of these. There are three aspects of the metering station that is modeled:
Flow Metering: what type of meter is used (Orifice, Ultrasonic or Coriolis) and in what
configuration (Single Meter, Dual Meter in Series or Dual Meter in Parallel).
Line Conditions: what configuration of sensors is used to measure the line temperature, line
pressure and optionally for some templates, line density.
Gas Analysis: how is the gas composition known (by using a Fixed Composition, by Online
GC or by Sampling).
By specifying choices for each of these aspects the user is in effect selecting a metering station template. When the user then presses the “Accept and Continue”-button a copy of the selected template is created and the application moves to the first of several input pages, “Conditions” (Figure 7.3). A page navigation menu below the application header is also displayed, where the user now can move freely between different pages (Figure 7.4), some related to input and others related to computed results and visualizations. The pages typically organize content in several sections, and the user can select a section with some form of navigation control. The selected metering station template is set up with default values, so the user can explore the application functionality without first finish all the data input. The following pages are available after the metering station template has been selected:
Metering Station: start page where the selected template is displayed. The user can also
create a new or open an existing from a file.
Conditions: input regarding flow rate, line conditions and also known gas composition.
Gas Analysis: input regarding uncertainty in known gas composition.
Flow Measurement: input regarding uncertainty in instrumentation and other facilities used
for flow measurement (for example flow calibration).
Results: computed uncertainty of the main flow measurement variables (standard volume
flow, mass flow and energy flow) displayed as uncertainty budgets tables.
Charts: computed uncertainty of the main flow measurement variables (standard volume flow,
mass flow and energy flow) and some other essential equipment, displayed as uncertainty
budgets charts.
Plots: computed uncertainty of the main flow measurement variables (standard volume flow,
mass flow and energy flow) as function of a selected flow rate range, displayed as plots.
Report: summary of the uncertainty analysis formatted as an on-screen report. This can be
printed and it is also possible to save the analysis in an encrypted file for later use and
reference.
The user can move between the input pages in any order, but due to computational dependencies the following work flow is recommended when input data: “Conditions”->”Gas Analysis”->”Flow Measurement”. Also, the logical flow between sections in each page is typically from left to right. Regarding metering station template, note that when specifying dual flow meters in series or parallel (Figure 7.2), there will be an option to select whether the laboratory flow calibration is performed on both
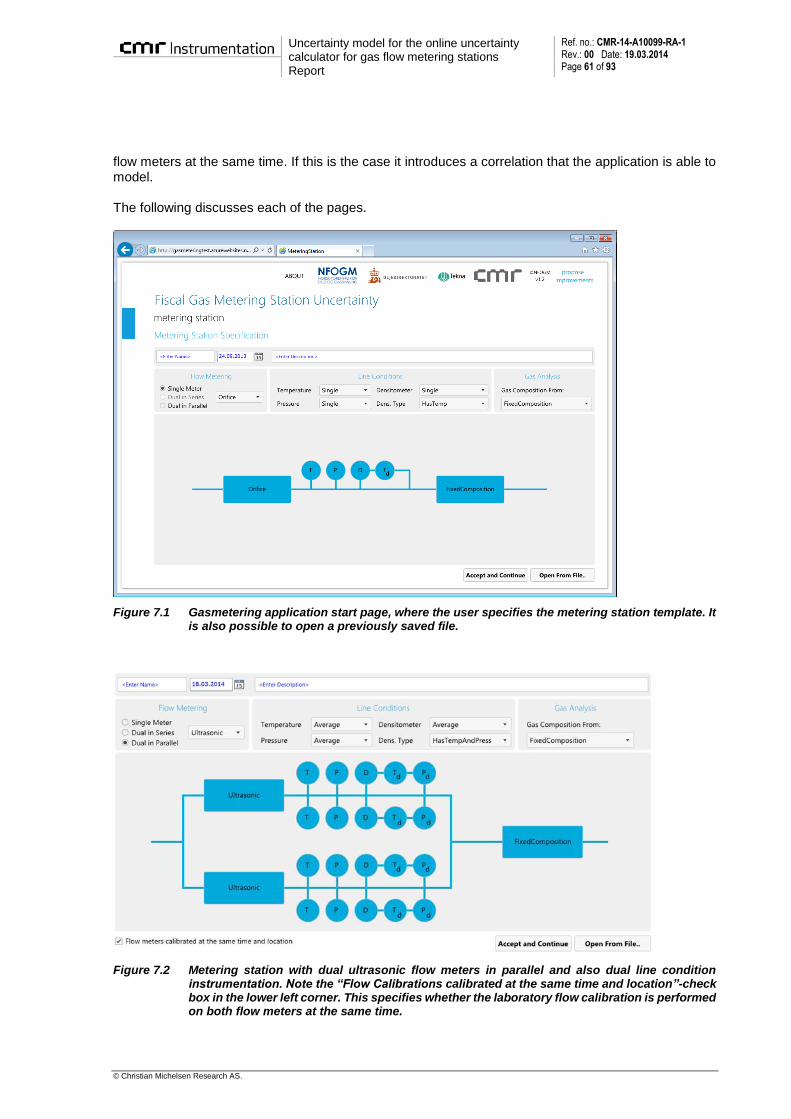
Uncertainty model for the online uncertainty calculator for gas flow metering stations Report
Ref. no.: CMR-14-A10099-RA-1 Rev.: 00 Date: 19.03.2014 Page 61 of 93
© Christian Michelsen Research AS.
flow meters at the same time. If this is the case it introduces a correlation that the application is able to model. The following discusses each of the pages.
Figure 7.1 Gasmetering application start page, where the user specifies the metering station template. It is also possible to open a previously saved file.
Figure 7.2 Metering station with dual ultrasonic flow meters in parallel and also dual line condition instrumentation. Note the “Flow Calibrations calibrated at the same time and location”-check box in the lower left corner. This specifies whether the laboratory flow calibration is performed on both flow meters at the same time.
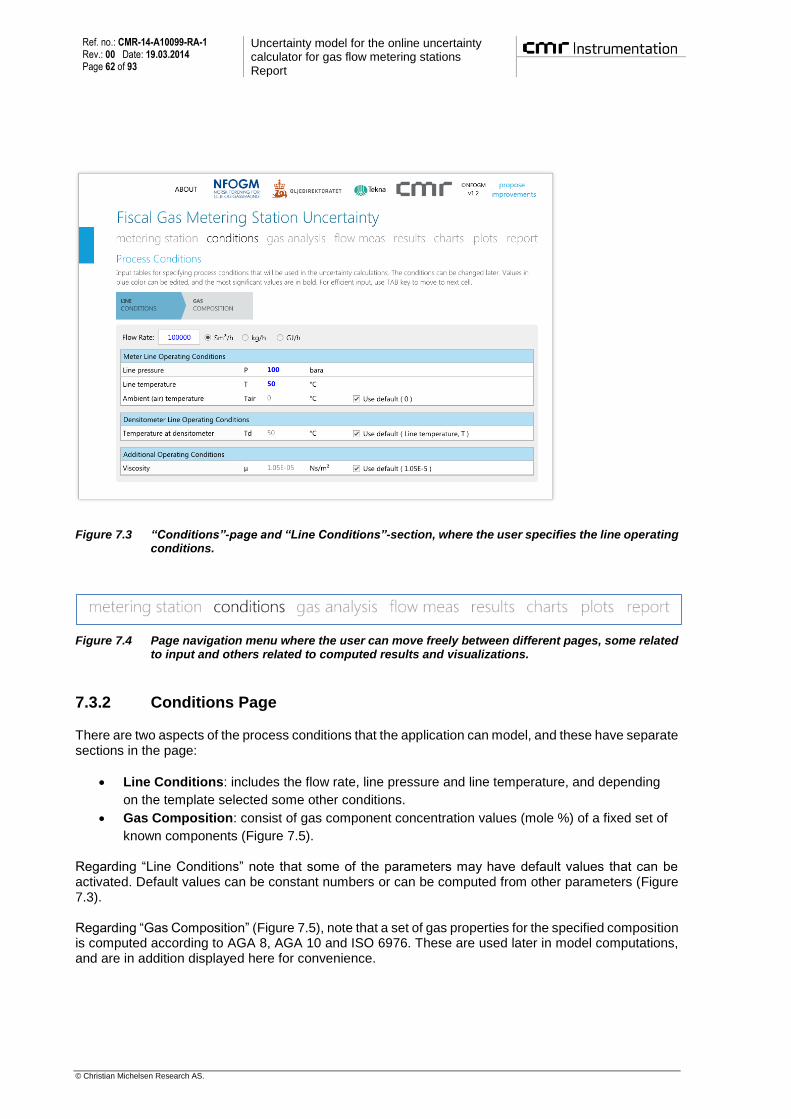
Ref. no.: CMR-14-A10099-RA-1 Rev.: 00 Date: 19.03.2014 Page 62 of 93
Uncertainty model for the online uncertainty calculator for gas flow metering stations Report
© Christian Michelsen Research AS.
Figure 7.3 “Conditions”-page and “Line Conditions”-section, where the user specifies the line operating conditions.
Figure 7.4 Page navigation menu where the user can move freely between different pages, some related to input and others related to computed results and visualizations.
7.3.2 Conditions Page
There are two aspects of the process conditions that the application can model, and these have separate sections in the page:
Line Conditions: includes the flow rate, line pressure and line temperature, and depending
on the template selected some other conditions.
Gas Composition: consist of gas component concentration values (mole %) of a fixed set of
known components (Figure 7.5).
Regarding “Line Conditions” note that some of the parameters may have default values that can be activated. Default values can be constant numbers or can be computed from other parameters (Figure 7.3). Regarding “Gas Composition” (Figure 7.5), note that a set of gas properties for the specified composition is computed according to AGA 8, AGA 10 and ISO 6976. These are used later in model computations, and are in addition displayed here for convenience.
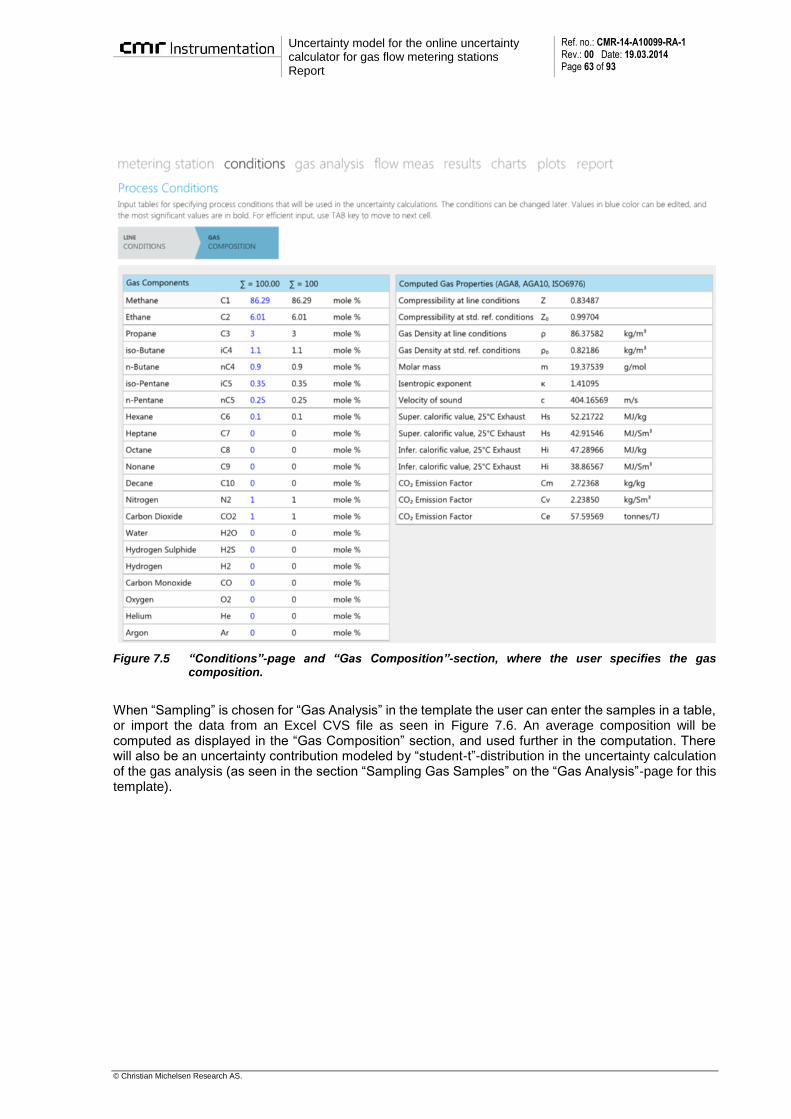
Uncertainty model for the online uncertainty calculator for gas flow metering stations Report
Ref. no.: CMR-14-A10099-RA-1 Rev.: 00 Date: 19.03.2014 Page 63 of 93
© Christian Michelsen Research AS.
Figure 7.5 “Conditions”-page and “Gas Composition”-section, where the user specifies the gas composition.
When “Sampling” is chosen for “Gas Analysis” in the template the user can enter the samples in a table, or import the data from an Excel CVS file as seen in Figure 7.6. An average composition will be computed as displayed in the “Gas Composition” section, and used further in the computation. There will also be an uncertainty contribution modeled by “student-t”-distribution in the uncertainty calculation of the gas analysis (as seen in the section “Sampling Gas Samples” on the “Gas Analysis”-page for this template).
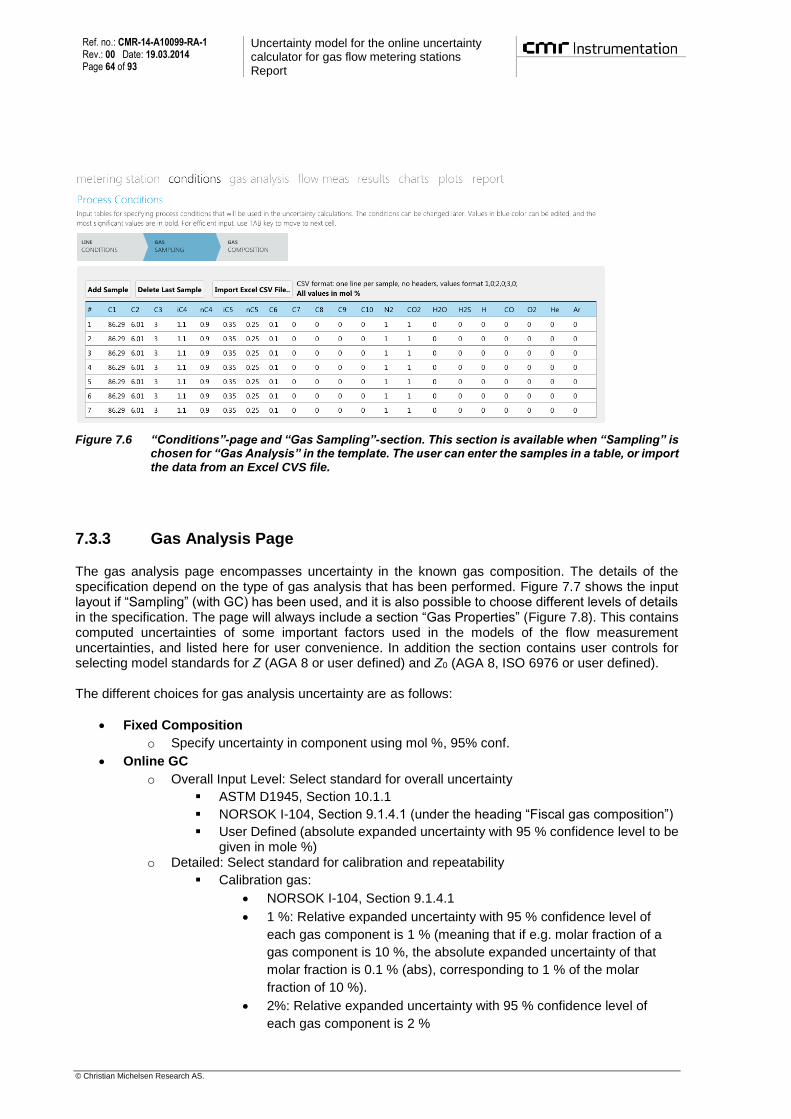
Ref. no.: CMR-14-A10099-RA-1 Rev.: 00 Date: 19.03.2014 Page 64 of 93
Uncertainty model for the online uncertainty calculator for gas flow metering stations Report
© Christian Michelsen Research AS.
Figure 7.6 “Conditions”-page and “Gas Sampling”-section. This section is available when “Sampling” is chosen for “Gas Analysis” in the template. The user can enter the samples in a table, or import the data from an Excel CVS file.
7.3.3 Gas Analysis Page
The gas analysis page encompasses uncertainty in the known gas composition. The details of the specification depend on the type of gas analysis that has been performed. Figure 7.7 shows the input layout if “Sampling” (with GC) has been used, and it is also possible to choose different levels of details in the specification. The page will always include a section “Gas Properties” (Figure 7.8). This contains computed uncertainties of some important factors used in the models of the flow measurement uncertainties, and listed here for user convenience. In addition the section contains user controls for selecting model standards for Z (AGA 8 or user defined) and Z0 (AGA 8, ISO 6976 or user defined). The different choices for gas analysis uncertainty are as follows:
Fixed Composition
o Specify uncertainty in component using mol %, 95% conf.
Online GC
o Overall Input Level: Select standard for overall uncertainty
ASTM D1945, Section 10.1.1
NORSOK I-104, Section 9.1.4.1 (under the heading “Fiscal gas composition”)
User Defined (absolute expanded uncertainty with 95 % confidence level to be given in mole %)
o Detailed: Select standard for calibration and repeatability
Calibration gas:
NORSOK I-104, Section 9.1.4.1
1 %: Relative expanded uncertainty with 95 % confidence level of
each gas component is 1 % (meaning that if e.g. molar fraction of a
gas component is 10 %, the absolute expanded uncertainty of that
molar fraction is 0.1 % (abs), corresponding to 1 % of the molar
fraction of 10 %).
2%: Relative expanded uncertainty with 95 % confidence level of
each gas component is 2 %

Uncertainty model for the online uncertainty calculator for gas flow metering stations Report
Ref. no.: CMR-14-A10099-RA-1 Rev.: 00 Date: 19.03.2014 Page 65 of 93
© Christian Michelsen Research AS.
User Defined (absolute expanded uncertainty with 95 % confidence
level to be given in mole %)
Repeatability:
NORSOK I-104, Section 9.1.4.1
User Defined (absolute expanded uncertainty with 95 % confidence
level to be given in mole %)
Linearity:
User Defined (absolute expanded uncertainty with 95 % confidence
level to be given in mole %)
Sampling
o GC analysis
Overall Input Level: Select standard for overall uncertainty
ASTM D1945, Section 10.1.1
NORSOK I-104, Section 9.1.4.1 (under the heading “Fiscal gas
composition”)
User Defined (absolute expanded uncertainty with 95 % confidence level to be given in mole %)
Detailed: Select standard for calibration and repeatability
Calibration gas:
o NORSOK I-104, Section 9.1.4.1
o 1 %: Relative expanded uncertainty with 95 % confidence
level of each gas component is 1 % (meaning that if e.g.
molar fraction of a gas component is 10 %, the absolute
expanded uncertainty of that molar fraction is 0.1 % (abs),
corresponding to 1 % of the molar fraction of 10 %).
o 2%: Relative expanded uncertainty with 95 % confidence
level of each gas component is 2 %
o User Defined (absolute expanded uncertainty with 95 %
confidence level to be given in mole %)
Repeatability:
o NORSOK I-104, Section 9.1.4.1
o User Defined (absolute expanded uncertainty with 95 %
confidence level to be given in mole %)
Linearity:
o User Defined (absolute expanded uncertainty with 95 %
confidence level to be given in mole %)

Ref. no.: CMR-14-A10099-RA-1 Rev.: 00 Date: 19.03.2014 Page 66 of 93
Uncertainty model for the online uncertainty calculator for gas flow metering stations Report
© Christian Michelsen Research AS.
Figure 7.7 Input of uncertainties for gas analysis when “sampling” (with GC) is selected.

Uncertainty model for the online uncertainty calculator for gas flow metering stations Report
Ref. no.: CMR-14-A10099-RA-1 Rev.: 00 Date: 19.03.2014 Page 67 of 93
© Christian Michelsen Research AS.
Figure 7.8 Computed uncertainties of some important factors used in the models of the flow measurement uncertainties. In addition the section contains user controls for selecting model standards for Z and Z0.
7.3.4 Flow Measurement Page
The flow measurement page encompasses specification of uncertainty in instruments and other facilities used for flow measurement (Figure 7.9). Simple instruments like a temperature transmitter has one section for uncertainty specification, but more complex instruments like an orifice flow meter have several sections (as can be seen in Figure 7.9). Some instruments also include flow calibration data (Figure 7.10). Note that it can be selected how the meter is adjusted for the calibration curve, as described in Appendix A. Depending on the equipment there can be functionality for using values from different standard specifications, as shown in Figure 7.9 where the user can select “ISO 5167 Specification” for the uncertainty in the orifice meter pipe diameter. An overall level can also be selected as the total uncertainty may depend on design, operational and maintenance routines designed to keep measurements within a given maximum uncertainty. The uncertainty requirements in the Norwegian measurement regulations has been pre entered as default values. There can also be functionality for storing frequently used specifications in files for later retrieval, as shown in Figure 7.11 where the detailed input for a temperature transmitter is shown. The “Save”-button can be used to save the complete specification to a file, and the “Load”-button can then later be used for quickly loading the saved specification for a temperature transmitter.
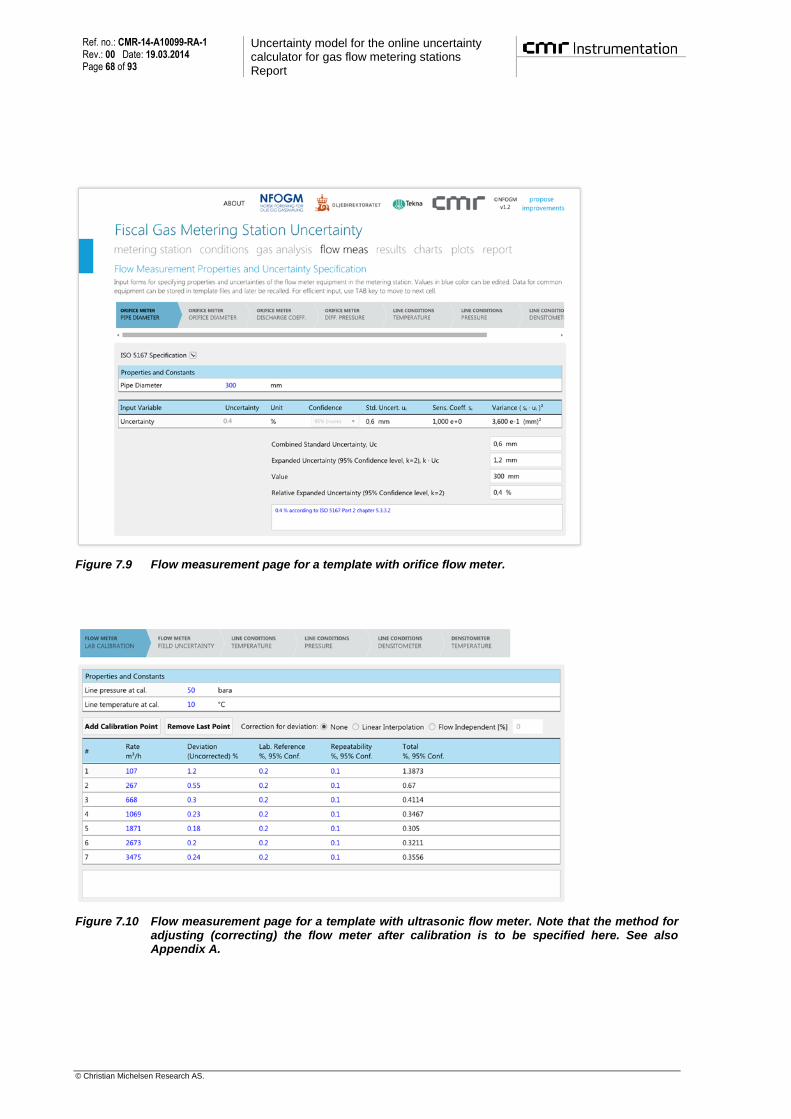
Ref. no.: CMR-14-A10099-RA-1 Rev.: 00 Date: 19.03.2014 Page 68 of 93
Uncertainty model for the online uncertainty calculator for gas flow metering stations Report
© Christian Michelsen Research AS.
Figure 7.9 Flow measurement page for a template with orifice flow meter.
Figure 7.10 Flow measurement page for a template with ultrasonic flow meter. Note that the method for adjusting (correcting) the flow meter after calibration is to be specified here. See also Appendix A.

Uncertainty model for the online uncertainty calculator for gas flow metering stations Report
Ref. no.: CMR-14-A10099-RA-1 Rev.: 00 Date: 19.03.2014 Page 69 of 93
© Christian Michelsen Research AS.
Figure 7.11 Detailed input for a temperature transmitter. The “Save”-button can be used to save the complete specification to a file, and the “Load”-button can then later be used for quickly loading the saved specification.
7.3.5 Uncertainty Calculation Results Page
This page is the first of several pages that displays the result of the uncertainty calculation based on the input data (Figure 7.12). There is one section for each of the main flow measurement variables, standard volume flow, mass flow and energy flow. Depending on template there can be sections for additional measurements. For example if the template included ultrasonic flow meter together with using GC for gas analysis, there is a section for the density measurement. The uncertainty is displayed as uncertainty budgets tables, and the functional relationship is displayed for reference. Depending on the selected metering template, there can also be a list of “computed values”. These are values computed from the input data for use in the uncertainty calculation and listed here for convenience.

Ref. no.: CMR-14-A10099-RA-1 Rev.: 00 Date: 19.03.2014 Page 70 of 93
Uncertainty model for the online uncertainty calculator for gas flow metering stations Report
© Christian Michelsen Research AS.
Figure 7.12 Computed uncertainty of the main flow measurement variables (standard volume flow, mass flow and energy flow) displayed as uncertainty budgets tables.
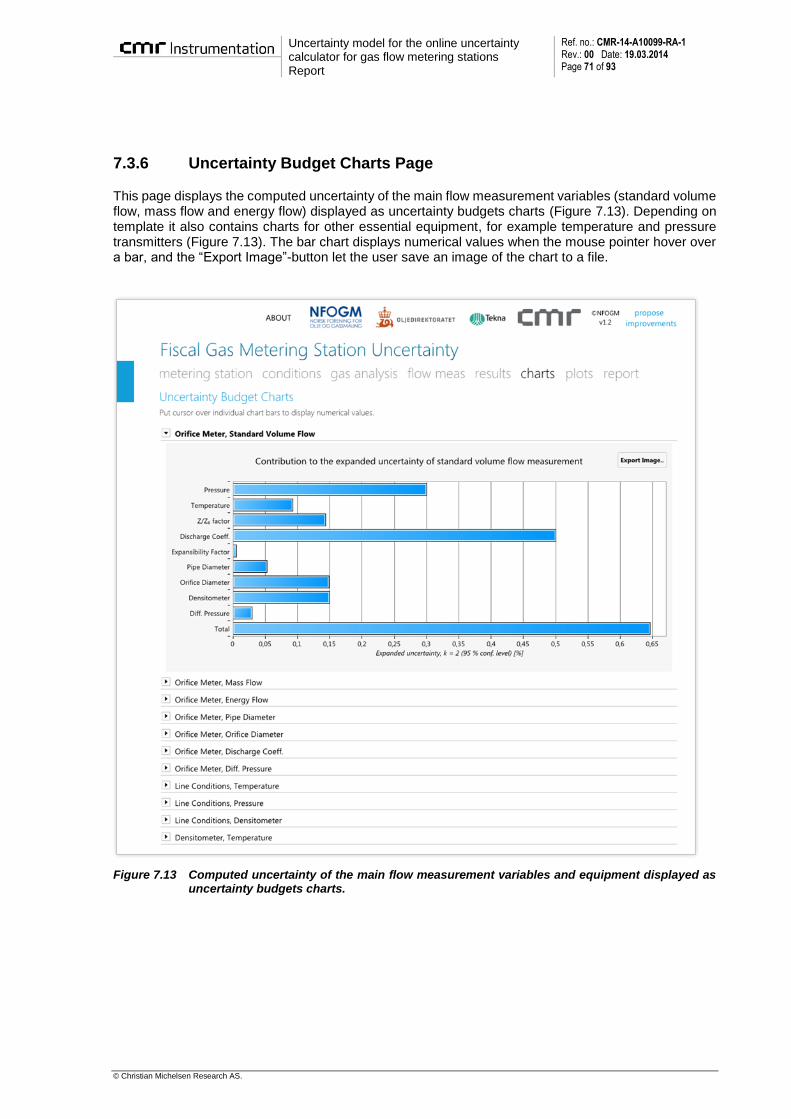
Uncertainty model for the online uncertainty calculator for gas flow metering stations Report
Ref. no.: CMR-14-A10099-RA-1 Rev.: 00 Date: 19.03.2014 Page 71 of 93
© Christian Michelsen Research AS.
7.3.6 Uncertainty Budget Charts Page
This page displays the computed uncertainty of the main flow measurement variables (standard volume flow, mass flow and energy flow) displayed as uncertainty budgets charts (Figure 7.13). Depending on template it also contains charts for other essential equipment, for example temperature and pressure transmitters (Figure 7.13). The bar chart displays numerical values when the mouse pointer hover over a bar, and the “Export Image”-button let the user save an image of the chart to a file.
Figure 7.13 Computed uncertainty of the main flow measurement variables and equipment displayed as uncertainty budgets charts.
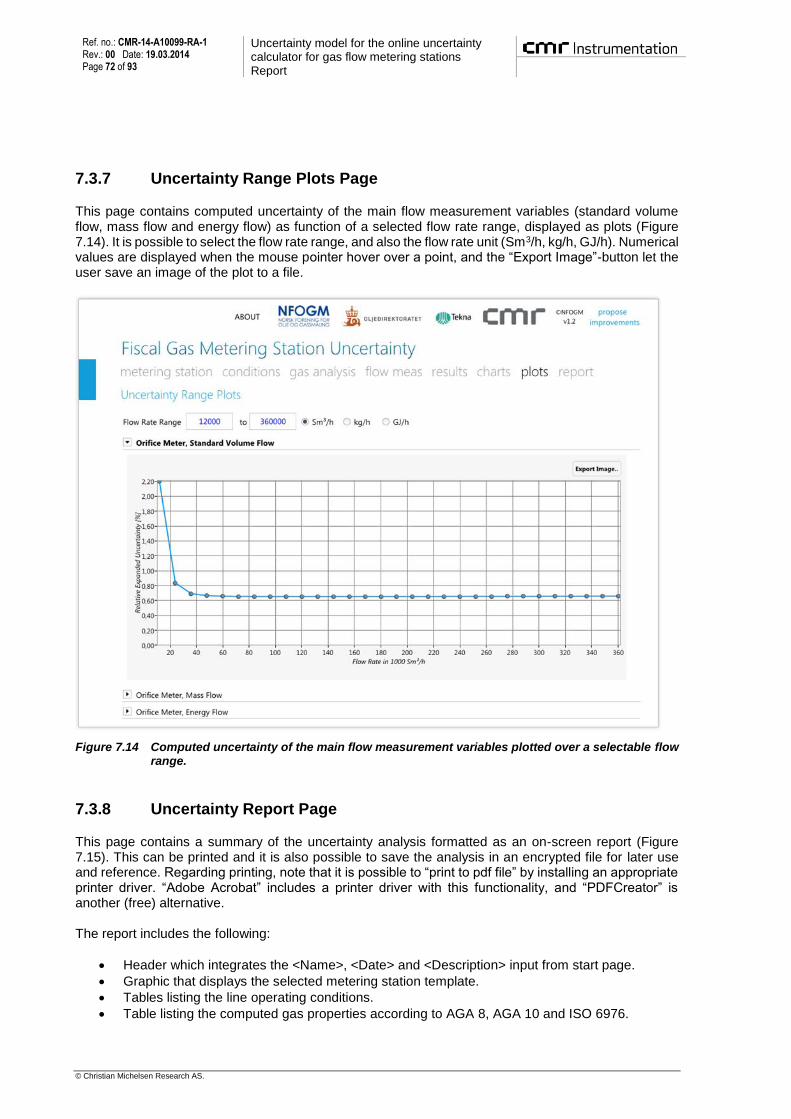
Ref. no.: CMR-14-A10099-RA-1 Rev.: 00 Date: 19.03.2014 Page 72 of 93
Uncertainty model for the online uncertainty calculator for gas flow metering stations Report
© Christian Michelsen Research AS.
7.3.7 Uncertainty Range Plots Page
This page contains computed uncertainty of the main flow measurement variables (standard volume flow, mass flow and energy flow) as function of a selected flow rate range, displayed as plots (Figure 7.14). It is possible to select the flow rate range, and also the flow rate unit (Sm3/h, kg/h, GJ/h). Numerical values are displayed when the mouse pointer hover over a point, and the “Export Image”-button let the user save an image of the plot to a file.
Figure 7.14 Computed uncertainty of the main flow measurement variables plotted over a selectable flow range.
7.3.8 Uncertainty Report Page
This page contains a summary of the uncertainty analysis formatted as an on-screen report (Figure 7.15). This can be printed and it is also possible to save the analysis in an encrypted file for later use and reference. Regarding printing, note that it is possible to “print to pdf file” by installing an appropriate printer driver. “Adobe Acrobat” includes a printer driver with this functionality, and “PDFCreator” is another (free) alternative. The report includes the following:
Header which integrates the <Name>, <Date> and <Description> input from start page.
Graphic that displays the selected metering station template.
Tables listing the line operating conditions.
Table listing the computed gas properties according to AGA 8, AGA 10 and ISO 6976.

Uncertainty model for the online uncertainty calculator for gas flow metering stations Report
Ref. no.: CMR-14-A10099-RA-1 Rev.: 00 Date: 19.03.2014 Page 73 of 93
© Christian Michelsen Research AS.
Uncertainty budget for standard volume flow at the given flow rate in units of Sm3/h. The functional relationship is displayed together with any relevant computed values used in the model.
Uncertainty budget for mass flow at the given flow rate in units of kg/h. The functional relationship is displayed together with any relevant computed values used in the model.
Uncertainty budget for energy flow at the given flow rate in units of GJ/h. The functional relationship is displayed together with any relevant computed values used in the model.
Uncertainty budget for additional measurements, depending on template. For example if the template included ultrasonic flow meter together with using GC for gas analysis, there is an uncertainty budget for the density measurement.
Uncertainty in CO2 emission factors and calorific value.
Figure 7.15 Report page contains a summary of the uncertainty analysis formatted as an on-screen report. This can be printed and it is also possible to save the analysis in an encrypted file for later use and reference.
Ref. no.: CMR-14-A10099-RA-1 Rev.: 00 Date: 19.03.2014 Page 74 of 93
Uncertainty model for the online uncertainty calculator for gas flow metering stations Report
© Christian Michelsen Research AS.
7.3.9 Note about “Save” and “Open” functionality
When the user saves an uncertainty analysis to file, it will always be a new file. It is not possible to save “changes” to an existing file. In practice this is not a limitation. If the user opens an uncertainty analysis file and want to “save changes”, it is always possible to just use the same file name and thereby overwrite the file. While this mechanism seems like an unnecessary limitation, it is in fact an important security feature of Silverlight. A Silverlight application cannot generally access the file system on a computer. The only exception to this is if the user is shown a file select dialog (controlled by the system, not the application) and then selects a specific file to open and read (read-only) or a name for a file to create (write-only). Through the system controlled file dialog the user has full control over what files the application can read, and over what file areas and file name the application can write to.
7.3.10 Note about “opening” an uncertainty analysis file
When the application start page is first shown the two buttons at the bottom right “Accept and Continue” and “Open From File” is both enabled. If the user chooses either of these the application moves to the “Conditions” page. If the user now goes back to the start page the “Open From File” button is no longer enabled and the “Accept and Continue” button have changed name to “Create New”. It is therefore not possible to open an uncertainty analysis file from this state. To either create a new uncertainty analysis or open an existing from file the user must first press the “Create New” button. This returns the application to the initial state where both the “Accept and Continue” and “Open From File” is enabled.

Uncertainty model for the online uncertainty calculator for gas flow metering stations Report
Ref. no.: CMR-14-A10099-RA-1 Rev.: 00 Date: 19.03.2014 Page 75 of 93
© Christian Michelsen Research AS.
8 Summary
This report documents uncertainty models for fiscal gas metering stations using either orifice, Coriolis or ultrasonic flow meters. The uncertainty models covers the case when a gas chromatograph is used, the case with gas sampling and the case with densitometer and a given gas composition. Two meters in parallel is covered, and for ultrasonic and Coriolis flow meters also two flow meters in series are covered. The uncertainty models are implemented on a web-based Microsoft Silverlight technology. This can be accessed for free from www.nfogm.no. The present work is a generalization of the uncertainty models for fiscal gas metering stations in [Lunde et al, 2002] and [Dahl et al, 2003].

Ref. no.: CMR-14-A10099-RA-1 Rev.: 00 Date: 19.03.2014 Page 76 of 93
Uncertainty model for the online uncertainty calculator for gas flow metering stations Report
© Christian Michelsen Research AS.
9 References
AGA 8: Starling, K.E. and Savidge, J.L.: “Compressibility Factors of Natural Gas and Other Related Hydrocarbon Gases,” American Gas Association Transmission Measurement Committee Report No. 8, Arlington, USA, 1994 (2nd Printing). AGA 10: “Speed of Sound in Natural Gas and Other Related Hydrocarbon Gases,” American Gas Association Report No. 10, Prepared by Transmission Measurement Committee, Washington, USA, 2003. ASTM D-1945, “Standard Test Method for Analysis of Natural Gas by Gas Chromatography,” ASTM International standard No. D1945 – 03, West Conshohocken, USA, 2010. Dahl, E., Frøysa, K.-E. and Lunde, P.: “Handbook of Uncertainty Calculations - Fiscal Orifice Gas and Turbine Oil Metering Stations”, Issued by Norwegian Society for Oil and Gas Measurement (NFOGM) and Norwegian Petroleum Directorate, 2003. ISO 5167-1, “Measurement of fluid flow by means of pressure differential devices inserted in circular cross-section conduits running full – Part 1: General principles and requirements,” ISO, Geneva, 2003. ISO 5167-2, “Measurement of fluid flow by means of pressure differential devices inserted in circular cross-section conduits running full – Part 2: Orifice plates,” ISO, Geneva, 2003. ISO 5168, “Measurement of fluid flow – Procedures for the evaluation of uncertainties,” ISO. Geneva, 2005. ISO 6976, "Natural gas – Calculation of calorific values, density, relative density and Wobbe index from composition," ISO, Geneva, 1995. ISO 10790, “Measurement of fluid flow in closed conduits – Guidance to the selection, installation and use of Coriolis meters (mass flow, density and volume flow measurements,” ISO, Geneva, 1999. ISO 10790-Amd1, “Measurement of fluid flow in closed conduits – Guidance to the selection, installation and use of Coriolis meters (mass flow, density and volume flow measurements. Amendment 1: Guidelines for gas measurement,” ISO, Genev,a 2003. ISO 15970, “Natural gas – Measurement of properties – Volumetric properties: density, pressure, temperature and compression factor,” ISO, Geneva, 2008. ISO 17089-1, “Measurement of fluid flow in closed conduits – Ultrasonic meters for gas – Part 1: Meters for custody transfer and allocation measurement,” ISO, Geneva, 2010. ISO GUM, “Uncertainty of measurement – Part 3: Guide to the expression of uncertainty in measurement (GUM:1995),” ISO guide 98-3, ISO, Geneva, 2008. Lunde, P. and Frøysa, K.-E.: “Handbook of Uncertainty Calculations, ultrasonic fiscal gas metering stations,” Issued by Norwegian Society for Oil and Gas Measurement (NFOGM) and Norwegian Petroleum Directorate, 2002. Lunde, P., Frøysa, K.-E., Lied, G., Skatvedt, R. and Vervik, S.: "Handbook of uncertainty calculations. Fiscal oil metering stations based on ultrasonic duty and master meters," in proceedings from the 28th International North Sea Flow Measurement Workshop, St. Andrews, Scotland, October 2010. NORSOK I-104: “Fiscal measurement system for hydrocarbon gas,” NORSOK standard I-104, Rev. 3, November 2005.

Uncertainty model for the online uncertainty calculator for gas flow metering stations Report
Ref. no.: CMR-14-A10099-RA-1 Rev.: 00 Date: 19.03.2014 Page 77 of 93
© Christian Michelsen Research AS.
NPD, “Regulations relating to measurement of petroleum for fiscal purposes and for calculation of CO2-tax (The measurement regulations),” The Norwegian Petroleum Directorate (NPD), 2001, last translated 2012.

Ref. no.: CMR-14-A10099-RA-1 Rev.: 00 Date: 19.03.2014 Page 78 of 93
Uncertainty model for the online uncertainty calculator for gas flow metering stations Report
© Christian Michelsen Research AS.
Appendix A Detailed formulas for uncertainty of correction factor after flow calibration
This Appendix gives the details regarding the uncertainty of the correction factor estimate as an uncertainty contribution to the calibration uncertainty of a flow calibrated flow meter. It is related to the Coriolis flow meter functional relationship in Section 5.2.1 and uncertainty model in Section 5.3.1. More specifically it gives the value for the first term of the right hand side of Eq. (5.4). For ultrasonic flow meters, it is related to the functional relationship in Section 6.2.1 and uncertainty model in Section 6.3.1. More specifically it gives the value for the first term of the right hand side of Eq. (6.9). The Coriolis flow meter is calibrated on mass flow rate, as this is the primary output of the Coriolis flow meter. Similarly, the ultrasonic flow meter is calibrated on actual volume flow rate. The method described here is similar for both types of flow meters and flow rates, and will be covered together. Thus, the following notation is used for the flow rates: index “x” can mean either “m” for mass or “v” for actual volume. In addition, the index “Meter” will mean either “Coriolis” or “USM”, depending on the meter type in question. The results presented here are based in [Lunde et al, 2002] and [Lunde et al, 2010].
A 1 Functional relationship
After flow calibration, an adjustment of the flow meter may be carried out. The flow calibration is carried by comparing the output flow rate from the flow meter with the similar reading from a reference measurement. This is carried out at a set of N different flow rates where the reference meter measured
the flow rate irefxq ,, and the flow meter measured the flow rate iMeterxq ,, , i = 1, …, N. A full correction of
the flow meter at each of these flow rates can therefore be written as
iMeterxiix qKq ,,, , (A.1)
where
iMeterx
irefx
iq
qK
,,
,, . (A.2)
The relative difference in per cent between the flow rate as measured by the flow meter and the reference meter can be written as
irefx
irefxiMeterx
iq
qqp
,,
,,,,100
. (A.3)
The relation between these two quantities is
i
i
i
ii
pK
K
Kp
100
100;
1100 . (A.4)
From these correction factors a general correction factor valid for all flow rates (and not only at the specific flow rates where the flow calibration is carried out) is established. This can formally be written as

Uncertainty model for the online uncertainty calculator for gas flow metering stations Report
Ref. no.: CMR-14-A10099-RA-1 Rev.: 00 Date: 19.03.2014 Page 79 of 93
© Christian Michelsen Research AS.
Meterxx Kqq , , (A.5)
where
xN qKKKfK ,,,, 21 . (A.6)
This factor corresponds to correcting a percentage deviation of p %, where
pKK
Kp
100100;
1100 . (A.7)
In practice, such a correction can be carried out in different ways, including
(i) no correction, (ii) a constant percentage correction, (iii) linear interpolation, and (iv) other methods (splines and other curve fittings).
In this report the three first methods will be covered. In the first case, with no correction, K will be equal to one, and p = 0. The flow meter is then not adjusted to give the same output flow rate as the reference meter. In the second case, an average percentage difference, p = pcorr, for example the flow weighted mean error, between the flow meter output and the reference measurement is established. Then a correction
factor corrpK 100100 is established and used for all flow rates. It should be commented that in
case (ii), the output flow rate of the flow meter after adjustment will generally not be the same as the flow rate measured by the reference instrumentation (for the flow rates used in the flow calibration). Thus, there will remain some known systematic errors in the flow meter. It should also be commented that case (i) is a special case of case (ii), with pcorr = p = 0. In the third case, the adjustment will be based on a linear interpolation between the adjustment factors established for the flow rates used in the flow calibration. Such an interpolation can be carried out either on K, or on the percentage deviation p. Here, a linear interpolation in p is described. Both for the correction and for the uncertainty analysis, the results will almost be the same whether the interpolation is carried out on p or on K. The linear interpolation can be written as
.
;
1,,,,,
,,,
,,1,,
1
iMeterxMeterxiMeterx
iMeterxMeterx
iMeterxiMeterx
iii
qqqwhen
qqqq
pppp
(A.8)
K can then be found from Eq. (A.7). It should be commented that this third case provides a correction such that the flow meter’s flow rate will be corrected to the reference meter flow rate, when the flow rate is equal to any of the flow rates used in the flow calibration. This case is therefore in agreement with the Norwegian Petroleum Directorate Measurement Regulations, where one requirement in Section 8 is that “The measurement system shall be designed so that systematic measurement errors are avoided or compensated for”. Using case (i) and (ii) is not in agreement with this requirement. The fourth case is a generalization of the third case, where the linear interpolation is replaced with a non-linear interpolation (e.g. based on splines) or a partially linear interpolation where more interpolation points than the ones used in the flow calibration (ref. case (iii)) are used. In such cases, it is recommended that for the uncertainty analysis, it is treated as case (iii).
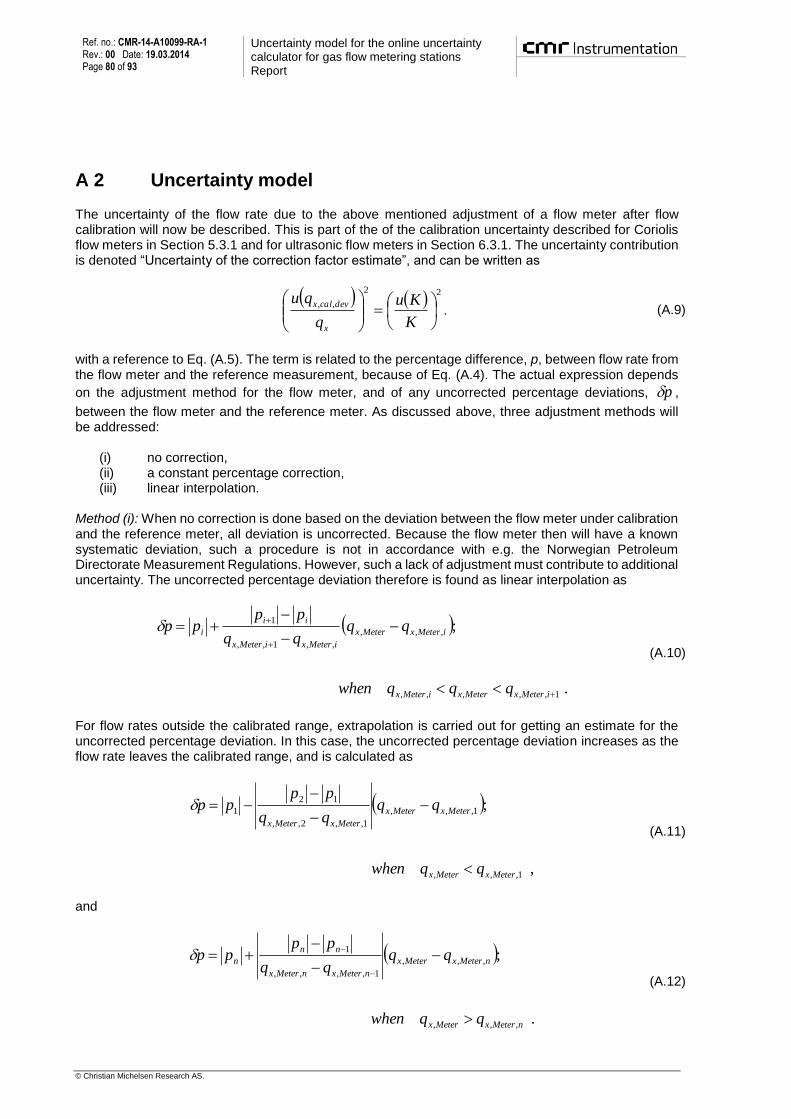
Ref. no.: CMR-14-A10099-RA-1 Rev.: 00 Date: 19.03.2014 Page 80 of 93
Uncertainty model for the online uncertainty calculator for gas flow metering stations Report
© Christian Michelsen Research AS.
A 2 Uncertainty model
The uncertainty of the flow rate due to the above mentioned adjustment of a flow meter after flow calibration will now be described. This is part of the of the calibration uncertainty described for Coriolis flow meters in Section 5.3.1 and for ultrasonic flow meters in Section 6.3.1. The uncertainty contribution is denoted “Uncertainty of the correction factor estimate”, and can be written as
22
,,
K
Ku
q
qu
x
devcalx. (A.9)
with a reference to Eq. (A.5). The term is related to the percentage difference, p, between flow rate from the flow meter and the reference measurement, because of Eq. (A.4). The actual expression depends
on the adjustment method for the flow meter, and of any uncorrected percentage deviations, p ,
between the flow meter and the reference meter. As discussed above, three adjustment methods will be addressed:
(i) no correction, (ii) a constant percentage correction, (iii) linear interpolation.
Method (i): When no correction is done based on the deviation between the flow meter under calibration and the reference meter, all deviation is uncorrected. Because the flow meter then will have a known systematic deviation, such a procedure is not in accordance with e.g. the Norwegian Petroleum Directorate Measurement Regulations. However, such a lack of adjustment must contribute to additional uncertainty. The uncorrected percentage deviation therefore is found as linear interpolation as
.
;
1,,,,,
,,,
,,1,,
1
iMeterxMeterxiMeterx
iMeterxMeterx
iMeterxiMeterx
ii
i
qqqwhen
qqqq
pppp
(A.10)
For flow rates outside the calibrated range, extrapolation is carried out for getting an estimate for the uncorrected percentage deviation. In this case, the uncorrected percentage deviation increases as the flow rate leaves the calibrated range, and is calculated as
,
;
1,,,
1,,,
1,,2,,
12
1
MeterxMeterx
MeterxMeterx
MeterxMeterx
qqwhen
qqqq
pppp
(A.11)
and
.
;
,,,
,,,
1,,,,
1
nMeterxMeterx
nMeterxMeterx
nMeterxnMeterx
nn
n
qqwhen
qqqq
pppp
(A.12)
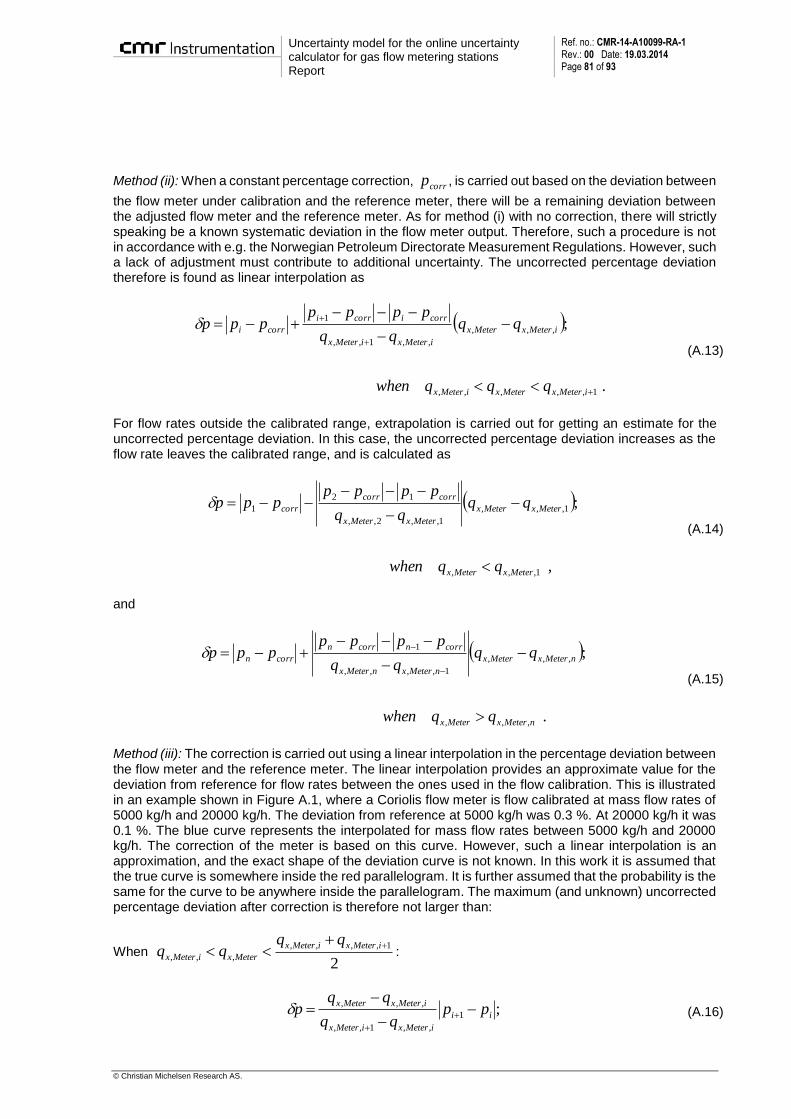
Uncertainty model for the online uncertainty calculator for gas flow metering stations Report
Ref. no.: CMR-14-A10099-RA-1 Rev.: 00 Date: 19.03.2014 Page 81 of 93
© Christian Michelsen Research AS.
Method (ii): When a constant percentage correction, corrp , is carried out based on the deviation between
the flow meter under calibration and the reference meter, there will be a remaining deviation between the adjusted flow meter and the reference meter. As for method (i) with no correction, there will strictly speaking be a known systematic deviation in the flow meter output. Therefore, such a procedure is not in accordance with e.g. the Norwegian Petroleum Directorate Measurement Regulations. However, such a lack of adjustment must contribute to additional uncertainty. The uncorrected percentage deviation therefore is found as linear interpolation as
.
;
1,,,,,
,,,
,,1,,
1
iMeterxMeterxiMeterx
iMeterxMeterx
iMeterxiMeterx
corricorri
corri
qqqwhen
qqqq
ppppppp
(A.13)
For flow rates outside the calibrated range, extrapolation is carried out for getting an estimate for the uncorrected percentage deviation. In this case, the uncorrected percentage deviation increases as the flow rate leaves the calibrated range, and is calculated as
,
;
1,,,
1,,,
1,,2,,
12
1
MeterxMeterx
MeterxMeterx
MeterxMeterx
corrcorr
corr
qqwhen
qqqq
ppppppp
(A.14)
and
.
;
,,,
,,,
1,,,,
1
nMeterxMeterx
nMeterxMeterx
nMeterxnMeterx
corrncorrn
corrn
qqwhen
qqqq
ppppppp
(A.15)
Method (iii): The correction is carried out using a linear interpolation in the percentage deviation between the flow meter and the reference meter. The linear interpolation provides an approximate value for the deviation from reference for flow rates between the ones used in the flow calibration. This is illustrated in an example shown in Figure A.1, where a Coriolis flow meter is flow calibrated at mass flow rates of 5000 kg/h and 20000 kg/h. The deviation from reference at 5000 kg/h was 0.3 %. At 20000 kg/h it was 0.1 %. The blue curve represents the interpolated for mass flow rates between 5000 kg/h and 20000 kg/h. The correction of the meter is based on this curve. However, such a linear interpolation is an approximation, and the exact shape of the deviation curve is not known. In this work it is assumed that the true curve is somewhere inside the red parallelogram. It is further assumed that the probability is the same for the curve to be anywhere inside the parallelogram. The maximum (and unknown) uncorrected percentage deviation after correction is therefore not larger than:
When 2
1,,,,
,,,
iMeterxiMeterx
MeterxiMeterx
qqqq :
;1
,,1,,
,,,
ii
iMeterxiMeterx
iMeterxMeterxpp
qqp
(A.16)

Ref. no.: CMR-14-A10099-RA-1 Rev.: 00 Date: 19.03.2014 Page 82 of 93
Uncertainty model for the online uncertainty calculator for gas flow metering stations Report
© Christian Michelsen Research AS.
when 1,,,
1,,,,
2
iMeterxMeterx
iMeterxiMeterxqq
qq:
.1
,,1,,
,1,,
ii
iMeterxiMeterx
MeterxiMeterxpp
qqp
(A.17)
This maximum percentage deviation is shown in Figure A.2. For flow rates outside the calibrated range, extrapolation is carried out for getting an estimate for the uncorrected percentage deviation. In this case, the uncorrected percentage deviation increases as the flow rate leaves the calibrated range, and is calculated as
,
;
1,,,
12
1,,2,,
1,,,
MeterxMeterx
MeterxMeterx
MeterxMeterx
qqwhen
ppqq
qqp
(A.18)
and
.
;
,,,
1
1,,,,
,,,
nMeterxMeterx
nn
nMeterxnMeterx
nMeterxMeterx
qqwhen
ppqq
qqp
(A.19)
For all three types of correction (Method (i), (ii) and (iii)), the expression for p is considered to be
expanded uncertainty of p with 100 % confidence level and rectangular distribution function. The
standard uncertainty of p is then found by dividing p with the square root of 3. The relative standard
uncertainty of the correction factor estimate can now be written as
p
ppu
K
p
KK
Ku
q
qu
x
devcalx
100
3)(
1,, . (A.20)
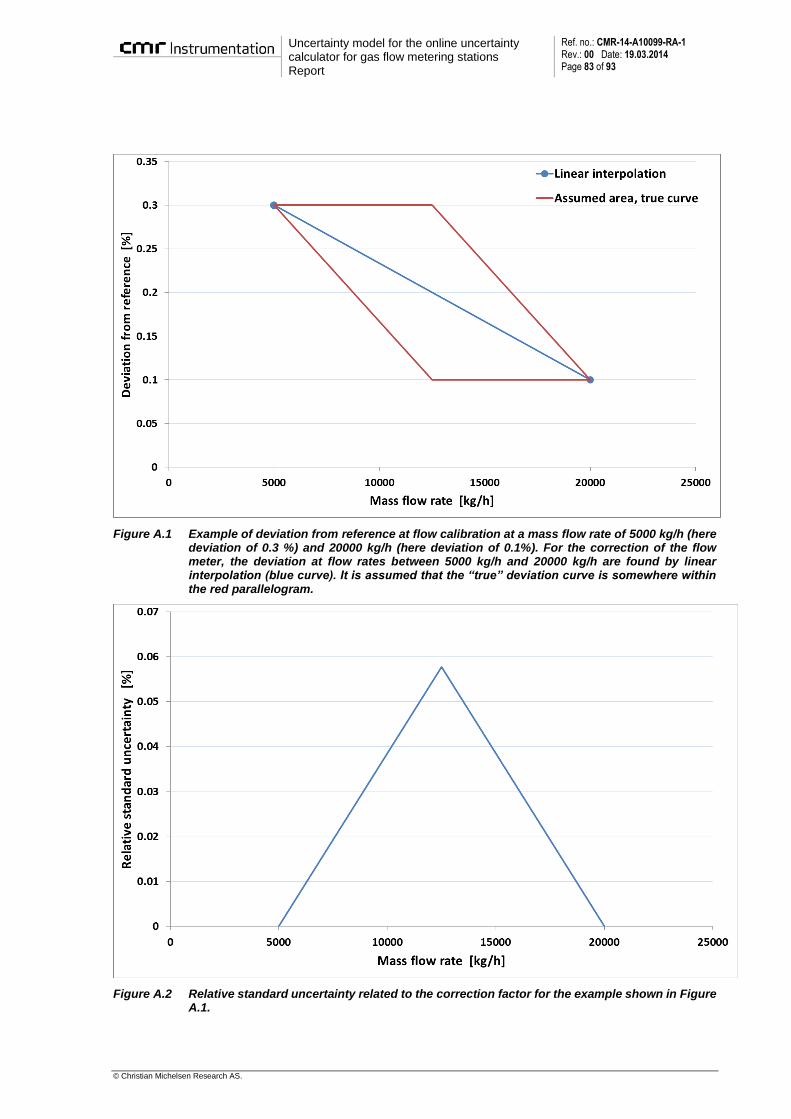
Uncertainty model for the online uncertainty calculator for gas flow metering stations Report
Ref. no.: CMR-14-A10099-RA-1 Rev.: 00 Date: 19.03.2014 Page 83 of 93
© Christian Michelsen Research AS.
Figure A.1 Example of deviation from reference at flow calibration at a mass flow rate of 5000 kg/h (here deviation of 0.3 %) and 20000 kg/h (here deviation of 0.1%). For the correction of the flow meter, the deviation at flow rates between 5000 kg/h and 20000 kg/h are found by linear interpolation (blue curve). It is assumed that the “true” deviation curve is somewhere within the red parallelogram.
Figure A.2 Relative standard uncertainty related to the correction factor for the example shown in Figure A.1.

Ref. no.: CMR-14-A10099-RA-1 Rev.: 00 Date: 19.03.2014 Page 84 of 93
Uncertainty model for the online uncertainty calculator for gas flow metering stations Report
© Christian Michelsen Research AS.
Appendix B Uncertainty model for two flow meters in parallel or in series
In this appendix, the uncertainty models for single flow meters are extended to cover two flow meters in parallel or two flow meters in series. First, a generic presentation for the uncertainty model for a single flow meter is presented. This result is thereafter used for development of uncertainty models for two meters in parallel or in series.
B 1 Generic uncertainty model for one flow meter
First, a generic uncertainty model for each of the two flow meters, meter A and meter B, is presented. It is shown here for mass flow rate, but can also be used for the other flow rates in question in this report. The mass flow rate for each of the two meters (separately) can be found by the following generic equations:
).,,,(
),,,,(
21
21
nBBBmB
nAAAmA
xxxfq
xxxfq
(B.1)
As an example, if this is an orifice metering station, the equations correspond to Eqs. (4.4) or (4.7), depending on the set-up of the metering station. The x-variables correspond then to the various inputs to these equations, like discharge coefficient, expansibility coefficient, differential pressure, pressure, temperature, density and other gas parameters. n is 7 if densitometer is used and 8 elsewhere (by counting how many uncertainty contributions there are in Eqs. (4.4) and (4.7)). Similarly, there are influencing parameters also for the other types of flow meters. The uncertainty model for each of these two flow rates can on absolute form be written as
22
2
2
2
1
1
2)(
nA
n
AAmA xux
fxu
x
fxu
x
fqu , (B.2)
22
2
2
2
1
1
2)(
nB
n
BBmB xux
fxu
x
fxu
x
fqu . (B.3)
This can be re-written to relative form by algebraic manipulations:
22
2
2
2
2
2
1
1
1
1
2
)()()(
nA
nA
nmA
nA
A
A
mA
A
A
A
mA
A
mA
mA
x
xu
x
f
q
x
x
xu
x
f
q
x
x
xu
x
f
q
x
q
qu , (B.4)
22
2
2
2
2
2
1
1
1
1
2
)()()(
nB
nB
nmB
nB
B
B
mB
B
B
B
mB
B
mB
mB
x
xu
x
f
q
x
x
xu
x
f
q
x
x
xu
x
f
q
x
q
qu . (B.5)
If this is an orifice metering station, the equations correspond to Eqs. (4.10) or (4.13), depending on the set-up of the metering station. Note that each term on the right-hand-side of Eqs. (B.4) and (B.5)

Uncertainty model for the online uncertainty calculator for gas flow metering stations Report
Ref. no.: CMR-14-A10099-RA-1 Rev.: 00 Date: 19.03.2014 Page 85 of 93
© Christian Michelsen Research AS.
represents the uncertainty contribution to the relative standard uncertainty of the mass flow rate in pipe A and B, respectively, originating from the uncertainty in each of the input parameters xi.
B 2 Two flow meters in parallel
The total mass flow through the orifice metering station with two parallel runs, can now be written as
mBmAm qqq . (B.6)
The uncertainty model for the total mass flow rate can on absolute form be written as
).()(2
)()(2
)()(2)(
22
22
22
2
2
2
2
2
2
2
11
11
1
2
1
1
2
1
1
2
nBnA
nn
nnB
n
nA
n
BABA
BABAm
xuxux
f
x
frxu
x
fxu
x
f
xuxux
f
x
frxu
x
fxu
x
f
xuxux
f
x
frxu
x
fxu
x
fqu
(B.7)
In this formula, the concept of correlation has been addressed. In the uncertainty model for one single orifice meter, correlations have been avoided by the careful choice of input parameters. However, when considering two meters in parallel, similar measurements/calculations have been carried out for each run, and an evaluation on possible correlation between these measurements/calculations have to be made.
The correlation coefficient 1r represents the correlation between the uncertainty in input parameter 1
)( 1x between pipe A and B. If there is full correlation, the correlation coefficient is 1. If there is no
correlation, the correlation coefficient is 0. It is similar for the other input parameters ( 2x to nx ).
This can be re-written to relative form by algebraic manipulations:

Ref. no.: CMR-14-A10099-RA-1 Rev.: 00 Date: 19.03.2014 Page 86 of 93
Uncertainty model for the online uncertainty calculator for gas flow metering stations Report
© Christian Michelsen Research AS.
.)()(
2
)(
)()(2
)(
)()(2
)(
22
1
2
2
2
2
22
222
2
2
2
2
2
2
2
2
2
2
1
1
1
1
11
111
2
1
1
1
1
2
1
1
1
1
2
nB
nB
nA
nA
nnmB
nB
mA
nA
m
mB
m
mAn
nB
nB
nmB
nB
m
mB
nA
nA
nmA
A
m
mA
B
B
A
A
mB
B
mA
A
m
mB
m
mA
B
B
mB
B
m
mB
A
A
mA
A
m
mA
B
B
A
A
mB
B
mA
A
m
mB
m
mA
B
B
mB
B
m
mB
A
A
mA
A
m
mA
m
m
x
xu
x
xu
x
f
x
f
q
x
q
x
q
q
q
qr
x
xu
x
f
q
x
q
q
x
xu
x
f
q
x
q
q
x
xu
x
xu
x
f
x
f
q
x
q
x
q
q
q
qr
x
xu
x
f
q
x
q
q
x
xu
x
f
q
x
q
q
x
xu
x
xu
x
f
x
f
q
x
q
x
q
q
q
qr
x
xu
x
f
q
x
q
q
x
xu
x
f
q
x
q
q
q
qu
(B.8)
Now assume that the flow in pipe A and B is of the same size. This means that
21 mmBmmA qqqq . This simplifies the above equation:
.)()(
2
)(
)()(2
)(
)()(2
)(
4
1
22
1
2
2
2
2
22
222
2
2
2
2
2
2
2
2
2
2
1
1
1
1
11
111
2
1
1
1
1
2
1
1
1
1
2
nB
nB
nA
nA
nnmB
nB
mA
nAn
nB
nB
nmB
nB
nA
nA
nmA
A
B
B
A
A
mB
B
mA
A
B
B
mB
B
A
A
mA
A
B
B
A
A
mB
B
mA
A
B
B
mB
B
A
A
mA
A
m
m
x
xu
x
xu
x
f
x
f
q
x
q
xr
x
xu
x
f
q
x
x
xu
x
f
q
x
x
xu
x
xu
x
f
x
f
q
x
q
xr
x
xu
x
f
q
x
x
xu
x
f
q
x
x
xu
x
xu
x
f
x
f
q
x
q
xr
x
xu
x
f
q
x
x
xu
x
f
q
x
q
qu
(B.9)
The correlation coefficients will as the model is used here be either 0 (uncorrelated) or 1 (fully correlated).
If the correlation coefficient 01 r , the terms related to the 1x variable (two first lines in the right hand
side of Eq. (B.9)) will reduce to

Uncertainty model for the online uncertainty calculator for gas flow metering stations Report
Ref. no.: CMR-14-A10099-RA-1 Rev.: 00 Date: 19.03.2014 Page 87 of 93
© Christian Michelsen Research AS.
.
)(
4
1
)()(2
)(
4
1
2
1
1
1
1
2
1
1
1
1
1
1
1
1
11
111
2
1
1
1
1
2
1
1
1
1
B
B
mB
B
A
A
mA
A
B
B
A
A
mB
B
mA
A
B
B
mB
B
A
A
mA
A
x
xu
x
f
q
x
x
xu
x
f
q
x
x
xu
x
xu
x
f
x
f
q
x
q
xr
x
xu
x
f
q
x
x
xu
x
f
q
x
(B.10)
Note that the two expressions in the parentheses in the last line of Eq. (B.10) are the uncertainty
contributions to mAq and mBq , respectively, originating from the uncertainty in the input parameters Ax1
and Bx1 . This can be seen by comparing with Eqs. (B.4) and (B.5).
If the correlation coefficient 11 r , the terms related to the 1x variable (two first lines in the right hand
side of Eq. (B.9)) will reduce to
.
)(
4
1
)()(2
)(
4
1
2
1
1
1
1
1
1
1
1
1
1
1
1
11
111
2
1
1
1
1
2
1
1
1
1
B
B
mB
B
A
A
mA
A
B
B
A
A
mB
B
mA
A
B
B
mB
B
A
A
mA
A
x
xu
x
f
q
x
x
xu
x
f
q
x
x
xu
x
xu
x
f
x
f
q
x
q
xr
x
xu
x
f
q
x
x
xu
x
f
q
x
(B.11)
Note that also here the uncertainty contributions to mAq and mBq , respectively, originating from the
uncertainty in the input parameters Ax1 and Bx1 appear.
In order to apply this uncertainty model, the various uncertainty contributions have to be classified as either correlated or uncorrelated. This is done in the chapters covering the different flow meters. In the derivation of the uncertainty model, the mass flow rate has been in focus. The standard volumetric flow rate and the energy flow rate can be treated in exactly the same way.
B 3 Two flow meters in series
The average mass flow found from the two flow meters, can now be written as
2
mBmAm
qqq
. (B.12)
The uncertainty model for the total mass flow rate can on absolute form be written as

Ref. no.: CMR-14-A10099-RA-1 Rev.: 00 Date: 19.03.2014 Page 88 of 93
Uncertainty model for the online uncertainty calculator for gas flow metering stations Report
© Christian Michelsen Research AS.
.)()(2
)()(2
)()(2)(4
1
22
22
22
2
2
2
2
2
2
2
11
11
1
2
1
1
2
1
1
2
nBnA
nn
nnB
n
nA
n
BABA
BABAm
xuxux
f
x
frxu
x
fxu
x
f
xuxux
f
x
frxu
x
fxu
x
f
xuxux
f
x
frxu
x
fxu
x
fqu
(B.13)
In this formula, like for two meters in parallel the concept of correlation has been addressed. In the uncertainty model for one single flow meter there are assumed to be no correlations. However, when considering two meters in series, similar measurements/calculations have been carried out for each run, and an evaluation on possible correlation between these measurements/calculations has to be made.
The correlation coefficient 1r represents the correlation between the uncertainty in input parameter 1
)( 1x between meter A and B. If there is full correlation, the correlation coefficient is 1. If there is no
correlation, the correlation coefficient is 0. It is similar for the other input parameters ( 2x to nx ).
This can be re-written to relative form by algebraic manipulations:
.)()(
2
)(
)()(2
)(
)()(2
)(
4
1
22
1
2
2
2
2
22
222
2
2
2
2
2
2
2
2
2
2
1
1
1
1
11
111
2
1
1
1
1
2
1
1
1
1
2
nB
nB
nA
nA
nnmB
nB
mA
nA
m
mB
m
mAn
nB
nB
nmB
nB
m
mB
nA
nA
nmA
A
m
mA
B
B
A
A
mB
B
mA
A
m
mB
m
mA
B
B
mB
B
m
mB
A
A
mA
A
m
mA
B
B
A
A
mB
B
mA
A
m
mB
m
mA
B
B
mB
B
m
mB
A
A
mA
A
m
mA
m
m
x
xu
x
xu
x
f
x
f
q
x
q
x
q
q
q
qr
x
xu
x
f
q
x
q
q
x
xu
x
f
q
x
q
q
x
xu
x
xu
x
f
x
f
q
x
q
x
q
q
q
qr
x
xu
x
f
q
x
q
q
x
xu
x
f
q
x
q
q
x
xu
x
xu
x
f
x
f
q
x
q
x
q
q
q
qr
x
xu
x
f
q
x
q
q
x
xu
x
f
q
x
q
q
q
qu
(B.14)
It is obvious that the same gas flows through both meters. Therefore for the purpose of an uncertainty
model the following identities will be used: 1 mmBmmA qqqq . This simplifies the above equation:

Uncertainty model for the online uncertainty calculator for gas flow metering stations Report
Ref. no.: CMR-14-A10099-RA-1 Rev.: 00 Date: 19.03.2014 Page 89 of 93
© Christian Michelsen Research AS.
.)()(
2
)(
)()(2
)(
)()(2
)(
4
1
22
1
2
2
2
2
22
222
2
2
2
2
2
2
2
2
2
2
1
1
1
1
11
111
2
1
1
1
1
2
1
1
1
1
2
nB
nB
nA
nA
nnmB
nB
mA
nAn
nB
nB
nmB
nB
nA
nA
nmA
A
B
B
A
A
mB
B
mA
A
B
B
mB
B
A
A
mA
A
B
B
A
A
mB
B
mA
A
B
B
mB
B
A
A
mA
A
m
m
x
xu
x
xu
x
f
x
f
q
x
q
xr
x
xu
x
f
q
x
x
xu
x
f
q
x
x
xu
x
xu
x
f
x
f
q
x
q
xr
x
xu
x
f
q
x
x
xu
x
f
q
x
x
xu
x
xu
x
f
x
f
q
x
q
xr
x
xu
x
f
q
x
x
xu
x
f
q
x
q
qu
(B.15)
Note that this equation is identical to Eq. (B.9). The correlation coefficients will as the model is used here be either 0 (uncorrelated) or 1 (fully correlated).
If the correlation coefficient 01 r , the terms related to the 1x variable (two first lines in the right hand
side of Eq. (B.15) will reduce to
.
)(
4
1
)()(2
)(
4
1
2
1
1
1
1
2
1
1
1
1
1
1
1
1
11
111
2
1
1
1
1
2
1
1
1
1
B
B
mB
B
A
A
mA
A
B
B
A
A
mB
B
mA
A
B
B
mB
B
A
A
mA
A
x
xu
x
f
q
x
x
xu
x
f
q
x
x
xu
x
xu
x
f
x
f
q
x
q
xr
x
xu
x
f
q
x
x
xu
x
f
q
x
(B.16)
Note that the two expressions in the parentheses in the last line of Eq. (B.16) are the uncertainty
contributions to mAq and mBq , respectively, originating from the uncertainty in the input parameters Ax1
and Bx1 . This can be seen by comparing with Eqs. (B.4) and (B.5).
If the correlation coefficient 11 r , the terms related to the 1x variable (two first lines in the right hand
side of Eq. (B.16)) will reduce to

Ref. no.: CMR-14-A10099-RA-1 Rev.: 00 Date: 19.03.2014 Page 90 of 93
Uncertainty model for the online uncertainty calculator for gas flow metering stations Report
© Christian Michelsen Research AS.
.
)(
4
1
)()(2
)(
4
1
2
1
1
1
1
1
1
1
1
1
1
1
1
11
111
2
1
1
1
1
2
1
1
1
1
B
B
mB
B
A
A
mA
A
B
B
A
A
mB
B
mA
A
B
B
mB
B
A
A
mA
A
x
xu
x
f
q
x
x
xu
x
f
q
x
x
xu
x
xu
x
f
x
f
q
x
q
xr
x
xu
x
f
q
x
x
xu
x
f
q
x
(B.17)
Note that also here the uncertainty contributions to mAq and mBq , respectively, originating from the
uncertainty in the input parameters Ax1 and Bx1 appear.
In order to apply this uncertainty model, the various uncertainty contributions have to be classified as either correlated or uncorrelated. This is done in the chapters covering the different flow meters. In the derivation of the uncertainty model, the mass flow rate has been in focus. The standard volumetric flow rate and the energy flow rate can be treated in exactly the same way.
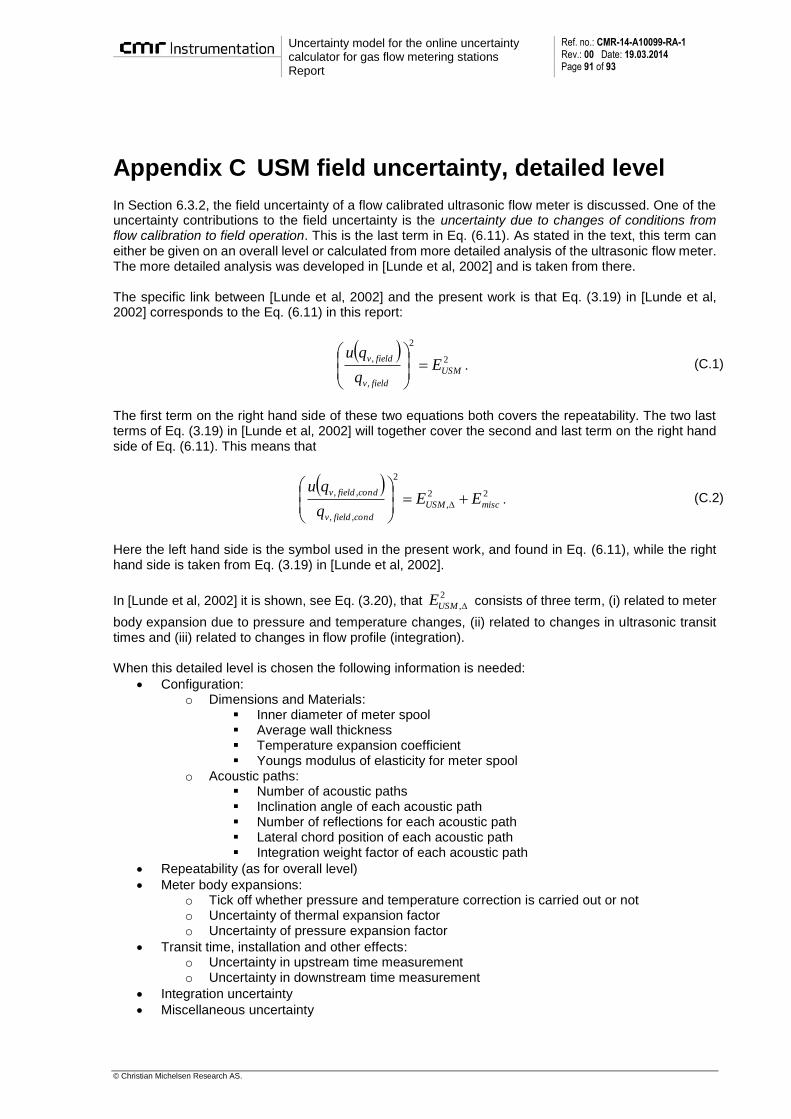
Uncertainty model for the online uncertainty calculator for gas flow metering stations Report
Ref. no.: CMR-14-A10099-RA-1 Rev.: 00 Date: 19.03.2014 Page 91 of 93
© Christian Michelsen Research AS.
Appendix C USM field uncertainty, detailed level
In Section 6.3.2, the field uncertainty of a flow calibrated ultrasonic flow meter is discussed. One of the uncertainty contributions to the field uncertainty is the uncertainty due to changes of conditions from flow calibration to field operation. This is the last term in Eq. (6.11). As stated in the text, this term can either be given on an overall level or calculated from more detailed analysis of the ultrasonic flow meter. The more detailed analysis was developed in [Lunde et al, 2002] and is taken from there. The specific link between [Lunde et al, 2002] and the present work is that Eq. (3.19) in [Lunde et al, 2002] corresponds to the Eq. (6.11) in this report:
2
2
,
,
USM
fieldv
fieldvE
q
qu
. (C.1)
The first term on the right hand side of these two equations both covers the repeatability. The two last terms of Eq. (3.19) in [Lunde et al, 2002] will together cover the second and last term on the right hand side of Eq. (6.11). This means that
22
,
2
,,
,,
miscUSM
condfieldv
condfieldvEE
q
qu
. (C.2)
Here the left hand side is the symbol used in the present work, and found in Eq. (6.11), while the right hand side is taken from Eq. (3.19) in [Lunde et al, 2002].
In [Lunde et al, 2002] it is shown, see Eq. (3.20), that 2
,USME consists of three term, (i) related to meter
body expansion due to pressure and temperature changes, (ii) related to changes in ultrasonic transit times and (iii) related to changes in flow profile (integration). When this detailed level is chosen the following information is needed:
Configuration: o Dimensions and Materials:
Inner diameter of meter spool Average wall thickness Temperature expansion coefficient Youngs modulus of elasticity for meter spool
o Acoustic paths: Number of acoustic paths Inclination angle of each acoustic path Number of reflections for each acoustic path Lateral chord position of each acoustic path Integration weight factor of each acoustic path
Repeatability (as for overall level)
Meter body expansions: o Tick off whether pressure and temperature correction is carried out or not o Uncertainty of thermal expansion factor o Uncertainty of pressure expansion factor
Transit time, installation and other effects: o Uncertainty in upstream time measurement o Uncertainty in downstream time measurement
Integration uncertainty
Miscellaneous uncertainty
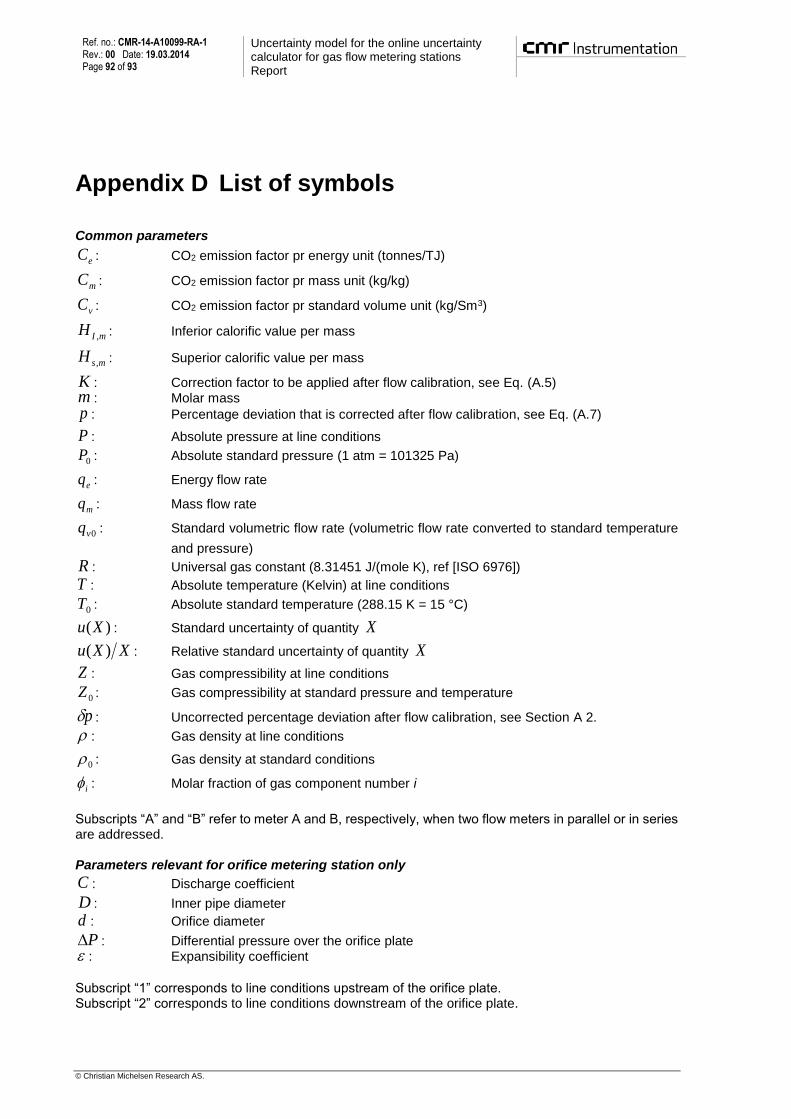
Ref. no.: CMR-14-A10099-RA-1 Rev.: 00 Date: 19.03.2014 Page 92 of 93
Uncertainty model for the online uncertainty calculator for gas flow metering stations Report
© Christian Michelsen Research AS.
Appendix D List of symbols
Common parameters
eC : CO2 emission factor pr energy unit (tonnes/TJ)
mC : CO2 emission factor pr mass unit (kg/kg)
vC : CO2 emission factor pr standard volume unit (kg/Sm3)
mIH , : Inferior calorific value per mass
msH , : Superior calorific value per mass
K : Correction factor to be applied after flow calibration, see Eq. (A.5) m : Molar mass
p : Percentage deviation that is corrected after flow calibration, see Eq. (A.7)
P : Absolute pressure at line conditions
0P : Absolute standard pressure (1 atm = 101325 Pa)
eq : Energy flow rate
mq : Mass flow rate
0vq : Standard volumetric flow rate (volumetric flow rate converted to standard temperature
and pressure)
R : Universal gas constant (8.31451 J/(mole K), ref [ISO 6976])
T : Absolute temperature (Kelvin) at line conditions
0T : Absolute standard temperature (288.15 K = 15 °C)
)(Xu : Standard uncertainty of quantity X
XXu )( : Relative standard uncertainty of quantity X
Z : Gas compressibility at line conditions
0Z : Gas compressibility at standard pressure and temperature
p : Uncorrected percentage deviation after flow calibration, see Section A 2.
: Gas density at line conditions
0 : Gas density at standard conditions
i : Molar fraction of gas component number i
Subscripts “A” and “B” refer to meter A and B, respectively, when two flow meters in parallel or in series are addressed. Parameters relevant for orifice metering station only
C : Discharge coefficient
D : Inner pipe diameter
d : Orifice diameter
P : Differential pressure over the orifice plate : Expansibility coefficient
Subscript “1” corresponds to line conditions upstream of the orifice plate. Subscript “2” corresponds to line conditions downstream of the orifice plate.

Uncertainty model for the online uncertainty calculator for gas flow metering stations Report
Ref. no.: CMR-14-A10099-RA-1 Rev.: 00 Date: 19.03.2014 Page 93 of 93
© Christian Michelsen Research AS.
Parameters relevant for Coriolis metering station only None Parameters relevant for ultrasonic metering station only
vq : Volumetric flow rate at line pressure and temperature