unclassified ad 1405 i1i8. - dtic
TRANSCRIPT
UNCLASSIFIED
AD 1405 i1i8.
DEFENSE DOCUMENTATION CENTERFOR
SCIENTIFIC AND TECHNICAL INFORMATION
CAMERON STATION. ALEXANDRIA. VIRGINIA
UNCLASSIFIED
NWIfC3: hen govezrmnt or other drawvip, sp*sl-fliatiLona or other data an used for any purpoiseother than in connectLon wLth a definitely relatedgovernment procurient operation, the U. B.Government thereby inhurs no responsbility,. nor anyobliLgtion whatsoeverj and the fact that the Govern-ment my have forualatedi, furnLihed, or in azn wysupplied the aidd drawings, speeLficatLons, or otherdata Le not to be regaded by iupleatLon or other-wtse as in any manner licens•ng the holder or anyother person or corporation, or convoying an Aghtsor peranisson to uuae use or sell anypatented inventLon that ym in any way be relatedthereto.
REPORT NO.
$$ D-TOW O I 0TDR-169 (324O.0-1r
' 0
Mechanism of Gold Diffusion into Silicon
10 APRIL 1963
Prepared byW. R. WILCOX
Materials Sciences LaboratoryAerospace Corporation
and
T. J. LA CHAPELLEPacific Semiconductors, Incorporated
N Lawndale, California
SPrepared for COMMANDER SPACE SYSTEMS DIVISIONUNITED STATES AIR FORCE
Inglewood, California
SLABORATORIES DIVISION. \ [A RS I'ACOt ('()R IP( )RA TIONCONTRACT NO. AF 04 (695) -169
t1i 3 IS A -° COPYDO NOT CIRCULATE 63
Mechanism of Gold Diffusion into Silicon
10 APRIL 1S6S
* Prepared byW. R. WILCOX
Materials Sciences LaboratoryAerospace Corporation
and
T. J. LA CHAPELLEPacific Semiconductor*, Iacorperted
Lawudale, California
Prepared for COMMANDER SPACE SYSTEMS DIVISION
UNITED STATES AIR FORCElaglewood, California
LABORATORIES DIVISION.
CONTRACT NOO. A? 040"U-169
63 ' b
noD- TR- 63- T0I..--. $"3340-01)TX. 1
MECHANISM OF GOLD DIFFUSION INTO SILICON*
Prepared by
W. R. WilcoxMaterials Sciences Laboratory
Aerospace Corporation
and
T. J. LaChapellePacific Semiconductors, Incorporated
Lawndale, California
"AEROSPACE CORPORATIONEl Segundo, California
Contract No. AF 04(695)-169
10 April 1963
Prepared for
COMMANDER SPACE SYSTEMS DIVISIONUNITED STATES AIR FORCE
Inglewood, California
The laboratory investigations reported herein were performied whilo
both authors were affiliated with Pacific Semiconductors, Ise. Fia.-analyses and reporting were conducted at Aerospace Corporation, amderContract No. AF 04(695)-169.
]Ir
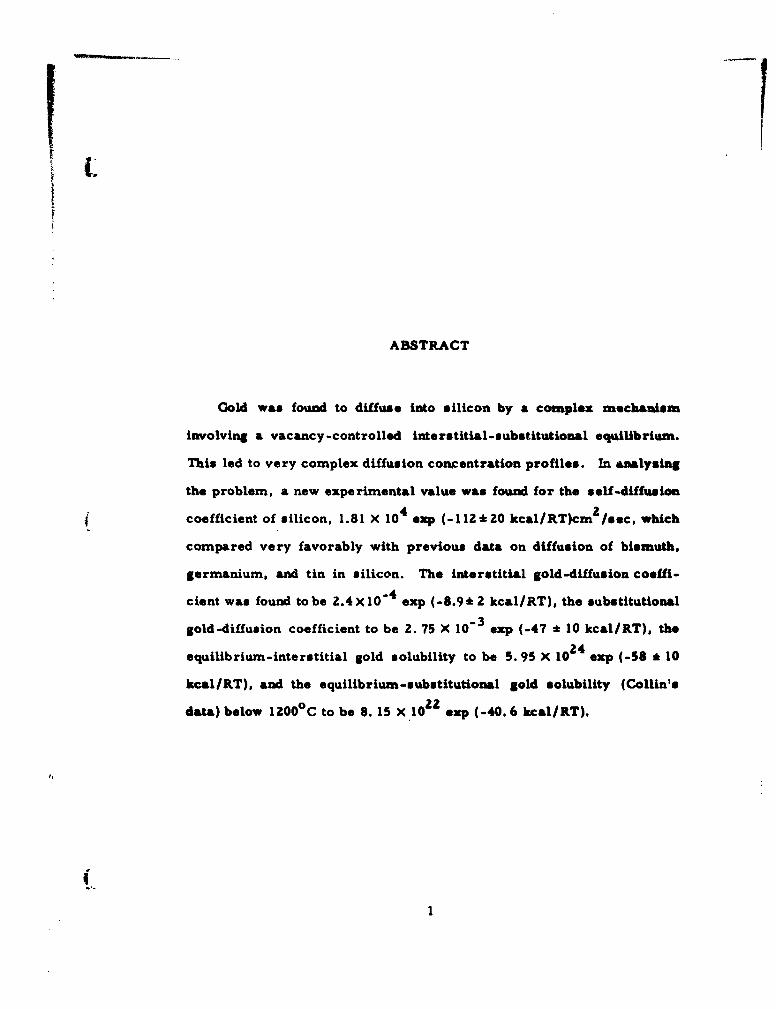
ABSTRACT
Gold was found to diffuse into silicon by a complex mechaaism
involving a vacancy -controlled interstitial-s ubstitutional equilibrium.
This led to very complex diffusion concentration profiles. In analysing
the problem, a new experimental value was found for the self-diffusion
coefficient of silicon, 1.81 X 10⁴ exp (- 112 * 20 kcal/RT)cm /sec, which
compared very favorably with previous data on diffusion of bismuth,
germanium, and tin in silicon. The interstitial gold-diffusion coeffi-
cient was found to be Z.4 X 10-4 exp (-8.9* 2 kcal/RT), the substitutional
gold-diffusion coefficient to be 2. 75 X 10-3 exp (-47 * 10 kcal/RT), the
equilibrium-interstitial gold solubility to be 5. 95 X 1024 exp (-56 * 10
kcal/RT), and the equilibrium-substitutional gold solubility (Collin's
data) below 12000 C to be 8.15 X 10 2 exp (-40.6 kcal/RT).
(1
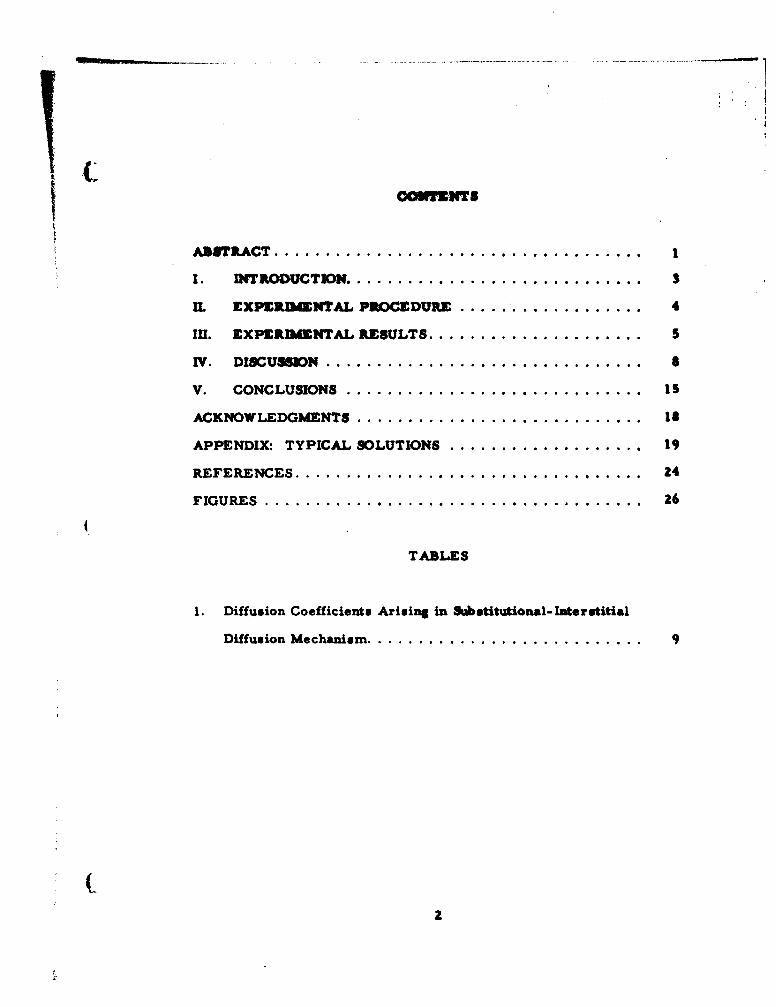
GOOWUGTS
ABSUTRACT .................................... I
I. INT RO UCTION ............................ 3
IL EXPERDENTAL POEDURE ...... 4
III. EXPERIMENTAL RESULTS ..................... $
IV. DISCUSSON ...............................
V. CONCLUSIONS ............................. IS
ACKNOWLEDGMENTS ............................ 18
APPENDIX: TYPICAL SOLUTIONS ................... 19
REFERENCES .................................. 24
FIGURES ..................................... 26
TABLES
1. Diffusion Coefficients Arising in Sdbstitutional-Interstitial
Diffusion Mechanism ........................... 9
!.2
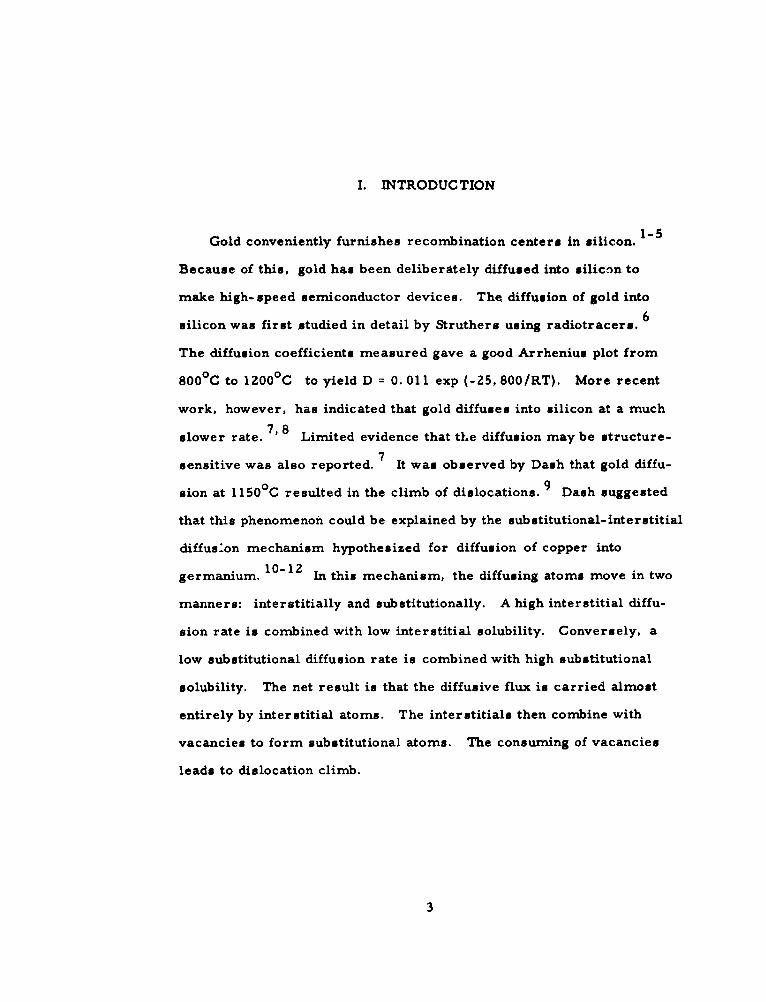
I. INTRODUCTION
Gold conveniently furnishes recombination centers in silicon. 1-5
Because of this, gold has been deliberately diffused into silicon to
make high-speed semiconductor devices. The diffusion of gold into
silicon was first studied in detail by Struthers using radiotracers. 6
The diffusion coefficients measured gave a good Arrhenius plot from
800 0 C to 12000 C to yield D = 0. 011 exp (-25, 800/RT). More recent
work, however, has indicated that gold diffuses into silicon at a much
slower rate. 7,8 Limited evidence that tle diffusion may be structure-7
sensitive was also reported. It was observed by Dash that gold diffu-
sion at 1150 0 C resulted in the climb of dislocations. 9 Dash suggested
that this phenomenon could be explained by the substitutional-interstitial
diffuslon mechanism hypothesized for diffusion of copper into
germanium. 10-12 In this mechanism, the diffusing atoms move in two
manners: interstitially and substitutionally. A high interstitial diffu-
sion rate is combined with low interstitial solubility. Conversely, a
low substitutional diffusion rate is combined with high substitutional
solubility. The net result is that the diffusive flux is carried almost
entirely by interstitial atoms. The interstitials then combine with
vacancies to form substitutional atoms. The consuming of vacancies
leads to dislocation climb.
3
The purpose of the work described in this paper was to determine,
quantitatively, the mechanism of gold diffusion into silicon. Measure-
ments of the diffusion were carried out from 7000 C to 13000 C usingradiotracer Au and also Au 1 9 9 . Almost 100 wafers were diffused,
including dislocation-free Czochralski silicon and floating- zone
material (having about 104 dislocations/cm r), high and low resistivity
n- and p-type silicon, and previously-diffusion-doped samples. 13
The substitutional-interstitial mechanism was verified, and the param-
eters involved were determined. Values were determined for inter-
stitial gold solubility, interstitial gold diffusion coefficient, substitu-
tional gold diffusion coefficient, and the self-diffusion rate of silicon.
II. EXPERIMENTAL PROCEDURE
The experimental techniques used in this work are reported else-
where in much greater detail than is attempted here. 14 Both (111)
floating-zone grown silicon of about 104 dislocations/cm and dislocation-
free (100) Czochralski-grown silicon were used. Comparison with
dislocation-free (111) Czochralski-grown material showed that
crystal orientation did not affect the gold diffusion. Therefore, in the
figures to follow, (100) is taken to mean Czochralski material and (111)
to mean floating-zone material. The specimens were in the form of
thick cylindrical wafers of about 1 to 2 cm in diameter and 0. 5 cm in
thickness. The wafers were parallel-lapped with 13-micron garnet. Extreme
4
care was taken to attain a very clean, oxide-free surface before plating
of the gold which was tagged with radiotracers. Both Au198 and Au199
were used at different times in tagging stable gold-chloride solutions
with radiotracer. Nearly carrier-free Au 19 9 was also used, undiluted
(as supplied by Oak Ridge National Laboratory), in some experiments
to produce very low surface concentrations of gold. The gold was chemi-
plated onto the wafers by injecting a dilute gold chloride solution into
hydrofluoric acid on the surface of the wafer. Autoradiographs before
and after diffusion showed that a very uniform layer was obtained (Ref.
14). The wafers were then encapsulated in quartz in an argon atmosphere
and placed in the diffusion furnace controlled to + 20 C for a period of time
ranging from 15 minutes to several days. After diffusion, the capsules
were quenched by placing them on a massive brass block. Excess sur-
face activity was removed by dissolving the gold with aqua regia. Count-
ing was then begun using a Geiger-Muller tube. Counting accuracy was
usually on the order of a few percent. A collimator on the wafer was used
to eliminate edge effects and non-parallelism. Thin layers were removed
using a high precision machine with fine silicon-carbide paper. Thick-
nesses were measured by a Mikrokator and by a Mettler microbalance to
about 5 X 10" 5 cm. Best results were obtained by counting the wafers
rather than the paper. The counting rate versus distance was converted
to a concentration profile, using the techniques described in Ref. 14.
III. EXPERIMENTAL RESULTS
The net results of the experiments were plots of gold concentration
versus distance into the silicon. The initial experiments were performed
between 800 0 C and 1100 0 C on dislocation-free silicon. The diffusion was6
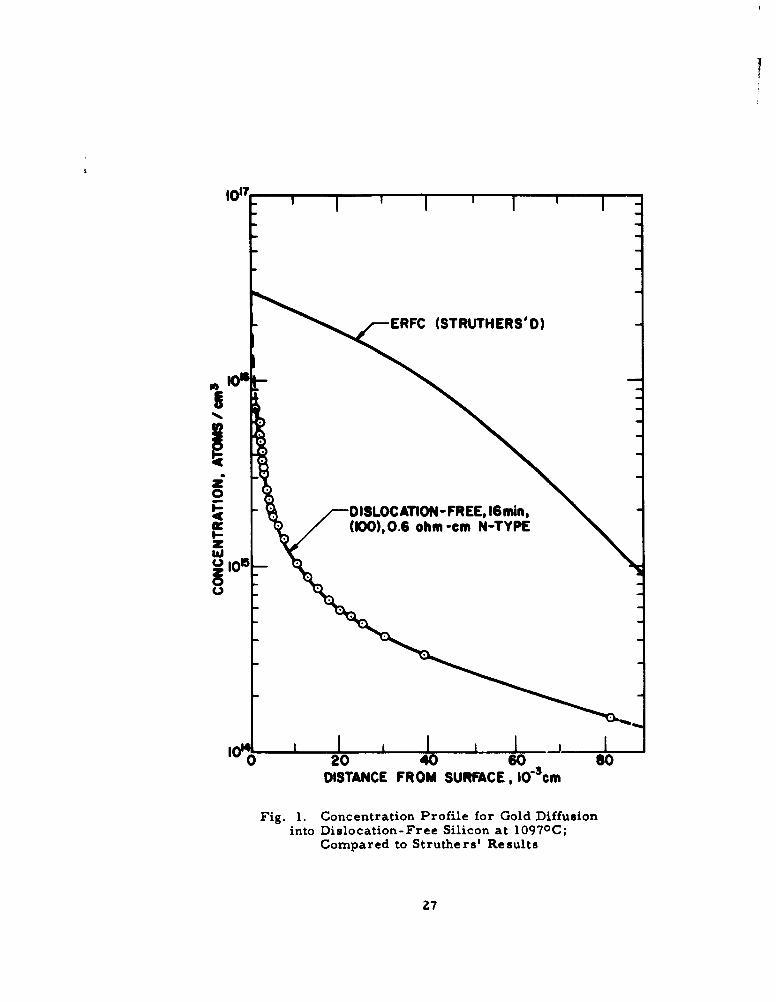
much slower than reported by Struthers, as shown in Fig. 1. In addition,
the concentration profiles did not remotely resemble a complementary-
error function distribution, which would be expected for a saturated sur-
face condition with a constant diffusion coefficient. It was found, however,
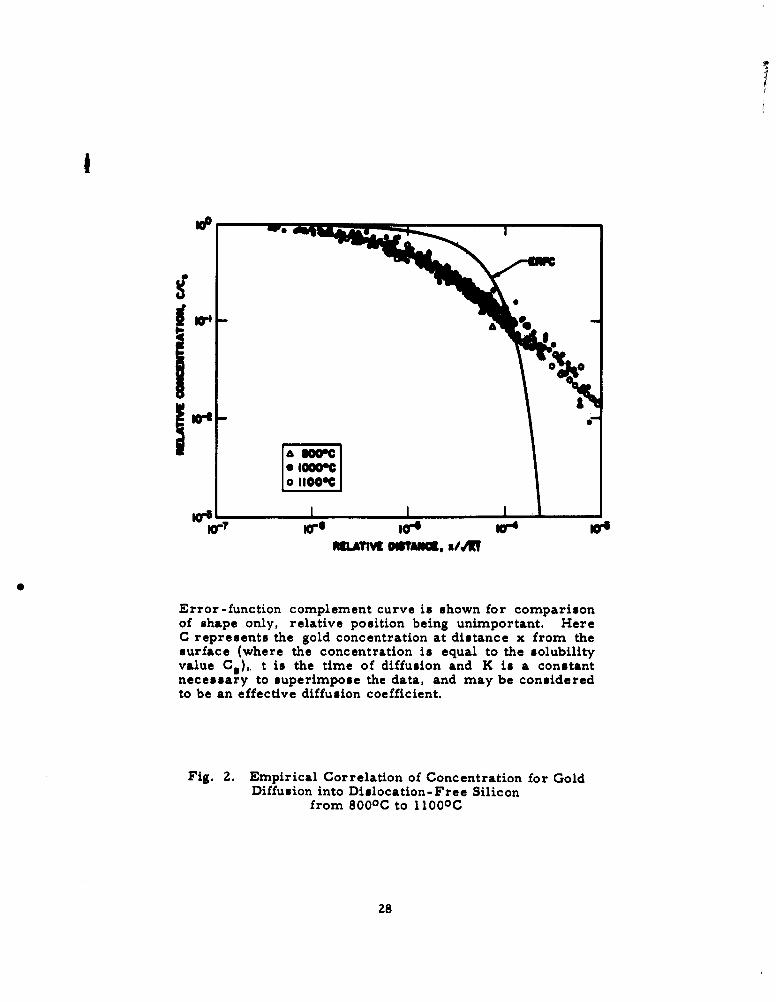
that when plotted on log-log paper the profiles were all nearly identical.
An empirical curve of the results is shown in Fig. 2. An interesting ob-
servation is that the portion of this curve from a concentration of about
10 to 98 percent of the solubility gives a very good straight-line plot of
log concentration versusvl' 7 "t. The values of K for various materials and
diffusion conditions are given in greater detail in Ref. 14. The effect of
high prior doping with n- and p-type impurities is also discussed in Ref. 14.
Phosphorous-diffused layers with high surface concentrations were found
to both hinder the gold diffusion rates and to increase the gold solubilities.
Further experiments revealed that the diffusion rates were higher
when floating-zone silicon was used than when dislocation-free silicon was
used. It was also found that the ideal error-function complement profile
was obtained for high temperatures (1300 0 C), Fig. 3, and for very long dif-
fusion times at lower temperatures (700 0 C), Fig. 4. In Fig. 3, note the
evidence of out-diffusion within 10- 3 cm of the specimen surface. This
out-diffusion is caused by reduced solubility during cooling from the
6

diffusion temperature at the end of the run. As would be expected, the out-
diffusion was more severe in the high-dislocation-density silicon. Figure 3
also shows Gaussian distributions obtained under conditions of very low
surface concentration, designated C. F. n the figures (for nearly carrier-
free radiotracer). It was possible to obtain Gaussian distributions at
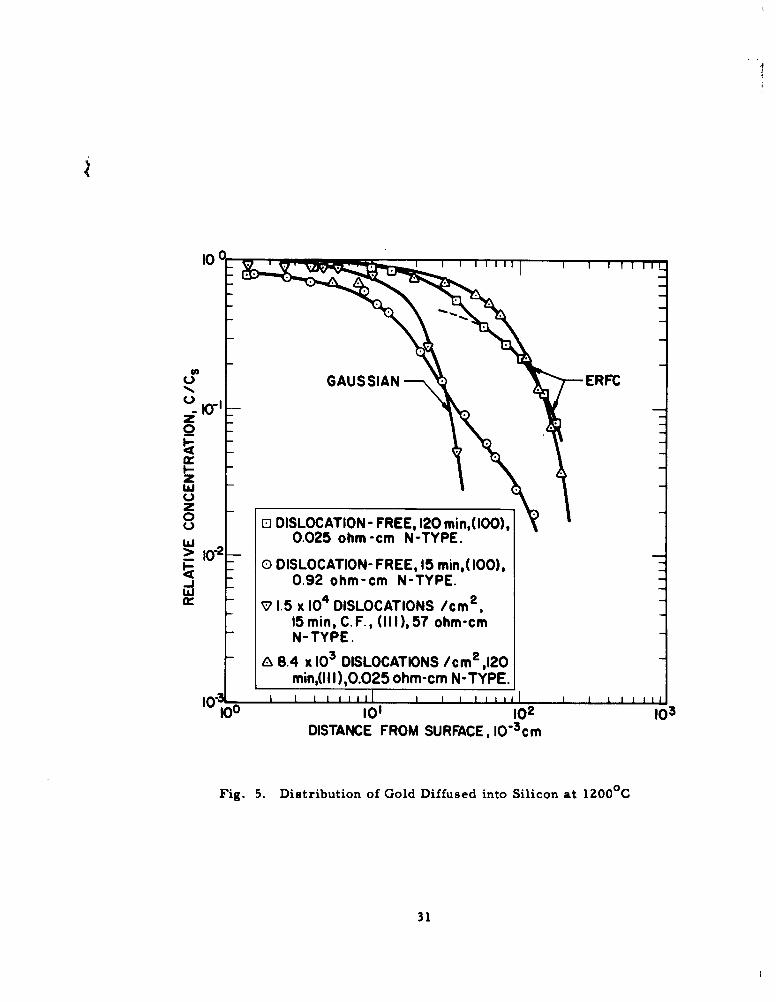
1200 0 C, Fig. 5, and even at 10000C under conditions of very low surface
concentrations and high dislocation density. Figure 5 also shows that the
diffusion profiles for dislocation-free silicon had already deviated from
ideal and were approaching those of Fig. 2. Figure 6 shows typical con-
centration profiles obtained for diffusion at 1100 0 C. Note that even the
profiles for the (111) floating-zone silicon deviated from the ideal error-
function complement at 11000C.
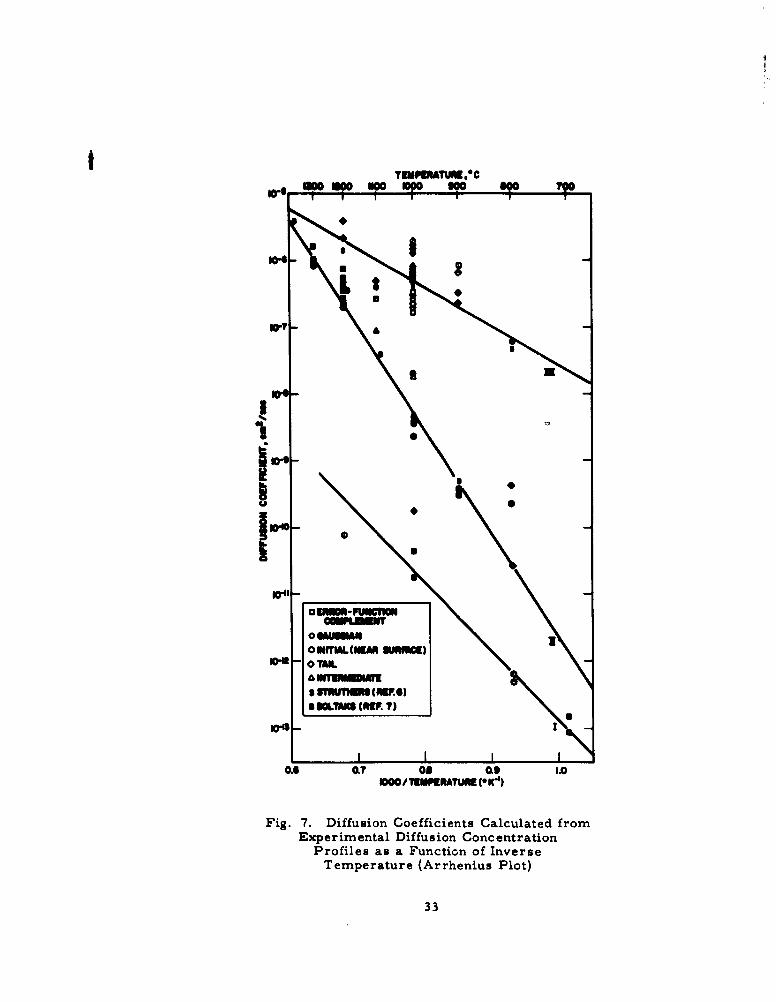
From the foregoing results, diffusion coefficients were calculated and
are shown in Fig. 7 as log D versus l/T (an Arrhenius plot). Calculation
of diffusion coefficients for the error-function complement (erfc) and
Gaussian-shaped profiles were easily obtained by superimposing log-log
plots of these curves on the data. The more complex experimental profiles
were analyzed by similarly superimposing on a log-log erfc plot those data
points which seemed to fit. Many of the profiles, for example, had erfc
tails, as illustrated in Fig. 6. The erfc tails at 800 C and 9000C were
much more pronounced than in Fig. 6. Extrapolation of the erfc fit to the
tails back to the surface of the sample also gave values for a solubility.
As will be seen later, these tails are believed to be caused by interstitial
diffusion alone. Hence, the extrapolated surface concentration is believed
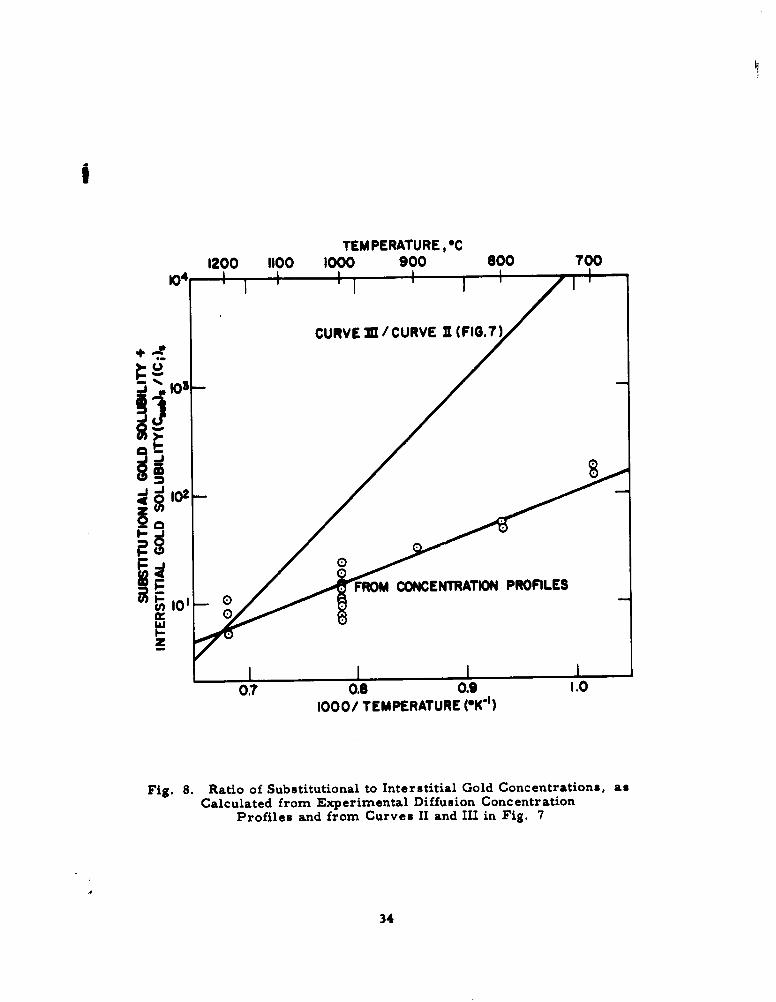
to be the interstitial gold solubility. The ratio of total gold solubility to
7

the interstitial gold solubility is given in Fig. 8, where it in compared
with values obtained from calculations using data in Fig. 7. Because
the interstitial solubility is so much lower than the substitutional solu-
bility, the substitutional solubility is very nearly equal to the total gold
solubility. Fitting the erfc curve to the rest of the data of complex pro-
files likewise gave diffusion coefficients, shown in Fig. 7. The diffusion
coefficients given by Boltaks7 and Struthers6 are also shown in Fig. 7.
IV. DISCUSSION
In attempting to determine the best mechanism for gold diffusion in
silicon based on the experimental data, we will assume a substitutional-
interstitial process and analyze the data on this basis. If the results
are reasonable, this can be taken as strong evidence supporting the
assumed mechanism.
The various types of diffusion coefficients which can arise with the
assumed mechanism are summarized in Table 1. The method of deri-
vation is illustrated in the Appendix.
8
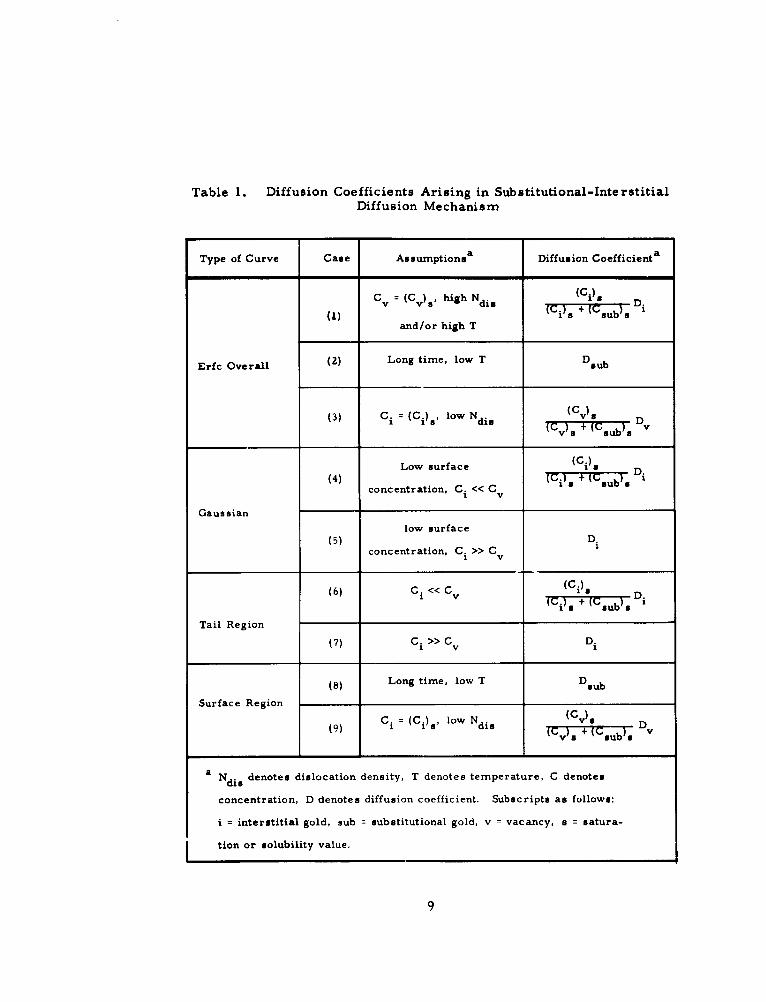
Table 1. Diffusion Coefficients Arising in Substitutional-InterstitialDiffusion Mechanism
Type of Curve Case Assumptionsa Diffusion Coefficienta
ihN (C.)sGv = (CV)s, high Ndie D(1) {i~s +{sub~s
and/or high T
Erfc Overall (2) Long time, low T Dsub
(3) Ci = (Ci)s, low N die D(1v) + (U sub)s v
Low surface (C.)1 Dconcentration, C. << C
1 v
Gaussian
low surface(5) D.
concentration, C. >> C1 V
(6) C. << C (C.)D
1 v D + (Usub) i
Tail Region
(7) Ci >> Cv Di
(8) Long time, low T Dsub
Surface Region lawN(Cv)
(9) Ci = (Ci) , low Ndig (CV)+ vvs-Ta sub)s
aNdis denotes dislocation density, T denotes temperature, C denotes
concentration, D denotes diffusion coefficient. Subscripts as follows:
i = interstitial gold, sub = substitutional gold, v = vacancy, s = satura-
tion or solubility value.
9
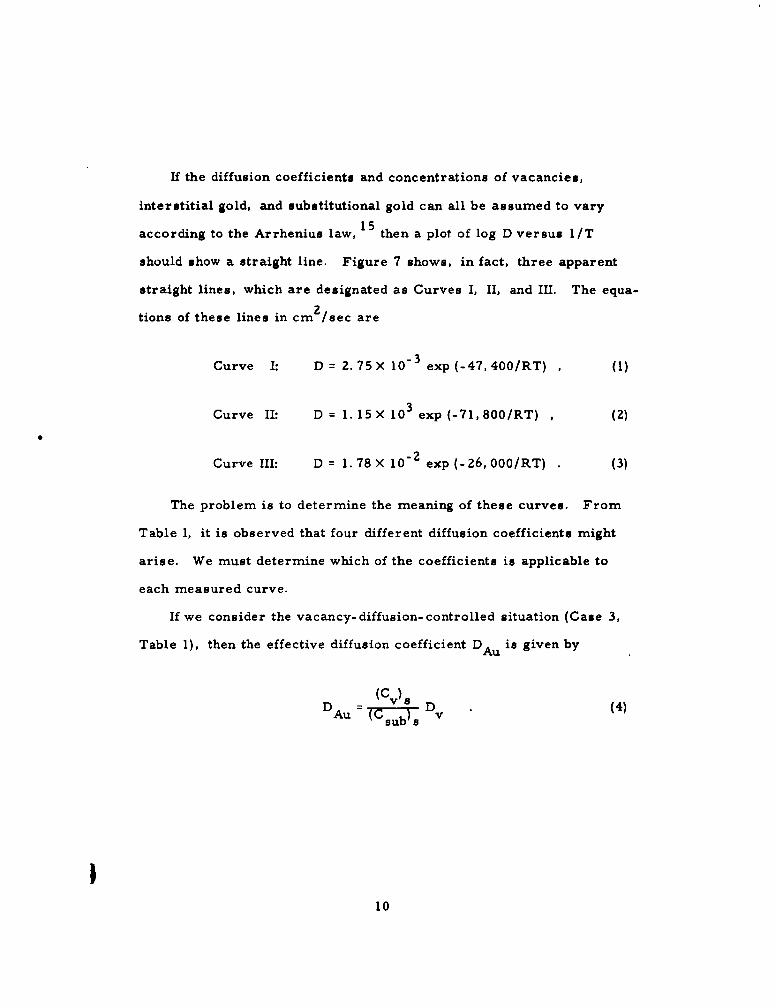
If the diffusion coefficients and concentrations of vacancies,
interstitial gold, and substitutional gold can all be assumed to vary
according to the Arrhenius law, 15 then a plot of log D versus lI/T
should show a straight line. Figure 7 shows, in fact, three apparent
straight lines, which are designated as Curves I, II, and III. The equa-
tions of these lines in cmn2 /sec are
Curve I: D = 2.75X 10⁻³ exp (-47, 400/RT) , (1)
Curve II: D = 1. 15 X 103 exp (-71,800/RT) , (2)
Curve III: D = 1.78 10- 2 exp(-26, 000/RT) (3)
The problem is to determine the meaning of these curves. From
Table 1, it is observed that four different diffusion coefficients might
arise. We must determine which of the coefficients is applicable to
each measured curve.
If we consider the vacancy-diffusion-controlled situation (Case 3,
Table 1), then the effective diffusion coefficient DAu is given by
(Cv)s
DAu -- (CV)s Dv (4)sub s
10

Here, it is assumed that (Cv)s < (C sub), which is reaonable. Note,
however, that
(C) Dv v (Xs ()Dv
Dd (Wwhere (X V) is the equilibrium atom fraction of vacancies in silicon,
N is Avogadrots number, p is the density of silicon, and W is the
atomic weight of silicon. The term (Np/W) is actually the number of
silicon atoms per unit volume.
Substituting Eq. (5) into Eq. (4) and solving for D sd we obtain
Dsd s (ub) DAu (Wf) (6)
If it is assumed that (Csub)s >> (Ci)s, which is in fact shown in Fig. 8,
then the equilibrium substitutional gold solubility (C sub) s is very nearly
equal to the total gold solubility, as measured by Collins et al. 3 and by6
Struthers. With this, D sd can be calculated using Eq. (6) and the
curves I, II, and III, in turn. The true result should be approximately
equal to the diffusion coefficients known for substitutional elements in
silicon, and, in particular, for the Group IV elements, germanium and
tin.
11

ICollins' data 3 for gold solubility can be given by
(C sub)s = 8. 15 X 1022 exp (-40,600/RT) (gold atoms/cmr3 Si) . (7)
This is particularly accurate below 12000C.
Substituting Eq. (7) and Eq. (1), (2), and (3), in turn, into Eq. (6),
we obtain, respectively:
Curve I: Dsd = 4. 32 X 10-3 exp (-88, O00/RT) , (8)
Curve II: Dsd = 1.81 X 10⁴ exp(-1l2,400/RT) , (9)
Curve III: Did 2.8 X 10'2 exp (-67, 200/RT) (10)
As shown in Fig. 9, the silicon self-diffusion coefficient deter-
mined from Curve II, Eq. (9), is very close to the diffusion coefficients
of bismuth, 16-18 tin, 19 germanium, 17,18 and fairly near that for
indium16 in silicon.
The gold solubility given by Struthers6 differs from the data of
Collins, used above. Struthers found, approximately,
(Csub)s = 3 X 10²¹ exp (-15,300/RT) (11)
12
This gives, for Curve II:
Dsd = 6.63 X 10 exp (-87, 100/RT) (12)
This is also shown in Fig. 9. It appears not to give as good an agree-
ment as that found using the solubility data of Collins. Although this
is not entirely certain, we shall tentatively conclude from this that
Collins' data for gold solubility is better than that of Struthers.
On the basis of the above calculations and comparisons, we con-
clude that Curve II of Fig. 7 represents the vacancy-controlled diffu-
sion
(Cv~Vs D
The only other possible explanation is that this curve is, instead,
(C.)s( D.
(Csub) s
In such an event, Curve III would have to represent D.. The ratio of1
values on Curve III to those on Curve II must then yield values for
(Csub)s/(Ci)s if this is true. These values are to be compared with
the experimental ratios given in Fig. 8. Because there is virtually
no agreement,we have shown that Curve II cannot represent the
interstitial-controlled diffusion. Therefore Curve II must represent
13
(CV),VUDv
as originally concluded. Curve III must be
(Ci) D.
It cannot be Di because, as we have just shown, this would necessitate
a lower curve for
(C.)Tr- iDi
which is not present. It cannot be Dsub because the values are far too
large for substitutional diffusion in silicon. Using the experimental
results in Fig. 8 for (Csub)s /(C )s (as determined from the tails on
the concentration profiles) together with Eq. (3) for Curve III, we find
that
Di = 2.44 X 10⁻⁴ exp (-8,900/RT) (13)
From this equation we calculate that, at 12000C, D. : 1.3 X 10⁻⁵ and,1
at 10000C, D. = 7.5 X 10- 61
14
This compares very well with the interstitial diffusants: lithium,20
nickel, 20 copper, 21-23 helium, 24 and hydrogen24 in silicon.
Now only Curve I remains. By the foregoing process of elimina-
tion and by virtue of the low values, Curve I must represent D sub' the
pure substitutional diffusion.
As a final point, it is worthwhile to re-examine the older data for
gold diffusion in silicon. Struthers' data6 are shown in Fig. 7 as the
S-points and Boltaks'7 by B-points. Struthers' data fall very nearly
on Curve III for interstitial-controlled diffusion. From this, it is sur-
mised that the original experimental conditions were probably as
follows: very low perfection silicon with more than 103 dislocations/2
cm and/or a surface concentration below saturation. Struthers has,
in fact, verified that both of these were his experimental conditions. 25
Boltaks' data, on the other hand, fall very nearly on the vacancy-
controlled- diffusion Curve II, indicating that he used saturated surface
conditions.
V. CONCLUSIONS
It has been determined that gold diffuses into silicon by a mecha-
nism analogous to that of copper diffusing into germanium. Movement
of gold atoms primarily involves an interstitial diffusion, controlled
by the concentration of vacancies (which are necessary to attain the
higher substitutional concentrations). Such a complex mechanism often
15
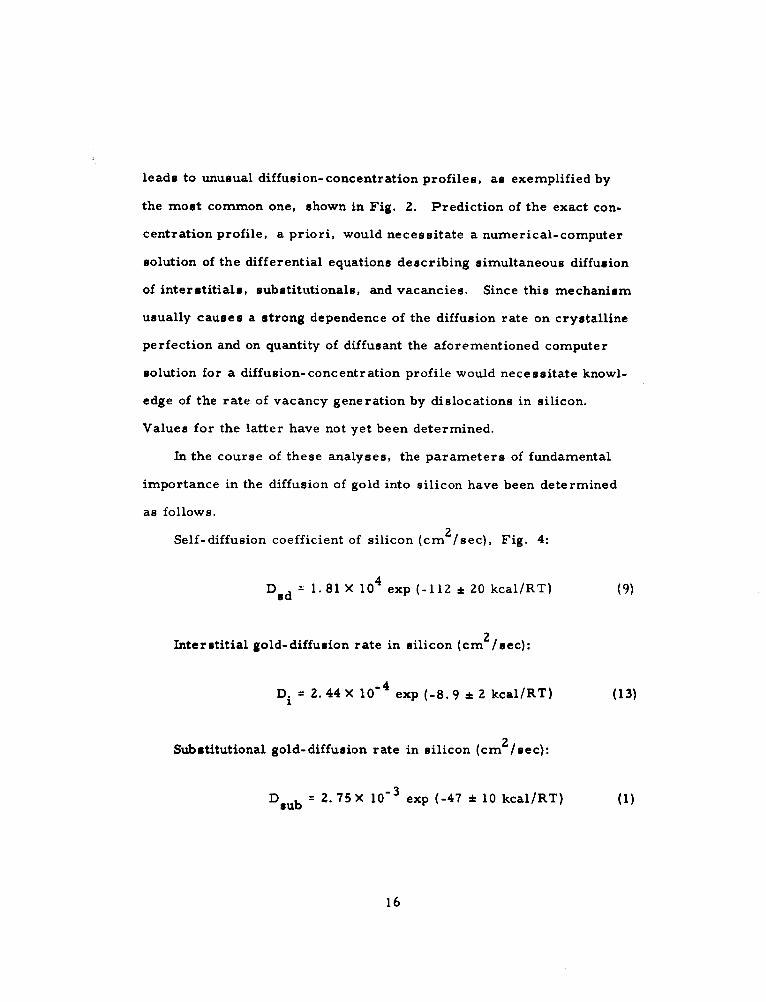
leads to unusual diffusion- concentration profiles, as exemplified by
the most common one, shown in Fig. 2. Prediction of the exact con-
centration profile, a priori, would necessitate a numerical-computer
solution of the differential equations describing simultaneous diffusion
of interstitials, substitutionals, and vacancies. Since this mechanism
usually causes a strong dependence of the diffusion rate on crystalline
perfection and on quantity of diffusant the aforementioned computer
solution for a diffusion-concentration profile would necessitate knowl-
edge of the rate of vacancy generation by dislocations in silicon.
Values for the latter have not yet been determined.
In the course of these analyses, the parameters of fundamental
importance in the diffusion of gold into silicon have been determined
as follows.
Self-diffusion coefficient of silicon (cm 2/sec), Fig. 4:
D ad 1.81 X 10⁴ exp (-112 * 20 kcal/RT) (9)
Interstitial gold-diffusion rate in silicon (cm /sec):
Di = 2.44 X 10⁻⁴ exp (-8.9 * 2 kcal/RT) (13)
Substitutional gold-diffusion rate in silicon (cm 2/sec):
Dsub 2.75 X 10⁻³ exp (-47 * 10 kcal/RT) (1)
16
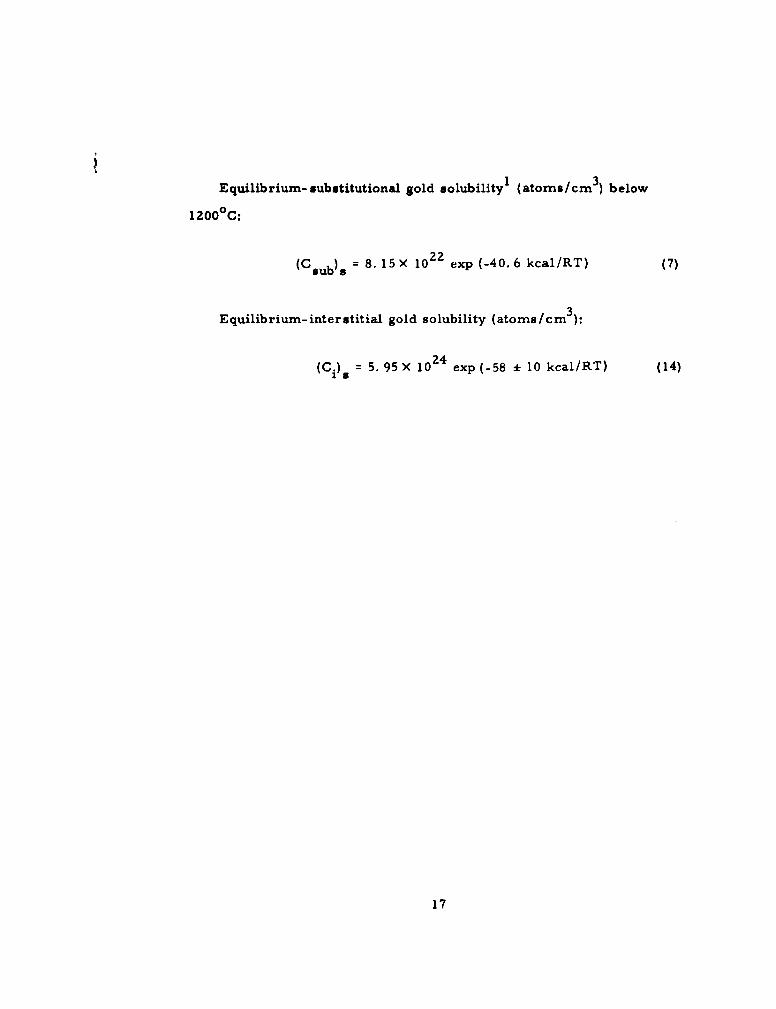
Equilibrium- substitutional gold solubilityI (atoms/cm 3 ) below
1200°C:
(Csub)s = 8. 15X 1022 exp (-40. 6 kcal/RT) (7)
Equilibrium- interstitial gold solubility (atoms/cm 3):
(Ci)s = 5.95 X 1024 exp (-58 * 10 kcal/RT) (14)
17
IACKNOWLEDGMENTS
The authors thank D. Forbes and 0. Hudson for their great
assistance with the experimental work which was accomplished at
Pacific Semiconductors, Inc. Our thanks also to Professor
G. Pearson of Stanford and to Dr. B. Goldstein of RCA for their
advice regarding construction of the precision lapping machine.
18
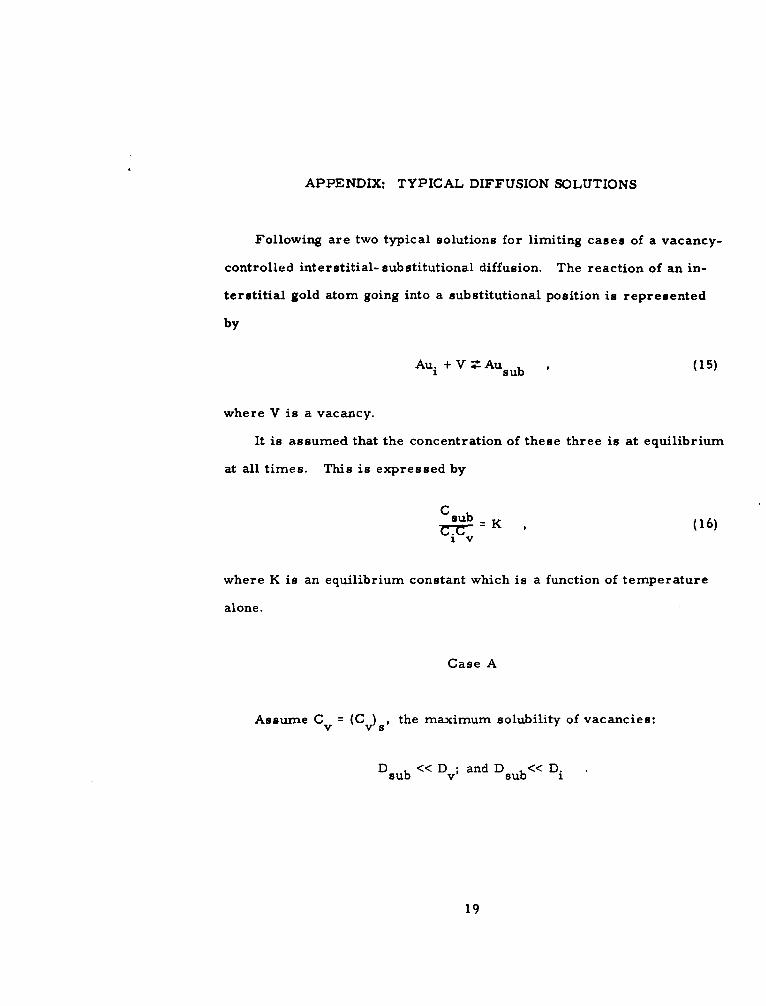
APPENDIX: TYPICAL DIFFUSION SOLUTIONS
Following are two typical solutions for limiting cases of a vacancy-
controlled interstitial- substitutional diffusion. The reaction of an in-
terstitial gold atom going into a substitutional position is represented
by
Aui +V -Ausub ' (15)
where V is a vacancy.
It is assumed that the concentration of these three is at equilibrium
at all times. This is expressed by
Csub-C -- K
(16)I v
where K is an equilibrium constant which is a function of temperature
alone.
Case A
Assume Cv = (Cv ) s, the maximum solubility of vacancies:
Dsub << Dv; and Dsub<< Di
19

The first condition holds for a very high dislocation density (since
vacancies are produced at dislocations) or where the gold concentra-
tion is so low that few vacancies are consumed. The gold concentra-
tion is also very low for the first gold atoms that penetrate deeply into
the crystal. The first condition may also be true even in dislocation-
free crystals at high temperatures where the number and rate of gener-
ation of vacancies is greater. The second and third conditions, which
state that the substitutional atoms are relatively stationary, are known
to be at least approximately true.
The expression for interstitial diffusion is
a 2 1 Ci8 subS= + -Tt- (17)
ax
But, from Eq. (16), we know that
Csub : KCi (CV) (18)
Therefore, Eq. (17) becomes
DaC. =1 [C.I I = K 11
For constant interstitial surface concentration, the solution to this is
C. x I 1 (20)
S2 Defft]
20
Iwhere
D.(D 1
(Di)eff I + K(CV) (
(C.) D.is + (Csub~s
Using the equilibrium expression, Eq. (18), we find that
Csub = (Csub)s erfc2 (Di)t] 12(22)
Hence, the effective diffusion coefficient for gold is
(C i)s (C.)sDi ='' Di (23)
i bs + (C sub)s
assuming
(C. «(C
(Ci)s sub)s
Case B
Assume D. >> Db; then
ac. 8C1i vDi -x>> Dv -x (24)
and that the silicon is dislocation free.
21
In essence, it is assumed that only the interstitial gold atoms
move, so that the vacancy concentration is the saturated value reduced
by the number of substitutional gold atoms, i. e. ,
Cv = (Cv)s - C sub (25)
Substituting this into Eq. (6) we find that
Csub = K (26)
Ti I (Cv)s - Csub]
Differentiating with respect to time, there results
8 Csub K(CV) a K 2 Ci(Cv)s 8Ci
5 LT i (1 + K Ci)(J
Substituting this into Eq. (17), we obtain
82 Ci 8Cii _ (28)
ax 1
where
(I + KCi)2
f(C.) - 1 (29)(I + KCi) + K (CV)(
22
For constant interstitial surface concentration, the solution to this is26
Ci (Ci)8 ,IZ (30)[( (D i) efl]
where
(Di)eff = f(Ci) Di
This, in turn, gives an effective diffusion coefficient for the total gold
content which is a function only of concentration. This is not much
help quantitatively but indicates that C/C can be a single function of
x/'-t at a given temperature (as was found experimentally in Fig. 2)
and still conform to the present mechanism.
23

REFERENCES
1 G. Bemski, Phys. Rev. 111, 1515 (1958).2 1R. 0. Carlson, J. Appl. Phys. 29, 1001 (1958).3 C. B. Collins, R. 0. Carlson, and C. J. Gallagher, Phys. Rev.
105, 1168 (1957).4 W. D. Davis, Phys. Rev. 114, 1006 (1959).5 A. E. Bakanowski and J. H. Forster, Bell Syst. Tech. J. 39,
87 (1960).6 J. D. Struthers, J. Appi. Phys. 27, 1560 (1956) and J. Appi.
Phys. 28, 516 (1957).7 B. I. Boltaks, G. S. Kulikov, and R. S. Malkovich, Soviet Physics-
Solid State 2, 2134 (1961).8 1R. Logan, A. L. Harrington, and M. F. Millea, IRE Device
Res. Conf. (June 1961).9 W. C. Dash, J. Appl. Phys. 31, 2275 (1960).
10A. G. Tweet and C. J. Gallagher, Phys. Rev. 103, 828 (1958).1 1 C. S. Fuller and J. A. Ditzenberger, J. Appl. Phys. 28, 401
(1957).
12F. C. Frank and D. Turnbull, Phys. Rev. 104, 617 (1956).
13The effects of variations in resistivity and prior doping are
discussed in a paper by T. J. LaChapelle and W. R. Wilcox, Ref. 14.
14T. J. LaChapelle and W. R. Wilcox, submitted to J. Electro-
chem. Soc.
24
I
REFERENCES (continued)
1 5For ideal dilute solid solutions of the retrograde type,
F. A. Trumbore, Bell Syst. Tech. J. 39, 205 (1960), has shown that
log C should be a linear function of 1/T.1 6 C. Fuller and J. Ditzenberger, J. Appl. Phys. 27, 544 (1956).1 7 D. A. Petrov, J. M. Schaschkow, and A. S. Belanovski, contri-
bution to Semiconductors and Phosphors, edited by M. Schon and H. Welker
(Interscience Publishers, Inc. , New York, 1958), p. 652.1 8 D. A. Petrov, J. M. Schaschkow, and I. P. Akimchenko, Chem.
Abst. 54, 17190b (1960).1 9 M. F. Millea, "Effect of Heavy Doping on the Diffusion of
Impurities in Silicon, " Ph. D. Dissertation, U. Illinois, Urbana, 1959,
AFDSR-TN-59-460, ASTIANo. AD-215,265.
20C. Fuller and J. Severiens, Phys. Rev. 92, 21 (1954).
21B. I. Boltaks and I. I. Sozinov, Soviet Physics-Solid State 3,
636 (1958).2 2 J. A. Burton, Physica 20, 835 (1954).2 3Fuller, Struthers, Ditzenberger, and Wolfstern, Phys. Rev. 93,
1182 (1954).2 4 A. van Wieringen and N. Warmoltz, Physica 22, 849 (1956).
2 5 J. D. Struthers, private communications (June 26 and July 3,
1962), Bell Telephone Laboratories, Murray Hill, N. J.
26J. Crank, The Mathematics of Diffusion, (Oxford, Clarendon Press,
1956), p. 148.
25
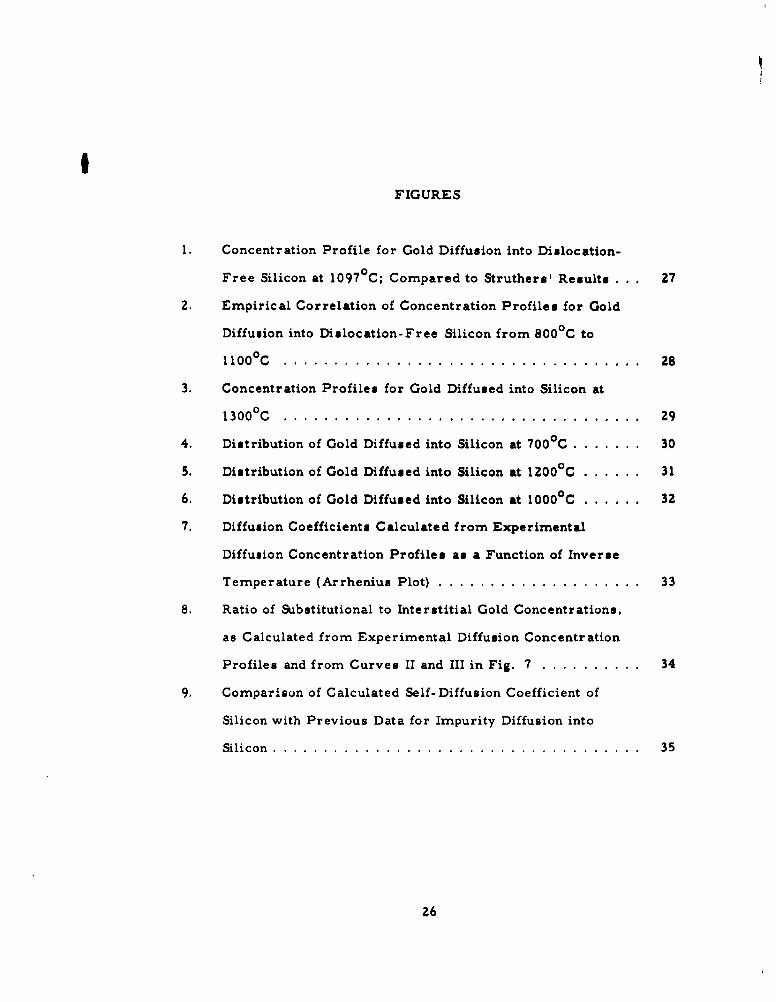
FIGURES
I. Concentration Profile for Gold Diffusion into Dislocation-
Free Silicon at 1097°C; Compared to Struthers' Results . . . 27
2. Empirical Correlation of Concentration Profiles for Gold
Diffusion into Dislocation-Free Silicon from 800 C to
1100°0 C .......................................... 28
3. Concentration Profiles for Gold Diffused into Silicon at
1300°C ........... ................................... 29
4. Distribution of Gold Diffused into Silicon at 700 C ....... .... 30
5. Distribution of Gold Diffused into Silicon at 1200 0 C ...... ... 31
6. Distribution of Gold Diffused into Silicon at 1000°C ...... ... 32
7. Diffusion Coefficients Calculated from Experimental
Diffusion Concentration Profiles as a Function of Inverse
Temperature (Arrhenius Plot) ....... .................... 33
8. Ratio of Substitutional to Interstitial Gold Concentrations,
as Calculated from Experimental Diffusion Concentration
Profiles and from Curves II and III in Fig. 7 .............. 34
9. Comparison of Calculated Self-Diffusion Coefficient of
Silicon with Previous Data for Impurity Diffusion into
Silicon .......... .................................... 35
26
1017
(STRUTHERS'D)
0
DISLOCATIONt-FREE, 16min,(100),0.6 ohm-cm N-TYPE
zw01015
0 20 40 60 s0
DISTANCE FROM SURFACE, 10"3cm
Fig. 1. Concentration Profile for Gold Diffusioninto Dislocation-Free Silicon at 10970C;
Compared to Struthers' Results
Z7
[4
io-of
W?- W- 0 040UCLATIW OISTArIOS, x/SY
Error-function complement curve is shown for comparisonof shape only, relative position being unimportant. HereC represents the gold concentration at distance x from thesurface (where the concentration is equal to the solubilityvalue C 3 ),. t is the time of diffusion and K is a constantnecessary to superimpose the data, and may be consideredto be an effective diffusion coefficient.
Fig. 2. Empirical Correlation of Concentration for GoldDiffusion into Dislocation-Free Silicon
from 800 0 C to 1100 0 C
28

!V
100
ERFC
"I01 GAUSSIAN2
o -
z 0 DISLOCATION-FREE,15 min, C. F,WU (100),2.5 ohm-cm P-TYPE.z0U 0 DISLOCATION-FREE,60min,(I00),>w 2.0 ohm-cm P-TYPE.> IO-2 17 61.6 x 10⁴ DISLOCATIONS/cm2 ,15min,
. - C.F, (111), 2.0 ohm-cm, P-TYPE.
- 7 1.4 x10 4 DISLOCATIONS/cm 2 ,60min,(111),2.3 ohm-cm P-TYPE.
"100 I01 102 103
DISTANCE FROM SURFACE, 10-3 cm
C. F. denotes that undiluted radiotracer (Au199 as supplied) was usedin plating surface before diffusion.
Fig. 3. Concentration Profiles for Gold Diffused into Silicon at 1300 0 C
29

!I
100
ER PC
i0I
L5 X 104 DISOCATIONS /am3,MO2M60mi,MN), a ohm-amN -TYPE.
IO' 1O 40O
DISTANCE FROM SURFACE, IO"3cm
Fig. 4. Distribution of Gold Diffused into Silicon at 700 0 C
30
I0 C -_' ' ' " 1 ' ' ' ' "_
0,
U
-'0O-I
z0
QG)DSOATSION -FEE 120ERFC10
wu 0.025 ohm-cm N-TYPE.>-- 102 0 DISLOCATION- FREE, 15 min,(lO0),_ - 0.92 ohm-cm N-TYPE.
I-
w
n- - 171.5 x 10⁴ DISLOCATIONS /cm,15 rain, C. F., (I111), 57 ohm-cm
- N-TYPE.- 0 8.4 x 10³ DISLOCATIONS /cm2,120
min,(ll ),0.025 ohm-cm N-TYPE.I0 Il I I 1 11 1 SL CA IO -F EE IJ_ m i, 0 , I I
000 o 01 -02 N0YDISTANCE FROM SURFACE, 10"mcm
Fig. 5. Distribution of Gold Diffused into Silicon at 1200°0C
31

E
0
0
%4. U
21ozU
21_
*1 "ago
"". 2
$0/:DN~l.VW.L3*NO33AlJIA.3
I I32
TIOPIRATUAC
TL,
o emmaegI•
U O.Th02 fL9 1.0
O@/TgMMRtATUE (K4)
Fig. 7. Diffusion Coefficients Calculated fromExperimental Diffusion Concentration
Profiles as a Function of InverseTemperature (Arrhenius Plot)
33
TEMPERATURE,*C
1200 1100 1000 900 800 700
CURVE Zn/CURVE I (FIG.?)
I0z--
FROM CONCENTRATION PROFILES
z
0. 0.S 0.9 1.01000/ TEMPERATURE (OK'1)
Fig. 8. Ratio of Substitutional to Interstitial Gold Concentrations, asCalculated from Experimental Diffusion Concentration
Profiles and from Curves II and III in Fig. 7
34

I
TMPIoATURI, Cm oo =0 9o 00 sw
finCfi\ of DSSic w th'Prv ubs D\\
''
S_ ( I-
~\
35\
DO.7I O.Iub) O.
IOOOTIMPERATURE (*K")
Fig. 9. Comparison of Calculated Self-DiffusionCoefficient of Silicon with Previous Data
for Impurity Diffusion into Silicon
35

z
~341
s~'s
-A0
U U U
.0 --- 0 -'a
0 A,~0.) 0 g &W "
k ~ . 0N '. wk . 0 - N
Vi~u- k- S
0 0 a0. 6b' ..
0"4o ... 4 N~0~X d
-o z -a - .-
~~~f j i o..
iý. X.
BT
X -0
.• "= _ . .q,
•,• o- .- -
U • .2
• ::j4I wo.; =.=.
•' 2. eT• 'yr--
ja V a1 PO i
~OV.1 41 :!,o~
'o0
UNo 6-0 0