unclassified - defense technical information center · results obtained by those who have applied...
TRANSCRIPT

UNCLASSIFIED
AD 2 9 4 5 7 6
ARtMED SERVICES TECHNICAL INFORMATION AGENCYARLINGTON HALL STATIONARLINGTON 12, VIRGINIA
UNCLASSIFIED

NOTICE: When government or other drawings, speci-fications or other data are used for any purposeother than in connection with a definitely relatedgovernment procurement operation, the U. S.Government thereby incurs no responsibility, nor anyobligation whatsoever; and the fact that the Govern-ment may have formnulated, furnished, or in any waysupplied the said drawings, specifications, or otherdata is not to be Fegarded by implication or other-wise as in any manner licensing the holder or anyother person or corporation, or conveying any rightsor permission to manufacture, use or sell anypatented invention that may in any way be relatedthereto.

.J- --- 17
S~R 217Techni, I Report :::::::::::::::::::::::::::T HE E F FECT OF S A LT I N C ON CR ET E
S:::::::::::::::::::::::::....... :::.. ::....:
,.°O°. ... .... O.°o°°...-.-° ..°
•:•: ...................
r• iiiiil~iiiiiiii~iiiiiii~ii...................S.......... ... °.......-......°- . .-. o O.°. °°.. .. -..
..... °°°-°°.o.-... .. •.... ...
....... °.-.°° o .°.°.° °.. ... -•.°. °. °o.-... .. - °.-..... ...
SUc.NVoCII N IERIG L B RT RSPort Huenerne,..........

THE EFFECT OF SALT IN CONCRETE ON COMPRESSIVE STRENGTH, WATERVAPOR TRANSMISSION, AND CORROSION OF REINFORCING STEEL
Y-R007-05-012
Type C
by
Donald F. Griffin and Robert L. Henry
ABSTRACT
The information reported herein represents basic data about the effects of saltin concrete on compressive strength, water vapor transmission (WVT), and corrosionof the reinforcing steel. Variables included in the study are: (1) water-cement ratio,(2) diameter of specimen, (3) thickness of specimen, (4) percent concentration ofsalts - either sodium chloride or sea-water salts, and (5) environment of specimen -20, 50, or 75 percent relative humidity at 73.4 F.
The investigation, partially carried out utilizing the NCEL-developed wet cup,has been in progress for approximately 1-1/2 years. An additional study of experi-mental walls subjected to sea-water spray was begun about one year ago and willcontinue for several years.
Sea-water salts at one time were thought to be detrimental to reinforcedconcrete, but this study shows that, if controlled, some salt is beneficial. A gainin strength, lower values of WVT, and no significant corrosion of mild steel arerealized when a salinity of 25 grams of salt per kilogram of solution is establishedin the mixing water. Other results reveal that an electrical-resistance corrosion-rate detection probe appears to be a reliable device for measuring the degree ofcorrosiveness of any concrete environment to reinforcing steel; with or without salts,WVT varies directly with the water-cement ratio; thinner concrete specimens havesomewhat higher WVT rates than thicker concrete specimens; with increasing salinities
the effect of thickness upon WVT becomes more pronounced.
Qualified requesters may obtain copies of this report from ASTIA.
The Laboratory invites comment on this report, particularly on theresults obtained by those who have applied the information.

INTRODUCTION
The purpose of the present investigation was to determine the effect of saltspray on portland-cement concrete and to determine the permissible amount of saltin the concrete mix. Specifically, it was desired to develop information about theeffects of sodium chloride and of sea water on the strength and water vapor trans-mission of concrete, and the corrosive effect on the reinforcing steel. A previousinvestigation of water-vapor transmission of plain concrete utilizing the wet-cupsystem has been described by the authors both in a Naval Civil Engineering Laboratoryreport1 and in a Journal of the American Concrete Institute. 2 Although more specificdetails about assembling wet cups with concrete specimens are given in References 1and 2, the reader may obtain a good idea of the wet-cup system by referring toFigures 1i and 14. In all cups, the water in the liquid phase of the cup was distilledwater. All saline waters referred to are.the mixing waters for the concretes. Initially,the vapor phase portion of each cup was flushed out with ambient air.
The previous study employed concrete specimen disks of one diameter and onethickness. In contrast, the study reported herein includes disks of two diameters andof several thicknesses and involves a specimen series with varying concentrations ofsodium chloride and a specimen series with varying concentrations of sea water inthe mixing water. Also included is a unique but direct method for estimating thedegree of corrosiveness of any concrete to reinforcing steel.
A collateral study of small, experimental reinforced-concrete walls to measuretheir durability to marine exposure, particularly as related to corrosion of the re-inforcing steel, was initiated in May 1961 and will extend for several years. Adescription of this phase of the investigation and the observations to date areincluded in this report as a related study.
The figures and tables follow the text.
CONCRETE MIX PROPORTIONS
The concrete mixes were proportioned according to the mix design data ofTable I. San Gabriel aggregate (described in Table I) was used in every case exceptwhere other aggregates are specified. Except for the reinforced_-concrete walls, all

batches had a volume of 2.25 cubic feet, and were mixed in a pan-type mixer, with
the following sequential operations:
1. Add gravel, sand, and cement.
2. Mix dry for 30 seconds.
3. Add water (73 F) in shortest time possible with mixer running.
4. Mix for 150 seconds, for a total mixing time (items 2-4) of 3 minutes.
5. Take slump test: designed for 3 inches; actual slump . . . inches.
6. If slump is too low, add water and mix for 30 seconds.
7. Repeat slump test; final slump . . . inches.
8. Place concrete in molds in ASTM standard manner, except vibrate withspud vibrator.
9. Smooth off tops with wooden float.
10. Cover with metal plates and place in fog room.
11. After 24 hours, strip molds, number cylinders, and place in fog room.
Every effort was made to treat every batch and specimen in identical ways.The fresh concrete was vibrated with a 1-inch spud vibrator in three lifts, instead ofrodding. Each lift was vibrated approximately 2.5 seconds.
Concrete for the walls was mixed in a revolving-drum mixer using a batch ofapproximately 6.0 cubic feet. The mixing procedure was similar to that used aboveexcept that the coral aggregate was saturated-surface-dry when placed in the mixer.
COMPRESSIVE STRENGTH
Sodium Chloride Series
Previous attempts to determine the compressive strength of concrete as a function
of sodium chloride content were not as conclusive as required and made use of datafor batches of concrete made at widely varying times for different purposes. 1 Series
2

of data, such as those shown in Tables Il-a and Il-b, can be satisfactorily obtainedonly by having an adequate supply of uniform materials and by batching in an orderlymanner on successive days using the same personnel for each operation.
Figures 1-a and 1-b show graphically, for two different water-cement ratios,how compressive strength varies with increases in the sodium chloride content of themixing water.* There is a pronounced and unmistakable optimum sodium chloridecontent for maximum compressive strength for each of the water-cement ratios. Itis interesting to note that the optimum sodium chloride content for the two water-cement ratios is not a furction of the ratio of NaC! to cement, as might be expected,but is more nearly a function of salinity (grams of salt per kilogram of solution, °/oo)of the mixing water. The optimum salinity for maximum strength seems to be withinthe range of 30-36°/oo for the two water-cement ratios.
Mixing water of the least salinity used (about 9°/oo) increased the slump froma design of 3 inches to a value of 5 inches. With increasing salinities, the slumpincreased to 8 inches. A constant slump of 3 inches undoubtedly would have requiredless mixing water, with consequently higher compressive strengths.
The rather sharp, abrupt changes in the curves of Figures 1-a and 1-b may bequestioned; however, these changes are what the data indicate as the result of carefulquality control in the fabrication and care of the concrete, which in turn is reflectedby the low standard deviations for the 14-day strengths. Other natural phenomenashowing such abrupt changes in relationships are not unknown.
Compressive strengths for the data in Tables Il-a and Il-b may also be expressedby the following data model involving the various factors observed to affect strength:
S= 7929.7 + 863.7 N - 1428.7 N2 + 326.2 N 3 - 6327.2 W/C
+ 1029.1T - 248.9NT + 12.1N W/C - 1031.3TW/C
+ 379.0 NT W/C
where S = compressive strength, psi
N = sodium chloride by weight of fresh concrete
T = natural logarithm of age in days
W/C = water-cement ratio
* Sodium chloride, U.S.P. granular; F.W. = 58.45, dissolved in the mixing water.
3

This data model was obtained by a least-squares fit to the data in Tables Il-aand Il-b. As an example of the meaning of this formula, consider a case where N is0.6, T is 2.639 for 14 days age, and W/C is 0.444. For this combination of factors,S may be calculated to be 6577 psi and compared with the observed value of 6640 psi.Curves for this data model are compared with observed data plotted in Figure 1-c.
The presentation of this data model is not a rejection of the peaked curves ofFigures 1-a and 1-b. On the contrary, this model should be used only to approximatecompressive strength as a function of the factors given and only within the range ofthe data and under the conditions specified for this experiment.
Sea Water Series
The chemical composition of hypothetical sea water is as follows:
Composition of Sea Water 3 Combinations of Ions in Sea Water4
Ion %o/o Salt 0/00
CI 18.980 NaCI 23.477
so4 2.649 MgCI 2 4.981
HCO3 0.140 Na 2so4 3.917
Br 0.065 CaCI2 1.102
F 0.001 KCI 0.664
H3BO3 0.026 NaHCO 0.192
Na+ 10.556 KBr 0.096
K+ 0.380 H 3BO3 0.026M++
Mg 1.272 SrCl2 0.024
Ca++ 0.400 NaF 0.003
Sr++ 0.0085 Total 34.482
Note: %/oo grams per kilogram of sea water. The salinity (0/%o) ofthis hypothetical sea water is 34.325, as shown in Reference 3.
4
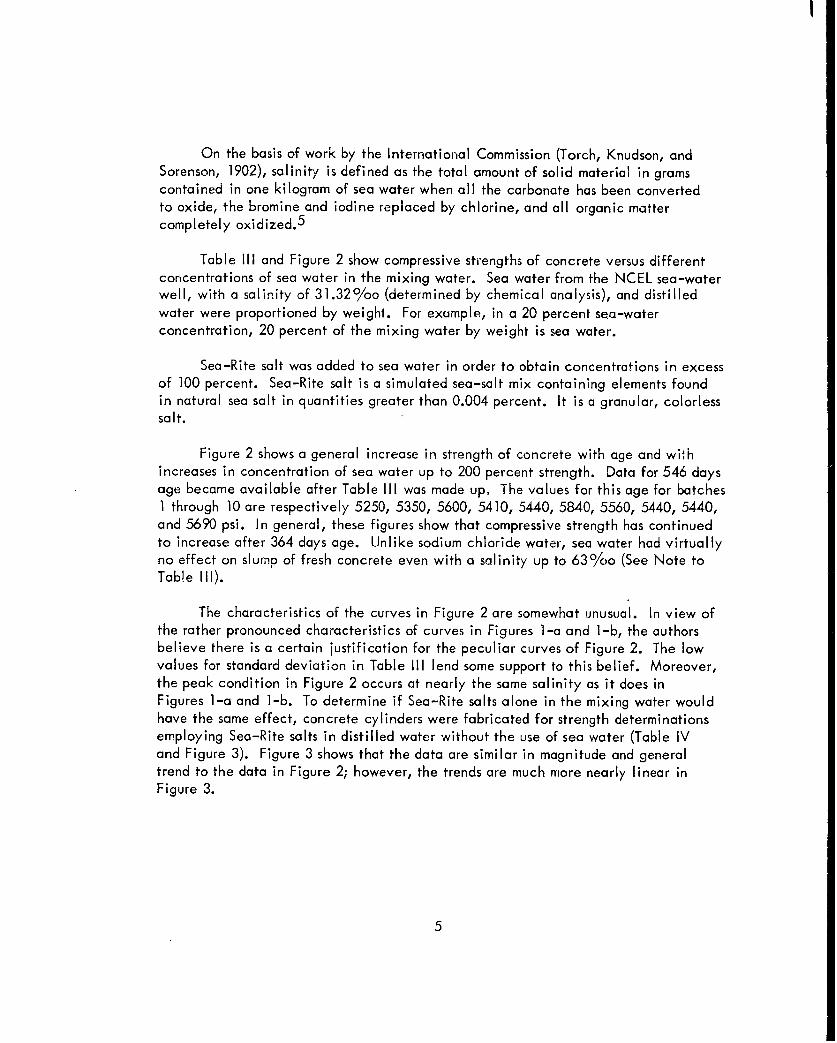
On the basis of work by the International Commission (Torch, Knudson, andSorenson, 1902), salinity is defined as the total amount of solid material in gramscontained in one kilogram of sea water when all the carbonate has been convertedto oxide, the bromine and iodine replaced by chlorine, and all organic mattercompletely oxidized. 5
Table III and Figure 2 show compressive strengths of concrete versus differentconcentrations of sea water in the mixing water. Sea water from the NCEL sea-waterwell, with a salinity of 31.320/oo (determined by chemical analysis), and distilledwater were proportioned by weight. For example, in a 20 percent sea-waterconcentration, 20 percent of the mixing water by weight is sea water.
Sea-Rite salt was added to sea water in order to obtain concentrations in excessof 100 percent. Sea-Rite salt is a simulated sea-salt mix containing elements foundin natural sea salt in quantities greater than 0.004 percent. It is a granular, colorlesssalt.
Figure 2 shows a general increase in strength of concrete with age and withincreases in concentration of sea water up to 200 percent strength. Data for 546 daysage became available after Table III was made up. The values for this age for batches1 through 10 are respectively 5250, 5350, 5600, 5410, 5440, 5840, 5560, 5440, 5440,and 5690 psi. In general, these figures show that compressive strength has continuedto increase after 364 days age. Unlike sodium chloride water, sea water had virtuallyno effect on slump of fresh concrete even with a salinity up to 630/oo (See Note toTable Ill).
The characteristics of the curves in Figure 2 are somewhat unusual. In view ofthe rather pronounced characteristics of curves in Figures 1-a and 1-b, the authorsbelieve there is a certain justification for the peculiar curves of Figure 2. The lowvalues for standard deviation in Table III lend some support to this belief. Moreover,the peak condition in Figure 2 occurs at nearly the same salinity as it does inFigures 1-a and 1-b. To determine if Sea-Rite salts alone in the mixing water wouldhave the same effect, concrete cylinders were fabricated for strength determinationsemploying Sea-Rite salts in distilled water without the use of sea water (Table IVand Figure 3). Figure 3 shows that the data are similar in magnitude and generaltrend to the data in Figure 2; however, the trends are much more nearly linear inFigure 3.
5

i
Depth-of-Cover Series
Concretes with two different water-cement ratios were fabricated for studiesof water vapor transmission and steel corrosion. The compressive strengths in psi ofthese concretes for various ages in days (d) without additives or admixtures are asfollows:
Std DevBatch No. W/C 7d 14d 28d 28d 56d 112d 224d 364d
S4L-2 0.702 2280 2820 3680 95 4310 4890 5050 5200
$4H-2 0.444 4630 5630 6470 175 7520 8070 8570 8950
The above compressive strength values are for 4-inch-diameter by 8-inch cylinders.Each value represents the average for three cylinders except for tests at 28 days, forwhich nine cylinders were used. Cement was Colton Type II; average slump was3 inches. All cylinders were cured in 100 percent relative humidity (RH) at 73.4 F.(Tolerances for all controlled environmental rooms were ±2.0 percent RH and +2.0 F.)
Wall Specimens
Twelve small reinforced-concrete walls were cast using concrete described inTable I. The walls are described further on in this report under "Corrosion of Steel."Table V and Figure 4 show the results of compressive strength versus age for twowater-cement ratios for each of three aggregates, the characteristics of which arepresented in Table I. Except for 28-day specimens, cylinders for compressive strengthwere field-cured on concrete pads on either side of the walls (land side and sea side).The values in Table V shown for the land side received no sea-water spray; the onesshown for the sea side received sea-water spray. Values for the sea side and landside jenerally were in such close agreement through 224 days age that average valueswere plotted in Figure 4.
It should be noted in Table V that for 448 days age, in general there aresignificant differences in compressive strengths for storage conditions (land sideversus sea side). At this age, compressive strengths of cylinders receiving sea-water spray are all lower than corresponding cylinders protected from sea spray.For earlier ages, no strcng pattern was established.
The effect of poor-quality aggregate on strength of concrete is shown by acomparison of strength of concrete incorporating Guam reef coral with the concreteincorporating superior aggregates such as San Gabriel and Eniwetok reef coral.
6

WATER VAPOR TRANSMISSION
Sodium Chloride Series
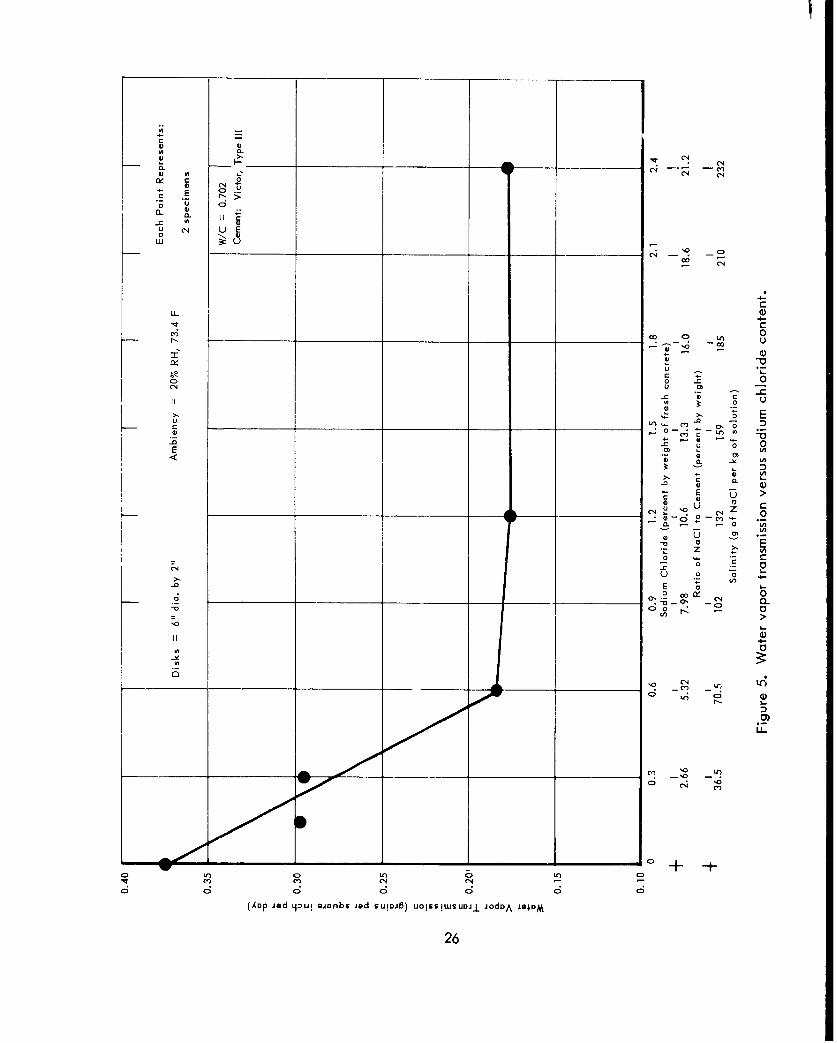
Table VI shows water vapor transmission (WVT, grains per square inch per day)values for concrete disks containing varying percentages of sodium chloride. Thedata are also shown graphically in Figure 5. It may be observed that there is a rapiddecrease in WVT with increasing salinity of mixing water. WVT reaches a minimumvalue at a salinity of about 70 0/oo; however, with further increasing salinity, theWVT values remain virtually constant.
Table VI1 shows WVT values for specimen thickness studies and relative humiditystudies for low-strength concrete (W/C = 0.702) containing 1.5 percent sodium chlorideby weight of fresh concrete. This percentage of sodium chloride has significance becausea large number of cores drilled from concrete structures on Pacific Ocean atolls con-tained chloride salts in this equivalent amount. 1 For the structures sampled, there wasno mix design information available and it was therefore not possible to determine theamount of salts on a salinity basis or on a salt-cement ratio basis.
Table VIII is similar to Table VII, except that the concrete is high strength(W/C = 0.444), and there is no salt in the concrete. Data for both tables are plottedas Figure 6. Comparison of Figures 6-a and 6-b shows that the effect of the salt inthe low-strength concrete is to reduce its WVT values close to the level of those forthe high-strength concrete without salt at the same respective ambient relativehumidities.
Table IX shows WVT values for specimens made in connection with a depth-of-cover corrosion study. Table VIII and Table IX-b are comparable and show similarresults. Data of Tables VII, VIII, and IX show slightly increasing rates of WVT withdecreasing thicknesses of specimens. Table IX also shows that WVT varies directlywith water-cement ratio; i.e., high water-cement-ratio concrete has higher WVTvalues than does low water-cement-ratio concrete.
Sea Water Series
WVT values for concrete disks containing varying percentages of sea water areshown in Table X. Figure 7 shows variations in WVT versus salinity. From a compari-son of Figures 7 and 5, it may be observed that the nearly horizontal portion of thecurves begins at a salinity of only 25.060/oo for sea water and of 70.50/oo for sodiumchloride. Figure 7 also shows the effect of thickness of specimen. At zero salinity,the thicker specimens show only slightly lower WVT rates than do the thinner speci-mens; however, with increasing salinity, the thicker specimens show much lower WVT.
7

Although not conclusively resolved, Figure 8 shows some limited evidence toindicate that specimens with larger cross-sectional areas have somewhat lower WVTrates than similar specimens with smaller areas.
Figure 9 shows WVT as a function of ambient relative humidity. This figureshows that if no sea water is present in the mixing water, WVT is virtually independentof specimen thickness, and if it is present, the thicker specimens show a greatly re-duced WVT rate compared to the thinner specimens. The dotted lines are assumed tobe reasonably correct (refer to Table X, for Figures 7, 8, and 9).
Kwajalein Coral Concrete
Table XI shows WVT rates for two 6-inch-diameter concrete cylinders made bythe Corps of Engineers on 19 September 1960 (PST). These cylinders were field-curedat Kwajalein for 24 hours at an average relative humidity of 73 percent. They werethen sealed in cardboard containers and delivered by air to NCEL on 26 September1960 and placed in a 100 percent RH, 73.4 F room until 17 October 1960, when theywere cut into disks and emplaced in wet cups in a 20 percent RH, 73.4 F room. A2-inch-thick disk and a 4-inch-thick disk were cut from each of the cylinders. Thepair of 2-inch specimens show remarkably close VvY'VT rates; however, they are higherthan any values obtained at NCEL for other concretes. WVT rates for the 4-inchspecimens agree reasonably close and are in line with values for other concretes.Portions of ground concrete samples from each of the two specimens were dried,weighed, extracted in a soxhlet apparatus for 96 hours, and analyzed spectrophoto-metrically for sodium chloride. The average sodium chloride content was found tobe 0. 09 percent by weight of hardened concrete.
The coral aggregate was hard reef coral with a maximum particle size of1.5 inches. The aggregate was washed with fresh water to reduce the salt contentto a minimum. The concrete incorporated an air-entraining agent and was made withLion Type II cement from Japan. The water-cement ratio was 0.554 and the slumpwas 3 inches. Air entrainment was 3.5 percent. The mixing water was fresh potablewater.
WVT of Wall Specimens
Table XII shows WVT rates for specimens fabricated at the time the walls werecast. The specimens were fabricated from closely controlled batches mixed in thepan-type mixer (see p 2). Values for the SG aggregate specimens are slightly greaterthan for other NCEL specimens of the same aggregate. Values for the ENR high-quality coral aggregate specimens are the lowest of the three different aggregates.The GMR poor-quality coral aggregate specimens show distinctly higher WVT ratesthan either the ENR or SG, apparently reflecting its poor quality in high WVT valuesas well as in low comparative-strength values.
8
WVT Curve Characteristics
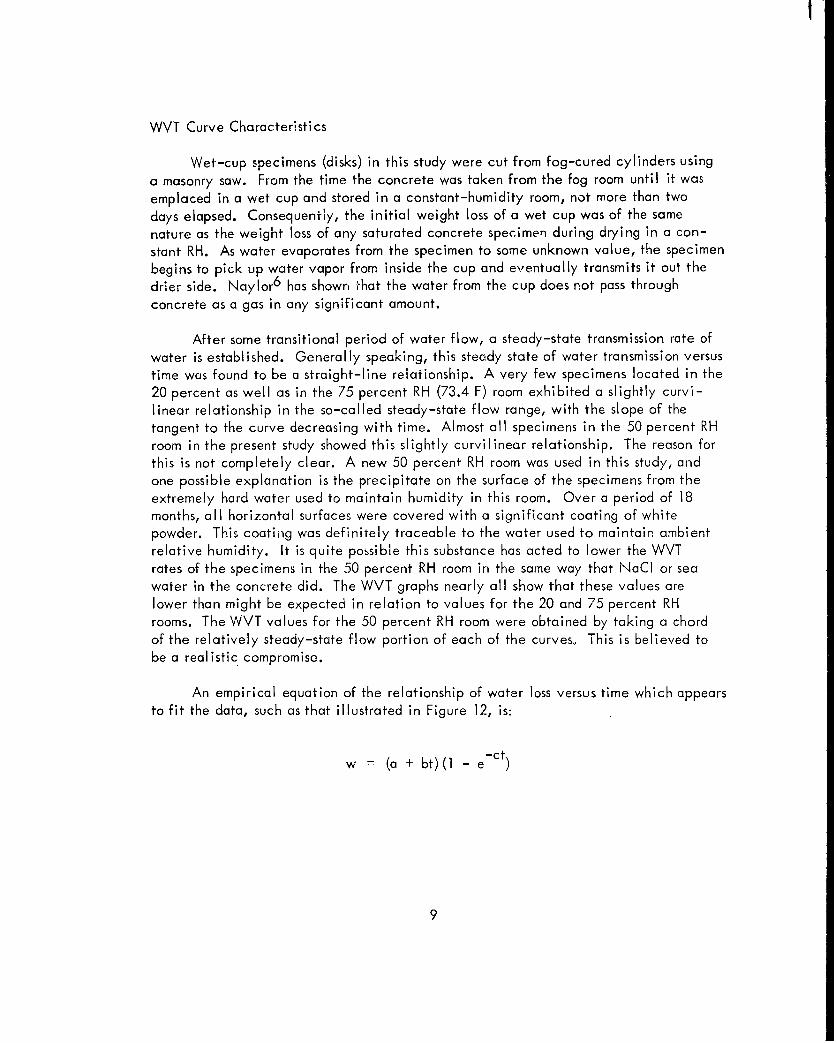
Wet-cup specimens (disks) in this study were cut from fog-cured cylinders usinga masonry saw. From the time the concrete was taken from the fog room until it wasemplaced in a wet cup and stored in a constant-humidity room, not more than twodays elapsed. Consequently, the initial weight loss of a wet cup was of the samenature as the weight loss of any saturated concrete specimen during drying in a con-stant RH. As water evaporates from the specimen to some unknown value, the specimenbegins to pick up water vapor from inside the cup and eventually transmits it out thedrier side. Naylor6 has shown that the water from the cup does not pass throughconcrete as a gas in any significant amount.
After some transitional period of water flow, a steady-state transmission rate ofwater is established. Generally speaking, this steady state of water transmission versustime was found to be a straight-line relationship. A very few specimens located in the20 percent as well as in the 75 percent RH (73.4 F) room exhibited a slightly curvi-linear relationship in the so-called steady-state flow range, with the slope of thetangent to the curve decreasing with time. Almost all specimens in the 50 percent RHroom in the present study showed this slightly curvilinear relationship. The reason forthis is not completely clear. A new 50 percent RH room was used in this study, andone possible explanation is the precipitate on the surface of the specimens from theextremely hard water used to maintain humidity in this room. Over a period of 18months, all horizontal surfaces were covered with a significant coating of whitepowder. This coating was definitely traceable to the water used to maintain ambientrelative humidity. It is quite possible this substance has acted to lower the WVTrates of the specimens in the 50 percent RH room in the same way that NaCI or seawater in the concrete did. The WVT graphs nearly all show that these values arelower than might be expected in relation to values for the 20 and 75 percent RHrooms. The WVT values for the 50 percent RH room were obtained by taking a chordof the relatively steady-state flow portion of each of the curves, This is believed tobe a realistic compromise.
An empirical equation of the relationship of water loss versus time which appears
to fit the data, such as that illustrated in Figure 12, is:
w = (a + bt)(1 - e-ct
9

where w = weight loss of wet cup
a = intercept value on w-axis
b = slope of linear portion of curve
t = time
e = 2.718
c = coefficient accounting for early curvilinear portion of relationship ofw and t
Asymptotically as time goes on (i.e., as t becomes quite large), this equationis well approximated by:
w = a + bt
so that b = dw/dt is the asymptotic WVT rate.
In the previous study,], 2 water vapor transmission was defined by the formula:
WVT 1WAt
where I = length of flow path or thickness of specimen, inches
W = weight of vapor transmitted, grains
A = area of cross section of specimen, square inches
t = time during which vapor transmission occurred, days
This expression seemed reasonable at the time; however, this study shows that WVT isvirtually independent of specimen thickness and therefore, I, must be deleted in theabove equation so that
WWVT At
At
10

Excluding vapor and ice as significant modes of moisture migration throughconcrete in the tests described herein, there remain four possible modes of moisturemigration: chemical compound, adsorbed, liquid, and dissolved. If the true mechanismof moisture migration could be disclosed, a great deal of understanding about thebehavior of concrete would result.
WVT Hysteresis
Hysteresis is herein defined as a reduction in WVT caused by aging or a previousexposure of the specimen. 7 For example, a number of specimens were first allowed todry naturally in each of the three RH rooms to nearly constant weight. These specimens,at equilibrium with their ambient environments, were then emplaced in wet cups, andwater loss versus time was determined. Although insufficient time has passed to provid,conclusive data, an example is shown in Figure 10. To date, the three specimens shov.WVT values of 0.128, 0.095, and 0.08o grains per square inch per day respectively for20, 50, and 75 percent RH. If these values are compared with Figure 7, it may be notedthat they are considerably lower than the curves of Figure 7 indicate for a salinity of6.26 0/o.
Vented Cups
With the exception noted below, all of the wet cups in the present as well asin the previous study1, 2 were unvented. That is, there was no opening directly intothe vapor phase portion of the cup. Consequently, as water was transmitted from thecup through the concrete, partial vacuums may have developed and altered the vaporpressure.
According to Sears, 8 a change in total pressure changes the vapor pressure.For example, an increase in the total pressure always increases the vapor pressure;if more of an inactive gas is pumped into a container, more of the liquid in the con-tainer evaporates, contrary to what might be expected. The change in vapor pressureis very small compared with the change in total pressure.
In order to assure equal total pressures internal to and external to the cup, ventswere installed in two cups as shown in Figure 11. Companion specimens were placedin the vented cups and in unvented cups. The curves of weight loss versus time forthese four cups are shown in Figure 12. This figure shows that for the first 100 daysthere are no significant differences between the vented and unvented cups. Also, itshows no significant differences between specimens 1 inch and 2 inches thick. Addi-tional time may be required to verify this. A control vented cup with acrylic top(instead of concrete) showed no significant weight loss.
11

I.
CORROSION OF STEEL
Corrosion-Detection Probe
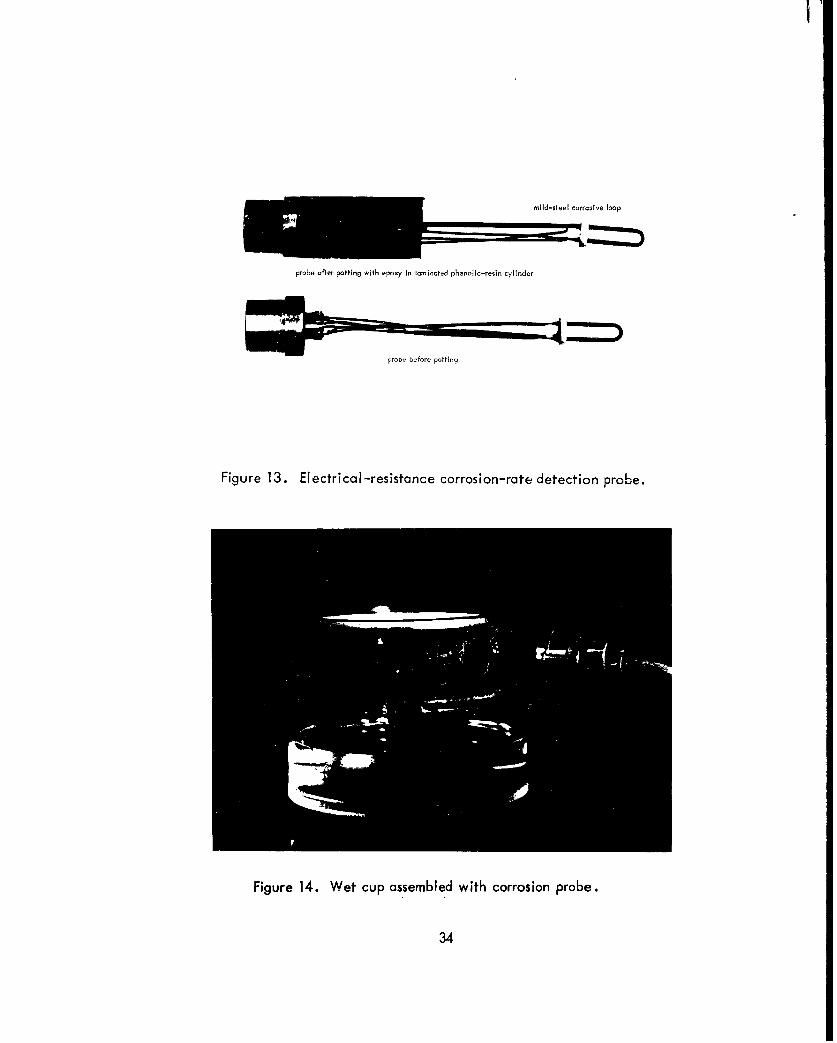
The use of a Corrosometer, an electrical-resistance corrosion-rate detectionprobe and metering device, to measure directly the degree of corrosive environmentof reinforcing steel occurred to the authors. The efficacy of the Corrosometer andprobes as a corrosion-detection device had been investigated previously. 9 Conse-quently, probes fabricated of mild steel of the type shown in Figure 13 were obtainedfor this purpose. The phenolic-resin potting cylinder shown in this figure was madejust long enough to extend about 1/2 inch into the concrete. The probes were insertedinto the fresh concrete through a hole in the wall of the cylindrical steel mold of theconcrete cylinder. In order to do this, a cap was fastened across the top of the cylinderimmediately after the concrete was cast. The cylinder was laid on its side, the plugunscrewed from the hole, and the probe inserted. The cylinder was then replaced inits as-cast position and placed in the fog room. The exterior end of the probe wasprotected by a small rubber sheet fastened around it.
The operati6-n of the Corrosometer is based on the fact that the electricalconductivity of most metals is very great, while the conductivity of nonmetals isnegligible by comparison. As the corrosion process converts metal into nonmetal,the electrical resistance of a piece of metal thus increases. The Corrosometer circuitutilizes this change of resistance to indicate the extent of penetration in an exposedmetal specimen as corrosion proceeds on its surface.
The resistance of this exposed specimen is not measured directly by theCorrosometer circuit. Instead, a second specimen, made from the same metal or alloy,is connected in series with the first and the two specimens are made part of a bridgecircuif. The second specimen is covered with a highly corrosion-resistant coatingand so retains its original cross section and resistance. The ratio of the resistanceof the exposed specimen to that of the covered specimen is then determined. Changesin this resistance ratio are translated directly into units of corrosion by the metercircuit.
By using a circuit which measures only the ratio of the two resistances, themeasurements are made essentially independent of the current used to energize thebridge. Likewise, because temperature changes affect the resistance of both exposedand covered elements in the same manner, the resistance ratio and the meter readingare independent of the temperature of the environment. It is this self-compensatingfeature of the bridge arrangement that permits the high degree of precision andsensitivity attained by the Corrosometer.
12

Sodium Chloride Series
Cylinders with probes were fabricated for concretes with different percentagesof sodium chloride. Two-inch-thick disks were cut with the probe in the middle andemplaced in wet cups as shown in Figure 14. In order to place the disk with probein an acrylic cup, a vertical strip was removed from the wall of the tube and cementedin place after the disk had been placed in the cup. The joint above the probe may beseen in Figure 14. The cups were stored in 20 percent RH at 73.4 F.
Table XIII and Figure 15 show results of the cups with concrete containingsodium chloride. Figure 15 shows that a salinity of 70.50/oo is most favorable forthe maximum rate of corrosion. The pattern of corrosion versus salinity is very similarto that shown on page 131 of Reference 10, and is thus verified.
Sea Water Series
A similor set of concrete disks with probes incorporating varying percentagesof sea water in the mixing water was also prepared and emplaced in wet cups storedin 20 percent RH at 73.4 F. Table XIV and Figure 16 show corrosion rates for theseprobes. Figure 16 indicates that no significant corrosion occurs up to a salinity of250/oo; thereafter, the corrosion rate increases markedly. The most favorable salinityin sea-water solutions for the maximum corrosion rate is evidently beyond 63°0/o(200 percent sea water).
Depth-of-Cover Series
A series of 6-inch-diameter by 6-inch-thick concrete specimens for each oftwo different water-cement ratios (0.444 and 0.702) were prepared with corrosion-detection probes. No salt was used in the concrete. The specimens were emplacedin wet cups and stored in 50 percent RH at 73.4 F. Measuring from the bottom surfaceof the specimen, the probes had depths of concrete cover of 1, 2, 3, 4, and 5 inches.A single probe was placed in each concrete disk, and each concrete disk was madein duplicate (each series had 10 cups). A time period of 400 days has shown nomeasurable corrosion in any of the 20 cups involved. WVT values of these cups arerepresented by cup No. U750 and cup No. U758 in Table IX.
Experimental Wal Is
In order to simulate a marine environmental exposure such as that encounteredby a building on a tropic atoll, small walls of reinforced concrete were built andsea-water spray was applied daily. The deiails of the concrete mixes and theiringredients are shown in Table I.
13

The variables to be investigated are shown in Table XV. The three types ofaggregate described in Table I and two water-cement ratios (0.444 and 0.702) wereused, and two different reinforcing-steel arrangements were employed. Each of thesteel arrangements had the same grid spacings. The only difference in arrangementwas that in one case the mild-steel bars were insulated from each other with electri-cians's plastic tape and tied together with nylon fishing cord, as shown in detail inFigure 17. In the other arrangement all steel bars were tack-welded together at thepoint of contact. These arrangements were to permit the investigation of corrosionof individual steel bars as compared to the corrosion of an interconnected grid ofsteel bars. Two depths of steel cover were also included as variables, the depthbeing measured from the outer surface of the concrete to the nearest surface of thesteel. It was desired to eliminate all external entries, such as tie-wire and boltholes, through the concrete to the steel as unknown variables; therefore, concreteblocks for the particular kind of concrete to encase the steel grids were precastwith wire loops embedded in each block for securing the steel grids. These areshown in Figure 18. In this way there were no steel wires going from the steel gridthrough the concrete to the outside. The use of spacer blocks was avoided for thesame reason, and the grids were held in place vertically by means of temporaryholding devices which may be seen in Figure 19.
It was desired to hold the water-cement ratio for the high-strength concretesequal throughout and that for the low-strength concretes equal throughout. It wasfurther desired to design all concretes for identical consistencies as measured by theslump test. This required a greater amount of water and cement for the coral aggre-gate concretes than for the San Gabriel aggregate concrete.
While the slump test has for a number of years appeared to be an excellentmeasure of consistency for San Gabriel aggregate concrete, coral aggregate concretesdo not respond quite so uniformly to the slump test. Although distribution of aggre-gate by percentage was approximately the same for all batches, the coral concretesappeared too harsh, compared with the San Gabriel aggregate concrete. The slumpsin inches for the various concretes used in the walls are tabulated below:
Wall No. Min Avg Max W/C Aggregate
6, 9 4-1/2 6-1/2 8 0.702 GMR2, 8 1 2 3 0.702 SG3, 10 1-1/2 5 6-1/2 0.702 ENR1, 11 1/2 1-1/2 3 0.444 GMR4, 12 3 3-1/2 4-1/2 0.444 SG5, 7 3 4-1/2 6 0.444 ENR
14

i
The apparent harshness of the coral concretes was further demonstrated in theconstruction of walls when the forms were stripped at 7 days age. For example,Figure 20 shows a typical San Gabriel concrete wall immediately after the formswere stripped and Figure 21 shows a typical coral concrete wall after the forms werestripped. Although the apparent consistencies were the same, the coral concretesdid not flow down into the foundation of the wall as well as did the San Gabrielconcrete. This occurred even though the spud vibrator was applied internally to theconcrete as well as externally to the form.
During the first 7 days of curing, the forms of each wall remained in place, andburlap was placed across the top of the walls for moisture retention. The burlap waskept wet by means of water spray. On the 7th day, after the forms were stripped fromeach wall, the voids, as shown in Figure 21, were filled in with appropriately designedfresh concrete. On the 8th day each wall was rubbed down with mortar employingthe same fine sand that had been used in the concrete mix for each particular wall.The ;valls were then completely wrapped in burlap, which was kept soaking wet. Onthe 28th day after placing, the walls were stripped of burlap, and 3-inch-diameterby 6-inch concrete cylinders for determining compressive strength were placed alongthe walls as shown in Figure 22. When the last walls to be cast (GMR) had achievedan age of 30 days, the first application of sea water was made to the seaward sideof each wall on 15 June 1961 for a 5-minute interval once each day at 0830. Thesea water was obtained from the NCEL sea-water well.
When the GMR walls were 29 days old, the first set of monthly photographs wastaken for the purpose of a statistical evaluation of time-dependent deterioration. On7 July 1961, considerable efflorescence was noted on walls 6, 9, and 11. Outside ofthis, no deterioration of the walls has been noted as of June 1962. The tests willcontinue.
GENERAL DISCUSSION
Strength
A contrilbuting factor to deterioration of concrete structures on tropical atollsis believed to be the presence of foreign salt. When hardened concrete is chemicallyanalyzed, the chloride content is usually expressed in combination with sodium. Forthis reason, the effect of sodium chloride was of interest. The actual combination ofchloride ions with other metals in concrete is very difficult to estimate accurately.
In a marine environment, sea water is the source of a significant amount offoreign salt found in concrete. There may be sea-water salts in the aggregate, andsea water may be used in the mixing water. Also, in tropical atolls, sea spray on
15

concrete structures continuously cdds salt to the hardened concrete. This salt may becarried into the concrete by the penetrating saline solution. A satisfactory externalwater-repellant coating on the concrete would prevent sea-spray salts from penetratingthe concrete.
For the average maximum of 1.5 percent sodium chloride by weight of hardenedconcrete found in tropical concrete, the corresponding salinity for concretes in thisstudy is 159O/oo. Roughly this would be equivalent to the salts in 4 kilograms of seawater reduced to 1 kilogram of saline solution. It is very difficult to see how thisconcentration of salt could get into the concrete at the time of mixing; however, aconcrete structure exposed to sea spray might accumulate this concentration of saltsover a period of years. Since the latter can be prevented, interest is mainly in theamount of salt permissible at the time of mixing.
Neither sea water with a salinity up to 630/oo nor sodium chloride water witha salinity up to 360/oo have adverse effect on compressive strength of concrete upltoone year as determined in this study. The general conclusion of Lea and Watkins,
emerging from their study of reinforced-concrete piles exposed to sea-water actionfor up to 23 years, was that the primary cause of deterioration of the piles was cor-rosion of the reinforcement and riot the disintegration of the concrete from chemicalor physical effects of the salts in the sea water. The senior author (Griffin) of thepresent study, from his own observations in the islands of Canton, Eniwetok, Kwajalein,and Midway, found no reason to disagree with this thesis.
Lea outlines prime essentials for sea-water concrete on page 552 and 553 ofReference 12. He states that sea water may be used for mixing plain concrete forsea-water structures except for high-alumina cement. However, high-alumina cementconcrete made with fresh water has greater durability when exposed to sea water thandoes portland cement. The durability of pozzolanic cements was lower than for high-alumina cement and higher than for portland cement under the same conditions. 1
Water Vapor Transmission
The use of lower water-cement ratios decreases WVT rates. The use of sodiumchloride water with salinities up to 700/oo and of sea water with salinities up to250/oo decreases WVT values.
Corrosion of Steel
For either sodium chloride water or sea water in concrete, salinities up to 250/oodo not produce highly significant corrosion rates. For sodium chloride water, salinitiesin excess of about 1600/oo do not produce highly significant corrosion rotes. Salinitiesbetween 250/oo arid 1600/oo of sodium diloride solutions in concrete do produce highlysignificant corrosion rates. This pattern may be true for sea-water concentrations also;however, the full pattern was not developed in this study.
16

Summary
It is apparent that some salt is beneficial to reinforced concrete. Concretewith mixing water with a salinity of 25%0/o, corresponding to 80 percent sea waterand 20 percent fresh water by weight, shows a gain in strength, lower values forwater vapor transmission, and no significant corrosion of mild steel. Additional saltgain in marine structures from sea spray should be prevented by use of water-repellantexterior coatings.
The experimental walls should reveal the extent of salt gain from sea-waterspray and the length of time for corrosion of the reinforcing steel to manifest itselfeither by an appearance of rust stains or by cracking of concrete caused by a forma-tion of corrosion products on the reinforcing rods.
FINDINGS
A. Compressive Strength
1. Concrete incorporating sodium chloride in the mixing water shows anoptimum salinity of about 36 0/oo for maximum compressive strength.
2. Depending upon age of concrete, relatively high concentrations of NaCIare permissible before strengths less than those for zero salinity result.
3. Natural sea water does not deteriorate plain concrete nor does it causeany reduction in strength. On the contrary, strength is generally increasedwith up to double the normal concentration of salts in sea water.
B. Water Vapor Transmission
1. With increasing sodium chloride salinity of mixing water up to 700/oo, andof sea-water salinity up to 250/0o, WVT is reduced to its minimum. Withfurther increasing salinitiec, WVT is almrst constant.
2. With increasing salinities, the effect of the thickness of the specimenbecomes much more pronounced, with thicker specimens showing muchgreater reductions in WVT than do thinner specimens.
3. With or without salts, WVT varies directly with the water-cement ratio.Concretes with higher water-cement ratios have higher WVT values.
17

4. Without salts, thinner concrete specimens have somewhat higher WVT ratesthan do thicker specimens. Indications are that 6 inches may be a limitingthickness beyond which greater thicknesses do not further decrease WVTsignificantly.
5. Concrete made with poor-quality aggregate (GMR) shows higher WVT valuesthan concrete made with high-quality aggregate (SG and ENR), other factorsbeing equal.
6. The present study does not confirm nor - probably because of the situationdescribed for the 50 percent RH room - does it completely negate an earlierfinding 1 that an ambient relative humdity of 20 or 50 percent at 73.4 F hasno significant effect on WVT compared with experimental variability.
7. No mathematical relationship could be established to predict water vaportransmission for specimens of identical concrete but with different thicknesses.
C. Corrosion
1. The electrical-resistance detection probe appears to be a reliable devicefor measuring the corrosiveness of concrete to reinforcing steel.
2. Concrete incorporating sodium chloride in the mixing water shows an optimumsalinity of 700/oo for maximum corrosion of steel.
3. Sea water with a salinity of 250/oo or less in the concrete mixing water doesnot significantly corrode steel.
GENERAL CONCLUSION
A small amount of sea-water salts is beneficial to concrete. At a mixing-watersalinity of 250/oo, strength is improved, WVT is minimized, and corrosion of mild steelis not significant.
18

REFERENCES
1. U. S. Naval Civil Engineering Laboratory. TR-130, Water Vapor Transmission ofPlain Concrete, by Donald F. Griffin and Robert L. Henry. Port Hueneme, California,16 May 1961.
2. Griffin, Donald F., and Robert L. Henry. "Integral Sodium Chloride Effect onStrength, Water Vapor Transmission, arid Efflorescence of Concrete," Journal ofAmerican Concrete Institute, No. 6, December 1961, pp. 751-772.
3. Nicol, J. A. Colin. The Biology of Marine Animals, p. 9. Interscience Publishers,New York, 1960.
4. Lyman, John, and Richard H. Fleming. " Composition of Sea Water," reprint fromSears Foundation Journal of Marine Research, 1940, pp. 134-146.
5. Sverdrup, H. U., Martin W. Johnson, and Richard H. Fleming. The Oceans -Their Physics, Chemistry, and General Biology. Prentice-Hall, New York, October1946.
6. U. S. Naval Civil Engineering Laboratory. TN-428, An Investigation of theGaseous Mode of Moisture Migration Through Portland Cement Concrete, byW. C. Naylor. Port Hueneme, California, 30 April 1962.
7. ASTM Committee C-16, "Water Vapor Transmission Testing," Materials Researchand Standards, Vol. 1, No. 2 (February 1961), Bulletin of ASTM, pp. 117-121.
8. Sears, Francis Weston. An Introduction to Thermodynamics, the Kinetic Theoryof Gases, and Statistical Mechanics, 2nd ed., p. 165. Addison-Wesley PublishingCo., Reading, Massachusetts, 1953.
9. U. S. Naval Civil Engineering Laboratory. TR-057, Evaluation of CondensateReturn Line Corrosion Testers, by J. M. Hayhoe and N. L. Slover. Port Hueneme,California, 13 March 1961.
10. Uhlig, Herbert H. The Corrosion Handbook. John Wiley & Sons, New York, 1948.
11. Lea, F. M., and C. M. Watkins. "The Durability of Reinforced Concrete in SeaWater," National Building Studies, Research Paper No. 30. Her Majesty's StationeryOffice, London, 1960.
12. Lea, F. M. The Chemistry of Cement and Concrete. St. Martins Press, New York,1956.
19

I!
5 5 0 01 A
5250 /\ Each Point Represents:
/ {_ 15 tests for 14 days age
SOJO 13 tests for all other ages
50-1-0--- on 4" dia. by 8" cylinders,
fog-cured
4750 f . .
4500,1 N
\'+\4250 -- S/ I
S4000 \ -- -c 364 days age
• 3750 .'" 224 d
. 112dEa
U 3500 Ingredients pc.f \
Water: Fresh 11.7 + obs.\ 56 d
3250 Cement: Colton, Type I1l 16.7
Aggregate: San Gabriel, 3/4" max. 120.1 \particle size _
3 Total 148.5 28 d3000T
i 'N I
2750 - .+ •14 d
2500 I0 0.3 0.6 0.9 1.2 1.5 1.8 2.1 2.4
Sodium Chloride (percent by weight of fresh concrete)
+ I I I II I2.66 5.32 7.98 10.6 13.3 16.0 18.6 21.2
Ratio of NaCI to Cement (percent by weight)
+ I I I I I I I I36.5 70.5 102 132 159 185 210 232
Salinity (g of NaCI per kg of solution)
Figure ]-a. Compressive strength versus sodium chloride content for W/C = 0.702.
20

8500
Each Point Represents:8250 • --
15 tests for 14 days age
8000 1 3 tests for all other ageson 4" dia. by 8" cylinders,fog-cured "
7750
7500
7250
7000T
6750
600
E\UO 5750--
5500 N 224 days age
112 d
56250/k
"Ingredients pcf 364 d
5000 Water: Fresh 11.7 + as d
Cement: Colton, Type III 26.4
4750 Aggregate: San Gabriel, 3/4" max. 109.9 28 dparticle size
14 d45 0 [ Total 1148 1.0 i \ '
0 0.3 0.6 0.9 1.2 1.5 1.8 2.1 2.4
Sodium Chloride (percent by weight of fresh concrete)
+ I I I I I i 11.68 3.36 5.04 6.73 8.40 10.1 11.8 13.4
Ratio of NaCI to Cement (percent by weight)+ I I I I I I
36.5 70.5 102 132 159 185 210 232Salinity (g of NaCI per kg of solution)
Figure 1-b. Compressive strength versus sodium chloride content for W/C = 0.444.
21

9000 \7 Each IPoint Rep Iresents:
15 tests for 14 days age
3 tests for oil other ageson 4" dia. by 8" cylinders,
8000 1` _____-___ _fg- c ured
Points =Observed data
Curves Least-squares fit
6000 ____
6000
cP, 364 days age
Eo 5000 -_ 56 d
U
4000 364__d
56 d
0 0.3 0.6 0.9 1.2 1..5 1.8 2.1 2.4 2.7Sodium Chloride (percent by weight of fresh concrete)
Figure I-c. Compressive strength versus sodium chloride content - Least-squares fit.
22

Ingredients pcf W/C = 0.702
Water: Distilled and/or sea water and Sea-Rite 11.7 + abs. Each Point Represents:
Cement: Colton, Type II 16.7 9 tests for 28 days age
Aggregate: San Gabriel, 3/4" max. 120.1 3 tests for all other agesi on 4" dia. by 8" cylinders,
Total 148.5 fog-cured
364 days age5500 • 224 d
50000
4500 I56 d
r4000 / • • 8
0 3500 • --- j•J•
/
U 1
3000 -
2500
2000 I111
0.47 0.93 1.40 1.86 2.33 2.80 3.27 3.74 4.22 4.69
Ratio of Sea-Water Salts to Cement (percent by weight)I I I I I I I I I I
t 6.26 12.53 18.79 25.06 31.32 37.65 43.97 50.30 56.63 62.96Salinity (g of salts per kg of solution)
I I I I I I I I I20 40 60 80 100 120 140 160 180 200
Concentration of Sea Water in Mixing Water (percent by weight)
Figure 2. Compressive strength versus sea-water concentration.
23

6000 1 1 1Ingredients pcf Each Point Represents:
Water: Distilled plus Sea-Rite 11.7 + abs. 3 tests on 4" dia. by 8"
Cement: Colton, Type 11 16.7 cylinders, fog-cured
5500 Aggregate: San Gabriel, 3/4" max. 120.1
l particle size W/C = 0.702
224 days age
5000
300
562 d
4)
4000 128 d
0.47 0.93 1.40 1.86 2.33 2.80 3.27 3.74 4.22 4.69Ratio of Sea-Rite Salts to Cement (percent by weight)SI I I I ) I I I I+ 6.26 12.53 18.79 25.06 31.32 37.65 43.97 50.30 56.63 62.96
Salinity (g of salts per kg of solution)+' ' I .2 0 40 60 80 100 12 0 140 160 180 200
Concentration of Sea-Water Equivalent in Mixing Water (percent by weight)
Figure 3. Compressive strength versus Sea-Rite concentration.
24

I.
9000
Aggregate W/CENR
0.4448000
SG 0.444
7000 / --1
GMR 0.444
500 SG 0 •. 702
.G • / - • -E N R 0 . 7 0 2
o- 4000 -
0U
3000
2000 -- R 0.7...
lo Cement: Colton, Type I
1000 - _Note: Each point for 28d is avg of
four fog-cured cylinders. Allother points each are avg of/ six field.cured cyl;Indes
(3 dia. by 6')0 28 56 112
224
Time (days) 448Figure 4. Compressive strength versus age of walls.
25
- 04 1140,
4) CN
E N>
04 C
- 0 (N
0L 0u -C
_ _ _ _ _ _ _~ u_ -
00ol o Lo _0
44,
r aL-n 0 Q)OE >
___ 0 -"9 U 0
4, U ' o t
~ E
0 0*04
E L--
00
100
C14
Cl0)
0 0 LO
Aft 0± I00 ) Cý 1
(Ao~p jed 4"!~ aionbs jed suiOJB) uo155!wsuDoj_ jodDA A84DM
26

0
z
o 0~
C) -u
0
CN
.0~0 E >E
.0 Ln C)
* E '4'O
>.E -a 'u 0:C4C
0~ 0
E.E - E
0 0.' au a
C)a
C'4C
u .2
U) C) C
C) C)0C)c-A~ 1.-o!*~b adsij)u~sLuui oD 0D
427

U.. -
*l o-0 - C 0 U') 0ý 0 L*nr, 0 N Nn Nl C4 LON E
-0 =
C)LC
Ln W) - C~) 0 C
< a)
In IIo 00
0
.,n
Cl
L.-
zo/0
C) Ln LnCl! C Cý 0
0 C)C) 0C) C(Aopjadqoulai~bs jd si~jB uoss~w uoiL iouA 04D
28)

cn 10
.2 C14'
'0
LL .0
o~ >'I
0
c- - -
EE
CD.
o. cE- 0
4--
I ~ 0
C).
U . ~ 06
C C'~ oa)ý
C) c ) IDcDC(A0 Ia qo!aa. e s ij)U !SW UD. oD 8D
E I I 29

0.35
0.30 22
-~0.25
4,4
S0.20
0.15
5,
0 .
>00
00
S0.15CL
ure Disk Thickness Sea Water 0,C re(in.) (% of mixing water) e0_
0.05 1 1.5 0 "
2 3.0 0 003 1.5 160 004 1.5 80.5
5 3.0 806 3.0 160
0I10 25 50 75 100
Ambient Relative Humidity (percent at 73.4 F)
Figure 9. Water vapor transmission versus ambient relative humidity -With and without sea-water.
30

'n.
4 04
0~0
00
n c, 0
r, r n c-4 CM
r 0
4, C
N
0. Z) : a4, C -
0 aU)lN U)
E i
~ ' C)CN
-2 0
00
-0 U0
0. W0
00
4, 00 E u
C 0)CN
C 0)
C CC-
.0 C) 0 D 00 D4, co '4-0L C1
0.WJB i-A- Oss- p8a
310

C14
00
Un
0) -4-
u
rN aa
oo
N .. •-
3212
• , .=
• O0, ,,,- ..-
I • U
-. •0 - .o o
•0: . . . . . 2
- o ° 0 a,
A - ° , • Cu • ,, ' • C
S• . ° " ° • .• . o
U a)

0 > 0
-i'O
00
0"0
000 0) 0 ' 0 '
E) 0 E'
4) r C14 CLN-0E
V) E 23-<H 4-
F--"A. 0.
00 Q
____ US 00
I ~E
F-.4-
E
0 0 Q)
CNC)0
u I
0 0
C0 0 0 0 0 0 0
(swojE) ja40M jo 4)4)0] ;qH6
aM
33
probe after potting with epoxy in laminated phenolic-resin cylinder
probe before potting
Fgure 13. Electrical -resistance corrosion-rate detection probe.
Figure 14. Wet cup assembled with corrosion probe.
34

C14
4C-
C'
oo zC) 4
r 0.
u 01
U2 F('4
-n C
- CC, u
0 S
L.-
10'0Cl
C> CD CDv M 0)
(josA~~ ~ ~ ~ 0a lw ~Nu~oj:
35n

14
I,,
12 •
/
10-
8
SWiC =0.702oo Cement: Colton, Type 81
U
Probes in 6" dia. by 2" wet-cup specimens2
10 20 30 40 50 60 70 80 90 100
Salinity (g of salts per kg of solution)
Figure 16. Corrosion versus salinity using sea water.
36

Figure 17. Details of steel insulation.
mN
Figure 18. Concrete supports for steel grids.
37
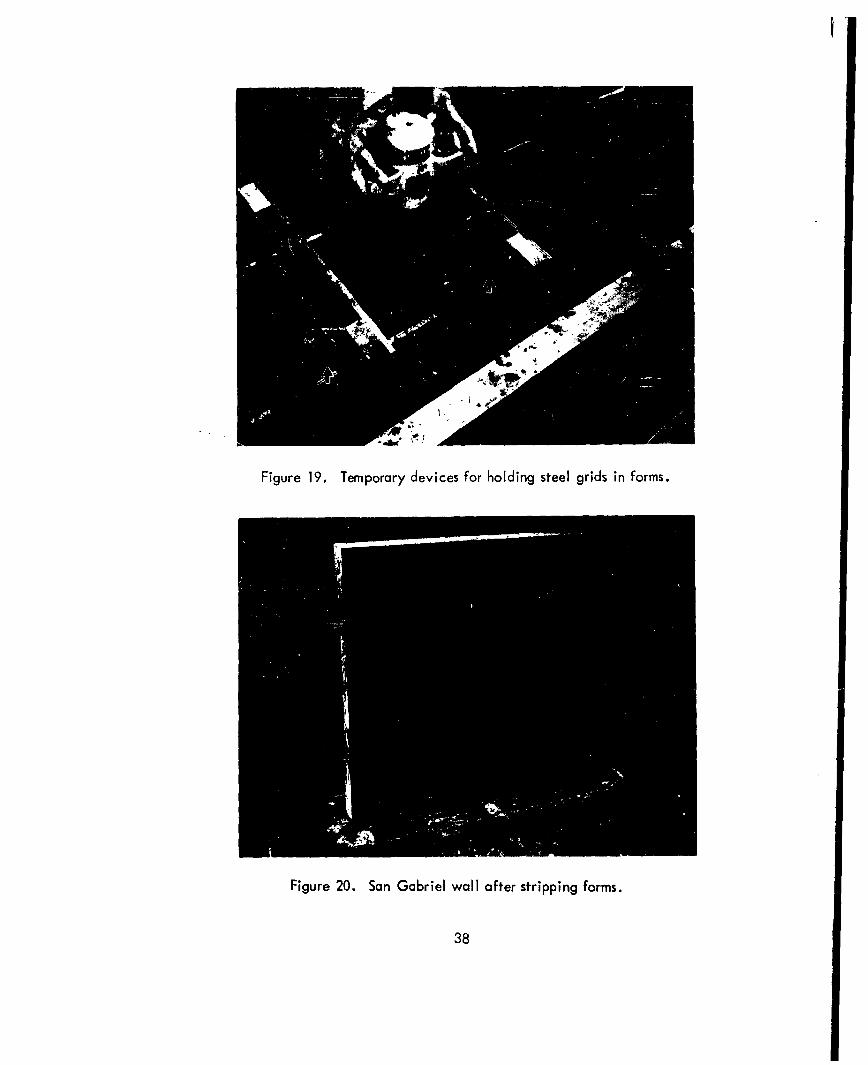
Figure 19. Temporary devices for holding steel grids in forms.
Figure 20. San Gabriel wall after stripping forms.

Figure 21. Coral concrete wall after stripping forms.
Figure 22. Overall view of experimental walls.
39

Table I. Summary of Concrete Mix Design Data
A. Characteristics of Materials
Cements: Colton, Type II; Colton, Type III; Victor, Type III.Aggregates: 1. SG or San Gabriel, a reference aggregate from the Irwindale
Pit of Consolidated Rock Products Co., Calif.2. ENR or Eniwetok Atoll reef coral from Eniwetok Islet,
Marshall Islands; a good-quality coral consisting of95 percent coralline limestone.
3. GMR or Guam reef coral from Apra Harbor, Guam, theMarianas; a poor-quality coral consisting of 96 percentcellular coral or porous coralline rock.
4. Specific characteristics:
SG ENR GMRItem
C F C F C F
Weighted AvgBulk Sp Gr (oven-dry) 2.66* 2.63* 2.49 2.49 L: 2.16
H: 2.11*
24-hr abs, percent 1.6* 1.8* 2.32 2.32 20.0* 7.6*
Comparative general Reference aggregate, 73 Good 73 49 Good 45physical condition, approx. 100 percent 25 Fair 25 45 Fair 45percent by weight good 2 Poor 2 6 Poor 10
* Determined by Task Engineers.
Data without (*) taken from NCEL TN-335A.
** L = W/C ratio of 0.702.H = W/C ratio of 0.444.
Note: San Gabriel aggregate was used unless otherwise indicated.
40

Table I. Summary of Concrete Mix Design Data (Cont'd)
5. Grading: Pounds retained on each sieve per 6.00± cu-ft batch
SG ENR GMRSieve
H L H L H L
3/4 19.7 16.5 0 0 0 0
3/8 197.6 196.6 202.0 193.8 179.6 172.4No. 4 125.1 121.0 116.4 110.0 103.4 98.0No. 8 72.5 85.9 67.2 77.8 59.8 69.6No. 16 65.9 82.9 61.2 75.2 54.4 67.0No. 30 72.5 83.5 67.2 76.0 59.8 67.6No. 50 59.2 76.2 55.2 69.4 49.0 61.8No. 100 33.1 38.7 30.6 35.4 27.2 31.2Pan 13.3 18.7 12.2 17.0 10.8 15.2
Total 658.9 720.0 612.0 654.6 544.0 582.8
Water: Port Hueneme tap water at 73.4 F.
Chemical analysis (ppm): hydroxide (0.0); carbonate (0.0);bicarbonate (137.0); chlorides (62.0); calcium (38.0); magnesium (14.6);sulphate (465.0); sodium and potassium (219.0).
Slump: Designed for 3 in.
B. Batch of 1 .0± cu ft consisted of the following:
SG ENR GMRMix Design Factors
H L H L H L
W/C 0.444 0.702 0.444 0.702 0.444 0.702Water (lb)a/ 11.7 11.7 13.4 13.8 13.4 13.8Cement (lb) 26.4 16.7 30.1 19.7 30.1 19.7Cement Factor 7.62 4.81 8.65 5.66 8.65 5.66Aggregcte (Ib) 109.9 120.0 102.0 109.0 90.7 97.2
a9 The quantity of water added at the mixer was corrected for moisture present inthe aggregate and moisture required for absorption.
b/ Sacks per cu yd of concrete.
41

Table Ila. Compressive Strength Versus Sodium ChlorideContent for W/C = 0.702
Compressive strength after various days of curein 100 percent RH at 73.4 F
Batch NaCIla (psi)b/No.
14d Std Dev 28d 56d 112d 224d 364d14d
SIL-1 0 3990 95 4480 4700 5030 4970 4910
SIL-2 0.075 4290 100 4780 5020 5170 5150 5060
SIL-3 0.150 4410 95 4890 5070 5290 5350 5230
SIL-4 0.225 4550 115 4790 5210 5460 5510 5420
SIL-5 0.300 4630 115 5020 5330 5630 5500 5450
SIL-6 0.450 4430 95 4800 4920 5160 5380 5280
SIL-7 0.600 4250 95 4610 4740 5080 5060 5330
SIL-8 0.750 4150 100 4510 4660 5010 5130 5150
SIL-9 0.900 4090 105 4440 4/50 4930 4860 4850
SIL-10 1.200 3830 100 4200 4360 4540 4710 4630
SIL-11 1.800 3280 85 3620 3800 4040 4130 4450
SIL-12 2.400 2760 65 3000 3320 3750 3660 3960
a__ Percent by weight of fresh concrete.
bj Three cylinders (4-in. -dia. by 8-in.) for each age for each salt concentrationexcept for 14d age: 15 cylinders for each were used.
Note: C-Type III cement; slump: 3 in. with no salt; with salt, slump ranged from5 to 8 in. as salt content was increased.
42

Table lib. Compressive Strength Versus Sodium ChlorideContent for W/C = 0.444
Compressive strength after various days of curein 100 percent RH at 73.4 F
Batch NaCla/ (psi)b/No.
14d Std Dev 28d 56d 112d 224d 364d14d
SIH-1 0 6760 200 6970 8020 8060 8150 8450
SIH-2 0.075 6550 185 6930 7290 7880 8040 8440
SIH-3 0.150 6620 180 7380 7630 7940 8180 8420
SIH-4 0.225 6840 180 6950 7820 7800 8570 8630
SIH-5 0.300 6940 125 7320 7760 7650 8380 8570
SIH-6 0.450 6780 185 7210 7590 8010 8480 8800
SIH-7 0.600 6640 150 7180 7550 7910 8100 8160
SIH-8 0.750 6510 130 7260 7560 7370 7990 8410
SIH-9 0.900 6150 185 6460 6820 7740 8000 8000
SIH-10 1.200 5800 160 6330 6720 7000 7310 7630
SIH-11 1.800 5070 125 5390 5800 6240 6370 6260
SIH-12 2.400 4480 65 4770 5020 5340 5450 5150
.2/ Percent by weight of fresh concrete.
b/ Three cylinders (4 -in.-dia. by 8-in.) for each age for each salt concentrationexcept for 14d age: 15 cylinders for each were used.
Note: C-Type III cement; slump: 3 in. with no salt; with salt, slump ranged from5 to 8 in. as salt content was increased.
43

Table 111. Compressive Strength Versus Sea-Water Concentrationfor W/C = 0. 702
Compressive strength after various days of curein 100 percent RH at 73.4 F
Batch Sea-Water (psi)b-/
No7dnetato2 14d 28d SdDv56d 112d 224d 364d28d
S3L-1R 0 2130 2800 3560 150 4240 4820 5080 5160
$31--2 20 2290 2830 3330ý 45 4080 4770 5030 5370
$3L-3 40 2390 2930 3460 45 4370 4690 5220 5290
$3L-4 60 2590 3010 3610 45 4150 4700 5060 5280
$3L-5 80 2670 3210 3770 70 42'80 4810 5180 5460
$3L-6 100 2800 3400 3890 100 4620 5080 5440 5760
$31L-7 120 2820 3470 3980 65 4410 4950 5330 5350
$3L-8 140 2840 3420 3810 110 4270 4780 5200 5340
$3L-9 160 2830 3410 3820 100 4350 4860 5260 5390
53 L- 10 200 2950 3460 4040 90 4560 5070 5460 5540
_E Percent by weight of mixing water; Sea-Rite added to sea water to obtain con-centrations greater than 100 percent.
SThree cylinders (4-in.-dia. by 8-in.) for each age for each sea-water concen-tration except for 28d age: 9 cylinders for each were used.
Note: C-Type 11 cement; slumps: 3 in. and nearly constant for all batches.
44

I,
Table IV. Compressive Strength Versus Sea-Rite WaterConcentration for W/C = 0.702
Compressive strength aftervarious days of cure in
Batch Sea-Rite Water 100 percent RH at 73.4 FNo. Concentration-/ (psi/
28d 56d 112d 224d
SR-1L 0 3270 4060 4550 4920
SR-2L 20 3420 4100 4610 4930
SR-3L 40 3460 4040 4660 4940
SR-4L 60 3350 4050 4460 4890
SR-5L 80 3580 4120 4650 5040
SR-6L 100 3610 4090 4560 4990
SR-7L 120 3680 4i80 4690 5060
SR-8L 140 3680 4200 4700 5040
SR-9L 160 3740 4270 4770 5100
SR-1OL 180 3780 4300 4810 5010
SR-IlL 200 3870 4340 4800 5220
a/ Concentration of sea-water equivalent in mixing water,percent by weight.
b. Three cylinders (4-in.-dia. by 8-in.) for each age foreach Sea-Rite water concentration.
Note: C-Type II cement; slumps: nearly constant;minimum = 2.75 in., maximum = 3.25 in.
45r

Table V. Compressive Strength of Wall Specimens
Compressive Strength (psi)Age of 3-in.-dia by 6-in. concrete cylindersAggregate Typea'a-and W/C (days)
28db 56d 112d 224d 448d
SG, 0.702
Land Side 4420 5250 4450 59903330Sea Side 4390 5060 4940 4600
SG, 0. 444
Land Side 7990 7990 8140 8500Sea Side 7410 7390 8460 7880
ENR, 0.702
Land Side 4490 4600 4510 4780Sea Side 3240 5230 4550 4670
ENR, 0.444
Land Side 7410 7820 8150 88506150Sea Side 7600 7610 8110 8280
GMR, 0. 702
Land Side 1990 2230 2040 24001630Sea Side 1960 2430 1980 2190
GMR, 0.444
Land Side 4670 4550 4840 60503610Sea Side 4460 5180 4880 5240
2,/ See Table I.
b/Each value is average of four fog-cured cylinders; other values are averagesof three field-cured cylinders.
Note: C-Type II cement.
46

Table VI. Water Vapor Transmission Versus Sodium ChlorideConcentrations in Mixing Water for W/C = 0. 702(also see Table XIII)
Batch Cup NaCI / W't 1 WAT AvgNo. No. Contenta k (t vT WVT
S2L-1 T483 0 1.992 0.625 0.370S2L-1 T484 0 1.972 0.642 0.380
S2L-2 T500 0.15 1.986 0.500 0.296S2L-2 T501 0.15 1.902 0.505 0.299
S2L-3 T547 0.30 1.987 0.504 0.298 0.295S2L-3 T548 0.30 1.975 0.494 0.292
S2L-4 T580 0.60 1.928 - --S2L-4 T581 0.60 2.160 0.308 0.182
S2L-5 T597 1.20 1.983 0.291 0.172S2L-5 T598 1.20 2.022 0.305 0.180
S2L-6 T646 2.40 1.971 0.303 0.17952L-6 T647 2.40 1.986 0.301 0.178
a NaCI content, percent by weight of fresh concrete; V-Type IIIcement.
b/ Length of flow path (or thickness of specimen).
.cJ Slope of straight-line portion of graph of water loss in grams versustime in days; 520 days of record; 20 percent RH at 73.4 F.
d/ Grains per sq in. per day (1 gram = 15.43 grains). Area of crosssection of flow path is 26.06 sq in. All specimens have a nominaldiameter of 6 in.
47

Table VII. Water Vapor Transmission of Concrete With 1.5Percent Sodium Chloride by Weight of FreshConcrete (Salinity of 159 /oo) for W/C = 0.702
RH atCut2/ Nominal /t WV/Cup 73.4 F ' (in.) Dia (in.) w/t wvTNo. (percent)
U827A 20 1.504 4 0.167 0.232
U827B 20 3.039 4 0.097 0.135
U828A 50 1.480 4 0.118 0.164
U828B 50 3.049 4 0.073 0.101
U829A 75 1.516 4 0.084 0.117
U829B 75 3.007 4 0.038 0.053
U822B 20 1.996 6 0.261 0.155
U822M 50 2.044 6 - -
U822T 75 2.059 6 0.149 0.088
.2/ Length of flow path (or thickness of specimen).
/Slope of straight-line portion of graph of water loss in grams versustime in days; 400 days of record.
c_/ Grains per sq in. per day (1 gram = 15.43 grains). Effective cross-sectional area of 4-in.-diameter specimens = 11.12 sq in., and of6-in.-diameter specimens = 26.06 sq in.
Note: S5L-1 series, C-Type II cement.
48

Table VIII. Water Vapor Transmission of Concrete WithoutAdmixtures for W/C = 0.444
RH at 1Cup 73.4 F t, (in.)a' in W/t/ wvTc/No. (percent) Dia (in.)
U871A 20 1.506 4 0.109 0.151
U871B 20 3.067 4 0.077 0.107
U872A 50 1.498 4 0.081 0.113
U872B 50 3.056 4 0.052 0.072
U873A 75 1.538 4 0.045 0.062
U873B 75 3.060 4 0.034 0.047
U874A 20 2.004 6 0.210 0.124
U874B 50 2.050 6 0.151 0.089
U874C 75 2.039 6 0.098 0.058
.q/ Length of flow path (or thickness of specimen).
jSlope of straight-line portion of graph of water loss in grams versustime in days; 400 days of record.
c/ Grains per sq in. per day (1 gram = 15.43 grains). Effective cross-sectional area of 4-in.-diameter specimens = 11.12 sq in., and of6-in.-diameter specimens = 26.06 sq in.
Note: S5H-1 series, C-Type II cement.
49
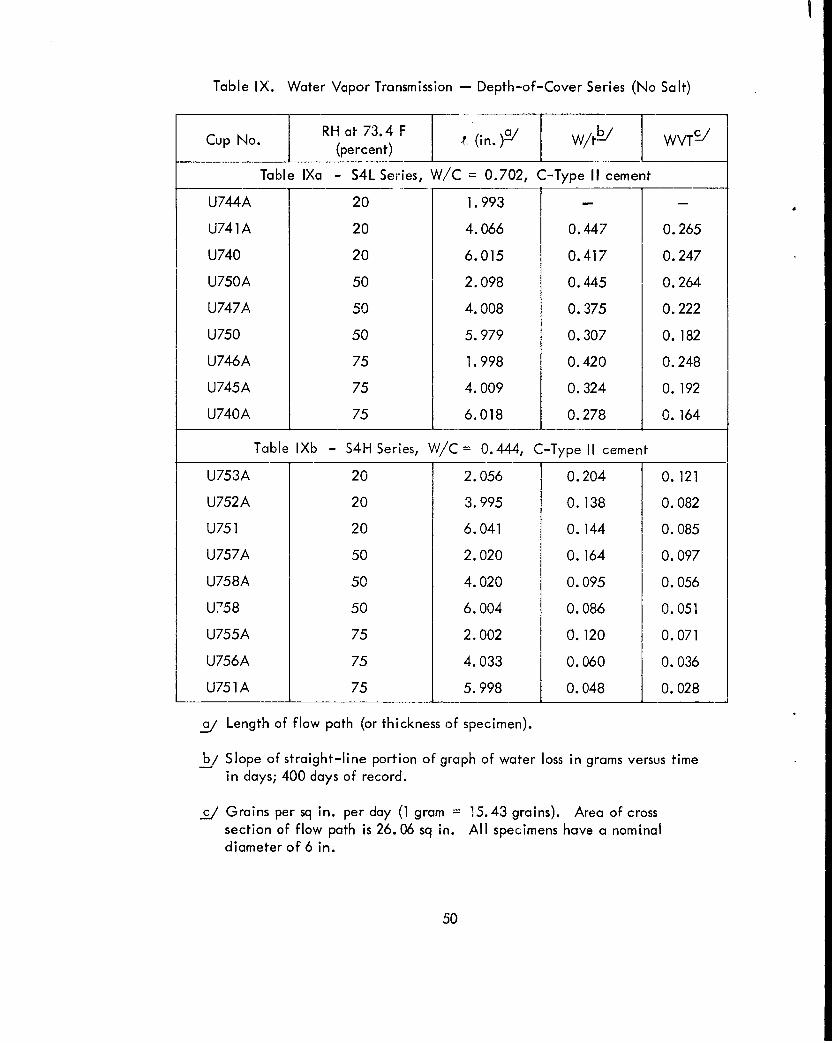
Table IX. Water Vapor Transmission - Depth-of-Cover Series (No Salt)
Cup No. RH at 73.4 F (in.)2/ W/tb/ WVTW/I (percent) ________ __ __ __
Table IXa - S4L Series, W/C = 0.702, C-Type II cement
U744A 20 1.993 - -
U741A 20 4.066 0.447 0.265
U740 20 6.015 0.417 0.247
U750A 50 2.098 0.445 0.264
U747A 50 4.008 0.375 0.222
U750 50 5.979 0.307 0.182
U746A 75 1.998 0.420 0.248
U745A 75 4.009 0.324 0.192
U740A 75 6.018 0.278 0.164
Table IXb - S4H Series, W/C = 0.444, C-Type II cement
U753A 20 2.056 0.204 0.121
U752A 20 3.995 0.138 0.082
U751 20 6.041 0.144 0.085
U757A 50 2. 020 0. 164 0.097
U758A 50 4.020 0.095 0.056
U758 50 6.004 0.086 0.051
U755A 75 2.002 0.120 0.071
U756A 75 4.033 0,060 0.036
U751A 75 5.998 0.048 0.028
_2/ Length of flow path (or thickness of specimen).
jSlope of straight-line portion of graph of water loss in grams versus timein days; 400 days of record.
_c/ Grains per sq in. per day (1 gram = 15.43 grains). Area of crosssection of flow path is 26.06 sq in. All specimens have a nominaldiameter of 6 in.
50

Table X. Water Vapor Transmission Versus Sea-Water Concentrations inMixing Water for W/C = 0. 702 (also see Table XIV)
Batch Cup Sea-Water RH at 73.4 F Nominal Dia 4 ( W/W WVT9./No. No. Corcentrationa/ (percent) (in.)b/
S3L-1 U306 0 20 6 2.000 0.488 0.289
S3L-2 U414 20 20 6 2.001 0.460 0.272
S3L-3 U447 40 20 6 2.006 - -
S3L-4 U480 60 20 6 1.960 0.348 0.206
S3L-5 U514 80 20 6 1.996 0.302 0. 179
S3L-6 U569 100 20 6 2.034 0.308 0. 182
S3L-7 U605 120 20 6 2.009 0.303 0. 179
S3L-8 U638 140 20 6 2.033 0.325 0. 192
S3L-9 U671 160 20 6 2.043 0.313 0.185
S3L-10 U704 200 20 6 2.000 0.296 0. 175
S3L-1 U307C 0 20 4 1.476 0.248 0.344
S3L-1 U307D 0 20 4 3.029 0.231 0.321
S3L-3 U448C 40 20 4 1.506 0.218 0.303
S3L-3 U448D 40 20 4 3.069 - -
S3L-5 U515C 80 - 20 4 1.494 0. 192 0.266
S3L-5 U515D 80 20 4 3.031 0. 112 0. 155
S3L-7 U606C 120 20 4 1.489 0.204 0.283
S3L-7 U606D 120 20 4 3.056 0.118 0.164
S3L-9 U672C 160 20 4 1.513 0.196 0.272
S3L-9 U672D 160 20 4 3.061 0.114 0. 158
S3L-1 U307A 0 50 4 3.060 - -
S3L-1 U307B 0 50 4 1.512 0.209 0.290
S3L-3 U448A 40 50 4 3.072 0.121 0.168
S3L-3 U448B 40 50 4 1.526 0.184 0.255
51

Table X. Water Vapor Transmission Versus Sea-Water Concentrations inMixing Water for W/C = 0.702 (also see Table XIV) (Cont'd)
Batch Cup Sea-Water RH at 73.4 F Nominal DiaNo. No. Concentrationa/ (percent) (in.)b/ ? (in.)cw/td_/WVTe_/
S3L-5 U515A 80 50 4 3.054 0.094 0. 131
S3L-5 U515B 80 50 4 1.503 0.153 0.212
S3L-7 U606A 120 50 4 3.053 0.088 0. 121
S3L-7 U606B 120 50 4 1.497 0.168 0.233
S3L-9 U672A 160 50 4 3.078 0.089 0. 123
S3L-9 U672B 160 50 4 1.492 0.152 0.211
S3L-1 U308E 0 75 4 1.506 0.174 0.242
S3L-1 U308F 0 75 4 3.020 0.177 0.246
S3L-3 U449E 40 75 4 1.529 0.140 0. 194
S3L-3 U449F 40 75 4 2.994 0.128 0. 178
S3L-5 U516E 80 75 4 1.500 0.110 0. 153
S3L-5 U516F 80 75 4 3.030 0.083 0.115
S3L-7 U607E 120 75 4 1.494 0. 129 0. 179
S3L-7 U607F 120 75 4 3.025 0.076 0. 105
S3L-9 U673E 160 75 4 1.491 0.115 0.160
S3L-9 U673F 160 75 4 2.936 0.073 0. 101
2/ Concentration of sea water in mixing water, percent by weight.
b/ Area of cross section of flow path for 6-in. cups is 26.06 sq in. ; for 4-in. cups,area is 11.12 sq in.
c/ Length of flow path (or thickness of specimen).
d/ Slope of straight-line portion of graph of water loss in grams versus time in days;440 days of record.
e/ Grains per sq in. per day (1 gram = 15.43 grains).
Note: C-Type II cement.
52

Table X1. Water Vapor Transmission of Kwajalein Coral Concrete
Cup No. tr (in.)S!/ W/tb/ WVT-C/
S684M 2.017 0.374 0.221
S685M 1.995 0.376 0.223
S684T 4.081 0.203 0.120
S685B 4.098 0.224 0.133
_, Length of flow path (or thickness of specimen).
b,/ Slope of straight-line portion of graph of water loss in gramsversus time in days; 570 days of record; 20 percent RH at 73.4 F.
c Grains per sq in. per day (1 gram = 15.43 grains). Nominaldiameter of cups is 6 in.; effective cross section of flow pathis 26.06 sq in.
Note: Japanese Type II cement.
53

Table XII. Water Vapor Transmission of Wall Specimens
Type of Cu N ( \AC/ 1 T4J' AvgAggregatea C P 4 (in. / _ __WVT
W/C = 0.444
ENR V84A 2.018 0.166 0.098 0.100ENR V84B 2.031 0.170 0.101
SG U997A 2.080 0.212 0.126SG U997B 1.999 0.241 0.143
GMR V170A 1.994 0.453 0.268GMR V170B 2.000 0.467 0.276
W/C = 0.702
ENR V41A 1.976 0.270 0.160ENR V41B 2.055 0.264 0.156
SG U954A 2.021 0.492 0.291SG U954B 2.012 0.527 0.312
GMR V127A 2.004 0.580 0.343
GMR V127B 2.032 0.550 0.326
aqj See Table I.
b/ Length of flow path (or thickness of specimen).
c/ Slope of straight-line portion of graph of water loss in grams versus timein days; 360 days of record; 50 percent RH at 73.4 F.
J Grains per sq in. per day (1 gram = 15.43 grains). Nominal diameterof cups is 6 in.; effective cross section of flow path is 26.06 sq in.
Note: C-Type II cement.
54
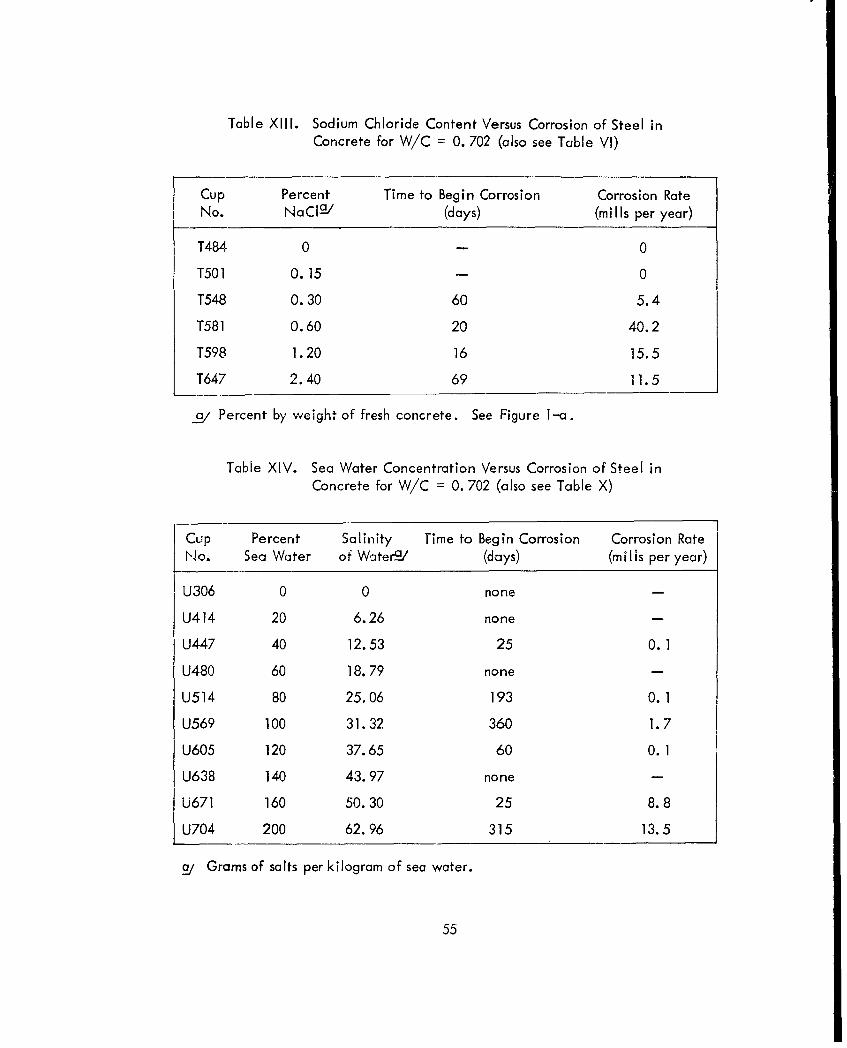
Table XIII. Sodium Chloride Content Versus Corrosion of Steel inConcrete for W/C = 0. 702 (also see Table VI)
Cup Percent Time to Begin Corrosion Corrosion RateNo. NaCla/ (days) (mills per year)
T484 0 0
T501 0.15 - 0
T548 0.30 60 5.4
T581 0.60 20 40.2
T598 1.20 16 15.5
T647 2.40 69 11.5
a_/ Percent by weight of fresh concrete. See Figure 1-a.
Table XIV. Sea Water Concentration Versus Corrosion of Steel inConcrete for W/C = 0. 702 (also see Table X)
Cup Percent Salinity Time to Begin Corrosion Corrosion RateNo. Sea Water of Watera-/ (days) (mills per year)
U306 0 0 none
U414 20 6.26 none -
U447 40 12.53 25 0.1
U480 60 18.79 none -
U514 80 25.06 193 0.1
U569 100 31.32 360 1.7
U605 120 37.65 60 0. 1
U638 140 43.97 none -
U671 160 50.30 25 8.8
U704 200 62.96 315 13.5
a_/ Grams of salts per kilogram of sea water.
55

00~
I 'S
2l :
c'J
o T)
I j <
CC 4
w -C
C4 C)) 'It
C3 OD CDI (0 V
2o x-o > :ý
00
Li CD)
'o C',
04 I- Z0 < 0 1
C).
H :cc ow. Z1
'0 0
-0
E a' -F -
56

DISTRIBUTION LIST
No. of SNDLcopies Code
10 Chief, Bureau of Yards and Docks (Code 70)
1 23A Naval Forces Commanders (Taiwan Only)
4 39B Construction Battalions
10 39D Mobile Construction Battalions
3 39E Amphibious Construction Battalions
2 39F Construction Battalion Base Units
1 A2A Chief of Naval Research - Only
2 A3 Chief of Naval Operation (OP-07, OP-04)
5 AS Bureaus
2 B3 Col leges
2 E4 Laboratory ONR (Washington, D. C. only)
1 E5 Research Office ONR (Pasadena only)
I E16 Training Device Center
7 F9 Station - CNO (Boston; Key West; San Juan; Long Beach; San Diego; Treasure Island;
and Rodman, C. Z. only)
6 F17 Communication Station (San Juan; San Francisco; Pearl Harbor; Adak, Alaska; and
Guam only)
1 F41 Security Station
1 F42 Radio Station (Oso and Cheltanham only)
1 F48 Security Group Activities (Winter Harbor only)
8 H3 Hospital (Chelsea; St. Albans, Portsmouth, Va; Beaufort; Great Lakes; San Diego;Oakland; and Camp Pendleton only)
1 H6 Medical Center
2 J1 Administration Command and Unit - BuPers (Great Lakes and San Diego only)
I J3 U. S. Fleet Anti-Air Warfare Training Center (Virginia Beach only)
2 J4 Amphibious Bases
1 J19 Receiving Station (Brooklyn only)
I J34 Station - BuPers (Washington, D. C. only)
1 J37 Training Center (Bainbridge only)
I J46 Personnel Center
1 J48 Construction Training Unit
1 J60 School Academy
1 J65 School CEC Officers
1 J84 School Postgraduate
1 J90 School Supply Corps
57

Distribution List (Cont'd)
No. of SNDLcopies Code
1 J95 School War College
1 J99 Communication Training Center
11 Li Shipyards
4 L7 Laboratory - BuShips (New London; Panama City; Carderock; and Annapolis only)
5 L26 Naval Foailities - BuShips (Antigua; Turks Island; Barbados; San Salvador; andEleuthera only)
I L30 Submarine Base (Groton, Conn. only)
2 L32 Naval Support Activities (London & Naples only)
2 L42 Fleet Activities - BuShips
4 M27 Supply Center
6 M28 Supply Depot (Except Guantanamo Bay; Subic Bay; and Yokosuka)
2 M61 Aviation Supply Office
15 NI BuDocks Director, Overseas Division
28 N2 Public Works Offices
7 N5 Construction Battalion Center
5 N6 Construction O fficer-in-Charge
1 N7 Construction Resident-Officer-in-Charge
12 N9 Public Works Center
1 N14 Housing Activity
2 R9 Recruit Depots
2 R10 Supply Installations (Albany and Barstow only)
I R20 Marine Corps Schools, Quantico
3 R64 Marine Corps Base
I R66 Marine Corps Camp Detachment (Tengan only)
6 WIAI Air Station
35 WIA2 Air Station
8 WIB Air Station Auxiliary
4 WIC Air Facility (Phoenix; Monterey; Oppoma; Naha; and Naples only)
4 WIE Marine Corps Air Station (Except Quantico)
I W1F Marine Corps Auxiliary Air Station
8 WiH Station - BuWeps (Except Rota)
I Deputy Chief of Staff, Research and Development, Headquarters, U. S. Marine Corps,Washington, D. C.
I President, Marine Corps Equipment Board, Marine Corps School, Quantico, Va.
2 Library of Congress, Washington, D. C.
10 Director, Office of Technical Services, Department of Commerce, Washington, D. C.
58

Distribution List (Cont'd)
No. ofcopies
I Chief of Staff, U. S .Army, Chief of Research and Development, Department of the Army,Washington, D. C.Office of the Chief of Engineers, Assistant Chief of Engineering for Civil Works, Department of
the Army, Washington, D. C.
I Chief of Engineers, Cepartment oi the Army, Attn: Engineering R & D Division, Washington, D. C.
1 Chief of Engineers, Department of the Army, Attn: ENGCW-OE, Washington, D. C.
1 Director, U. S- Army Engineer Research and Develcprrwtnt Laboratories, Attn- InformationResources Branch, Fort Belvoir, Va.
I Headqtarters, Wright Air Development Division, (WWAD-Library), Wright-Patterson Air ForceBase, Ohio
3 Headquarters, U. S. Air Force, Directorate of Civil Engineering, Attn: AFOCE-ES,Washington, D. C.
1 Commanding Officer, U. S. Naval Construction Battalion Center, Port Hueneme, Calif., Attn:Materiel Dept., Code 140
1 Deputy Chief of Staff, Development, Director of Research and Development, Department of theAir Force, Washington, D. C.
1 Director, National Bureau of Standards, Department of Commerce, Connecticut Avenue,Washington, D. C.
2 Office of the Director, U. S. Coast and Geodetic Survey, Washington, D. C.
10 Armed Services Technical Information Agency, Arlington Hall Station, Arlington, Va.
2 Director of Defense Research and Engineering, Department of Defense, Washi ngton, D. C.
2 Director, Division of Plans and Policies, Headquarters, U. S. Marine Corps, Washington, D. C.
2 Director, Bureau of Reclamation, Washington, D. C.
1 Commanding Officer, U. S. Navy Yards and Docks Supply Office, U. S. Naval Construction
Battalion Center, Port Hueneme, Calif.
1 Facilities Officer (Code 108), Officze of Naval Research, Washington 25, D. C.
1 Federal Aviation Agency, Office of Management Services, Administrative Services Division,Washington 25, D. C. Attn: Library Branch
59

Distribution List (Cont'd)
No. ofcopies
1 Director, Marine Physical Laboratory, U. S. Navy Electronics Laboratory, San Diego
1 Commander, Pacific Missile Range, Attn: Technical Director, Point Mugu, Calif.
1 Commander, U. S. Naval Shipyard, Attn: Materials and Chemical Lab., Boston, Mass.
1 Office of Naval Research, Branch Office, Navy No. 100, Box 39, FPO, New York
1 Deputy Chief of Staff, Research & Development Headquarters, U. S. Marine Corps, Washington, D. C.
1 Deputy CCMLO for Scientific Activities, Washington, D. C.
1 U. S. Army, Attn: Director of Research and Development Group, Washington, D. C.
1 Chief, Concrete Division, Waterways Experiment Station, P. 0. Drawer 2131, Jackson, Miss.
1 Federal Housing Administration, Washington, D. C.
1 Mr. J. R. Moses, Director (C-400), Materials Testing and Evaluation Division, District PublicWorks Office, 14ND, Navy No. 12S, FPO, Son Francisco
1 Mr. E. M. Raymond (D-220:EMR), Materials Division District Public Works Office, 14ND, NavyNo. 128, FPO, San Francisco
1 Director, National Bireau of Standards, Department of Commerce, Connecticut Ave., Washington,D. C., Attn: Mr. Melvin Romanoff
1 Officer in Charge, U. S. Naval Supply Research and Development Facility, Naval Supply Center,Attn: Library, Bayonne, N. J.
I Officer in Charge, U. S. Navy Unit, Rensselaer Polytechnic Institute, Troy, N. Y.
1 Officer in Charge, U. S. Naval Supply Research and Development Facility, Naval Supply Center,Bayonne, N. J.
1 Commanding Officer, Fleet Training Center, Navy No. 128, %FPO, San Francisco
1 Commander, U. S. Naval Shipyard, Attn: Material Laboratory, Brooklyn, N. Y.
I U. S. Naval Research Laboratory, Chemistry Division, Washington, D. C.
1 Commandant, 1st Naval District, Attn: CEC Naval Reserve Program Officer, 495 Summer Street,Boston, Mass.
1 Commandant, 3rd Naval District, Attn: CEC Naval Reserve Program Officer, 90 Church Street,New York
1 Commandant, 4th Naval District, Attn: CEC Naval Reserve Program Officer, Naval Base,Philadelphia, Pa.
1 Commandant, 5th Naval District, Attn: CEC Naval Reserve Program Officer, Norfolk, Va.
I Commandant, 6th Naval District, Attn: CEC Naval Reserve Program Officer, U. S. Naval Base,Charleston, S. C.
1 Commandant, 8th Naval District, Attn: CEC Naval Reserve Program Officer, U. S. Naval Station,New Orleans, La.
1 Commandant, 9th Naval District, Attn: CEC Naval Reserve Program Officer, Building 1,Great Lakes, Ill.
1 Commandant, 11th Naval District, Attn: CEC Naval Reserve Program Officer, 937 N. HarborDrive, San Diego
1 Commandant, 12th Naval District, Attn: CEC Naval Reserve Program Officer, Federal OfficeBuilding, San Francisco
60

Distribution List (Cont'd)
No. ofcopies
I U. S. Army Corps of Engineers, Office of the District Engineer, St. Paul District, 1217 U.S.P.D"and Customs House, St. Paul, Minn.
1 PCA, Research and Development Labs, 5420 Old Orchard Road, Skokie, III.
1 U. S. Army Waterways Experiment Station, Corps of Engineeiý, Jackson Installation, ConcreteDivis'on, P. 0. Drawer 2131, Jackson, Miss.
1 Library, Engineering Department, Iowa State University, Ames, Iowa
1 Libraty, Iowa State University, Ames, Iowa
1 Library, University of Alasko, Fairbanks, Alaska
1 Columbia University, Lamont Geological Observatory, Attn: Library, Palisades, N. Y.
1 Department of Mechanical Engineering, West Virginia University, Morgantown, W. Va.
1 Chief, Physical Research Branch, Research Division, U. S. Department of Commerce, Bureau of
Public Roads, Washington, D. C.
1 Director, Engineering Research Institute, University of Michigan, Ann Arbor, Mich.
1 Library, Engineering Department, University of California, 405 Hilgard Avenue, Los Angeles
1 Library, oaltelle Institute, Columbus, Ohio
1 Library, University of Southern Califoinia, University Park, Los Angeles
I Director, Soil Physics Laboratory, Department of Engineering, Attn: Library, Princeton Uniersity,
Princeton, N. J.
1 Library, West Virginia University, Morgantown, W. Va.
1 Library, Engineering Department, West Virginia University, Morgantown, W. Va.
1 Library, Borea College, Berea, Kty.
I Director, The Technological Institution, Northwestern University, Evanston, Ill.
1 Library, Institute of Technology, University of Minnesota, Minneapolis, Minn.
1 Library, California Institute of Technology, Pasadena, Calif.
1 Chief of Engineers, Department of the Army, Washington, D. C.
I Mr. Walter Gunther, The Mitre Corporation, P. 0. Box 208, Lexington, Mass.
I Commandant, 13th Naval District, Attn: CEC Naval Reserve Program Officer, Seattle, Wash,
61

CN CN
LL c
0 C ) N Cb ;0
-4)1C C -.C,.
00 0± -o
wEZJ - 4 ) E c e -0 Ln o 0 ) c
.2 ~ 0) u) 0z 0 5 .- U oo0 < a,0 0
-0 od Z~ -- D -0 0 w -0 .
4~-
-- .2-a , -D o P E0- 5 0 Lý t') 13- z U -;a
,: () 0 0)C4u
_0 (N .. 2 -0Cc,) :- 00 .2N1 o a ý
- 0 U -0, 1-, .o .
J0.L Z 0 .- Q) >40
_) -j o ': 7 '
4) , )
o U 0 J
CC . -
:E~ u E L QF- 0 < W U
-0 a) 0 Q0
7: uo 0 z -.. ,
U-~, U- o - ~ . I
0 00). ~
I C u C4)
Z w -ad Z ,E-o o -o 0- 0- 0 U-D... a- d
z u < , V
z 0 'L-0 u i - - 0Ez; >4CC I .4 kn~t ~ o 20O~ -<0 0 1 :
u U,- uo . ,,w '0 0 0 .- C-
04~~~, -0O -,c