unclassified eeeeeeeeiieiie eeeeiiiiiiiiie ... organiuzation -name and address 10. program element....
TRANSCRIPT
7 AOAO87 090 'AIR FORCE INST OF TECH WRIGHT-PATTERSON APR OH SCHOOL--ETC F/6 15/5
CORRELATION BETWEEN THE ASSIGNMENT OF PERSONNEL TO TECHNICAL -TCC(U)JUN 80 H WILLIAMS, A B WINN
UNCLASSIFIED AFIT-LSSR-22-80 NLEi h' ' I I I I I EIEEEEEEEEIIEIIEEEEEIIIIIIIIIEIIIIIEEEIIIIIElllEEEEEEEEEEIEIIIIIIIEEEEE

'ow Ir Im4
ra0
42
DEPARTMENT OF THE AIR FORCEAIR UNIVERSITY (ATC)
AIR FORCE INSTITUTE OF TECHNOLOGY
&hL2S~t~ronAir Force gas*, Ohio

,3
A CORRELATION BETWEEN THE ASSIGNMENTOF PERSONNEL TO TECHNICAL ORDERVALIDATION/VERIFICATION VERSUS
TECHNICAL ORDER DEFICIENCYFORMS GENERATED
Herman Williams, GS-13Arthur B. Winn, GS-11
LSSR 22-80
-al
w ils

The contents of the document are technically accurate, andno sensitive items, detrimental ideas, or deleteriousinformation are contained therein. Furthermore, the vilweexpressed in the document are those of the author(s) and donot necessarily reflect the views of the School of Systemsand Logistics, the Air University, the Air Traininq Coumand,the United States Air Forc , or the Department of Defense.
Is
rv\
*
U
-
A..

ISAP SCN 75-20B AM Control Number ISSR 22-80
API? RESEARH ASSEWE~
The purpose of this questionnaire is to detemine the potential for currentand future applications of API thesis research. Please return completedquestionnaires to: .AErT/ LSH rThesis Feedback), Wright-Patterson AB,Ohio 4S433.
1. Did this research contribute to a current Air Force project?
a. Yes b. No
2. Do you believe this research topic is significant enough that it wouldhave been researched Cor contracted) by yaw organization or another agencyif AFI? had not researched it?
a. Yes b. No
3. The benefits of API? research can often be expressed by the equivalentvalue that your agency received by virtue of AFI? perforing the research.Can you estimate what this research would have cost if it had beenaccomplished under contract or if it had been done in-house in terms of man-power and/or dollars?
a. Mn-years $ (Contract).
b. MNm-years S (In-house).
4. Often it is not possible to attach equivalent dollar values to research,although the results of the research may, in fact, be important. Whether ornot you were able to establish an equivalent value for this research C3 above),what is your estimate of its significance?
a. Highly b. Significant c. Slightly d. Of NoSignificant Significant Significance
S. Cants:
'aWow and Grade Position
organization Loction

111111 NO CUAaI
Pft"lTV PC@ PUVATUt. L $3 -- STT
I BUSINESS REPLY MAIL _____
AM? SAM POWf N&. n= WMNINSTS L.
POSTAGS WVl K PAID I AOOM5UI ________
AFL?/LSH (Thesis Feedback)* V~~~~~riht-?accersou AFB OR 45433________
I, -
UNCLASSIFIED
REPORT DOCUMENTATION PAGE READ INSTRUCTIONS_________________________________________ BEFORE COMPLETING FORM
__________. G O..T ACCESSION NO. 3- RECIPIENT'S CATALOG NUMSER
LTJ-o04"*. it Iv .,O REPORT & PERIOD COVERED
CORRELAT ION BETWEEN THE .&SSIGNMENTO'i ESONNEL TO TECHNICAL ORDER VALIDATIQW atr'sTei'VERIFICATION VXRSUS TECHNICALORDER
ny 'T~iN( Y ORMS CMEERATED,IIITORa. .CONTRACT OR GRATO NURa
Herman 'Will jamsi GS-13~: Arthur B./,Minn1 GS-ll
11-prwPR-MING ORGANIUZATION -NAME AND ADDRESS 10. PROGRAM ELEMENT. PROJECT, TASKCAREA & WORK UNIT NUMOCRS
School of Systems and LogisticsAir Frrn Ingtituta nf Technology.WPAFB OH ___________
11. CONTROLLING OFF ICE NMEM AND ADDRESS 2
Department of Communication8and Humanities - US
P RIAGENCYNAMEA ADORESS(it different from Coneo5U~lnd Office) It. SECURITY CLASS I('rT-1pr)
UNCLASS IF lEDiss' OECL ASSI FIC ATI ON/ DOWN GRAOm4-
16. DISTRIBUTION STATEMENT (of this Reort)L SHDL
Approved f or public release; distribution unlimited
17. OISTRIIUUTION STATEMENT (of th. abstract mftered in Block 29. it diffrt hrow goo.M)
'~'EFOR UB CRELEASE AFR I19017,
flERKC.LYCKMa uSAWI11. SUPPLEMENTARY NOTES ZICD 1VDWA~I
III- ICRY WORDS (COMin,.. on reverse ads it necesary and identily by block numbher)
AFTO FORM 22TECHNICAL MANUALTECHNICAL DATAVERIFICATION-LOGISTICS ITT-SO)20. ASRACT (CanIte.. an reverse side it necessary mnd idetify by Woek Member)
Thesis Chairman: Ronald G. Blackledge, Lieutenant Colonel, USAF
DO I P0Mb"7 1473 DIrTON Oir I NOV 65 IS OBSOLETE UCASFE
/SECUIRITY CLASSIFICATION OF T1415 PAGE (1111hon Doa a terow
%MINIMUM.-

!1NCASSIFIEDSCCU~ITY CLASSIFICATION OP THIS PAGC(lmea Date Rn on )
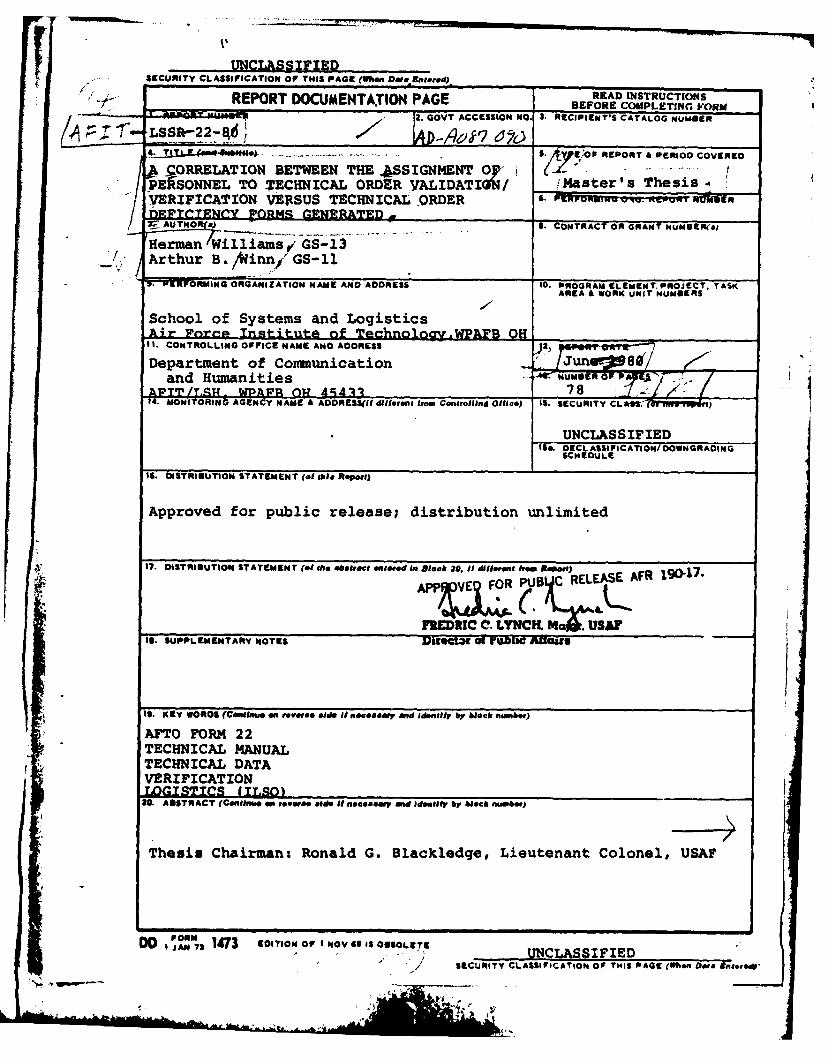
During the acquisition phase of weapon system procurement, thetechnical manuals are developed along with the design of theweapon system. The process of proofing the manual is calledvalidation/verification. This research investigated the rela-tionship hypothesized to exist between the number of peopleattending validation/verification and the number of AFTO Form 22discrepancy forms generated when the weapon system was deliveredto the using commands. Although the variables were tested tomodels of linear, exponential and hyperbolic equations, no sig-nificant correlation was found to exist.
$1CUrNITY CLASSI-ICATIOIJ OF PAG &E(rWhfe Des Enteed)
LSSR 22-80
A CORRELATION BETWEEN THE ASSIGNMENT OF PERSONNEL
TO TECHNICAL ORDER VALIDATION/VERIFICATION VERSUS
TECHNICAL ORDER DEFICIENCY FORMS GENERATED
A Thesis
Presented to the Faculty of the School of Systems and Logistics
of the Air Force Institute of Technology
Air University
In Partial Fulfillment of the Requirements for the
Degree of Master of Science in Logistics Management
By
Herman Williams, BBA Arthur B. Winn, BAGS-13 GS-11
June 1980
Approved for public release;distribution unlimited
4Ui 4,
.$ • , ,. .
This thesis, written by
Mr. Herman Williams
and
Mr. Arthur B. Winn
has been accepted by the undersigned on behalf of thefaculty of the School of Systems and Logistics in partialfulfillment of the requirements for the degree of
MASTER OF SCIENCE IN LOGISTICS MANAGEMENT
DATE: 9 June 1980
COMMITTEE CHAIRMAN
ii

ACKNOWLEDGEMENTS
We wish to express our sincere appreciation to our
thesis advisor, Lieutenant Colonel Ronald G. Blackledge,
Instructor of Logistics Management, School of Systems and
Logistics, Air Force Institute of Technology, for his guid-
ance and understanding throughout this thesis effort. We
are also indebted to the host of logistics and equipment
specialists for their cooperation in providing us with the
necessary data and information. We must also acknowledge
Ms. Ruth E. Hogan and Mrs. Daniel E. Reynolds, whose typing
efforts assisted us greatly in the preparation of this
thesis. A final note of gratitude is given to Mrs. Elvira
Winn, whose understanding and support contributed immensely
to the success of this research effort.
iii
II, . ~ ~ ~ ~ ~~~pl .. ... 1 , _0 ," ., , .' - _ _ ... ... ....

TABLE OF CONTENTS
Page
ACKNOWLEDGEMENTS....................iii
LIST OF TABLES......................vi
LIST OF FIGURES ..................... vii
Chapter
I. INTRODUCTION .................... 1
Background .................... 1
Definitions...................6
Literature Review. ................. 8
Statement of the Problem ............. 12
Research Objective. ................ 13
Research Hypothesis............. 14
II. COLLECTION AND ANALYSIS PLAN........ 15
The Conceptual Model ............. 15
The Operational Model..............19
Data Collection............... 20
Data Analysis.................23
III. DATA DEVELOPMENT ................. 30
General.....................30
Collection Form.................30
Design .................. 30
Format.....................32
iv
jChapter Page
Program Selection Process ............ 32
Approach to Computer Programs..........34
IV. ANALYSIS. .. ........... ........ 36
CURFIT Analysis.................37
SPSS Analysis..................38
SPSS Analysis with Transformed Data. ...... 41
V. FINDINGS, CONCLUSIONS AND RECOMMENDATIONS ... 47
Assumptions and Findings. ............ 47
Conclusions...................49
Recommendations.................49
APPENDICES........................51
A. T.O. DATA COLLECTION CHECKLIST ........... 52
B. RESEARCH RAW DATA.................62
C. INDIVIDUAL SYSTEMS, A-10, C-5, 427M. ........64
D. COMPOSITE SYSTEMS (LARGE AND SMALL). ....... 68
SELECTED BIBLIOGRAPHY...................74
A. REFERENCES CITED..................75
B. RELATED SOURCES..................78
V

LIST OF TABLES
Table Page
*1. Composite Correlation .. .......... . . . 39
*2. Small Systems. ................... 40
*3. Large Systems. ................... 40
4. Exponential Equation Results. ........... 44
5. Geometric Equation Results. ............ 46
16. Regression Analysis Results .. ........... 48
vi
LIST OF FIGURES
Figure Page
1. Approximating Curve.................24
2. Best Fit Curve...................25
3. Economical Area ................... 29
4. T.O. Data Collection Checklist...........31
5. Computer Run for Exponential Equation ......... 43
6. Computer Run for Geometric Equation ......... 45
vii
CHAPTER I
INTRO DUCT ION
Background
Americans have paid many prices to protect their
country. Nowhere is this more dramatically shown than in
the "U.S. casualties in Major Wars [12:420]." Dangers to
the well-being of the country are growing. One notes the
continuing Soviet expansion which, from 1940 to 1948,
engulfed 91.9 million people in the annexation of neigh-
boring countries to the Soviet Union (12:500). Our
country's history is checkered with the attempts of our
nation to survive and yet grow against the backdrop of
social, political, and economic forces in the world--an
argument of guns versus butter. If the awareness of past
struggles, particularly the Russian expansion, is not
enough to suggest a requirement for increased efforts
toward a protection of U.S. National Security, then a turn
from the pages of history to the pages of a current news-
paper will strengthen the view. Hostages held in Iran and
Soviet military intervention in Afghanistan highlight the
recent requirement for strengthening the forces that assure
our national security.
In the era of competing budget priorities--guns
and butter--nowhere is the payback more impressive than
1
S.
in the expenditure of funds to take care of weapons we
already have--the idea of maintenance. This thesis
focuses on maintenance and the proper development of tech-
nical data used in its process.
Security has always depended on weapons. Roman
and feudal gladiators fought with the sword but modern-day
weapons are more sophisticated. Modern technology has pro-
vided such diverse weapons as the M-16 rifle and the F-16
aircraft. Many of the more complex weapons which function
in the microsecond world of today's electronics are intri-
cate and require high levels of maintenance precision or
recurring malfunctions will occur. If malfunctions are
allowed to get out of hand, the "sword" is removed from the
hand of the "gladiator" and he has no weapon with which to
fight. For example, in order for the B-52 to rendezvous
at a given point, an assortment of navigational aids,
including navigation radars, radios, doppler radars, astro-
trackers and sensitive gyroscopic devices are required to
permit the navigator to fly the navigational route and get
the aircraft to its destination. Only then can the strike
be made. Many other supporting systems, like hydraulics,
fuel, and basic flight instrument systems, are also neces-
sary. All these systems must be maintained to a high
degree of availability.
While it may be obvious that proper weapon main-
tenance is necessary, what may not be so obvious is the
2
3. 3 -

role that is played by the technical data and, more spe-
cifically, the technical order (T.O.). The technical order
is where the maintenance procedures are standardized into
a body of knowledge. When maintaining complex systems,
especially with an increasingly younger and inexperienced
work force, standard methods, procedures, and instructions
are vital. Conceptually, one can visualize a hierarchy of
requirements, starting from the requirement of National
Security, to a strong Armed Force, to an effective weapon,
to adequate maintenance of that weapon system and, finally,
to the requirement for accurate and adequate maintenance
procedures supporting that maintenance.
The mandate to acquire an Air Force weapon system
falls to Air Force Systems Command (AFSC). This organiza-
tion is responsible for turning new ideas into hardware,
and then developing the hardware into an operational sys-
tem. while it is true that technical data include much of
the written communication required to develop the new sys-
tem, this thesis is concerned only with the part of tech-
nical data developed for operational maintenance. Walton
described the broad relationship of technical data to the
engineering of new weapon systems as follows:
Engineering new systems entails the considerationof state-of-the-art developments as well as the knownscientific principles. . . . To this end, technicaldata provide the means of communication needed todevelop the new system. With this accomplished thedata are then called upon to support the new system
3

after it has been put in commission (for example, to
support operations, maintenance, and logistics) (27:41.
On the one hand, the technical data aiding in engi-
neering development would be the engineering data that
describe the weapon system in terms of engineering draw-
ings and specifications; on the other hand, the procedural
technical data that is developed from the engineering
specification eventually is placed in the hands of main-
tenance.
Technical manuals embody procedural data. Some
meaningful assurance of the accuracy and adequacy of the
technical manuals is required. Walton discussed the pro-
cesses that are established by the Air Force Systems Pro-
ject Office in AFSC for building and checking these tech-
nical manuals. He discussed the planned subprogram for a
technical manual system development and activation in terms
of a system model document with twelve elements that com-
prise the many requirements, documents, basic concepts,
functional flow diagrams, training equipment listings,
and calculations. He continued:
A vulidation and verification (V&V) plan is alsodeveloped as part of the quality control program totechnical manuals. (Validation is a term commonly usedto describe the contractor program of proving tech-nical data against operating equipment. Verificationis a term used to describe a similar program performedunder the cognizance of the customer.) [27:18].
The emphasis placed on this program aspect (V&V) can be
seen from two other quotes from Walton:
4

Each development program should provide atleast a tentative plan for validation, verifica-tion, and demonstration of procedural technicaldata [27:3691.
and also:
When proving out the technical data in a veri-fication program, the critical concerns should bethe possible lack of information, and the accuracyof the information that is provided [27:37].
But what if the foregoing critical concerns are
not observed? What would be the consequence of little or
no V&V of technical manuals?
If the purpose of technical data is communication,
it follows that inaccurate technical data results in faulty
communication. When this occurs, an Air Force technical
manual discrepancy form (AFTO Form 22) is generated by the
user (35:6-2). The AFTO Form 22s generated describe the
difficulties the user has encountered during his mainte-
nance of the weapon system.
The following case illustrates the effect of inac-
curate technical manuals. In the B-52 modification Inspect
and Repair As Necessary (IRAN) program at Kelly Air Force
Base during the 1960s, it was discovered that the techni-
cal manuals were not adequate in checking out the avionic
subsystems. Aircraft repair and return schedules had to
be slipped since maintenance could not be completed. Man-
agement alerted the weapon system designer, Boeing Aircraft,
,and original contractor engineering data were retrieved to
accomplish depot checkout. Upon receipt of these data it
5

was found that the complex procedure of electronically
solving the various navigational triangles to ascertain
proper heading and drift readouts were imbedded in the
test procedure and had to be laboriously recalculated to
recreate and determine the technical data errors (13).
More precisely, many underlying formulas used longitude
and latitude vectors and computed trigonometric values in
the solutions of the navigation problems in testing the
instruments. It was found that since the geographic loca-
tion of Wichita, Kansas, differs from that of San Antonio,
Texas, those readouts were incorrect. This contributed to
many, many maintenance problems until the system discrep-
ancy was discovered. While the AFTO Form 22 process
identified the general problem areas as each calculation
was flagged as incorrect, it was apparent that a better
review of the procedure during technical manual V&V would
have eliminated the subsequent AFTO Form 22 concerns.
This thesis, thea, is focused on the relationship of a
program's V&V effort and subsequent AFTO Form 22s. Its
purpose, beyond stating the obvious relationship, is to
build up the details of the relationship and arrive at
some conclusions concerning AF management in this area.
Definitions
Key terms and abbreviations used throughout this
paper are summarized as follows:
6

1. Air Force Technical Order (AFTO) Form 22,
Technical Order System Improvement Report--Air Force form
used for recommending improvements in formal technical
orders (T.O.s) and those preliminary T.O.s authorized for
operational and maintenance use.
2. Correlation--the state of relationship such
that to each member of one set or series a corresponding
member of another set is assigned.
3. Integrated Logistics Support (ILS)--a composite
of the elements necessary to assure the effective and
economical support of a system or equipment at all levels
of maintenance for its programmed life cycle.
4. Integrated Logistics Support Office (ILSO)--
refers to that function within the Systems Program Office
responsible for ensuring the timely integration of logis-
tics considerations during program acquisition.
5. Maintenance--the upkeep, preservation, and
repair of weapon systems, weapon system components, or
equipment.
6. Subsystem--the necessary assemblies, subassem-
blies, and parts connected or associated together to per-
form one or more specified functions, usually as a major
subdivision of a complete operational system.
7. Technical Orders--a group of publications
that embody the procedures to operate/maintain Air Force
weapon systems, weapon system components, or equipment.
7
lae

8. Validation--the process by which the contractor
tests maintenance and operating procedures in the proposed
T.O.s for technical accuracy, adequacy, completeness, and
compatibility with the requirement of the applicable mili-
tary specifications.
9. Verification--the process by which T.O.s are
tested and proven (by Air Force personnel under Air Force
jurisdiction) to be clear, logical, and adequate for
operating and maintaining associated equipment and for
certifying that T.O.s are compatible with the pertinent
hardware, tools, and support equipment.
Literature Review
The development and acquisition of Air Force weapon
systems is the responsibility of the Air Force Systems
Command (AFSC). AFSC accomplishes this task through pro-
duct divisions, one of which is the Aeronautical Systems
Division (ASD). The product division directs action of
Systems Program Offices (SPOs). The SPO Director, under
the single manager concept, is the individual responsible
for a total program (5).
The Air Force Logistics Command (AFLC) is the
supporting command in the acquisition of weapon systems,
and accomplishes its mission through the Air Force Acquisi-
tion Logistics Division (AFALD) (4).
8

The AFALD mission is to ensure logistical support-
ability early in the acquisition process with a commitment
to reducing maintenance problems during the system's life
cycle.I To ensure that logistics support design require-ments are in conformity with performance design require-
ments, the Commanders of AFSC and AFLC approved the assign-
ment of AFLC logistics personnel to each SPO for Integrated
Logistics Support (ILS.) responsibilities (19:3). DOD
Directive 4100.35 describes Integrated Logistics Support
as:
a composite of the elements necessary toassure the effective and economical support of systemor equipment at all levels of maintenance for its pro-grammned life cycle. It is characterized by the harmonyand coherence obtained between each of its elements
* . * (3 6 :7 .
Air Force Regulation 800-8 identifies "the elements:"
Maintainability and Reliability Interf aceMaintenance and PlanningSupport EquipmentSupply SupportPackaging, Handling, and TransportationTechnical DataFacilitiesManpower Requirements and PersonnelTraining and Training SupportLogistics Support Resource FundsLogistics Support Management InformationComputer ResourcesEnergy ManagementSurvivabilityILS Test and Evaluation (34:11]
The ILS staff is responsible for each of these elements.
9
wu
* ---

.... .
Validation and verification is a subset of the
"technical data" element. This study will focus on the
element "Technical Data" and particularly the AFALD logis-
tics responsibilities relative to the validation and veri-
fication efforts in the technical orders acquisition pro-
gram. As an initial indicator of the scope of the V&V
manning problems, the following example is cited. During
the calendar years 1977 and 1978 AFALD submitted additive
manpower packages (requests for fifty-nine spaces) through
Hq AFLC to the Air Staff in support of unprogrammed work-
load. Although the additive requirements were recognized,
only twenty-six spaces were allocated with the remaining
thirty-three spaces to be considered in future manpower
outyear programs.1 This meant the thirty-three spaces had
to be filled from current manpower resources. Overall
manning of the ILS effort, including the Technical Data
element, is significantly below that requested.
Colonel Richard F. Gillis (ASD/AFHL), former A-10
Deputy Program Manager for Logistics, stated that he had
to reprocure contractor based technical order data because
inadequate technical data were originally purchased. He
generalized his comments to state that there is a requirement
1A Point Paper (July 1978) addressing AFLC/CS
Letter "Identification of Trade-off Candidates for Man-power Increases," 19 January 1978, and the non-allocationof additive manpower authorization to support new work-loads.
10
for more qualified AFLC logisticians upon the establishment
of the SPO cadre (9).
The AFALD FY82-86 Program Objective Memorandum
(POM) Input identifies current additive manpower require-
ments for Technical Order Management during FY81 (Calendar
Year 1980), through FY83. It also identifies the impact,
if not staffed, as follows:
The use of matrix assistance, overtime, and parttime assistance from other program personnel will notprovide a viable substitute for full time dedicatedsupport. If dedicated support is not provided withinthe stated time frames, . . . the result will be adeteriorating logistics support posture (2:Sec.II,p.0-5-19].
And specifically to the point of this thesis:
Without the additional manpower spaces, programacquisition support for Technical Orders will continueto be limited to only a small percentage of programsrequiring assistance. This in turn will continue tofoster the current Air Force T.O. problems which resultin fielding T.O.s that are inadequate to support newAir Force systems and that require costly changes[2:Ch.II,p.0-5-27].
The Deputy for Product Evaluation, Engineering and
Test (PT) serves as the AFALD corporate memory for lessons
learned and operates a repository of technical data and
provides feedback to AFLC and AFSC on prior identified
design and product deficiencies (4:p.4-1). The following
are specific examples of lessons learned on specific prob-
lems associated with technical orders at the user organiza-
tion:
11

Field use of inadequately verified technical datacauses unnecessary maintenance manhours to research cor-rections needed; maintenance manhours to develop workaround procedures [1:6].
Unvalidated manuals for the operation and mainte-nance of equipment undergoing test and evaluation,can result in technicians being unable to perform thetask as directed by the manuals [1:7].
Lack of adequate technical order (T.O.) validationand verification results in inaccurate data andincreases maintenance manhours expended in trouble-shooting equipment deficiencies [1:10].
Verification of Technical Orders (T.O.s) requires:(1) scoping the size and effort, (2) identifying andprogramming for the qualified resources required tosupport the verification effort (1:181.
One conclusion from the literature review is the
inescapable consensus of experts that the field of ILS
(including Technical Data) is undermanned. Another con-
clusion is that the field is gaining more attention, in
general, and Technical Data is being looked at, in par-
ticular. General William J. Evans, former AFSC Commander,
emphasized this thought:
* . . The recent establishment of a HQ AFSC DCS/Test and Evaluation will focus not only on performancetesting, but validation of logistics supportability,compatibility of AGE, and Tech Order validation[18:98].
Statement of the Problem
The continued Department of Defense budgetary con-
straints and personnel reductions for complex weapon systems
have severely impacted both the AFSC and AFLC ability to
provide optimal manpower for validation and verification
12

of technical orders. Because of a great lack of trained
people and money to hire them, many AF areas are not opti-
mally manned. The chore of good management becomes that
of balancing the loading of people such that, even though
each area is undermanned, the ultimate product is the best
possible for that total amount of resources. The crucial
question of this thesis concerns how much good increased
manning of verification and validation efforts would do;
that is, is the marginal utility of more people, in terms
of reducing AFTO Form 22s, high or low?
Research Objective
Many Air Force development programs currently are
undermanning their technical order verification and vali-
dation effort to the point that they may not be enjoying
economic benefit for investment of effort. The marginal
utility of adding more people might be quite high.
For the purposes of this study, the number of
people assigned to the V&V effort by the ILSO component of
an AF System Program Office represents the investment of
effort. Decreasing numbers of corresponding technical
order discrepancy AFTO Form 22s represent increasing bene-
fit to weapon system maintenance. Increasing numbers of
technical order discrepancy AFTO Form 22s represent
decreasing benefit to weapon systems maintenance.
13

This study identifies the relationship that exists
between the number of people assigned to the verification
and validation effort and the number of AFTO Form 22s
generated during a subsequent time period.
Therefore, the research objectives are:
1. To identify the relationship between numbers
of people assigned to the validation and verification
effort and the numbers of AFTO Form 22s generated.
2. To evaluate this relationship in terms of
marginal benefits (decrease in AFTO Form 22s) per increase
of people assigned to verification and validation efforts.
Research Hypothesis
The number of people assigned in a program's ILS
shop to the validation and verification effort is inversely
related to the subsequent number of AFTO Form 22s (Tech-
nical Order Discrepancy Reports) generated for that pro-
gram.
1. The relationship exhibited follows a pattern
similar to an exponential curve with a marked characteris-
tic at some point of significantly smaller marginal return
(in reduced AFTO Form 22s) relative to the increased man-
ning.
2. There is a significant proportion of programs
which fall in the uneconomical area using the marginal
analysis in hypothesis 1 (i.e., either grossly too many
or too few people).
14
L I. - . . ....... ........

CHAPTER II
COLLECTION AND ANALYSIS PLAN
The Conceptual Model
Air Force technical manuals exist to aid personnel
to operate and maintain Air Force equipment. Those manuals
contain procedures of calibrating, operating, repairing,
servicing, fabricating, and troubleshooting AF equipment.
If these procedures are not reasonably accurate, the AF
equipment may not be either properly operated or maintained.
When a user senses an error, and after establishing that a
problem exists with the technical order, he generates an
AFTO Form 22 describing the deficiency.
When an adequate validation and verification is
accomplished, errors in the technical manuals are detected
and subsequently corrected prior to the delivery of the
weapon system to the user. It is the broad premise of the
conceptual model that inadequate verification and valida-
tion in the Air Force leads to increased AF generation of
AFTO Form 22s.
Validation is done by a contractor and can be done
in the absence of Air Force personnel. Opportunities exist
for the contractor to err in the press of meeting contrac-
tual deadlines. The contractor is also the seller and the
15

Air Force is the buyer. Air Force interests are not fully
protected until Air Force representation in the verifica-
tion process occurs.
Validation and verification are thus the mechanism
to ensure that technical publications provide the user with
accurate and readily understandable information, and also
that requirements are as prescribed in the statement of
work. Validation includes checking of operating and main-
tenance procedures, which in turn include checkout, calibra-
tion, alignment, and scheduled removal and replacement
instructions and checklists. These procedures are vali-
dated by actual performance or simulation. All other data
such as schematic diagrams, wiring data contained in main-
tenance manuals, and descriptive data contained in all
types of manuals are checked against current source data
(3:p.2-150).
Verification is the process by which technical
publications are checked and proven under Air Force juris-
diction (but, with other agencies if needed) to be adequate
for operation and maintenance of equipment procured for
operational units. The basic guidance for procedures and
scope of verification is contained in T.O. 00-5-1, para-
graph 3-2. The verification exercise is normally planned
and conducted to obtain maximum effectiveness in evaluating
systems, equipment, personnel, and manuals. The technical
publications presented for verification will be as complete
16
!?4
and accurate as possible to allow completion of verifica-
tion functions in accordance with the sample verification
plan (3:p.2-16).
Verification meetings are conducted to discuss
and clarify which technical orders or procedural technical
publication data elements are to be checked during demon-
stration by type, method, and policies to be employed,
location, and number and skill of personnel needed to par-
ticipate in the demonstration of technical orders verifi-
cation.
In addition, the technical order deficiencies are
identified and corrected. Agreements should be reached
on further actions to resolve any point not understood or
any disagreements that cannot be reached at the meeting.
Future meetings and verification efforts should be com-
pleted in time to permit delivery of technical orders to
the user before arrival of the weapon system.
The presence of Air Force people in the verifica-
tion phase who check the contractor and question him con-
cerning defects will tend to diminish the number of errors
remaining in the manual. This study posits that the
number of Air Force people attending a V&V is inversely
related to the number of AFTO Form 22s generated in a given
period. It is seldom practical to checkout or verify all
technical order data during demonstration. For example,
tear-down instructions for replacement of certain
17
components with low failure rates might be considered
unnecessary for demonstration verification. For those com-
ponents, desk top (hands-off) verification of the techni-
cal orders is sufficient. Also, desk top verification is
performed when demonstration verification cannot be com-
pleted in time to provide fully verified T.O.s with the
first delivered operational weapon system. Preliminary
T.O.s are then used for safety and minimal essential yeri-
fication. However, there exists the high probability of
omitting precautionary information needed for the pro-
tection of personnel and equipment, if these are taken as
final products.
The conceptual model, the numbers of Air Force
personnel attending a validation and verification versus
the number of AFTO Form 22s generated in a subsequent
period, is most correct only if AF personnel are in a posi-
tion to have "hands-on" the equipment used. That is
because only the formal "hands-on" meetings indicate an
appropriate validation and verification effort, while
desk top validations can vary in comprehensiveness to a
marked degree. Desk top verification where the equipment
is not present, is accordingly not included in this study.
In some cases, the Air Force equipment may be a
relatively simple avionics system such as an ultra high
frequency (UHF) radio set. In other cases, the equipment
may be a more complex terrain avoidance radar set. In
18

I.still other cases, the equipment may be as complex as
the entire weapon system with aircraft structure related
manuals.
The Operational Model
Typically, the first time a machine is operated,
some malfunctions surface. Remember, however, that all
are not due to faulty technical orders. Also, many tech-
nical order malfunctions may not be detected immediately
since equipment may be new to the AF user. Accordingly,
AFTO Form 22s may be sparse in the first months of use.
It is reasonable, however, to expect an Air Force activity
to question improper operation and narrow the systemic
causes down to specific technical data within six months.
The period that is studied for AFTO Form 22 accumulation is
twelve months starting after weapon delivery to the user.
The Aeronautical Systems Division (ASD) is one of
three product divisions of the AFSC. The ASD mission is
to plan, program, and manage the acquisition of aeronautical
systems, subsystems, and associated equipment. In addition
to aircraft, ASD is concerned with systems such as various
air launched missiles, drones, and other equipment ranging
from jet engines to standard aircraft escape systems.
The other product divisions are the Electronic
Systems Division (ESD), Space Division (SD), Ballistic Mis-
sile Division (BMD), and Armament Division (AD). ASD is
19

considered as representative of the Divisions and its
convenient collocation with the School of Systems and
Logistics at Wright-Patterson Air Force Base led to its
selection for this thesis.
The validation and verification is accomplished
during the full scale development phase of the ASD System
Program. The records of the number of people assigned to
the specific V&V meetings exist .in the ASD office. When
the engineering responsibility is transferred to the system
manager at the Air Logistics Center, however, the responsi-
bility for the technical data is also transferred. AFTO
Form 22 information therefore cannot come from ASD. Tech-
nical data branches at the Air Logistics Centers assume
the responsibility of receipt of any discrepancies in the
technical manual. AFTO Form 22s that are generated are
recorded and processed by these technical data branches.
The record and outcome of the AFTO Form 22s are subse-
quently stored in each ALC computer.
Data Collection
This study will initially select the data concern-
ing AFTO Form 22 numbers generated from ALC computer tapes
for selected weapon systems. Each weapon system technical
manual is categorized by technical order number. That
number, obtained from the Air Force when the manual is
first conceived, serves as an identifier for that weapon
20
- :
system's specific manual. No two manuals bear the same
number. The technical order number is also referenced when
the records of the System Program Office identify the vali-
dation and verification events. Thus the two variables,
numbers of people assigned to the V&V (of a given technical
order by number) and numbers of AFTO Form 22s generated
(of a given technical order number) will be used in this
study.
Since System Program Offices differ as to the number
of T.O.s they generate, it is necessary to standardize the
number of people assigned to V&V by counting them in rela-
tion to number of T.O.s they must verify. It is only
reasonable to assume that for any given V&V meeting, two
people assigned to do fifteen T.O.s will do a more compre-
hensive job than two people doing one hundred T.O.s. While
it is recognized that one merely needs to extend the second
meeting longer to get the same manhours per T.O., it is
rare that V&V meetings actually correspond in length to
number of T.O.s. While this situation makes the relation-
ship between V&V and AFTO Form 22s less than precise, it
is believed that some standardization is required to give
valid results and that this method of standardization
yields the essence of the relationship. It should be noted
that output is measured in terms of AFTO Form 22s per
T.O. This situation already defines a kind of standardiza-
tion among programs, hence further change is not required.
21

This process will give conformity among the SPOs and pro-
vide a more accurate measuring technique for determining
correlation between V&V efforts and AFTO Forms 22.
Thirty programs will be selected and a random
sample of technical orders, validation and verification,
and subsequent AFTO Form 22s applied to those programs$ will be studied. The sample size selected was by the
heuristic (rule of thumb) approach that a sample size
N > 30 constitutes a minimumly large sample size (12:188).J Of the thirty programs, a minimum of ten and a maximum of
one hundred samples of technical orders will be selected.
This leads to a sample size larger than three hundred and
estimated to be about eight hundred. Since it is not
uncommon to have over two hundred manuals in a larger weapon
system, and as few as twenty in a smaller one, this range
seems appropriate. The sampling rule of thumb will be to
randomly take 50 percent of each program. This large sam-
ple of data comparisons should preclude any generalized
concerns of statistical significance. Since it is possibleI for any one program director to directly influence the size
of his V&V effort, he can bias all T.O.s sampled from his
program. It is for this reason that the minimum sample
size rationale is used on programs instead of total number
of T.O.s across programs. The thirty programs will be
selected to demonstrate a range of sizes with approximately
50 percent being complete major weapon systems (such as
22

the F-15) and 50 percent being smaller systems (like the
Precision Location Strike System). A check will be made
during the analysis to see if there is any major differ-
ence in the scatter of the two types of data.
The list of attendees who attended validation
and verification meetings will be acquired from the system
program office having the responsibility of the respective
weapon system. If no attendance occurred, then that AFTOI Form 22 data will be reported and flagged. This will
give a zero abscissa for a positive (AFTO Form 22)
ordinate. The AFTO Form 22s will be obtained from the
Air Logistics Center having responsibility over the tech-
nical data for the respective weapon. Attendees at V&V
for each technical order will be plotted against cumula-
tive AFTO Form 22s for each technical order.
Data Analysis
In cases where two variables are functionally rela-I ted, but the relationship is not known, the relationship
is hypothesized by the use of a mathematical expressionI describing a suspected relationship. The technique of
regression and correlation can be used to fit collected
data points to a preselected equation form. For example,
of a sample of N runs of a process obtained from some
source data reveals a content xl,x 21..xn with corres-
ponding yields Yl'Y2 .... pn such that there exist data
23
h..

plots (xly I), (x2Y2), .. , (XnYn) then the resulting
plotting or diagram is called a scatter diagram. It is
often possible to visualize a smooth curve approximating
that data.
In Figure 1, the data visually appear to fit an
imaginary line described by the mathematical expression
y=ao+alX. For a given unit change of X there is a corres-
ponding and linear change of Y. The slope is constant.
Y
= al.Y ao +
:0oa •
I a a
X
Fig. 1. Approximating Curve
A different relationship exists between the vari-
ables in this study. It is the hypothesis that the rela-
tionship is nonlinear; for an increase in numbers of people
assigned to validation/verification efforts, there is a
decrease in the number of AFTO Form 22s generated and the
slope of the curve of the function between these two
variables is not constant.
24

In the case of the relationship of the variables
in this thesis, one can also conceptually visualize the
smooth curve approximating the data. The general problem
of finding equations of approximating curves which fit
given sets of data is called curve fittihg. The model
that is hypothesized in this study is an exponential rela-
tionship that is inverse as visually depicted in Figure 2.
xIts general equation is Y = ab
Y
(XI ,Y,)
* D
x 3 ,Y3 ) *- - c
Fig. 2. Best Fit Curve
This version of the approximating curve (c) is: Y = ab- X,
indicating a negative slope. Associated with each set of
data points (X, Y) in Figure 2 is a distance to the curve
(C) from Y that can be called D such that for Y1 Y2 '''',
Yn there exist DI, D 2,..., Dn . This difference is sometimes
called a deviation, error, or residual and may be positive,
negative, or zero. A measure of the goodness of fit of
the curve (C) to the set of data is provided by the
25

2 2 2quantity D +D +... + D If this quantity is small,1 2n
then the deviation or error approaches zero and it can be
said that where Q = D 2 +... is a minimum, then
the approximating curve is the best fitting curve. Spe-
cifically, when Y = a+aoX, Q = 0ao+a1Xl-Y) +
(a o.+aX-y 1 X Entry of the data
points into the computer that transforms the exponential
relationship, Y = ab -X, to a linear relationship, Y =
a I +a 0 X, allows the computer to establish the best fit
through solutions of the following simultaneous equations
called the normal equations for the least squares line:
ZY a N+a EX01
ZYX = aX+a :X2
The constants a and a0 can be found from the formulas
thus derived:
a (Y) (EX2 ) - (ZX) (EXY)a°0= NZX 2 -(X)2
NEXY - (ZX) ( Y)l NX - (ZX)2
Thus the computations shown explain the computer approach
to the fit of a line through the use of data points of a
straight line. The remaining transformation from an expon-
ential function to a straight line is shown:
26
L mi~]i- i/II ..1,, 1, • ._

1. Y =abx
2. Log Y = log a+(logb)X
3. Log Y = ao+a1 X
Such that Log Y vs X shows the linear relationship a o+a X.
Thus, after transforming the exponential function to a
linear function, the computation for a curve fit through
the normal equations for the least squares line is accom-
plished within the computer.
The technique of fitting a set of data points to a
chosen curve according to the least squares criterion for
best fit is called regression analysis. The use of the
preceding methods are parametric and the assumptions in
this study are:
1. The data are at least an interval scale (in
fact, the data are ratio).
2. The variables are from a normally distributed
population.
Under these assumptions the correlation measure used is the
Pearson product moment coefficient r. It is a characteris-
tic of r that r2 is an estimate of the explained deviation
of individual data items Y from the mean of Y. In other
words, r2 = the explained variation " the total variation.
The higher the ratio of explained deviation to total devi-
ation, the higher the degree of correlation that exists
between the variables.
27
V' *~-*4

The F-test signifies the degree of confidence one
has concerning the R figure derived between the dependent
variable and independent variable(s). In this research,
F-tests will be run on a probability of .1 to insure that
the R confidently models the data.
The R figure and F-test are both instrumental in
showing how well a curve fits the data. Assuming a good
fit, the curve becomes the informational model on which
the next step is based. It is now necessary to determine
the point where the scope changes most rapidly. This can
be accomplished by finding the point between the limits
where slope (b) equals 0 (X axis) and b equals infinity
(where the constant equals infinity) on the Y axis.
Mathematically this can be shown to be the point where b
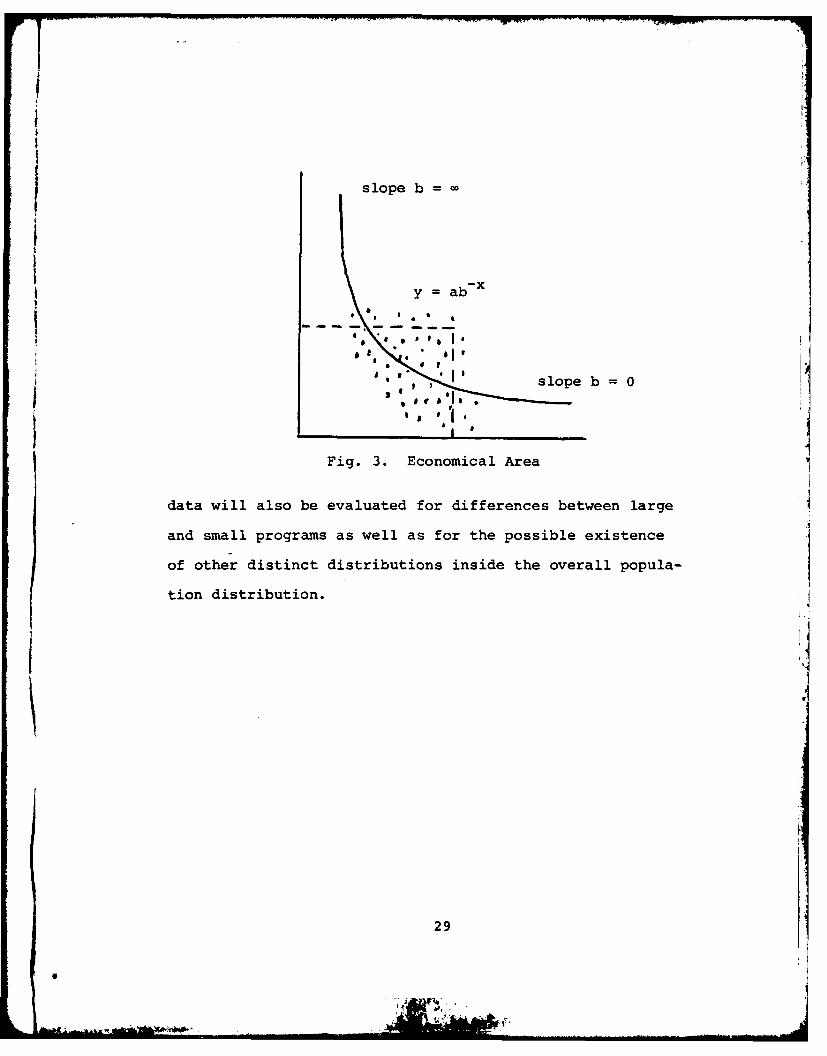
equals -1. The actual economical range used will be a
rectangle defined by 20 percent of the highest number of
people doing V&V in the Y axis and 20 percent of the highest
measured number of AFTO Form 22s in the X axis. The rec-
tangle will be on the Point of Origin where Y axis inter-
sects X axis. See Figure 3. Comment will be made in the
analysis as to the sensitivity of defining the economical
rectangle sides of 20 percent of their maximum respective
values as opposed to slightly higher values.
Finally, the sample data will be again superimposed
over the curve. Each data point will be noted as to its
relative position in or out of the economical range. The
28
. - '¢t .,, ,, ; .L -' ,ll * ' --- "--: , .- ' 4 -I. . . . . . .. .. . .. .. . . . -- . .. . '
iI n
slope b =
y ab-x
" slope b =0
I a * %
Fig. 3. Economical Area
data will also be evaluated for differences between large
and small programs as well as for the possible existence
of other distinct distributions inside the overall popula-
tion distribution.
29

CHAPTER III
DATA DEVELOPMENT
General
The collection and arrangement of research data
necessitated the design of collection forms, a subdivision
of the data into small and large weapon systems programs,
and the determination of the computer approach that develops
the data for analysis. Each of these requirements was met
and is discussed in the following sections.
Collection Form
Design
A collection form entitled "T.O. Data Collection
Checklist" was designed for identification and control of
each technical order number relating to a specific weapon
system (see Figure 4). The form design permitted the T.O.
data to be identified at both system and subsystem inden-
ture.
The form also identified the research data as to
the number of Air Force personnel that participated in the
T.O. verification and the number of AFTO Form 22s (T.O.
discrepancies) that were generated. The form design linked
together three pieces of research data, T.O.s, number of
30
I I I . . ... I .. . .. . . ... . . . .

WM SYS: PRO TO ONLDAr. DATE:
OFC SYMBOL:
PG NO OFPHOWE: SIZE PBOPLE TO W/TO 22s
12122122!31132141i425152111212112231324142515211122122313241425152
Fig. 4. T.O. Data Collection Checklist
31
_________ 3 _________ ___ ____
people at verification, and number of AFTO Form 22s gener-
ated.
The form also permitted an adjustment to standardize
the number of people assigned to T.O. verification relative
to the number of T.O.s they must verify.
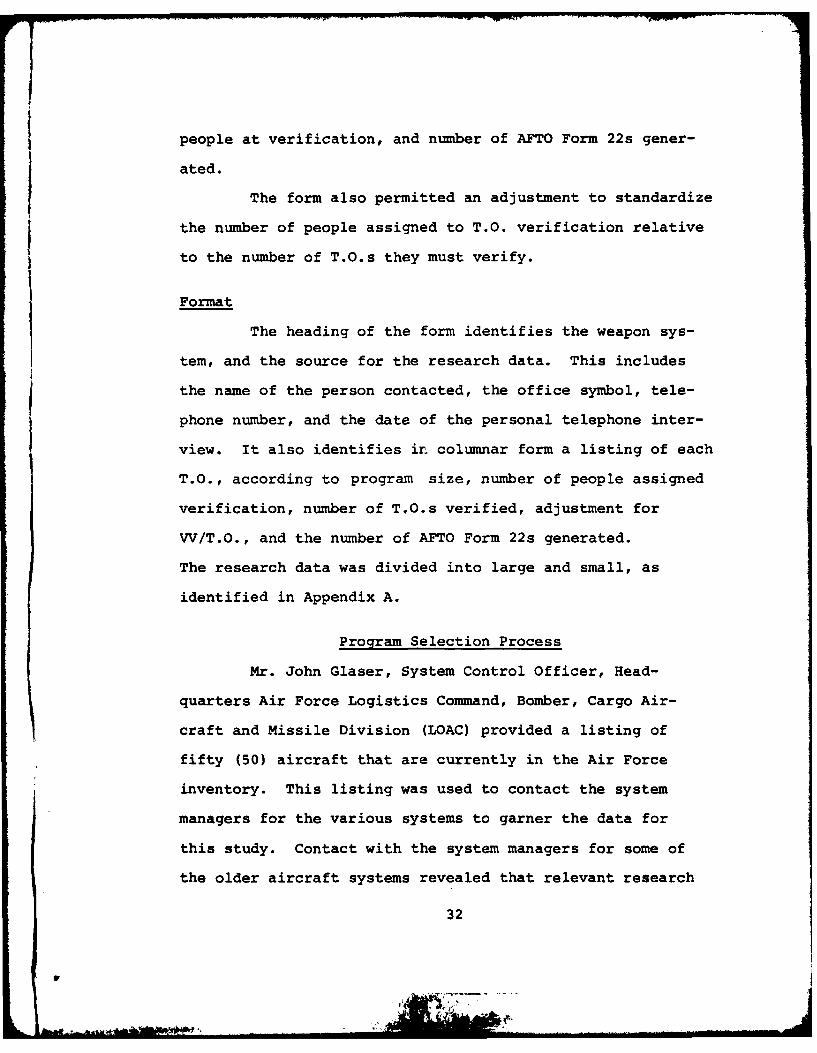
Format
The heading of the form identifies the weapon sys-
tem, and the source for the research data. This includes
the name of the person contacted, the office symbol, tele-
phone number, and the date of the personal telephone inter-
view. It also identifies in columnar form a listing of each
T.O., according to program size, number of people assigned
verification, number of T.O.s verified, adjustment for
VV/T.O., and the number of AFTO Form 22s generated.
The research data was divided into large and small, as
identified in Appendix A.
Program Selection Process
Mr. John Glaser, System Control Officer, Head-
quarters Air Force Logistics Command, Bomber, Cargo Air-
craft and Missile Division (LOAC) provided a listing of
fifty (50) aircraft that are currently in the Air Force
inventory. This listing was used to contact the system
managers for the various systems to garner the data for
this study. Contact with the system managers for some of
the older aircraft systems revealed that relevant research
32

data was not available; it had either been destroyed dur-
ing Program Management Responsibility Transfer (PMRT),
retired or lost. These programs obviously had to be
dropped.
This was also true with some of the older systems
for which ASD still had residual management responsibilities.
The newer systems, i.e., EF-111 Aircraft, Precision Locator
Strike System (PLSS), etc., had not progressed to the
Technical Order verification stage; therefore, they too
were excluded. In order to obtain a representative sample
for this study, therefore, the population was expanded to
include weapon systems from two other Air Force Systems
Command, Product Divisions, Electronic Systems Division
(ESD) and the Space Division (SD). The population sample
size included large and small programs as follows:
1. C-5 *12. UH-l (Helicopter)
2. A-10 *13. AFSATCOM (Satellite
3. F-15 Communication)
4. F-16 *14. 427M (SatelliteTracking & Warning
5. C-141 System)
6. F-5E *15. DSP (Defense Sup-
7. F-4E port Program)
8. E-4A *16. AGM65E* 17. BISS (Environment
9. MINUTEMAN III Surveillance System)i0. TRACAL (Instrument *18. PAVE PENNY (Laser
Landing System) Receiver)
*11. GATES (Solar Observ- *19. PAVE SPIKE (Lasering Optical Network) Designator & Ranger)
*20. AAD-5/ASQ 154
*Denotes small systems.
33

IIBoth the F-15 and F-16 aircraft were deleted from
the study because the data obtained was not according to
the study criteria. Study criteria required formal veri-
fication of T.O.s to be completed and in the hands of the
user for at least one year subsequent to verification of
the T.O. Technical order verification was not accomplished
prior to delivery of the aircraft to the user for these
programs. This reduced the sample size to eighteen programs,
which formed the research data base.
Approach to Computer Programs
The research data was fed into two computer pro-
grams to determine the relationship between the variables
stated in the hypothesis. One of the programs is called
CURFIT and details of that program can be found in the
CREATE shop at HQ AFLC/ACTAS. The second computer program
is more widely known and is called the Statistical Package
for the Social Sciences (SPSS).
The CURFIT computer program is designed to test
the research data against six frequently used equation
forms. The computer program yields either the index of
determination, which is another name for the coefficient of
determination, or the words "CAN'T FIT" under the heading
of the index of determination. The equation forms
matched were:
34
MM.

(1) Y=A+BX
(2) Y=Ae BX
(3) Y=A.X
(4) Y=A+ (B/IX)
(5) Y=1/A+B x
(6) Y=X/A+B X
35

CHAPTER IV
I ANALYSIS
This chapter addresses three approaches to analysis
of the research data. The first approach uses a computer
program written in BASIC computer language and will be
discussed from the standpoint of regression analysis as it
applies to six approximating curves provided by the CURFIT
I analysis. The second and third approach uses a computer
program written in CARDIN and will be discussed from the
standpoint of a scattergram as it applies to a linear approxi-
mating curve called SPSS analysis. Additionally, the third
approach includes the research technique of transforming
the research raw data in order to determine the goodness of
fit to an exponential equation similar to the equation of
the form y=ab-x discussed in Chapter II. The values of
the coefficients of determination can be exhibited in all
three approaches to determine the goodness of fit to the
equation under study.
Recalling that the equations represent a prospec-
tive information model if a high degree of correlation
exists, the research focused on the degree of correlation
exhibited by each computer result.
36
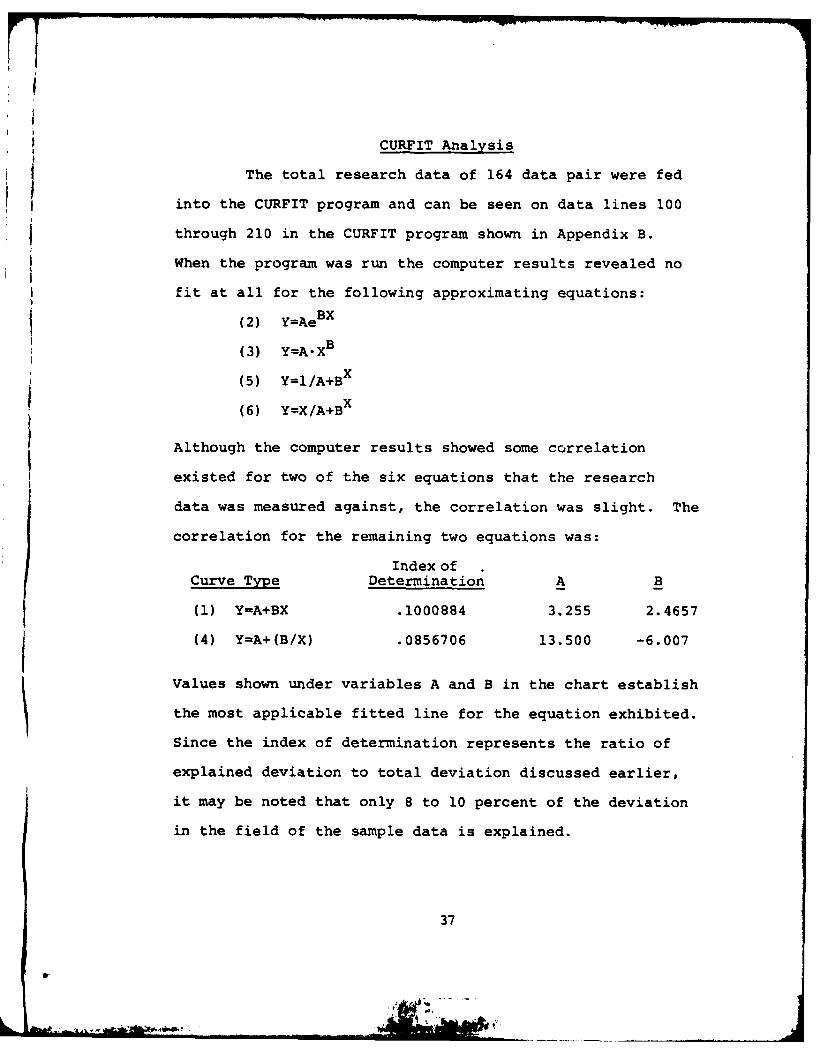
CURFIT Analysis
The total research data of 164 data pair were fed
into the CURFIT program and can be seen on data lines 100
through 210 in the CURFIT program shown in Appendix B.
When the program was run the computer results revealed no
fit at all for the following approximating equations:
(2) Y=AeBX
(3) Y=A-X
(5) Y=I/A+BX
(6) Y=X/A+Bx
Although the computer results showed some correlation
existed for two of the six equations that the research
data was measured against, the correlation was slight. The
correlation for the remaining two equations was:
Index ofCurve Type Determination A B
(1) Y=A+BX .1000884 3.255 2.4657
(4) Y=A+(B/X) .0856706 13.500 -6.007
Values shown under variables A and B in the chart establish
the most applicable fitted line for the equation exhibited.
Since the index of determination represents the ratio of
explained deviation to total deviation discussed earlier,
it may be noted that only 8 to 10 percent of the deviation
in the field of the sample data is explained.
37
tA
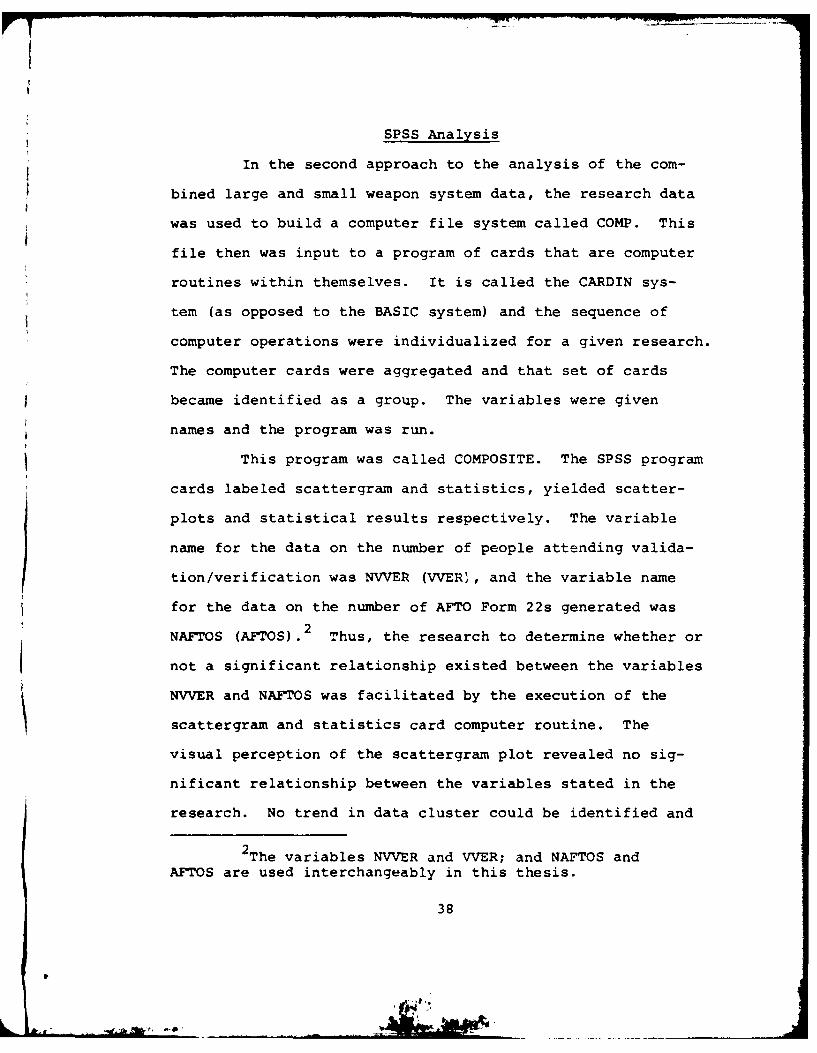
SPSS Analysis
In the second approach to the analysis of the com-
bined large and small weapon system data, the research data
was used to build a computer file system called COMP. This
file then was input to a program of cards that are computer
routines within themselves. It is called the CARDIN sys-
tem (as opposed to the BASIC system) and the sequence of
computer operations were individualized for a given research.
The computer cards were aggregated and that set of cards
became identified as a group. The variables were given
names and the program was run.
This program was called COMPOSITE. The SPSS program
cards labeled scattergram and statistics, yielded scatter-
plots and statistical results respectively. The variable
name for the data on the number of people attending valida-
tion/verification was NVVER (VVER'), and the variable name
for the data on the number of AFTO Form 22s generated was2
NAFTOS (AFTOS). Thus, the research to determine whether or
not a significant relationship existed between the variables
NVVER and NAFTOS was facilitated by the execution of the
scattergram and statistics card computer routine. The
visual perception of the scattergram plot revealed no sig-
nificant relationship between the variables stated in the
research. No trend in data cluster could be identified and
2The variables NVVER and VVER; and NAFTOS andAFTOS are used interchangeably in this thesis.
38

the low values computed in the statistic card results sup-
ported by the impression generated by scattergram observa-
tions. For example, the R2 value, coefficient of correla-
tion, was 0.0903. The composite correlation, Table 1,
illustrates the statistics card outputs.
TABLE 1
COMPOSITE CORRELATION
RUN NAME: COMPOSITE
FILE NAME: COMP
Correlation Std Err of Est Plotted Values Excluded
R 0.300 12.035 164 0
2R 0.0903
The research was continued to investigate whether
or not a single weapon system program or group of weapon
systems program data was reducing the correlation values.
A subfile structure of the data was established and subfile
identification was designed into the existing computer card
set. Large weapon systems and small weapon systems pre-
viously identified on the T.O. Data Collection Checklist
were identified using file structure methods in SPSS. The
results of this approach are summarized in the Small Systems
and Large Systems Charts (Tables 2 and 3).
39

TABLE 2
SMALL SYSTEMS
RUN NAME: SMALSUB
FILE NAME: SMASYS
Correlation
Subfile R R2 Std Err Plotted Excluded
TRAC -0.59 0.351 0.832 5 0
AADS -0.73 0.529 6 4 0
427M 0.081 (.006 4.27 24 0
TABLE 3
LARGE SYSTEMS
RUN NAME: LARGSUB
FILE NAME: LARSYS
CorrelationSubfile R R2 Std Err Plotted Excluded
C-5 -0.18 0.032 10.13 22 0
A-10 0.54 0.295 8.39 15 0
C-141 -0.50 0.253 5.35 10 0
F-5 +0.09 0.009 8.00 7 0
MN3 -0.23 0.054 20.78 9 0
40

The small and large subfiles not shown were run by
the computer but there was not enough relation between the
variables of those subfiles for the computer to exhibit a
coefficient of correlation. It should be noted that the
coefficient of determination, R2 , ranged from 0.006 to 0.53.
In cases where the coefficient was 0.35 or more, the number
of plotted values was 5 or below. Conclusions concerning
these points will be discussed in the next chapter.
SPS3 Analysis with Transformed Data
In the previous programs, the exponential equation
was Y=AeBX. The equation Y=abX was not addressed Tby those
programs. In order to evaluate a goodness of fit of equa-
tions in the family of Y=ABX in a linear regression pro-
gram, it is required that the common logarithm of Y be taken
and the regression analysis of the log Y vs X be accomplished
to ascertain whether correlation to the information model
Y=abx will test for Y=ab -X
The following relationships were established with
SPSS compute cards:
Variable Name Variable
(1) NVVER X
(2) NAFTOS Y
(3) PNVVER (X+l) NVVER+l
(4) PNAFTOS (Y+l) NAFTOS+l
(5) MNVVER (-1) (X+l)
41
a!

(6) PLVVER log (X+l)
(7) PLAFTOS log (Y+l)
On (3) through (7) the number 1 is included since the raw
data (X, Y) or (NVVER, NAFTOS) contained zeros and com-
puting the logarithm of zero is mathematically meaningless.
The final SPSS program (see Figure 5) reveals the
development of the variable MNVVER or minus X. For ease
of interpretation the following definitions for the code
names apply:
NVVER. The code name that is the X variable of raw
data. The number of people to attend validation/verifica-
tion.
NAFTOS. The code name that is the Y variable of
raw data. The number of AFTO Form 22s generated.
PNVVER. The code name that describes the X vari-
able data manipulated by the addition of one in order to
effect the logarithm of the number.
PNAFTOS. The code name that describes the Y vari-
able data manipulated by the addition of one in order to
effect the logarithm of the number.
PLVVER. The code name that describes the logarithm
of the X variable data manipulated by the addition of the
number 1.
PLAFTOS. The code name that describes the logarithm
of the Y variable data manipulated by the addition of the
number 1.
42
*

V
PRINT LOGCOP2
05/16/80 19.06
$ IDENT UP1186,AFIT-LSG, WILL WINN CL80 SEC 2I SELECT SPSS/SPSSRUN NAME COMPOSITE WITH Y=AB*:*-XLIST ERRORSFILE NAME LOG COP2VARIABLE LIST NVVER,NAFIOSINPUT MEDIUM CARDN OF CASES 164INPUT FORMAT FREEFIELDCOMPUTE PNVVER=NVVER+ICOMPUTE PNAFTOS=NAFTOS+lCOMPUTE PLVVER=LGIO(PNVYER)COMPUTE PLAFTOS=LG10(PNAFTOS)COMPUTE MNVVER=(-1);0PNVVERVAR LABELS NVVER,NO OF PEOPLE TO VALVER/NAFTOS,NO OF AFTOSVAR LABELS PLVVER,LOG OF NO OF PEOPLE TO VALVER/PLAFTOS.LOG OF NO AFTOSLIST CASES CASES=164/VARIABLES=MNVVER,PLAFTOS,NVVER,NAFTOSCONDESCRIPTIVE PLVVER,PLAFTOSREAD INPUT DATAs SELECTA 80AO11/COHP,RSCATTERGRAM PLAFTOS(0,3) UITH MMVVER (LOWEST,HIGHEST)OPTIONS 6,7STATISTICS ALLREGRESSION VARIABLES=PLAFTOS,MNVVER/REGRESF' I=PLAFTOS UITH MNVVER/FINISH$ END JOB
Fig. 5. Computer Run for Exponential Equation
43

It can be seen that the transformed variable, PLAFTOS and
MNVVER are required as inputs log Y and -X to effect the
transformation from:
Y=ab- x (the exponential equation)
to
log Y=log a+ (-X) (logb).
Thus, the exponential equation is transformed into a linear
equation and the techniques of regression analysis apply.
The computer run with the aforementioned variables
showed little correlation between the 164 data pair (-X,
log Y). The values are shown in Table 4.
TABLE 4
EXPONENTIAL EQUATION RESULTS
RUN NAME: COMPOSITE WITH Y=AB**-X
FILE NAME: LOG COP 2
Correlation
R R2 Std Err Plotted Values Excluded
-0.197 0.039 0.5035 164 0
The same technique (see Figure 6) used to develop
the transformed variables for Y=ab-x was used to input the
log Y vs log X to determine if a relationship existed for
the geometric curve:
Y=aXb (the geometric equation)
44
~t." ilia

PRIIQNT LOGCOP
05/16/80 19.04
I IDENT UP1186,AFIT-LSG, WILL UINN CL8O SEC 2$ SELECT SPSS/SPSSRUN NAME COMPOSITEFILE NAME LOG COPVARIABLE LIST NVVERNAFTOSINPUT MEDIUM CARDN OF CASES 164INPUT FORMAT FREEFIELDCOMPUTE PNVVER=MVVER+lCOMPUTE PNAFTOS=NAFTOS+lCOMPUTE PLVVER=LG1O(PNVVER)COMPUTE PLAFTGS=LG)(P4AFTDS)VAR LABELS NVVERNO OF PEOPLE TO VALVER/NAFTOS,NO OF AFTOSVJAR LABELS PLVVER,LOG OF NO OF PEOPLE TO VALVERJPLAFTOS.ELOG OF NO AFTOSLIST CASES CASES=164/VARIABLES=PLVVER,PLAFTOSCONDESCRIPTIVE PLVVER,PLAFTOSREAD INPUT DATA$ SELECTA 80A011/COMP,RSCATTERGRAN PLAFTOS(0,2.1) WJITH PLVVER(0,2)OPTIONS 6,7ISTATISTICS ALLREGRESSION VARIABt ES=PLAFTOS,PLVVER/REGRESSION:PLAFTOS WITH PLVVER/FINISH
$ END JOB
Fig. 6. Computer Run for Geometric Equation
45

The results of this run are shown in Table 5. In both
cases, exponential and geometric, no significant relation-
ship could be determined by either examination of the
scatterplots for the A-10, C-5, 427M systems and the
composite program or their correlation coefficients.
TABLE 5
GEOMETRIC EQUATION RESULTS
RUN NAME: COMPOSITE
FILE NAME: LOG COP 2
Correlation
R R2 Std Err Plotted Values ExcludL
0.249 0.0624 0.4973 164 0
46

CHAPTER V
FINDINGS, CONCLUSIONS AND RECOMMENDATIONS
Assumptions and Findings
The assumptions that were made prior to the research
were that if people were sent to the validation/verification
and conducted the actual checkout of the technical manual
in question, itwould have an effect to minimize the even-
tual generation of technical order discrepancy forms called
AFTO Form 22s. It was also an assumption that if smaller
or greater numbers of people were sent to the validation/
verification for the purpose of the actual technical manual
checkout, then some measurable change in the amount of dis-
crepancy Form 22s would occur. The research failed to
support a relationship between the research variables.
The findings exhibited coefficients of determina-
tion well below 35 percent as a general rule and in the
one case where the coefficient was at slightly above 50
percent, the number of cases was extremely small. Examina-
tion of the values for the error sum of squares (SSE),
regression sum of squares (SSR) and the total sum of
squares (SSTO), supported the view that little or no rela-
tionship existed between the variables for a given equa-
tion. A typical example is found in the regression analysis
47

.Ivr y
portion of the computer run that tested the research data
for fit to the equation Y-ab X (see Table 6).
TABLE 6
REGRESSION ANALYSIS RESULTS
Source of Variation Sum of Squares Mean Square
Regression 1.66736 1.66736
Residual (Error) 41.07247 0.25353
Recalling the total variation (SSTO) is found by
adding SSE and SSR then 1.66736 plus 41.07247 equals
42.73983. It can be seen that the contribution of the
explained variation, 1.66736, to the total variation
242,73983, is small. That rate is seen as the value R
In general, it can be stated that the closer the explained
deviation equals the total deviation, the closer the value
of Rapproaches one. In this case, a value of R that
equals 0.039 indicates only 3 hundredths of the total devi-
ation can be explained.
Hence the conclusion of this research is that
little correlation of the research variables exists for
the model Y=ab- or any of the models tested. There was
no indication to suspect broader coverage of weapon sys-
tems would yield better correlation, but since records were
destroyed or lost as in the case of the older weapon sys-
tems such as the F-l00, research is limited.
48
Although time and resources are expended in the
sending of verification teams to validation and verifica-
tion sites, the researchers could find no previous study
establishing an empirical base. This is not to say that
verification should not be done, but since scarce resources
are involved, it seems reasonable that further study con-
cerning the cost-benefits realized are required when veri-
fication involves more than one person.
Conclusions
Since no significant correlation could be estab-lished between the research variables, it must be concluded
that some other major factors determine the number of AFTO
22s a program ultimately sees. Within the range of people
assigned to validation and verification on the studied
systems, the conclusion must be that manning was not a
factor. This is an interesting conclusion in that it is
counter-intuitive and certainly not an argument for
increased validation and verification manning as some
would wish.
Recommendations
In view of the research conclusions, an expansion
of or continuation of this study is not recommended. How-
ever, further study should look at other external environ-
mental factors to determine if potential correlations
49

exist relative to technical data verification. In line with
this study, it is recommended that close scrutiny be paid
I to the data collection and analysis to verify if indeed
the study is valid. We think it is. If this is true,
program offices should be advised that, within limits of the
data range of validation and verification manning seen in
this study, AFTO 22s are not sensitive to undermanning in
prior validation and verification.
50
L&-MO

APPENDICES
51

APPENDIX A
T.O. DATA COLLECTION CHECKLIST
52

WEAPON SYSTEM: C-5
(SOURCE: 28)
CONTROL TECHNICAL NO. PEOPLE NO. OF AFTO
NUMBER ORDER Wv T.O.s VV/T.O. 22s
00101 12P5-4-40-2 3 2 1.52 15
00102 12P5-4-49-4 3 2 1.52 21
00103 12P5-4-50-4 3 1 3 9
00104 12P5-45- 3 1 3 6
00105 12P5-4-55-3 3 1 .75 21
00106 12P5-4-56-2 3 1 3 0
00107 12P5-4-63-3 3 2 1.52 6
00108 12P5-4-63-4 3 2 1.52 9
00109 12P5-4-66-3 2 3 .66 0
00110 12P5-4-64-4 2 3 .66 0
00111 12P5-4-66-4 2 3 .66 0
00112 12P5-4-67-3 3 1 3 0
00113 12P5-4-67-8-2 3 1 3 15
00114 12P5-4-67-8-3 3 1 3 15
00115 12P5-4-67-8-4 3 1 3 6
00116 12P5-4-67-23 3 4 .75 36
00117 12P5-4-67-33 3 4 .75 21
00118 12P5-4-67-33-1 3 4 .75 0
00119 12P5-4-67-33-2 3 4 .75 0
00120 12P5-4-67-43 3 3 1 24
00121 12P5-4-67-63 3 3 1 12
00122 12P5-4-67-83 3 3 1 18
53

WEAPON SYSTEM: A-10
(SOURCE: 26)
CONTROL TECHNICAL NO. PEOPLE NO. OF AFTO
NUMBER ORDER vv T.O.s VV/T.O. 22s
00201 1A-1OA-33-1-1 9 4 2.27 1
00202 1A-1OA-33-1-2 9 4 2.27 22
00203 35C1-4-79-1 2 3 .66 0
00204 35Cl-4-80-1 2 3 .66 0
00205 4SA2-53-3 2 3 .66 0
00206 5A11-7-11-3 2 1 2 0
00207 4S1-99-3 2 1 2 12
00208 4S1-100-3 2 1 2 11
00209 4S10100-3 2 1 2 1
00210 5A13-5-17-3 2 1 2 1
00211 43E24-6-4-1-1 7 3 .704 10
00212 43E24-6-4-1-2 7 3 .704 4
00213 43E24-6-4-1-3 7 3 .704 24
00214 13A5-46-3 7 1 7.1 28
00215 13A5-46-4 2 1 2 7
WEAPON SYSTEM: C-141
(SOURCE: 19)
00501 5N5-16-2-2 9 1 9 0
00502 5N6-9-5-2 8 3 2.66 0
00503 12P5-4-44-2 8 3 2.66 0
00504 12P5-4-44-3 8 3 2.66 2
54

• ~~~~~~ ~ ~ .... =7.. ... . ...... !.I 1 I k
CONTROL TECHNICAL NO. PEOPLE NO. OF AFTO
NUMBER ORDER VV T.O.s VV/T.O. 22s
00505 5N5-7-3-8-1 6 6 1 12
00506 5N5-17-2-8-1 6 6 1 13
00507 5A7-5-2-8-1 6 6 1 4
00508 5A43-2-3 6 6 1 15
00509 33DA9-30-1 6 6 1 5
00510 33DA11-79-1 6 6 1 2
WEAPON SYSTEM: F-5E
(SOURCE: 7)
00601 33DA116-6-1 5 3 1.66 2
00602 33DA116-7-1 5 3 1.66 1
00603 11F23-4-2-2 5 3 1.66 20
00604 12R2-2ARC164-3-1 3 1 3 0
00605 llFl-APQ159-2 4 5 .8 1
00606 llFl-APQ159-12 4 5 .8 0
00607 llFl-APQ159-22 4 5 .8 0
WEAPON SYSTEM: F-4
(SOURCE: 13)
00701 1F4E-2-19 10 11 .91 42
00702 IF4C-6 10 11 .91 13
00703 1F4C-6WC-4 10 11 .91 1
00704 IF4C-6WC-7 10 11 .91 1
00705 1F4C-6WC-3 10 11 .91 4
00706 1F4G-2-19-1 10 11 .91 2
00707 1F4G-2-33 10 11 .91 1
55
.5 . "

CONTROL TECHNICAL NO. PEOPLE NO. OF AFTONUMBER ORDER VV T.O.s VV/T.O. 22s
00708 IF4E-2-11 10 11 .91 1
00709 1F4E-2-12 10 11 .91 6
00710 1F4E-2-13 10 11 .91 3
00711 1F4E-2-33 10 11 .91 1
WEAPON SYSTEM: E-4A
(SOURCE: 23)
00801 1E-4A-2-27 7 10 .70 3
00802 1E-4A-2-25 7 10 .70 0
00803 1E-4A-2-21 7 10 .70 1
00804 1E-4A-2-35 7 10 .70 0
00805 1E-4A-2-32 7 10 .70 2
00806 1E-4A-2-28 7 10 .70 5
00807 1E-4A-2-53 7 10 .70 0
00808 1E-4A-2-29 7 10 .70 14
00809 1E-4A-2-30 7 10 .70 0
00810 1E-4A-2-51 7 10 .70 0
WEAPON SYSTEM: MINUTEMAN III
(SOURCE: 9)
00901 21M-LGM30G-1-13 4 1 4 67
00902 21M-LGM30G-2-7-2 4 1 4 42
00903 21M-LGM30G-2-10-1 4 1 4 43
00904 21M-LGM30G-2-11-1 4 1 4 37
00905 21M-LGM30G-2-12-3 5 1 5 25
00906 21M-LGM30G-2-16-2 5 1 5 20
56

CONTROL TECHNICAL NO. PEOPLE NO. OF AFTONUMBER ORDER VV T.O.s VV/T.O. 22s
00907 21M-LGM3OG-2-28-1 5 1 5 26
00908 31R3-4-25-2 4 1 4 8
00909 3158-26SW5-2-1 4 1 4 1
00910 11N-RS12A-2-1 4 1 4 24
SMALL SYSTEMS
WEAPON SYSTEM: TRACAL
(SOURCE: 2 2)
01001 31R4-2G-192 12 3 4 3
01002 31R4-2GRN3O-2 12 3 4 1
01003 31R4-2GRN31-2 12 3 4 2
01004 31R4-2G-182 7 1 7 1
01005 31R4-2GRN31-26WC-1 6 1 6 1
WEAPON SYSTEM: GATES
(SOURCE: 17)
01101 31M1-2FMQ7-1 5 6 .83 2
01102 31M1-2FMQ7-1 5 6 .83 1
01103 31M1-2FMQ-6WC-1 5 6 .83 1
01104 31M3-4-5-1 5 6 .83 2
01105 3lM3-4-5-1--6WC-1 5 6 .83 1
01106 31M3-4-6-6WC-1 5 6 .83 1
WEAPON SYSTEM: UH-1
(SOURCE: 35)
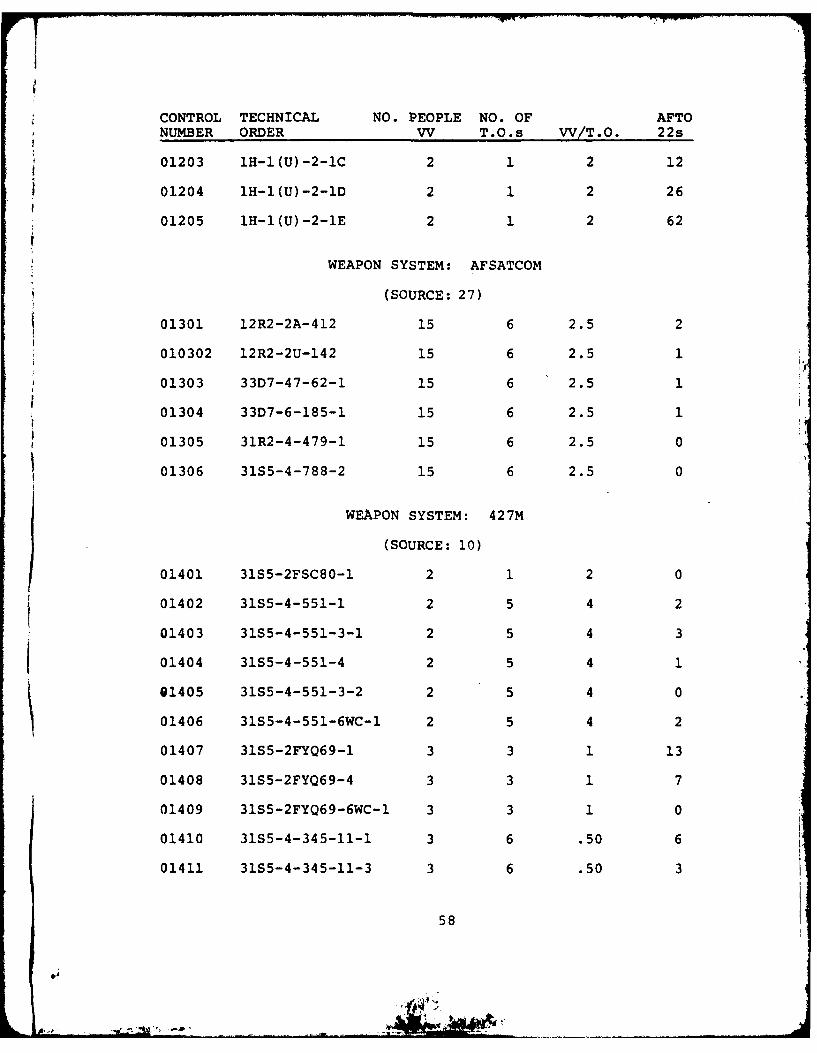
01201 1H-1(U)-2-1A 2 1 2 4
01202 1H-1(U)-2-1B 2 1 2 13
57
CONTROL TECHNICAL NO. PEOPLE NO. OF AFTONUMBER ORDER vv T.O.s VV/T.O. 22s
01203 1H-1(U)-2-lC 2 1 2 12
01204 1H-1(U)-2-1D 2 1 2 26
01205 1H-1(U)-2-1E 2 1 2 62
WEAPON SYSTEM: AFSATCOM
(SOURCE: 2 7)
01301 12R2-2A-412 15 6 2.5 2
010302 12R2-2U-142 15 6 2.5 1
01303 33D7-47-62-1 15 6 2.5 1
01304 33D7-6-185-1 15 6 2.5 1
01305 31R2-4-479-1 15 6 2.5 0
*01306 31S5-4-788-2 15 6 2.5 0
WEAPON SYSTEM: 427M
(SOURCE: 10)
01401 3155-2FSC80-1 2 1 2 0
01402 31S5-4-551-1 2 5 4 2
01403 31S5-4-551-3-1 2 5 4 3
01404 31S5-4-551-4 2 5 4 1
01405 3155-4-551-3-2 2 5 4 0
01406 3155-4-551-6WC-1 2 5 4 2
01407 3155-2FYQ69-1 3 3 1 13
01408 3155-2FYQ69-4 3 3 1 7
01409 3155-2FYQ69-6WC-1 3 3 1 0
01410 31S5-4-345-11-1 3 6 .50 6
01411 3155-4-345-11-3 3 6 .50 3
58
CONTROL TECHNICAL NO. PEOPLE NO. OF AFTONUMBER ORDER VV T.O.s VV/T.O. 22s
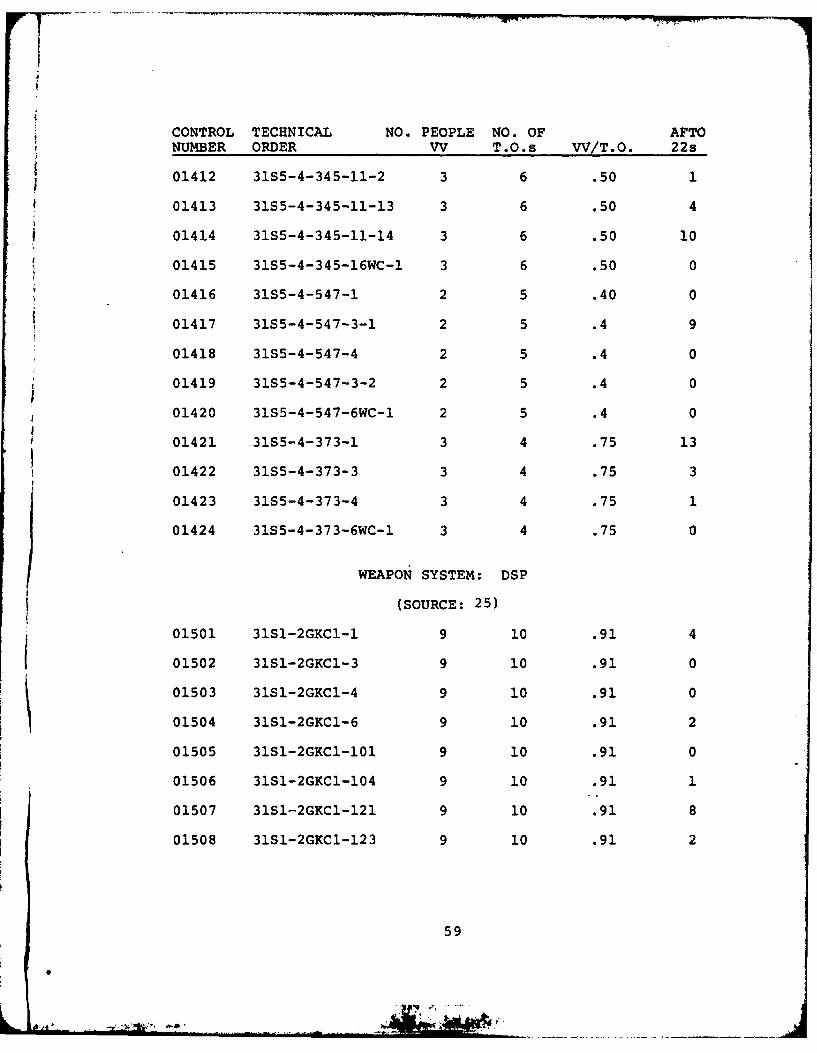
01412 31S5-4-345-11-2 3 6 .50 101413 31S5-4-345-II-13 3 6 .50 4
01414 31S5-4-345-11-14 3 6 .50 0
01415 31S5-4-345-16WC- 3 6 .50 0
01416 31S5-4-547-1 2 5 .40 0
01417 31S5-4-547-3-1 2 5 .4 9
01418 31S5-4-547-4 2 5 .4 0
01419 31S5-4-547-3-2 2 5 .4 0
01420 31S5-4-547-6WC-I 2 5 .4 0
01421 31S5-4-373-1 3 4 .75 13
01422 31S5-4-373-3 3 4 .75 3
01423 31S5-4-373-4 3 4 .75 1
01424 31S5-4-373-6WC-1 3 4 .75 0
WEAPON SYSTEM: DSP
(SOURCE: 25)
01501 31S1-2GKC1-1 9 10 .91 4
01502 31S1-2GKC1-3 9 10 .91 0
01503 31S1-2GKC1-4 9 10 .91 0
01504 31S1-2GKC1-6 9 10 .91 2
01505 31S1-2GKC1-101 9 10 .91 0
01506 31S1-2GKC1-104 9 10 .91 1
01507 31S1--2GKC1-121 9 10 .91 8
01508 31S1-2GKC1-123 9 10 .91 2
59
CONTROL TECHNICAL NO. PEOPLE NO. OF AFTO
NUMBER ORDER VV T.O.s VV/T.O. 22s
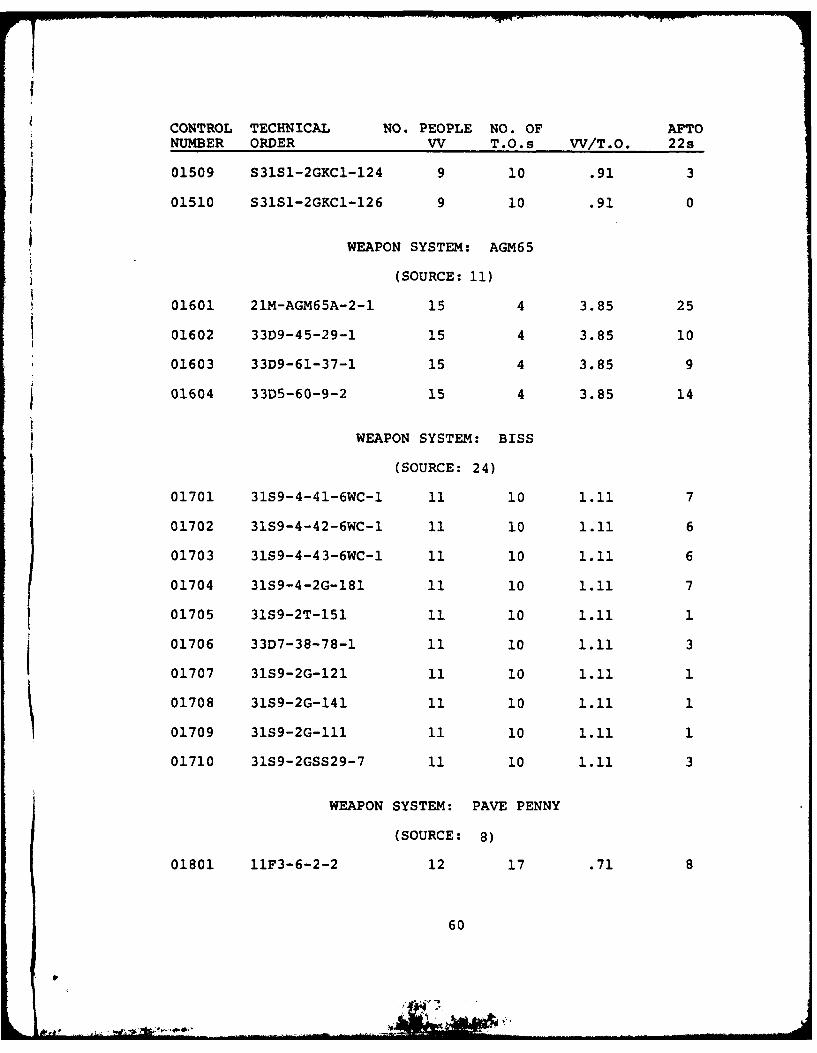
01509 S31SI-2GKC1-124 9 10 .91 3
01510 $31SI-2GKCI-126 9 10 .91 0
WEAPON SYSTEM: AGM65
(SOURCE: 11)
01601 21M-AGM65A-2-1 15 4 3.85 25
01602 33D9-45-29-1 15 4 3.85 10
01603 33D9-61-37-1 15 4 3.85 9
01604 33D5-60-9-2 15 4 3.85 14
WEAPON SYSTEM: BISS
(SOURCE: 24)
01701 31S9-4-41-6WC-1 11 10 1.11 7
01702 31S9-4-42-6WC-1 11 10 1.11 6
01703 31S9-4-43-6WC-1 11 10 1.11 6
01704 31S9-4-2G-181 11 10 1.11 7
01705 31S9-2T-151 11 10 1.11 1
01706 33D7-38-78-1 11 10 1.11 3
01707 31S9-2G-121 11 10 1.11 1
01708 31S9-2G-141 11 10 1.11 1
01709 31S9-2G-111 11 10 1.11 1
01710 31S9-2GSS29-7 11 10 1.11 3
WEAPON SYSTEM: PAVE PENNY
(SOURCE: 8)
01801 11F3-6-2-2 12 17 .71 8
60
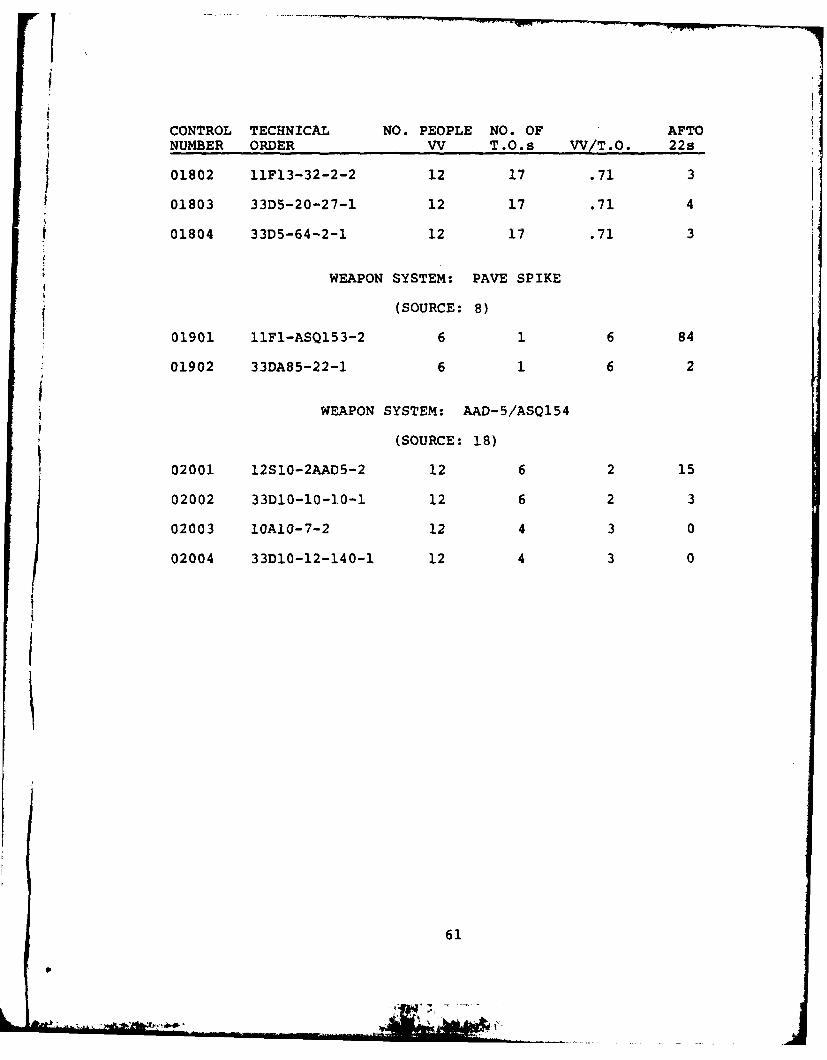
CONTROL TECHNICAL NO. PEOPLE NO. OF AFTONUMBER ORDER Wv T.O.s VV/T.O. 22s
01802 11F13-32-2-2 12 17 .71 3
01803 33D5-20-27-1 12 17 .71 4
01804 33D5-64-2-1 12 17 .71 3
WEAPON SYSTEM: PAVE SPIKE
(SOURCE: 8)
01901 11F1-ASQ153-2 6 1 6 84
01902 33DA85-22-1 6 1 6 2
WEAPON SYSTEM: AAD-5/AS0154
(SOURCE: 18)
02001 12S10-2AAD5-2 12 6 2 15
02002 33D10-10-10-1 12 6 2 3
02003 10A10-7-2 12 4 3 0
02004 33D10-12-140-1 12 4 3 0
61
0V

I APPENDIX BRESEARCH RAW DATA
62
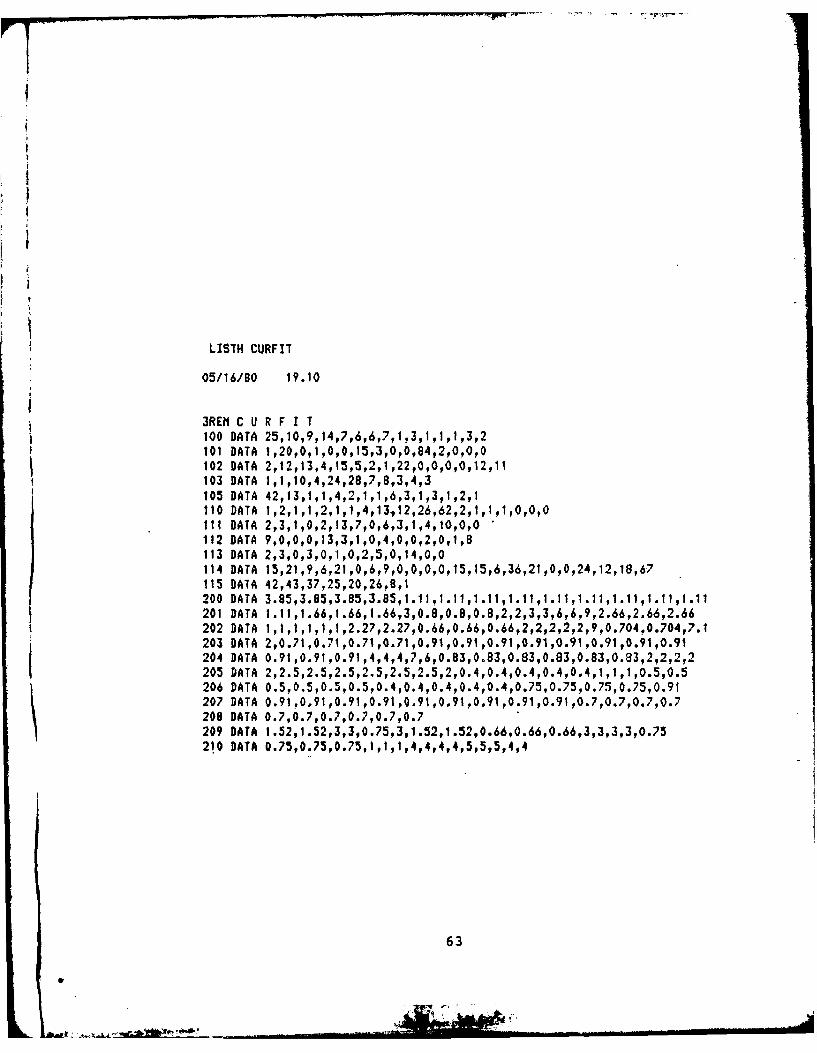
LISTH CURFIT
05/16/80 19.10
3REM C U R F I T100 DATA 25,10,9,14,7,6,6,7,1,3,1,1,1,3,2101 DATA 1,20,0,1,0,0,15,3,0,0,84,2,0,0,0102 DATA 2,12,13,4,15,5,2,1,22,0,0,0,0,12,11103 DATA 1,1,10,4,24,28,7,8,3,4,3105 DATA 42,13,1,1,4,2,1,1,6,3,1,3,1,2,1110 DATA 1,2,1,1,2,1,1,4,13,12,26,62,2,1,1,1,0,0,0Ill DATA 2,3,1,0,2,13,7,0,6,3,1,4,10,0,0112 DATA 9,0,0,0,13,3,1,0,4,0,0,2,0,1,8113 DATA 2,3,0,3,0,1,0,2,5,0,14,0,0114 DATA 15,21,?,6,21,0,6,9,0,0,0,0,15,15,6,36,21,0,0,24,12,18,67115 DATA 42,43,37,25,20,26,8,1200 DATA 3.85,3.85,3.85,3.85,1.11,1..1,1.11,1.11,1.11,1.11,1.11,1.11,1.11201 DATA 1.11,1.66,1.66,1.66,3,0.8,0.8,0.8,2,2,3,3,6,6.9,2.66,2.66,2.66202 DATA 1,1,1,1,1,1,2.27,2.27,0.66,0.66,0.66,2,2,2,2t2,9,0.704.0.704,7.1203 DATA 2,0.71,0.71,0.71,0.71,0.91,0.91,0.91,0.91,0.91,0.91,0.91,0.91204 DATA 0.91,0.91,0.91,4,4,4,7,6,0.83,0.83,0.83,0.83,0.83,0.83,2,2,2,2205 DATA 2,2.5,2.5,2.5,2.5,2.5,2.5,2,0.4,0.4,0.4,0.4,0.4,1,1,1,0.5,0.5206 DATA 0.5,0.5,0.5,0.5,0.4,0.4,0.4,0.4,0.4,0.75,0.75,0.75,0.75,0.91207 DATA 0.91,0.91,0.91,0.91,0.91,0.91,0.91,0.91,0.91,0.7,0.7,0.7,0.7208 DATA 0.7,0.7,0.7,0.7,0.7,0.7209 DATA 1.52,1.52,3,3,0.75,3,1.52,1.52,0.66,0.66,0.66,3,3,3,3,0.75210 DATA 0.75,0.75,0.75,1,1,1,4,4,4,4,5,5,5,4,4
63
4' -

APPENDIX C
INDIVIDUAL SYSTEMS, A-10, C-5, 427M
64
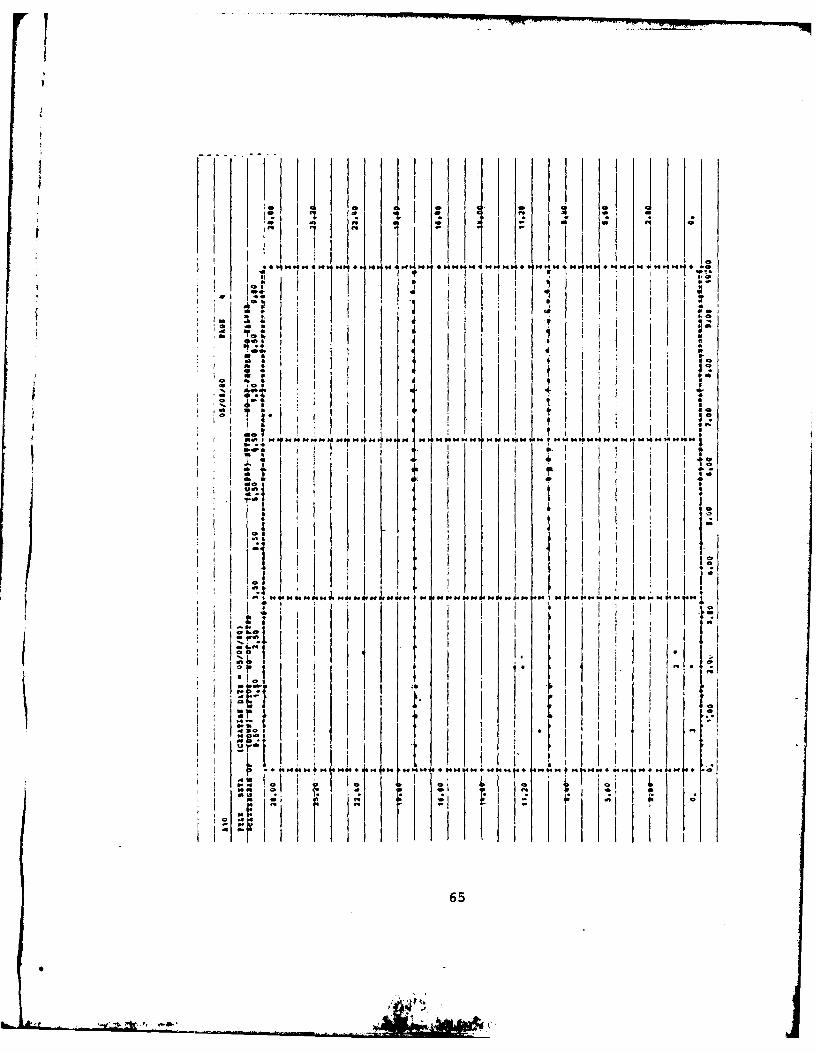
I
I II I
0 --I 9,
1442.41i1 1 - '1ii ' i Il~. I , :1~4r'4
94494*14~t14].~1~14.4N~4.@ I- S I
I"-., ~ Ii
3S ii
~ I94414141441414414,141149111414941414149414944714 I,~ 1 7T~7
1 .
Ii.I I
*9 1499H*149 H14NMIbUH*~ *9
ii I II F
I I
I 0 t1I~Ii ti4
I I i
I I I i-~ I
Oil I*
10 .4~ I I
I I I 1 1
65
S
5-
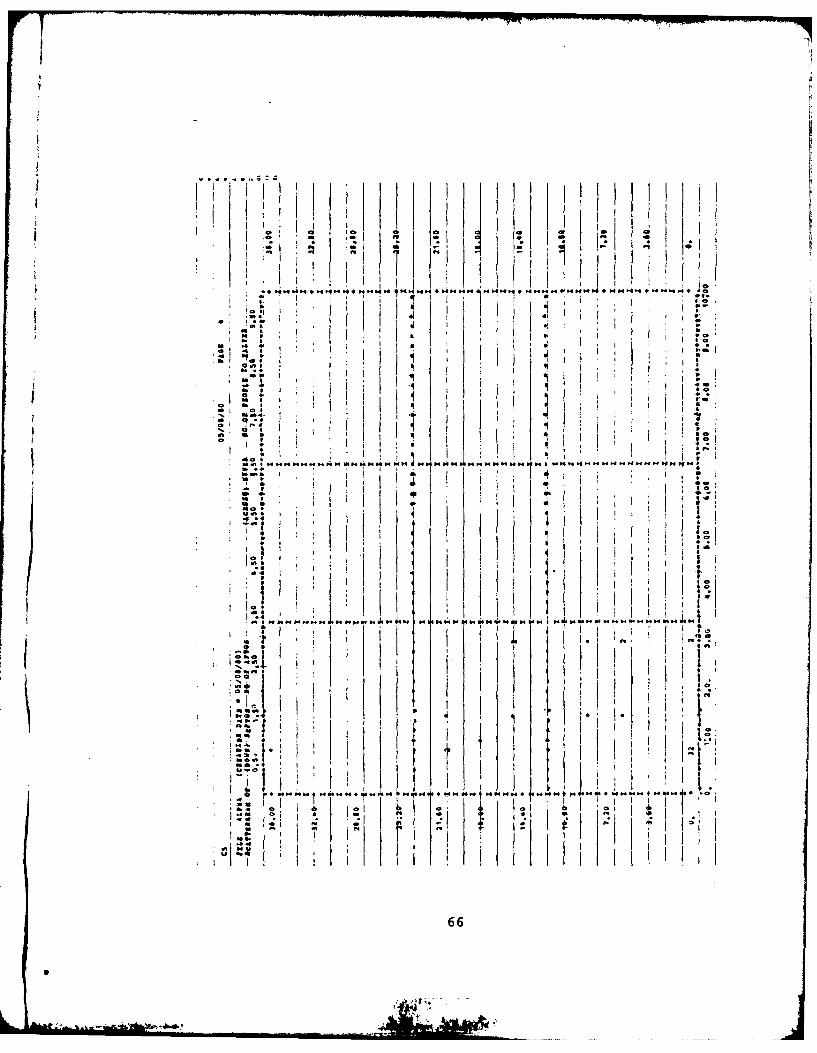
!II
414
a I
. W.
f 1'4-
..... . ..' ." I' '1
Ia
' I
III I
I Io,'66
I
I
• ,IOI N ~ lII I 4.1 1... .
e 44 . ".
.,* ' i
w,- l. ..
Z -. ; ,I.I I 41
, 41*• ° "
+...
-- . I• .1
,.,, : . , ; ,,,
- U..6 I ,
, .I I "* I ., . ,,
,,,3 I " I . . ,4*4, , .,, We
*i . . .4. I 1.
il*- . i i -'
- .
,1 11 o S I ,. i 4
.* " i.1 IIll . I i* i . - * I
t a ' S * I I,,
I ' 4.*I '
APPENDIX D
COMPOSITE SYSTEMS (LARGE AND SMALL)
!I
68
J ,&•
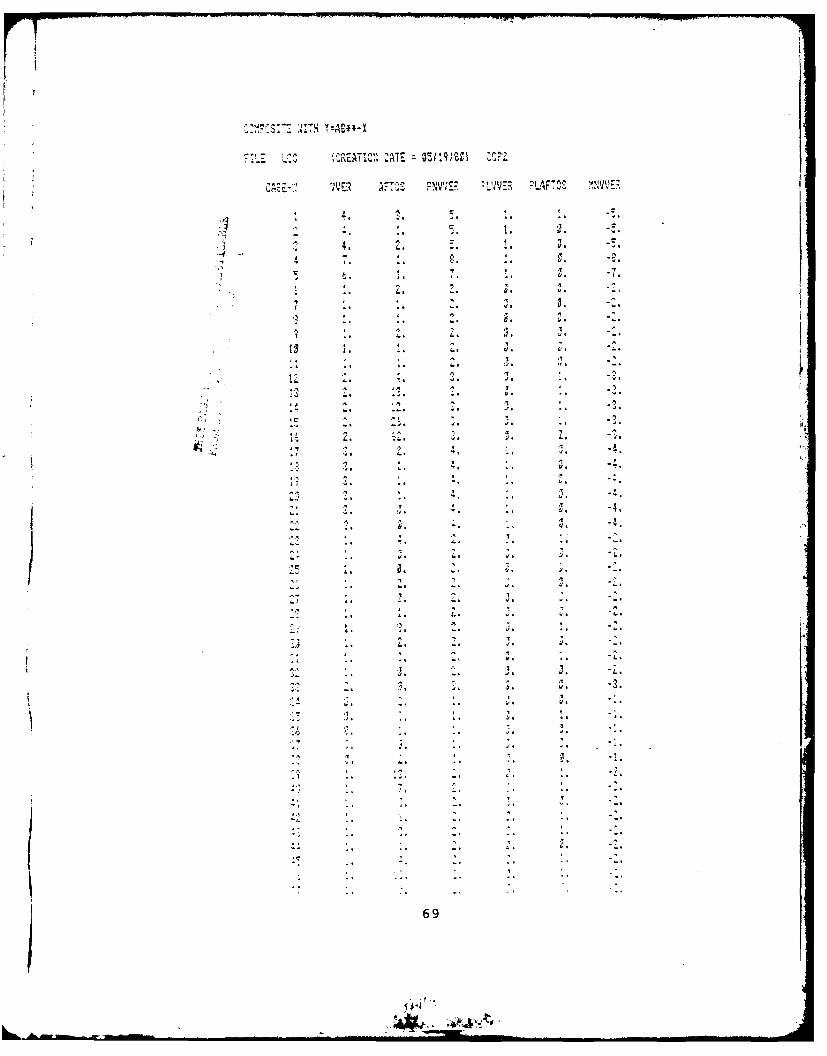
k '
Th?!:3:-: :UTM T:AEI#-X
- . AS' ~ WIE ;g~~ 222a.: 4-..".. 44,. -
n-.. ~ . P70'S PNVVS? :LYvE; 'AFTOS ~WVE
4. 3. 5.4 4 '1 -
- 4 .4 54 14 ~. -.
I A a. S44 -.
'-44 - 4 C 4'
~1 A 4. 44 -.4 .4 U4
.4 ,. -. U.'4
3 2 2. 2.* .4. '.4
13 4 4 .4
4. 5. '4 t44.
.4 £4 ~4 :44 444 -.5: -,
44 A -~ 3 4 A
* . '4 -- 4 -. -I. .4 44
4C A
6' **' -. -44 4. 44 .4 .~. 14~'4 4" 4- 1 4 -7
44 .4 4 4* 4.4 44
.7 .,
a ,.
.' ~. 4.. . ,
-, 4 a 4 '.4 4
-. 44 4. -, 144
4.7 44 .4 , -.4
4 .4 444
- 4 * . .4. a
-.4 44 .4 4 .. 24
-, -4 * 4 '7
44 4,. 7. .4 #4 ~4.'1 4
44 -. 42.
4. .. , -. 1 -.4
4.., 4 -- .-' A -. -
- .4 ~4 4. ~4 U. ~4.
-~ £* V4 '.~ 4,. i. -.
4 '7 4 -'4-- 44 '4 -. 4,4 4. -4
4 '4 -,
'4 -4 -. 444 -4
4 4 '4 4' '4 '4
-- .4 -. 4,4 "4 444
C1. 44 A 4 .4'44 -4 44 44 -4
4 4' -,
-:41 .4 4. -4 44 44 -4
4 -' A 4 .4
.4 44 -4 #4 44 444
'1 -1
'p. -. ~. a.A .4 '4 -.4 '4 .44
2. 42. u. t).
4.4 -4 .4 4,4 .4
I 4 '4 4 -
.44 4, '4 Z44
..
* .
. -1
44 .4 -4 44 .4
.4 44 44 44 £4
As' -'4
4 4
'p
.4 54 44 -.4 '4 .4 44
24 :. 2.4 4 '4 .~. , 4 A
4 - 4 . . 4 4 4' 4
44 A A .4 4
4 4 - 4 4 4 4, 4 - 4
4 4 444 .4 4 .4
4- 4
'4 A
'4
4 - 4 - 4 4 4 4 4 - 4
44 . . 'A
-- .4 ~. 4. 1.
4 . - 4 4 4 . 4 - 4
4 4 - .4 4 4 4 4 4 4' 4
4 4 4 - ' ' -j 69
~ 4iSktd

' . . .'n r. ,%. . .I .' - .
-. 4 4 ,14
. ... t . C d, " t.
,1",. .. .' - . - -
.-" 4,. . 0, . . , -4*. -
z.', : -.
-4'* ' , 4- -,
.., ,4. ',... -. .
4$ 4. 4 ,. '- ,' , -
-4.4 . "4 -', . -.," -
-,4 .. , . ,,. ,-
-. 5 . 4 . " , ' 4 ,
4. . , C . 4. - .
7 . :.:. ,.,-,.
4 .' 4 4 , .',4,4- .
-4. .4 4 , 4, , 4, " - .
4., . . .. .. -2.
,- . : ,4 -., --
I< •
; 4.. ,J t. I. - .
- .-04(-
4/4 -, <"
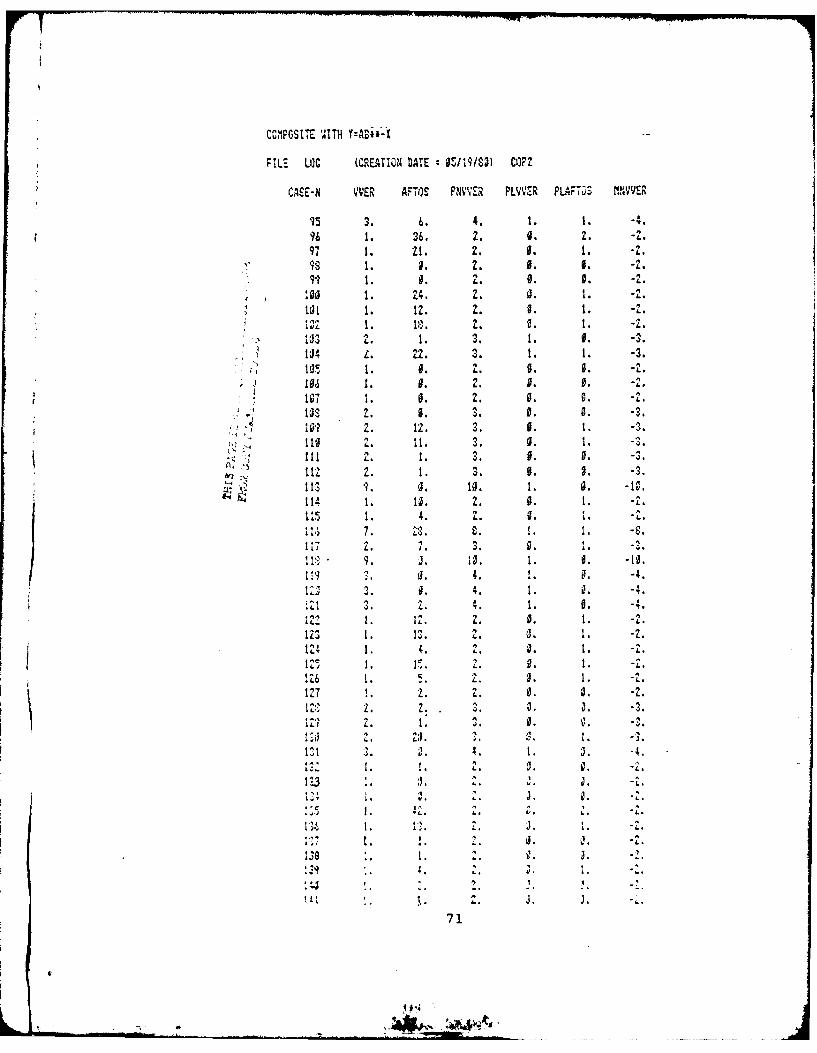
CUhPGSITE 0ITH Y:A31,-I
FILE LOG (CREATION DATE ;05191,85) COP2
CASE-N VVER AFT S PNVVER PLVVER PLAFT. . YER
6I 3. 6. 4. 1. 1. -4.96 1. 36. 2. 0. 2. -.
97 1, 21. 2. 0. 1. -Z.Is 1. 0. Z. 0. 5. -2.91 0. 0. -2.
99. 1..l0t . z Z. 9. . -.
101 1. 12. 2. 0. 1. -2.
13 S z: .f I,.Z
Z.. -2.3..
1' I3 S . 1 . 1. 0. -3.
1140. .. -2..
IIs. -2.10 7 2. 0. 2.. -.
105 2., . 3. 0. 0. -3.
... . 2 12. 30. 1. -4., 110 Z.. t1. 3. 0. 1, -3.
3 4-*0. 0.
., 112 2. 1. 3. 0. 0. -3.113 '?. 0I. 10l. 1. 0. - 10.
114 1. 10. 2. 0. 1. -2.
125 . 4. 0. 1. -2.
11c . 7. 3. 0. . -11, 9. J. 10. 1. 0. -10.
1 37 . Z. 4. 1. 0. -4.
1. 0. -4.
0.-2
123 1. 13. 2. 0, 1. -2.
124 1, 4. 2. 0. 1) -2.
12 1 . •.0 12127 1. 23. 2. 0, J. -Z
S124 I. 2. C. 0. 3.-.
71
IZ',) W, z. -'. O
- I *.:r4!. DATE 25/:;132;.2"2.
.A .44,.'. 4 - .
awe.: -' a.. . .
..... : , 2 z. -2.
:: ..... 2. .'. . - -.
. ' , 2. -' I, t
-.,,.. ,-
.. '2 .. 4. 'a. 6 . 2.' -".
..- 4 .. -5
.. , -. J L. -
'ci 4,.7.
4 . 2. 2

WMI
a I I' ~- r-
. i 1i .
, I o,
-
rr
i IiD
43P
0I
I I, ,,,, 9
. -- . .., Ii II
-1
04
73

SELECTED BIBLIOGRAPHY
74

A. REFERENCES CITED
1. Air Force Acquisition Logistics Division. AFALD Les-sons Learned Bulletin. AFALD/PTQ, Wright-PattersonAFB OH, February 1979.
2. . AFALD Manpower Submission for FY 82-86 POMInput. AFALD/MO, Wright-Patterson AFB OH, 26 Octo-ber 1979.
3. Air Force Institute of Technology. A Compendium ofAuthorized Logistics Terms and Definitions. Tech-nical Report No. 5, Wright-Patterson AFB OH, June1970.
4. Air Force Logistics Command. Air Force AcquisitionLogistics Division. AFLC Regulation 23-17. Wright-Patterson AFB OH, 1977.
5. Air Force Systems Command. Aeronautical Systems Divi-sion. AFSCR 23-3. Washington: Government PrintingOffice, 1978.
6. . Technical Publications Acquisition Manual.AFSCM 310-2. Washington: Government PrintingOffice, 1971.
7. Ashworth, Earl E. F-5F Technical Order Manager, ASD/SD30C, Wright-Patterson AFB OH. Personal inter-view, 27 March 1980.
8. Barksdale, Senior Master Sergeant Richard, USAF. PAVE
PENNY/PAVE SPIKE Technical Order Manager, ASD/RWRK,Wright-Patterson AFB OH. Personal interview.4 April 1980.
9. Barnard, Harry, Walter Karol and Master Sergeant LesterSerling. Detachment 41 OO-ALC/MT, Minute Man IIIIntegrated Logistics Support Branch, Vandenburg AFBCA. Telephone interview. 25 April 1980.
10. Carlburg, Major Richard E., USAF, and Senior MasterSergeant Larmie Hubbard, 427M Technical OrderBranch, 47th Communication Group/TOVT, Peterson AFBCO. Telephone interview. 8 April 1980.
75
I II

11. Deardoff, Harvey. Lead Equipment Engineer, Pomas B.Fasules, Development Equipment Engineer, AGM65 Sup-port Equipment Branch, ASD/SD65E. Wright-PattersonAFB OH. Personal interview. 27 March 1980.
12. Dolwatch, Theodore B. Information Please Almanac Atlasand Yearbook. 32nd ed. New York: InformationPlease Publishing, Inc., 1978.
13. Florence, Stan. F-4 Equipment Specialist, O0-ALC/MMSRA, Hill AFB UT. Telephone interview. 15 April1980.
14. Flores, Daniel. Aircraft Maintenance Branch (SA-ALC/MAB), Kenny AFB TX. Telephone interview.10 October 1979.
15. Gillis, Colonel Richard F., USAF. CX Deputy ProgramManager for Logistics (ASD/AFHL), Wright-PattersonAFB OH. Personal interview. 16 October 1979.
16. Glaser, John. System Control Officer, Bomber CargoAircraft and Missile Division, AFLC/LOAC, Wright-Patterson AFB OH. Personal interview. 21 March1980.
17. Kipers, Bill. Logistics Specialist, GATES TechnicalOrder Branch, ESD/OCIU, Hanscom AFB MA. Telephoneinterview. 11 April 1980.
18. McCutcheon, Technical Sergeant Mike. AAD-5 TechnicalOrder Manager, ASD/RWRC, Wright-Patterson AFB OH.Personal interview. 4 April 1980.
19. Pearl, George. C-141 Equipment Specialist, WR-ALC/MMIR,Robins AFB GA. Telephone interview. 16 April 1980.
20. Powers, Clarke W., and Thomas J. Recktenwalt. "AirForce Acquisition Logistics Division: Its Creationand Role." Unpublished master's thesis. LSSR 32-78B, AFIT/SL, Wright-Patterson AFB OH, March 1978.ADA061357.
21. Price, Robert B., and Gene W. Deal. "An Analysis ofthe Role of the DPML as Viewed by Various Partici-pants in the System Acquisition Process." Unpub-lished master's thesis. SLSR 6-73A, AFIT/SL,Wright-Patterson AFB OH, March 1973. AD760083.
76
22. Pucillo, Carmine. Logistics Specialist, TRACAL Tech-nical Order Branch, ESD/OCNL, Hanscom AFB MA.Telephone interview. 15 April 1980.
23. Punneo, James. Equipment Specialist, E-4A TechnicalOrder Branch, OC-ALC/MMARTB, Tinker AFB OK. Tele-phone interview. 11 April 1980.
24. Rendon, John. Logistics Specialist, BISS TechnicalOrder Branch, ESD/OCBU, Hanscom QFB MA. Telephoneinterview. 11 April 1980.
25. Ringer, Jack. Equipment Specialist, DSP TechnicalOrder Branch, SM-ALC/MMCRABA, McClellan AFB CA.Telephone interview. 11 April 1980.
26. Rinker, Lieutenant Colonel Bruce, USAF. Chief, A-10Integrated Logistics Support Branch, ASD/YXL,Wright-Patterson AFB OH. Personal interview.16 April 1980.
27. Romino, Major Len, USAF. Chief AFSATCOM IntegratedLogistics Support Branch, ESD. Hanscom AFB MA.Telephone interview. 15 April 1980.
28. Smith, Herman. Equiopment Specialist, C-5 TechnicalOrder Branch, OC-ALC/MMIRE, Kelly AFB TX. Tele-phone interview. 11 April 1980.
29. Spiegel, Murray R. Theory and Problems of Statistics.New York: McGraw-Hill, 1961.
30. U.S. Department of the Air Force. Air Force TechnicalOrder System. AFR 8-2. Washington: GovernmentPrinting Office, 1979.
31. . Air Force Technical Order System. T.O.00-5-1. Oklahoma City: OC-ALC, 1978.
32. .Integrated Loistics Support (ILS) Program.AFR 800-8. Washington: Government Printing Office,1980.
33. U.S. Department of Defense. Integrated Logistics Sup-port Planning Guide. DOD Directive 4100.35.Washington: Government Printing Office, 1970.
34. Walton, Thomas F. Technical Data Requirements forSystems Engineering and Support. Englewood CliffsNJ: Prentice-Hall, Inc., 1965.
77
' : .. .. .. ... / / ' I - -T. .. ...

35. Wiggins, Tom. Equipment Specialist, UH-l TechnicalOrder Branch, WR-ALC/MMSCRA, Robins AFB GA. Tele-phone interview. 15 April 1980.
B. RELATED SOURCES
Baldwin, William G. AFALD/MO, Wright-Patterson AFB OH.Personal interview. December 1979.
Champion, Tom. AFALD/PTQP, Wright-Patterson AFB OH. Per-sonal interview. 18 January 1980.
Emory, William C. Business Research Methods. Homewood IL:Richard D. Irwin, Inc., 1976.
Riva, Major Dennis, USAF. F-16/YPAT, Wright-Patterson AFBOH. Personal interview. 27 December 1979.
Siegel, Sidney. Nonparametric Statistics for the BehavioralSciences. New York: McGraw-Hill, 1956.
Tittle, Fremont. KC-10/YPL, Wright-Patterson AFB OH.Personal interview. 15 January 1980.
78
oar' i ..

I i