unclassified env/jm/mono(2016)33/rev1 - oecd
TRANSCRIPT

Unclassified ENV/JM/MONO(2016)33/REV1 Organisation de Coopération et de Développement Économiques Organisation for Economic Co-operation and Development 22-Aug-2017
___________________________________________________________________________________________
_____________ English - Or. English ENVIRONMENT DIRECTORATE
JOINT MEETING OF THE CHEMICALS COMMITTEE AND
THE WORKING PARTY ON CHEMICALS, PESTICIDES AND BIOTECHNOLOGY
Overview of the set of OECD Genetic Toxicology Test Guidelines and updates performed in 2014-2015
Series on Testing & Assessment
No. 238 - 2nd edition
JT03418020
Complete document available on OLIS in its original format
This document, as well as any data and map included herein, are without prejudice to the status of or sovereignty over any territory, to the
delimitation of international frontiers and boundaries and to the name of any territory, city or area.
EN
V/JM
/MO
NO
(20
16
)33
/RE
V1
Un
classified
En
glish
- Or. E
ng
lish

ENV/JM/MONO(2016)33/REV1
2

ENV/JM/MONO(2016)33/REV1
3
OECD Environment, Health and Safety Publications
Series on Testing and Assessment
No. 238
Overview of the set of OECD Genetic Toxicology Test Guidelines and updates performed in 2014-
2015
Environment Directorate
ORGANISATION FOR ECONOMIC CO-OPERATION AND DEVELOPMENT
Paris 2017
About the OECD

ENV/JM/MONO(2016)33/REV1
4
The Organisation for Economic Co-operation and Development (OECD) is an intergovernmental
organisation in which representatives of 35 industrialised countries in North and South America, Europe
and the Asia and Pacific region, as well as the European Commission, meet to co-ordinate and harmonise
policies, discuss issues of mutual concern, and work together to respond to international problems. Most of
the OECD’s work is carried out by more than 200 specialised committees and working groups composed
of member country delegates. Observers from several countries with special status at the OECD, and from
interested international organisations, attend many of the OECD’s workshops and other meetings.
Committees and working groups are served by the OECD Secretariat, located in Paris, France, which is
organised into directorates and divisions.
The Environment, Health and Safety Division publishes free-of-charge documents in twelve different
series: Testing and Assessment; Good Laboratory Practice and Compliance Monitoring; Pesticides;
Biocides; Risk Management; Harmonisation of Regulatory Oversight in Biotechnology; Safety of
Novel Foods and Feeds; Chemical Accidents; Pollutant Release and Transfer Registers; Emission
Scenario Documents; Safety of Manufactured Nanomaterials; and Adverse Outcome Pathways. More
information about the Environment, Health and Safety Programme and EHS publications is available on
the OECD’s World Wide Web site (www.oecd.org/chemicalsafety/).
This publication was developed in the IOMC context. The contents do not necessarily reflect the
views or stated policies of individual IOMC Participating Organizations.
The Inter-Organisation Programme for the Sound Management of Chemicals (IOMC) was established in
1995 following recommendations made by the 1992 UN Conference on Environment and Development
to strengthen co-operation and increase international co-ordination in the field of chemical safety. The
Participating Organisations are FAO, ILO, UNDP, UNEP, UNIDO, UNITAR, WHO, World Bank and
OECD. The purpose of the IOMC is to promote co-ordination of the policies and activities pursued by
the Participating Organisations, jointly or separately, to achieve the sound management of chemicals in
relation to human health and the environment.

ENV/JM/MONO(2016)33/REV1
5
This publication is available electronically, at no charge.
For this and many other Environment,
Health and Safety publications, consult the OECD’s
World Wide Web site (www.oecd.org/ehs)
or contact:
OECD Environment Directorate,
Environment, Health and Safety Division
2, rue André-Pascal
75775 Paris cedex 16
France
Fax : (33-1) 44 30 61 80
E-mail : [email protected]
© OECD 2017
Applications for permission to reproduce or translate all or part of this material should
be made to: Head of Publications Service, [email protected], OECD, 2 rue André-
Pascal, 75775 Paris Cedex 16, France

ENV/JM/MONO(2016)33/REV1
6
FOREWORD
This document presents an Overview of the set of OECD Genetic Toxicology Test Guidelines
(TGs) and updates performed in 2014-2015. The projects for the global update of the Genetic Toxicology
TGs and the development of an accompanying document were included in the work plan of the Test
Guidelines Programme in 2011. The projects were led by a group of four countries, France, Canada, the
US and the Netherlands. The present document gives an account of the update of the set of genetic
toxicology TGs which was completed in 2015 and provides at the same time a succinct overview of the
TGs for genetic toxicology.
The present document was circulated twice to the Working Group of the National Coordinators
of the Test Guidelines Programme (WNT) for review and commenting, in September and December 2015.
The resulting comments were addressed and the document subsequently approved by the WNT at its 28th
meeting in April 2016. The Joint Meeting of the Chemicals Committee and the Working Party on
Chemicals, Pesticides and Biotechnology agreed to declassification of this document on 8 July 2016.
Following an initial publication in July 2016, the document was updated in 2017 with the
inclusion of an annex presenting a document developed during the update of the set of Test Guidelines on
genotoxicity and supporting the WNT decision to implement revised criteria for the selection of the top
concentration in the in vitro mammalian cell assays on genotoxicity (Test Guidelines 473, 476 and 487).
The revision was approved by the WNT by written procedure in March 2017 and the Joint Meeting of the
Chemicals Committee and the Working Party on Chemicals, Pesticides and Biotechnology agreed to
declassification of the updated document on 5 May 2017.
This document is published under the responsibility of the Joint Meeting of the Chemicals
Committee and the Working Party on Chemicals, Pesticides and Biotechnology.

ENV/JM/MONO(2016)33/REV1
7
OVERVIEW OF THE SET OF OECD GENETIC TOXICOLOGY TEST GUIDELINES AND
UPDATES PERFORMED IN 2014-2015
TABLE OF CONTENTS
Overview of the set of OECD Genetic Toxicology Test Guidelines and updates performed in 2014-20153
FOREWORD ................................................................................................................................................... 6
OVERVIEW OF THE SET OF OECD GENETIC TOXICOLOGY TEST GUIDELINES AND UPDATES
PERFORMED IN 2014-2015 .......................................................................................................................... 7
1 GENERAL INTRODUCTION (PREAMBLE) ....................................................................................... 9
1.1 General Background ......................................................................................................................... 9 1.2 History and Status of TGs ............................................................................................................... 10
2 AIM OF GENETIC TOXICOLOGY TESTING ................................................................................... 12
2.1 Genotoxicity Endpoints ................................................................................................................... 12
3 TEST GUIDELINES FOR GENETIC TOXICOLOGY ........................................................................ 13
3.1 In vitro genetic toxicology tests ...................................................................................................... 14 3.1.1 Tests for gene mutations ............................................................................................................ 14 3.1.2 Tests for chromosomal abnormalities ........................................................................................ 16
3.2 In vivo genetic toxicology tests ....................................................................................................... 18 3.2.1 Tests for gene mutations ............................................................................................................ 18 3.2.2 Tests for chromosomal abnormalities ........................................................................................ 18 3.2.3 Tests for Primary DNA Damage ............................................................................................... 20
4 OVERVIEW OF ISSUES ADDRESSED IN THE 2014-2015 REVISION OF THE GENETIC
TOXICOLOGY TEST GUIDELINES .......................................................................................................... 22
4.1 Issues specific to in vitro TGs ......................................................................................................... 22 4.1.1 Cells ........................................................................................................................................... 22 4.1.2 Cytotoxicity and selection of highest concentration for cytotoxic chemicals ........................... 22 4.1.3 Selection of highest concentration tested for poorly soluble and/or non-cytotoxic chemicals .. 24 4.1.4 Treatment duration and sampling time ...................................................................................... 24 4.1.5 Concentration selection and minimum number of test concentrations/cultures ........................ 25 4.1.6 Metabolic Activation ................................................................................................................. 26
4.2 Issues specific to in vivo TGs .......................................................................................................... 26 4.2.1 Dose Selection ........................................................................................................................... 26 4.2.2 Proof of exposure (bioavailability) ............................................................................................ 27 4.2.3 Tissue selection, duration of treatment and sampling time ....................................................... 28 4.2.4 Combination/integration of tests ............................................................................................... 29 4.2.5 Use of one or both sexes ............................................................................................................ 30 4.2.6 Age range of animals ................................................................................................................. 31
4.3 Issues common to in vitro and in vivo TGs ..................................................................................... 31 4.3.1 Experimental design and statistical analysis considerations...................................................... 31 4.3.2 Size of samples and statistical power: in vitro tests .................................................................. 31
ENV/JM/MONO(2016)33/REV1
8
4.3.3 Size of samples and statistical power: in vivo tests ................................................................... 33 4.3.4 Demonstration of laboratory proficiency and establishing an historical control database ........ 34 4.3.5 Concurrent negative and positive controls ................................................................................ 35 4.3.6 Data interpretation and criteria for a positive/negative result.................................................... 37 4.3.7 Chemicals that require specific approaches ............................................................................... 39 4.3.8 Test batteries, weight of the evidence and interpretation of data .............................................. 39
REFERENCES .............................................................................................................................................. 40
APPENDIX A. DOCUMENT SUPPORTING THE WNT DECISION TO IMPLEMENT REVISED
CRITERIA FOR THE SELECTION OF THE TOP CONCENTRATION IN THE IN VITRO
MAMMALIAN CELL ASSAYS ON GENOTOXICITY (TEST GUIDELINES 473, 476 AND 487) -
[ENV/JM/TG/RD(2014)20] ........................................................................................................................... 52
APPENDIX B. TREATMENT AND SAMPLING TIMES FOR IN VIVO GENETIC TOXICOLOGY
TGS IN RODENTS (THE APPLICABLE TGS SHOULD BE CONSULTED FOR MORE DETAILED
INFORMATION). ......................................................................................................................................... 62
APPENDIX C. COMPILATION OF PUBLISHED NEGATIVE (VEHICLE) CONTROL DATA FOR
THE DOMINANT LETHAL TEST.............................................................................................................. 63
APPENDIX D. COMPILATION OF PUBLISHED NEGATIVE (VEHICLE) CONTROL DATA FOR
THE MOUSE SPERMATOGONIAL CHROMOSOMAL ABERRATION TEST. .................................... 65
APPENDIX E. DEFINITIONS .................................................................................................................... 66

ENV/JM/MONO(2016)33/REV1
9
1 GENERAL INTRODUCTION (PREAMBLE)
1. An Introduction Document to the OECD Genetic Toxicology Test Guidelines (TGs) was first
published in 1987 (OECD, 1987). Following a global update of the Genetic Toxicology TGs, which was
completed in 2015, the present Document was written to provide succinct and useful information to
individuals unfamiliar with genetic toxicology testing, as well as experienced individuals wishing to obtain
an overview of the recent changes that were made to the TGs during the recent round of revisions. It
provides: 1) general background and historical information on the OECD genetic toxicology TGs; 2) a
brief overview of the important types of genetic damage evaluated by these tests; 3) a description of the
retained TGs; and 4) the issues and changes addressed therein during the revision process. It should be
noted that the purpose of this Document is different from that of the previous 1987 Introduction Document,
in that it is not intended to provide an extensive overview of the field of Genetic Toxicology, or to provide
an extensive discussion of the strengths and weaknesses of the tests, or to discuss testing strategies.
1.1 General Background
2. Since the 1980s, the view on the relative importance of the various tests for which a TG exists
has changed. Simultaneously, there has been an increase in our knowledge of the mechanisms leading to
genetic toxicity, as well as an increase in our experience with the use of the tests. The interpretation of test
results has evolved, as has the identification of the critical technical/procedural steps in the different tests.
Moreover, it has become clear that tests which detect the types of genetic damage that can be transmitted in
mammalian cells should be considered to be the most relevant for evaluating chemicals for their potential
to induce mutations.
3. There have also been significant economic changes since the OECD genetic toxicology TGs were
first established (1983). The number of newly developed chemicals to be tested has increased; furthermore,
regulatory jurisdictions, such as the European Registration, Evaluation, Authorization and Restriction of
CHemical regulations (REACH; EC, 2006; ECHA, 2008a,b), require assessment of the toxicity (including
genotoxicity) of an unprecedented large number of chemicals already in commerce. Consequently, there is
an impetus for testing to become more efficient, and faster; whereas, at the same time, it is recognised that
the performance (i.e. sensitivity and specificity) of the tests should not suffer. In addition, most regulatory
authorities have increased their commitment to avoid unnecessary use of animals in toxicology testing. For
some regulatory genetic toxicology testing strategies the number of required tests has been reduced from
several to 3, or even as few as 2, in vitro tests. In line with the basic principles of humane animal
experimentation (Replacement, Reduction, and Refinement, i.e. 3Rs; Russell and Burch, 1959) it has been
recommended that in vitro tests should be followed up with as few as possible, but scientifically adequate,
in vivo tests. Regulatory authorities have established various ways to do this, including a prohibition of in
vivo tests in the European Union (EU) Regulation for cosmetic ingredients (EC, 2009), and the need to
submit a testing proposal prior to some vertebrate test specified under REACH (EC, 2006). Importantly,
significant reductions in animal use can be accomplished, by the combination of in vivo genetic toxicity
endpoints, as well as their incorporation into repeated dose toxicity tests, or by reducing the number of
animals for concurrent positive controls in in vivo genetic toxicology tests, thus reducing the total number
of animals used in evaluating a particular test chemical. The 3Rs principles were taken into consideration
in the revision of each individual in vivo test, and are thus reflected in the final recommendations in each in
vivo TG. Because regulatory authorities may implement the 3Rs in different ways, neither the individual
TGs, nor this Document, list specific regional requirements.
4. At its 22nd
meeting in March 2010, the OECD Workgroup of National Coordinators for Test
Guidelines (WNT) formed an Expert Workgroup that would review all the genetic toxicology TGs and
make decisions to delete or update the various TGs, and to develop new TGs. Subsequently, taking
advantage of experience with the tests, the TG revisions were made, which reflect increased knowledge
ENV/JM/MONO(2016)33/REV1
10
concerning the features of the various tests and the technical conduct of the tests. In addition, the revision
process provided an opportunity to harmonise, as appropriate, the recommendations across all of the
genetic toxicology TGs under revision. This harmonisation led to a common approach concerning the
features and conduct of the various tests.
1.2 History and Status of TGs
5. The history and current status of the different TGs is summarised in Table 1. Since the last round
of TG revisions in 1997, new TGs have been adopted: TG 487 (in vitro mammalian cell micronucleus test)
in 2010; TG 488 (transgenic rodent somatic and germ cell gene mutation assays) in 2011; TG 489 (in vivo
mammalian alkaline comet assay) in 2014; and finally, TG 490 (in vitro mammalian cell gene mutation
assays using the thymidine kinase (TK) gene [Mouse Lymphoma Assay (MLA) and TK6 test] approved in
2015. Because of the acceptance of a new TG (TG 490) that includes both the MLA and TK6 tests, TG 476
was revised and updated, and now includes only the in vitro mammalian cell gene mutation tests using the
hypoxanthine guanine phosphoribosyl transferase (Hprt) locus and xanthine-guanine phosphoribosyl
transferase transgene (xprt) gene.
6. A decision to delete some TGs was made based on the observation that these tests are rarely used
in the various legislative jurisdictions, that some basic core tests have been demonstrated as being robust
and sufficient based on many years of use, or on the availability of newer tests showing a better
performance for the same endpoint. Moreover, the assays conducted in mammalian cells are preferred to
those in yeasts, fungi or insects because they are considered more relevant to mammalian biology. TGs that
were deleted include: TG 477 (sex-linked recessive lethal test in Drosophila melanogaster); TG 480
(Saccharomyces cerevisiae, gene mutation test); TG 481 (Saccharomyces cerevisiae, mitotic
recombination assay); TG 482 (DNA damage and repair, Unscheduled DNA synthesis test in mammalian
cells in vitro); and, TG 484 (mouse spot test). In addition, TG 479 (in vitro sister chromatid exchange test
for mammalian cells) was deleted because of a lack of understanding of the mechanism(s) of action of the
effect detected by the test. Once approved for deletion, a TG is in effect for 18 months. During the 18
months, under the Mutual Acceptance of Data (MAD), assays that were planned before may continue to be
conducted and the results should be accepted by regulatory agencies. After the 18 months, results that
were previously generated, prior to the effective deletion date shall continue to be accepted, but no new test
should be initiated using the deleted test guideline.
7. Thus, the tests described in the deleted TGs should not be used for new testing, and are no longer
a part of the set of OECD recommended tests. However, data previously generated from these deleted TGs
can still be used in regulatory decisions. Therefore, the deleted TGs are available on the OECD public
website http://www.oecd.org/env/ehs/testing/oecdguidelinesforthetestingofchemicals.htm - bottom section
(“Test Guidelines that have been deleted or replaced by updated versions”), because it may be useful to
consult these TGs in the context of the assessment of chemicals based on old study reports.
8. In addition, it was recognised that two tests have limitations that result in their being less widely
used and less favoured by some regulatory authorities than in the past. These include TG 485, (the mouse
heritable translocation assay which requires 500 first generation males per dose level) and TG 486 [the
unscheduled DNA synthesis (UDS) test with mammalian liver cells in vivo]. Although both of these tests
fulfill most of the criteria for deletion, the decision was made to neither delete, nor update, these TGs
because they were still viewed as having utility by some regulatory agencies.
9. A decision was made not to update TG 471 (bacterial reverse mutation test) during this round of
revisions.

ENV/JM/MONO(2016)33/REV1
11
Table 1: Current status of the Test Guidelines for genetic toxicology
TG Title Adopted Revised Deleted Reference
Recently Revised
473 In vitro mammalian chromosomal aberration test
1983 1997 / 2014 OECD, 2014a
474 Mammalian erythrocyte micronucleus test 1983 1997 / 2014 OECD, 2014b
475 Mammalian bone marrow chromosomal aberration test
1984 1997 / 2014 OECD, 2014c
476 In vitro mammalian cell gene mutation test
using the Hprt and xprt genes 1984 1997 / 2015 OECD, 2015a
478 Rodent dominant lethal test 1984 2015 OECD, 2015b
483 Mammalian spermatogonial chromosomal aberration test
1986 1997/2015 OECD, 2015c
Recently Adopted
487 In vitro mammalian cell micronucleus test 2010 2014 OECD, 2014d
488 Transgenic rodent somatic and germ cell gene mutation assays
2011 2013 OECD, 2013
489 In vivo mammalian alkaline comet assay 2014 OECD, 2014e
490 In vitro gene mutation assays using the TK gene
2015 OECD, 2014d
Archived/Deleted
472 Genetic toxicology: Escherichia coli, Reverse Assay
1983 1997
477 Sex-linked recessive lethal test in Drosophila melanogaster
1984 2014
479 In vitro sister chromatid exchange assay in mammalian cells
1986 2014
480 Saccharomyces cerevisiae, gene mutation assay
1986 2014
481 Saccharomyces cerevisiae, mitotic recombination assay
1986 2014
482 DNA damage and repair, unscheduled DNA synthesis in mammalian cells in vitro
1986 2014
484 Mouse spot test 1986 2014
Retained, but not revised
471 Bacterial reverse mutation assay 1983 1997 OECD, 1997a
485 Mouse heritable translocation assay 1986 OECD, 1986
486 Unscheduled DNA synthesis (UDS) test with mammalian liver cells in vivo
1997 OECD, 1997b
1After the revision, TG 476 is only used for the mammalian cell gene mutation test using the Hprt or xprt locus

ENV/JM/MONO(2016)33/REV1
12
2 AIM OF GENETIC TOXICOLOGY TESTING
10. The purpose of genotoxicity testing is to identify chemicals that can cause genetic alterations in
somatic and/or germ cells, and to use this information in regulatory decisions. Compared to most other
types of toxicity, genetic alterations may result in effects that are manifested only after long periods
following exposure. Furthermore, the deleterious effect can be caused by DNA damage that occurs in a
single cell at low exposures. Rather than destroying that cell, the genetic alteration can result in a
phenotype that not only persists, but can be amplified, as the cell divides, creating an expanding group of
abnormal cells within a tissue or organ. Genetic alterations in somatic cells may cause cancer if they affect
the function of specific genes (i.e. proto-oncogenes, tumour suppressor genes and/or DNA damage
response genes). Mutations in somatic and germ cells are also involved in a variety of other (non-cancer)
genetic diseases. Accumulation of DNA damage in somatic cells has been related to some degenerative
conditions, such as accelerated aging, immune dysfunction, cardiovascular and neurodegenerative diseases
(Erickson, 2010; Hoeijmakers et al., 2009; Slatter and Gennery, 2010; De Flora and Izzotti, 2007; Frank,
2010). DNA damage in germ cells is associated with spontaneous abortions, infertility, malformation, or
heritable mutations in the offspring and/or subsequent generations resulting in genetic diseases, e.g. Down
syndrome, sickle cell anemia, hemophilia and cystic fibrosis (Yauk et al. 2015).
2.1 Genotoxicity Endpoints
11. Two types of genetic toxicology studies are considered (in order of importance): 1) those
measuring direct, irreversible damage to the DNA that is transmissible to the next cell generation, (i.e.
mutagenicity) and 2) those measuring early, potentially reversible effects to DNA, or the effect of
mechanisms involved in the preservation of the integrity of the genome (genotoxicity). It is recognised
that there are a number of different specific definitions for mutagenicity and genotoxicity that are used in
different geographic regions and by different regulatory authorities. For the purpose of this Document, the
use of working definitions for mutagenicity and genotoxicity has been proposed. These definitions are
presented below.
12. Mutagenicity is a subset of genotoxicity. Mutagenicity results in events that alter the DNA
and/or chromosomal number or structure that are irreversible and, therefore, capable of being passed to
subsequent cell generations if they are not lethal to the cell in which they occur, or, if they occur in germ
cells, to the offspring. Thus, mutations include the following: 1) changes in a single base pairs; partial,
single or multiple genes; or chromosomes; 2) breaks in chromosomes that result in the stable
(transmissible) deletion, duplication or rearrangement of chromosome segments; 3) a change (gain or loss)
in chromosome number (i.e. aneuploidy) resulting in cells that have not an exact multiple of the haploid
number; and, 4) DNA changes resulting from mitotic recombination. Positive results in mutagenicity tests
can be caused by test chemicals that do not act directly on DNA. Examples are aneuploidy caused by
topoisomerase inhibitors, or gene mutations caused by metabolic inhibition of nucleotide synthesis. There
is an extensive literature on elucidation of these mechanisms by follow-up testing as part of risk
assessment strategies that are beyond the scope of this guidance.
13. Genotoxicity is a broader term. It includes mutagenicity (described above), and it also includes
DNA damage which may be mutagenic, but may also be reversed by DNA repair or other cellular
processes, and, thus, which may or may not result in permanent alterations in the structure or information
content in a surviving cell or its progeny. Accordingly, tests for genotoxicity also include those tests that
evaluate induced damage to DNA (but not direct evidence of mutation) via effects such as unscheduled
DNA synthesis (UDS), DNA strand breaks (e.g. comet assay) and DNA adduct formation, i.e. primary
DNA damage tests (see Section 3).

ENV/JM/MONO(2016)33/REV1
13
3 TEST GUIDELINES FOR GENETIC TOXICOLOGY
14. A full evaluation of a chemical’s ability to induce the possible types of genetic damage involved
in adverse human health outcomes (cancer, non-cancer diseases involving somatic cell mutation, and
heritable disease involving germ cell mutation) includes tests that can detect gene mutation, structural
chromosomal damage and aneuploidy. To adequately cover all the genetic endpoints, one must use
multiple tests (i.e. a test battery), because no individual test can provide information on all endpoints.
Complete assessment of mutagenic potential through the detection of gene mutations, structural
chromosomal aberrations, and numerical chromosomal abnormalities can be achieved in a variety of ways.
However, the selection of: 1) which tests to use, 2) how to combine them into test batteries, 3) whether to
use them for initial screening or to follow up previously generated results, and 4) how to interpret the
hazard identified (or not), or to make decisions about further testing or regulatory action, is beyond the
purview of the OECD TGs and this document. Recommended batteries of tests are described in other
regional or international regulatory documents for various types of chemicals (e.g. Cimino, 2006a and b;
Eastmond et al., 2009).
15. There are tests that detect primary DNA damage (i.e. the first in the chain of events leading to a
mutation), but not the consequences of this genetic damage. The endpoint measured in these tests does not
always lead to a mutation, a change that can be passed on to subsequent generations (of cells or
organisms). The DNA damage measured in the comet assay, or the unscheduled DNA synthesis test, may
lead to cell death, or it may initiate DNA repair, which can return the DNA either to its original state or
result in mutation. When evaluating the mutagenic potential of a test chemical, more weight should be
given to the measurement of permanent DNA changes (i.e. mutations) than to DNA damage events that are
reversible. However, tests that detect primary DNA damage can be useful for: 1) preliminary screening; 2)
as part of in vivo follow up of in vitro positive results; 3) for mechanistic studies, e.g. for the detection of
oxidative DNA damage; 4) as an exposure biomarker demonstrating that the test chemical, or its metabolic
or reactive products, have reached a target tissue and can damage the DNA; and 5) the investigation of the
mode of action of carcinogens in target tissues.
16. The information and recommendations provided in the TGs have been developed specifically for
the routine evaluation of test chemicals, in particular for hazard identification. It should be recognised that
the recommendations in each of the TGs and reflected in this Document are, therefore, specific for hazard
identification. When a test is being used for more detailed experimentation, or for other regulatory
purposes (other than hazard identification), modification(s) of the protocol may be necessary. For instance,
if the goal is to conduct a more detailed dose response evaluation, perhaps at low doses/concentrations to
assess whether there is a no observed-effect level, or to better define a point of departure for quantitative
risk assessment, or to understand the response at particular levels of exposure, it is likely that a greater
number of test concentrations/doses would be required, and/or a different strategy for concentration/dose
selection (than indicated in the TGs), and/or increasing the power of the study (than indicated in the TGs;
e.g. by scoring more cells) would be needed. If the goal is to evaluate whether a chemical that is a mutagen
and a carcinogen is inducing specific tumors via a mutagenic mode of action, it would be desirable to tailor
the concentration/dose selection and possibly the length of exposure and timing of sampling to optimally
address the question(s) being investigated for that specific chemical. There are a number of references that
provide additional information for designing experiments that go beyond simple hazard identification (Cao
et al., 2014; Gollapudi et al., 2013; Johnson et al., 2014; MacGregor et al., 2015a; MacGregor et al.,
2015b; Moore et al., 2008; Parsons et al., 2013; and Manjanantha et al., 2015).
17. The individual TGs provide specific information describing the tests and the detailed
recommendations for their conduct. The tests are briefly discussed below. This section is divided into in
vitro and in vivo tests, and further divided based on the principal genetic endpoint detected by the specific
test.

ENV/JM/MONO(2016)33/REV1
14
3.1 In vitro genetic toxicology tests
3.1.1 Tests for gene mutations
18. TG 471: Bacterial Reverse Mutation Test. The bacterial reverse mutation test (commonly
called the “Ames test”) identifies chemicals that induce gene mutations (i.e. both base-pair substitutions
and frameshift mutations resulting from small insertions and deletions). This test uses specific strains of
two species of bacteria, Salmonella typhimurium and Escherichia coli. Each strain contains identified
mutations in an amino acid biosynthesis gene (i.e. histidine [His] or tryptophan [Trp], respectively) as the
reporter gene. Those mutations prevent bacterial growth in the absence of the amino acid in the growth
medium. Exposure to mutagens may induce a mutation (a reversion) that will restore the wild type DNA
sequence, or the wild type phenotype, and the functional capability of the bacteria to synthesise the
essential amino acid, and thus, to grow on medium without the required amino acid. Cells in which this
function-restoring mutation (reversion) has occurred are called revertants and for the test method, bacterial
colonies are counted. Consequently, the Ames test is termed a “reverse mutation test”.
19. There is a panel of specific strains that are used for the bacterial reverse mutation test, which are
each sensitive to a different mechanism of mutation (e.g. base substitution at GC pairs, base substitution at
AT pairs, or a single base insertion or deletion). A positive result in any one strain is considered relevant,
and positive results in additional strains do not necessarily increase the level of confidence in the
mutagenic response. The strains that can be reverted by the test chemical, and therefore, the types of
mutation(s) induced by the test chemical, may provide information on the chemical’s mechanism of action.
20. An advantage of the bacterial reverse mutation test is the relatively large number of cells exposed
(about 108) with a background mutant frequency that is both low and stable enough to allow a large range
of response between the background and the highest induced mutant frequencies usually detected. This
combination of wide range and stable background allows for relatively sensitive and reliable detection of
chemicals that induce a weak response.
21. S. typhimurium and E. coli are prokaryotic bacteria that differ from eukaryotic/mammalian cells
in factors such as cellular uptake, metabolism, chromosome structure and DNA repair processes. As such,
they have some limitations in reflecting the effects in mammalian species including humans. There have
been developments to automate the test and to minimise the amount of test chemical required (Claxton et
al., 2001; Fluckiger-Isler et al., 2004; Sui et al., 2009). While widely used for screening, the miniaturised
versions of the Ames test have not been universally accepted as replacements for standard regulatory
testing.
22. TG 476: In vitro Mammalian Cell Gene Mutation Tests Using the Hprt or xprt genes. These
in vitro mammalian cell gene mutation tests identify chemicals that induce gene mutations at the Hprt
(hypoxanthine-guanine phosphoribosyl transferase) or xprt (xanthine-guanine phosphoribosyl transferase)
reporter gene. This test is a forward mutation test because the mutation inactivates the function of the gene
product rather than reversing a previous inactivating mutation. Gene mutations are evaluated as mutant
colonies that can grow in medium containing the selective agent 6-thioguanine, a metabolic poison which
allows only cells deficient in HPRT to grow and form colonies. Because the Hprt gene is on the X-
chromosome in humans and rodents, only one copy of the Hprt gene is active per cell. Thus, a mutation
involving only the single active Hprt gene will result in a cell with no functional HPRT enzyme. The test
can be performed using a variety of established cell lines. The most commonly used cells for the HPRT
test include the CHO, CHL and V79 lines of Chinese hamster cells, L5178Y mouse lymphoma cells, and
TK6 human lymphoblastoid cells. The non-autosomal location of the Hprt gene (X-chromosome) allows
the detection of point mutations, insertions and deletions of varying lengths.

ENV/JM/MONO(2016)33/REV1
15
23. For the XPRT assay, the bacterial gpt transgene that codes for the XPRT enzyme, a bacterial
analogue of the mammalian HPRT protein enzyme, is used. The only cells recommended in TG 476 for the
XPRT assay are AS52 cells (derived from CHO cells) containing the bacterial gpt transgene (and from
which the Hprt gene was deleted). The autosomal location of the gpt locus allows the detection of certain
genetic events, such as large deletions and loss of heterozygosity via inter-allelic recombination, not
readily detected in the HPRT test because such events may be lethal due to the lack of homologous genes
(Honma et al., 1997).
24. Both tests involve treating cells with the test chemical, followed by an incubation period that
provides sufficient time (termed the expression time) for the newly induced mutants to lose their functional
HPRT or GPT enzyme. The cell population is cloned in the presence and absence of the selective agent 6-
thioguanine for the enumeration of mutant cells and the measurement of cloning efficiency, respectively, in
order to calculate a mutant frequency. This mutant selection can be performed either using Petri dishes (for
monolayer cultures) or microtiter culture plates (for suspension cell cultures). The soft agar cloning
method has also been used successfully for the HPRT assay in L5178Y mouse lymphoma cells (Moore and
Clive, 1982).
25. The cell density in mutant selection culture plates should be limited in order to avoid metabolic
co-operation (sharing of HPRT enzyme) between mutant and non-mutant cells, which would alter mutant
selection. This is particularly important for cells growing in monolayer such as cultures of V79 or CHO
cells (COM 2000), but is less of an issue for cells growing in suspension.
26. TG 490: In vitro Mammalian Cell Gene Mutation Tests Using The Thymidine Kinase Gene.
This new TG describes two distinct assays that identify chemicals that cause gene mutations at the
thymidine kinase (TK) reporter gene. The two assays use two specific TK heterozygous cell lines: L5178Y
TK+/-
3.7.2C cells for the mouse lymphoma assay (MLA) and TK6 (TK+/-
) cells for the TK6 assay; these are
forward mutation assays. The mouse lymphoma assay (MLA) and TK6 assay using the TK locus were
originally described in TG 476. Since the last revision of TG 476, the MLA Expert Workgroup of the
International Workshop for Genotoxicity Testing (IWGT) has developed internationally harmonised
recommendations for assay acceptance criteria and data interpretation for the MLA (Moore et al. 2003,
2006) and this new TG was written to accommodate these recommendations. While the MLA has been
widely used for regulatory purposes, the TK6 assay has been used much less frequently. It should be noted
that in spite of the similarity between the endpoints, the two cell lines are not interchangeable, and there
may be a valid preference for one over the other for a particular regulatory program. For instance, the
validation of the MLA demonstrated its appropriateness for detecting not only gene mutation, but also the
ability of a test chemical to induce structural chromosomal mutation [International Conference on
Harmonisation of Technical Requirements for Registration of Pharmaceuticals for Human Use (ICH,
2011)].
27. The autosomal and heterozygous nature of the TK gene in the two cell lines enables the detection
of cells deficient in the enzyme TK following mutation from TK+/-
to TK-/-
. This deficiency can result from
genetic events that are compatible with cell survival while they affect the TK gene. Genetic events detected
using the TK locus include both gene mutations (base substitutions, frameshift mutations, small deletions)
and chromosomal damage (large deletions, chromosomal rearrangements and mitotic recombination). The
latter events are expressed as loss of heterozygosity (LOH), which is a common genetic change of tumor
suppressor genes in human tumorigenesis.
28. TK mutants include normal growing and slow growing mutants. These are recognised as “large
colony” and “small colony” mutants in the MLA, and as “early appearing colony” and “late appearing
colony” mutants in the TK6 assay. Normal growing and slow growing mutants are scored simultaneously
and differentiated by size and shape in the MLA. Normal growing and slow growing mutants are scored at

ENV/JM/MONO(2016)33/REV1
16
different incubation times in the TK6 assay. Scoring of slow growing colonies in the TK6 assay requires
cell refeeding with the selective agent and growth media (Liber et al., 1989). Normal growing and slow
growing mutants must be enumerated as separate mutant frequencies. Normal growing colonies are
considered indicative (but not exclusively predictive) of chemicals inducing point and other small-scale
mutations; whereas, slow growing colonies are considered indicative of chemicals that induce
chromosomal damage (Moore et al., 2015; Wang et al., 2009). Slow growing colonies consist of cells that
have suffered damage impacting genes adjacent to TK. Their doubling time is prolonged and, thus, the size
of the colony is smaller than for a normal growing one (Amundson and Liber, 1992; Moore et al., 2015).
29. The test involves treating cells with the test chemical. After a sufficient expression time for the
newly induced mutants to lose their functional TK enzyme, the cell population is cloned in the presence
and absence of the selective agent triflurothymidine for the enumeration of mutant cells and the
measurement of cloning efficiency, respectively, in order to calculate a mutant frequency. For the MLA,
this mutant selection can be performed using soft agar cloning medium in Petri dishes or liquid medium in
microwell culture plates. The TK6 assay is generally conducted using microwell culture plates.
3.1.2 Tests for chromosomal abnormalities
30. There are basically two types of endpoints that can be used to determine if a chemical can cause
chromosomal damage and/or aneuploidy; chromosomal aberrations and micronuclei. Most cells containing
chromosomal aberrations are not viable when, for example, the deficiency comprises essential gene(s) and,
thus, they are not transmitted to daughter cells. Micronuclei are visualised in cells following the first cell
division, but are not retained in all subsequent generations. Thus, most events detected in the chromosomal
aberration and micronucleus tests are not mutations per se. Nevertheless, based on many genetic studies of
the chromosomal basis of heritable genetic effects in humans and other species, it can be assumed that
chemicals able to induce chromosomal aberrations and micronuclei in those tests are also able to induce
transmissible chromosome mutations, e.g. reciprocal translocations, stable translocations and aneuploidy
(Yauk et al., 2015).
31. TG 473: in vitro Mammalian Chromosomal Aberration Test. The in vitro chromosomal
aberration test identifies chemicals that induce structural chromosomal aberrations (breaks, deletions and
rearrangements). In cultures of established cell lines [e.g. CHO, V79, Chinese Hamster Lung (CHL), TK6]
or primary cell cultures, including human or other mammalian peripheral blood lymphocytes The cells
used should be selected on the basis of growth ability in culture, stability of the karyotype (including
chromosome number) and spontaneous frequency of chromosomal aberrations. At the present time, the
available data do not allow firm recommendations to be made, but suggest it is important, when evaluating
chemical hazards, to consider the p53 status, genetic (karyotype) stability, DNA repair capacity and origin
(rodent versus human) of the cells chosen for testing. The users of this test are, thus, encouraged to
consider the influence of these and other cell characteristics on the performance of a cell line in detecting
the induction of chromosomal aberrations, as knowledge evolves in this area.
32. Structural chromosomal aberrations may be of two types, chromosome or chromatid, depending
on the mechanism of action; the chromatid-type is most often observed. Most chromosomal aberrations are
observed only in metaphases of the first or second mitotic cell division after treatment, because most cells
containing these aberrations are lost in subsequent cell divisions, they do not result in mutations per se.
Chemicals may be active in particular phases of the cell cycle and, thus, give a particular pattern of
chromatid versus chromosome aberrations. That is, a G2-active chemical is likely to induce chromatid
aberrations at the first mitosis, but many of these events will be converted into chromosome aberrations in
the second mitosis. Furthermore, damage induced pre-S-phase will appear as chromosome aberrations but
damage induced post-S-phase will result in chromatid aberrations in the first mitosis. When cells are
exposed to chemicals during the entire cell cycle, it is likely that both chromatid and chromosome
aberrations will be observed. Individual cells are viewed by microscope and the information on the types of

ENV/JM/MONO(2016)33/REV1
17
chromosomal aberrations observed in each cell is recorded. Chromosomal aberrations occur if DNA strand
breaks are misrepaired. This repair system theoretically involves removal of a few nucleotides to allow
somewhat inaccurate alignment of the two ends for rejoining followed by addition of nucleotides to fill in
gaps.
33. There is extensive literature suggesting that fluorescence in situ hybridisation (FISH), or
chromosome painting, can provide additional (mechanistic) information including detection of anugens
through enhanced visualisation of translocations that are not readily visible in the standard chromosomal
aberration test. However, the Expert Group did not incorporate recommendations regarding use of these
techniques in any of the Test Guidelines for chromosomal aberrations (TG 473, TG 475, and TG 483)
during update of the Test Guidelines.
34. Polyploidy (including endoreduplication) could arise in chromosome aberration assays in vitro.
While aneugens can induce polyploidy, polyploidy alone does not indicate aneugenic potential, and can
simply indicate cell cycle perturbation or cytotoxicity. This test is not designed to measure aneuploidy. An
in vitro micronucleus test would be recommended for the detection of aneuploidy.
35. TG 487: in vitro Mammalian Cell Micronucleus Test. The in vitro micronucleus test identifies
chemicals that induce chromosomal breaks and aneuploidy. Micronuclei are formed when either a
chromosome fragment or an intact chromosome is unable to migrate to a mitotic pole during the anaphase
stage of cell division and is not incorporated into the daughter nuclei. The test, thus, detects chromosomal
breaks (caused by clastogens) or numerical chromosomal abnormalities or chromosome loss (caused by
aneugens). In order to differentiate clastogens (micronuclei without centromeres/kinetochores) from
aneugens (micronuclei with centromeres/kinetochores), it is necessary to use FISH and centromere or
kinetochore staining.
36. The test can be conducted using cultured primary human, or other mammalian peripheral blood
lymphocytes, and a number of cell lines such as CHO, V79, CHL, L5178Y and TK6. There are other cell
lines that have been used for the micronucleus assay (e.g. HT29, Caco-2, HepaRG, HepG2 and primary
Syrian Hamster Embryo cells), but these have not been extensively validated, and the TG recommends that
they be used only if they can be demonstrated to perform according to the described requirements. The
cells used are selected on the basis of their ability to grow well in culture, stability of their karyotype
(including chromosome number), and spontaneous frequency of micronuclei. At the present time, the
available data do not allow firm recommendations to be made, but suggest it is important, when evaluating
chemical hazards to consider the p53 status, genetic (karyotype) stability, DNA repair capacity and origin
(rodent versus human) of the cells chosen for testing. The users of this test are, thus, encouraged to
consider the influence of these and other cell characteristics on the performance of a cell line in detecting
the induction of micronuclei, as knowledge evolves in this area.
37. The scoring of micronuclei is generally conducted in the first interphase after the first division of
cells following test chemical exposure. Cytochalasin B (cytoB) can be used to block cytoplasm
division/cytokinesis and generate binucleate cells during or after test chemical exposure. This may be
desirable, because it can be used to measure cell proliferation and allows the scoring of micronuclei in
dividing cells only. The use of cytochalasin B is mandatory for mixed cell cultures, such as whole blood
cultures, in order to identify the dividing target cell population; but for cell lines the test can be conducted
either with or without cytochalasin B; however, potential interactions between the test chemical and
cytochalasin B should be noted. It should be noted that when using L5278Y cells there may be problems
with conducting the test, and, therefore, the MN test should be performed without cytochalasin B.
ENV/JM/MONO(2016)33/REV1
18
38. Automated systems that can measure micronucleated cell frequencies include, but are not limited
to, flow cytometers (Avlasevich, et al., (2011), image analysis platforms (Doherty et al. 2011; Seager et
al., 2014), and laser scanning cytometers (Styles et al., 2001).
39. The in vitro micronucleus test has been shown to be as sensitive as the chromosomal aberration
test for the detection of clastogens, and has the additional advantage of detecting aneugens (Corvi et al.,
2008). However, the in vitro micronucleus test does not allow identification of translocations and other
complex chromosomal rearrangements that can be visualised in the chromosomal aberration assay, and
which may provide additional mechanistic information.
3.2 In vivo genetic toxicology tests
3.2.1 Tests for gene mutations
40. For the in vivo gene mutations tests, mutations are measured in transgenic “reporter” genes that
generally are not expressed in situ; however, both “reporter” genes and endogenous, expressed genes are
assumed to be mutated through similar molecular mechanisms (OECD, 2009). Positive selection systems
have been developed to select, visualise, and enumerate the clones/colonies resulting from mutant cells.
41. TG 488: Transgenic Rodent Somatic and Germ Cell Gene Mutation Assays. The transgenic
rodent gene mutation test identifies chemicals that induce gene mutations in transgenic reporter genes in
somatic and male germ cells. The test uses transgenic rats or mice that contain multiple copies of
chromosomally integrated phage or plasmid shuttle vectors, which harbour the transgenic reporter genes in
each cell of the body, including germ cells. Therefore, mutagenicity can be detected in virtually any
tissues of an animal that yield a sufficient amount of DNA, including specific site of contact tissues and
germ cells. The reporter genes are used for detection of gene mutations and/or small deletions and
rearrangements resulting in DNA size changes (the latter specifically in the lacZ plasmid and Spi-
test
models) induced in vivo by the test chemicals (OECD, 2009, OECD, 2011; OECD, 2009). Briefly,
genomic DNA is extracted from tissues, transgenes are recovered from genomic DNA, and transfected into
a bacterial host deficient for the reporter gene. The mutant frequency is measured using specific selection
systems. The transgenes are genetically neutral in the animals, i.e. their presence or alteration has no
functional consequence to the animals that harbour them. These transgenes respond to treatment in the
same way as endogenous genes in rats or mice with a similar genetic background, especially with regard to
the detection of base pair substitutions, frameshift mutations, and small deletions and insertions (OECD,
2009). These tests, therefore, circumvent many of the limitations associated with the study of in vivo gene
mutation in endogenous genes (e.g. limited tissues suitable for analysis that can be used to readily
enumerate mutant cells). Because the target genes are functionally neutral, mutations can accumulate over
time allowing increased sensitivity for detection of mutations when tissues receive repeated
administrations of the test chemical. A 28-day treatment is recommended for exposing both somatic and
germline tissues.
42. DNA sequencing of mutants is not required, but it is often helpful to confirm that the mutational
spectra, or type of mutations seen following treatment, are different from those found in the untreated
animal/tissue, to calculate the frequency of the different specific types of mutations, and to provide
mechanistic data. DNA sequencing is also used to estimate the amount of clonal expansion of the
originally mutated cell to more accurately estimate the actual mutation frequency by adjusting the
frequency of mutants detected by positive selection.
3.2.2 Tests for chromosomal abnormalities
43. As described in Section 3.1.2, there are two types of chromosome damage endpoints
(chromosomal aberrations and micronuclei). Based on many genetic studies of the chromosomal basis of

ENV/JM/MONO(2016)33/REV1
19
heritable genetic effects in humans and other species, it can be assumed that chemicals able to induce
chromosomal aberrations and micronuclei in those tests are also able to induce transmissible chromosome
mutations (e.g. reciprocal translocations, stable translocations and aneuploidy) in humans.
44. TG 474: Mammalian Erythrocyte Micronucleus Test. The mammalian erythrocyte
micronucleus test identifies chemicals that induce micronuclei in erythroblasts sampled from bone marrow
(usually measured in immature erythrocytes) or peripheral blood (usually measured in reticulocytes) of
animals. Normally rodents are used, but other species (e.g. dogs, primates, humans) can be studied when
justified. When a bone marrow erythroblast develops into an immature erythrocyte (also referred to as a
polychromatic erythrocyte, or reticulocyte) and then migrates into the peripheral blood, the main nucleus is
extruded. Subsequently, any micronuclei that have been formed may remain behind in the cytoplasm.
Thus, detection of micronuclei is facilitated in erythrocytes because they lack a main nucleus.
45. Micronuclei may originate from acentric chromosomes, lagging chromosome fragments or whole
chromosomes, and, thus, the test has the potential to detect both clastogens and aneugens. The use of FISH
and centromere, kinetochore, or alpha-satellite DNA staining can provide additional mechanistic
information, and help differentiate clastogens (resulting in micronuclei without centromeres) from
aneugens (resulting in micronuclei with centromeres). Automated systems that can measure micronucleus
frequencies include, but are not limited to, flow cytometers for erythrocytes (Torous et al., 2000; De Boeck
et al., 2005; Dertinger et al., 2011), image analysis platforms (Doherty et al., 2011), and laser scanning
cytometers (Styles et al., 2001).
46. Micronuclei can be measured in other tissues, provided that the cells have proliferated before
tissue collection and can be properly sampled (Hayashi et al., 2007; Uno 2015a and b). However, this TG
is restricted to measurement of effects in the bone marrow that are subsequently detected in the bone
marrow per se or in the peripheral blood because of the lack of validation of tests applied to other tissues.
These limitations restrict the usefulness of the micronucleus test for the detection of chemicals targeting
specific organs.
47. TG 475: Mammalian Bone Marrow Chromosomal Aberration Test. The mammalian bone
marrow chromosomal aberration test identifies chemicals that induce structural chromosomal aberrations
in bone marrow cells. While rodents are usually used, other species may in some cases, be appropriate, if
scientifically justified. Structural chromosomal aberrations may be of two types, chromosome- or
chromatid-type depending on the mechanism of action. The chromatid-type is more often observed.
Chromosomal aberrations are observed only in metaphase of the first or second mitotic cell division
because cells containing aberrations are usually lost in subsequent cell divisions.
48. Although chromosomal aberrations can potentially be measured in other tissues, TG 475
describes detection of effects in bone marrow cells only. Because of this tissue limitation, the test may not
provide useful information for chemicals targeting specific organs nor for reactive direct acting chemicals
that should be tested at a site of contact. Cell information on the various types of chromosomal aberrations
is visualised in individual cells using microscopy.
49. The standard design of this test is not optimised for the detection of aneuploidy. Polyploidy
(including endoreduplication) could arise in chromosomal aberration tests in vivo. Although increased
incidence of polyploidy may be seen as an indication for numerical chromosomal abnormalities, an
increase in polyploidy per se does not indicate aneugenic potential; rather, it may simply indicate cell cycle
perturbation. Because of the nature of the damage, it can only be detected within days of its occurrence.
50. TG 478: Rodent Dominant Lethal Test. The rodent dominant lethal test identifies chemicals
that induce genetic damage causing embryonic or fetal death resulting from inherited dominant lethal
ENV/JM/MONO(2016)33/REV1
20
mutations induced in germ cells of an exposed parent, usually male rats or mice (Bateman, 1984; Generoso
and Piegorsch, 1993) or, predominantly, in the zygote after fertilisation (Marchetti et al, 2004). Usually
male rats are treated and mated to a number of untreated virgin females sufficient to permit the detection of
at least a doubling in the dominant lethal frequency; occasionally, females are treated; however, females
appear less suitable in a system where fertilisation of the eggs is essential and where embryonic death is
evaluated (Green et al., 1985).
51. Dominant lethality is generally a consequence of structural and/or numerical chromosomal
aberrations, but gene mutations and toxic effects cannot be excluded. Because it requires a large number of
animals, this test is rarely used. While death of a fetus is the event detected, the dominant lethal test does
not necessarily assess a biological endpoint that reflects a potential health risk to future generations, it does
represent an adverse health outcome for the mother. Furthermore, chemicals that cause dominant lethality
also cause F1 congenital malformations (i.e. the viable equivalent of dominant lethality; Anderson et al.,
1998), and the majority of chemicals that are positive in the dominant lethal test also are positive in the
heritable translocation test (TG 485) and specific locus test (Yauk et al., 2015) which do measure heritable
mutations per se. Accordingly, the dominant lethal test is also predictive of mutational events that can
affect the offspring.
52. TG 483: Mammalian Spermatogonial Chromosomal Aberration Test. The spermatogonial
chromosomal aberration test identifies chemicals that induce structural chromosomal aberrations in male
germ cells and is predictive for the induction of heritable mutations. Usually, sexually mature Chinese
hamsters or mice are used. Chromosomal aberrations in spermatogonial cells are readily observed in
metaphases of the first or second mitotic cell division of spermatogenesis. Cytogenetic preparations for
analysis of spermatogonial metaphases at 24 and 48 h after exposure allow the analysis of chromosomal
aberrations in spermatocytes. A measure of cytotoxicity, and, thus, of exposure of the target cells, can be
obtained by measuring the ratio between spermatogonial metaphases to either meiotic metaphases or
interphase cells. The standard design of the test is not suitable for detection of aneuploidy. Although
increased incidence of polyploidy may be seen as an indication for numerical chromosomal abnormalities,
an increase in polyploidy per se does not indicate aneugenic potential because it can result from cell cycle
perturbation.
53. TG 485: Mouse Heritable Translocation Assay. The mouse heritable translocation assay
identifies chemicals that induce structural chromosomal changes in the first generation progeny of exposed
males. The test is performed in mice, because of the ease of breeding and cytological verification.
Sexually mature animals are used. The average litter-size of the strain should be greater than 8, and it
should be relatively constant. The type of chromosomal change detected in this test system is reciprocal
translocation. Carriers of translocation heterozygotes and XO-females show reduced fertility. This method
is used to select first generation progeny for cytogenetic analysis. Translocations are cytogenetically
observed as quadrivalents, which are comprised of two sets of homologous chromosomes (or bivalents) in
meiotic cells at the diakinesis stage of meiosis of F1 male progeny. To analyze for translocation
heterozygosity one of two possible methods is used: 1) fertility testing of first generation progeny; or 2)
cytogenetic analysis of all male first generation progeny. Monitoring of the litter size of the F1 generation
can provide an indication that dominant lethality is also occurring. The mouse heritable translocation test
requires a large number of animals and is consequently rarely used. Moreover, expertise for the
performance of the mouse heritable translocation test is no longer readily available.
3.2.3 Tests for Primary DNA Damage
54. TG 486: Unscheduled DNA Synthesis (UDS) Test With Mammalian Liver Cells in vivo.
The unscheduled DNA synthesis (UDS) test identifies chemicals that induce DNA damage and subsequent
repair (measured as unscheduled DNA synthesis vs. normal S-phase scheduled synthesis) in liver cells of

ENV/JM/MONO(2016)33/REV1
21
animals, commonly rats. However, this test does not detect the mutagenic consequences of the unrepaired
genetic damage. Accordingly, the UDS test may be an appropriate test to detect DNA damage after
exposure to chemicals that specifically target the liver, and that were positive in the Ames test. The test
responds positively only to chemicals that induce the type of DNA damage that is repaired by nucleotide
excision repair (mainly bulky adducts). The test is based on the incorporation of tritium-labelled thymidine
into the DNA by repair synthesis after excision and removal of a stretch of DNA containing a region of
damage, and the response is dependent on the number of DNA bases excised and replaced at the site of
damage.
55. To conduct the UDS test, the test chemical is administered in vivo by the appropriate route, the
liver cells are collected, generally by liver perfusion, and put into cultures. The incorporation of tritium-
labelled thymidine into the liver cell DNA is conducted in vitro, and this is scored following
autoradiography. The UDS test should not be considered as a surrogate for a gene mutation test and it may
be less reliable than other primary DNA damage tests (Kirkland and Speit, 2008).
56. TG 489: In vivo Mammalian Alkaline Comet Assay. The comet assay identifies chemicals
that induce primary DNA damage. An alternate name is the alkaline single-cell gel electrophoresis assay.
Under alkaline conditions (> pH 13), the comet assay can detect single and double strand breaks in
eukaryotic cells, resulting, for example, from direct interactions with DNA, alkali labile sites, as a
consequence of transient DNA strand discontinuities resulting from DNA excision repair, or from
processing during the assay. These DNA strand breaks may be: 1) repaired, resulting in no persistent effect;
2) lethal to the cell; or 3) fixed as a mutation resulting in a permanent heritable change. Therefore, the
alkaline comet assay detects primary DNA strand breaks that do not always lead to gene mutations and/or
chromosomal aberrations.
57. The comet assay can be applied to any tissue of an animal from which good quality single cell or
nuclei suspensions can be prepared, including specific site of contact tissues and germ cells (Tice et al.,
1990). Cell division is not required. The comet assay provides an indication whether the chemical, or its
metabolites, can reach DNA and cause primary strand breaks in a tissue, and, therefore, it is also useful in
detecting exposure to target tissues and possible target tissues. However, neither structural chromosomal
damage nor mutation is detected directly. Like many of the in vivo genetic toxicology tests, it can be
integrated into repeat dose toxicity studies designed for other purposes (see Section 4.2.4), but because the
damage it measures usually does not persist, longer exposures do not result in increased sensitivity.
Accordingly, DNA damage (DNA strand breaks) should be measured shortly after exposure.
58. It should be noted that the standard alkaline comet assay as described in TG 489, is not
considered appropriate to measure DNA strand breaks in mature germ cells (i.e. sperm). Genotoxic effects
may be measured in testicular cells at earlier stages of differentiation. However, because in males the
gonads contain a mixture of somatic and germ cells, positive results in the whole gonad (testis) are not
necessarily reflective of germ cell damage; nevertheless, positive results indicate that the test chemical has
reached the gonad and has caused genotoxicity in this tissue. Currently, testing of fresh tissue samples is
recommended because freezing/thawing of sampled tissues and subsequent performance of the comet
assay is not regarded as fully validated (see also paragraph 91).
59. The alkaline comet assay is most often performed in rodents, although it can be applied to other
species, if scientifically justified. Further modifications of the assay allow more efficient and specific
detection of DNA cross-links, or certain oxidised bases (by addition of lesion-specific endonucleases). The
test guideline does not include procedures for the conduct of these modifications of the test.
60. Fragmentation of the DNA can be caused not only by chemically-induced genotoxicity, but also
during the process of cell death, i.e. apoptosis and necrosis. It is difficult to distinguish between

ENV/JM/MONO(2016)33/REV1
22
genotoxicity and apoptosis/necrosis by the shape of the nucleus and comet tail after electrophoresis, e.g. by
scoring “hedgehogs” (Guerard et al., 2014; Lorenzo et al, 2013). Consequently, for positive results, it is
recommended that tissue samples be collected for histopathological examination to determine if
apoptosis/necrosis occurred and could have resulted in DNA strand breaks via a non-genotoxic
mechanism.
4 OVERVIEW OF ISSUES ADDRESSED IN THE 2014-2015 REVISION OF THE GENETIC
TOXICOLOGY TEST GUIDELINES
61. As indicated in the introductory paragraphs, the Expert Workgroup undertook an extensive
revision of the genetic toxicology TGs including a comprehensive harmonisation of recommendations
across the TGs. This Document provides an amplification of issues considered to be important for test
conduct and data interpretation and also an overview of the new recommendations.
4.1 Issues specific to in vitro TGs
4.1.1 Cells
62. In the recent revision to the in vitro TGs there is new guidance concerning the characterisation
and handling/culturing of cells that are used in the individual tests. In particular, an emphasis is placed on
assuring that genetic drift is avoided for cell lines. For many of the widely used mammalian cell lines, a
new cell repository has been recently established and stocked with cells that are as close as possible to the
original source (Lorge et al., in prep).
4.1.2 Cytotoxicity and selection of highest concentration for cytotoxic chemicals
63. For the in vitro assays, cytotoxicity is used as a primary means for selecting test concentrations.
The in vitro assays are conducted using measurements of cytotoxicity that have been developed and are
specific to the individual assays. Since the previous revisions of the TGs, the importance of cytotoxicity,
and the possibility that biologically irrelevant positive results, can be obtained at high levels of cytotoxicity
has been recognised (Lorge et al., 2008). The recommendations for measuring cytotoxicity and the
appropriate levels of cytotoxicity are now clearly emphasised in the individual TGs and are summarised
here. These changes were implemented to standardise interpretation of assay results and guide the conduct
of testing to increase the reliability and acceptability of the data by providing clearer standards for
measuring cytotoxicity and ensuring that the most appropriate limit concentration is used when testing
cytotoxic chemicals. It should be noted that for in vitro assays, the treatment period is relatively short
(generally 3 to 24 hours). It is not useful to conduct longer term in vitro exposures. This is because some of
the endpoints, particularly the cytogenetic endpoints, do not accumulate with time, and most actually
decrease with time (either because they are diluted by differential growth or eliminated by apoptosis). In
order to detect genetic damage, in vitro tests are conducted up to high test chemical concentrations in order
to induce detectable levels of genetic damage under short treatment periods. Therefore, information on in
vivo exposure concentrations are not relevant to the selection of exposures used in in vitro assays that are
set based on the physiology of the mammalian cells under the conditions of the in vitro assay. This
characteristic is consistent with the use of in vitro tests for hazard identification.
4.1.2.1 in vitro cytogenetic assays
64. The proper conduct of the in vitro cytogenetic assays requires assuring that the cells in all of the
test cultures have undergone cell division and have achieved a high proportion of dividing cells in the
negative control/untreated cultures. The reduction of cell proliferation is usually used to evaluate
cytotoxicity. Two new measures of cytotoxicity for the in vitro cytogenetic assays, the Relative Increase in

ENV/JM/MONO(2016)33/REV1
23
Cell Count (RICC) and Relative Population Doubling (RPD), have been developed and are now
recommended in the revised TGs 473 and 487 for use with cell lines. Previously recommended methods
such as Relative Cell Counts (RCC), trypan blue, and other vital stains, and optical evaluation of
confluence or cell density are no longer recommended because they do not demonstrate that the cells are
dividing. Passage through at least part of mitotic cycle is required before a micronucleus or chromosomal
aberration is created. The new measures are, thus, more directly related to the end points. It should be
noted that RPD is thought to underestimate cytotoxicity in cases of extended sampling time (e.g. treatment
for 1.5-2 normal cell cycle lengths and harvest after an additional 1.5-2 normal cell cycle lengths, leading
to sampling times longer than 3-4 normal cell cycle lengths in total) as stated in the revised TGs. Under
these circumstances RICC might be a better measure for cytotoxicity. Alternatively, the evaluation of
cytotoxicity after a 1.5-2 normal cell cycle lengths would be a helpful estimate. For the micronucleus
assay, in addition to RICC and RPD, the Cytokinesis Blocked Proliferation Index (CBPI), or the
replication index (RI) continue to be acceptable measures of cytotoxicity. For certain chemical classes,
e.g. surfactants, the CBPI may underestimate cytotoxicity in in vitro micronucleus assays using cytoB.
Mitotic index continues to be recommended for the chromosomal aberration assay when using primary
cultures of lymphocytes for which, in contrast to immortalised cell lines, RPD and RICC may be
impractical to measure.
65. The top level of cytotoxicity for assay acceptance has been more explicitly defined for the in
vitro cytogenetic assays, and it should be noted that this level differs from that requested by other
guidelines/guidances. It is now recommended that if the maximum concentration is based on cytotoxicity,
the highest concentration should aim to achieve 55 ± 5% cytotoxicity using the recommended cytotoxicity
parameters (i.e. reduction in RICC, RPD, CBPI, RI, or MI to 45± 5% of the concurrent negative control).
Care should be taken in interpreting positive results found only in the higher end of this 55 ± 5%
cytotoxicity range.
4.1.2.2 in vitro gene mutation assays
66. The in vitro gene mutation assays require that the cells grow through the expression phase of the
assay, and also during the cloning for mutant selection. Therefore, they can only be conducted using
concentrations that are compatible with cell survival and proliferation. For the MLA, TG 490 now clearly
articulates that only the Relative Total Growth (RTG), originally defined by Clive and Spector (1975),
should be used as the measure for cytotoxicity. RTG was developed to take into consideration the relative
(to the negative control) cell growth of the treated cultures during the treatment and expression periods,
and the cloning efficiency at the time of mutant selection. For the other in vitro gene mutations assays
(TK6, Hprt and xprt) the relative survival (RS) should be used. RS is the relative cloning efficiency of
cells plated immediately after treatment and corrected to include any cell loss during treatment. That is, RS
should not be based solely on the plating efficiency of those cells that survive the treatment. The
appropriate calculations to correct for cell loss during treatment are included in the TGs. In addition, for
assays using RS as the measure of cytotoxicity, the cells used to determine the cloning efficiency
immediately after treatment should be a representative sample from each of the respective untreated and
treated cell cultures. For the in vitro gene mutation assays, if the maximum concentration is based on
cytotoxicity, the highest concentration should aim to achieve between 20 and 10% RTG for the MLA, and
between 20 and 10% RS for the TK6, Hprt and xprt assays. TG 490 (for the MLA and TK6 assays)
indicates that, care should be taken when interpreting positive results found only between 20 and 10%
RTG/RS, and a result would not be considered positive if the increase in MF occurred only at or below
10% RTG/RS. TG 476 (for the Hprt and xprt assays) indicates that care should be taken when interpreting
positive results only found at 10% RS or below.

ENV/JM/MONO(2016)33/REV1
24
4.1.3 Selection of highest concentration tested for poorly soluble and/or non-cytotoxic chemicals
67. TG 471 was not updated in the current round of revisions. Therefore, there are no new
recommendations for the Ames test and the top concentration for the Ames test is 5000 µg/plate in the
absence of cytotoxicity at lower concentrations or problems with solubility
68. In this current round of revisions of the in vitro TGs, new recommendations are made for
chemicals that are poorly soluble (unable to reach the recommended top concentration or cytotoxicity
without using concentrations that are not soluble in the test culture) and/or non-cytotoxic. For poorly
soluble test chemicals that are not cytotoxic at concentrations below the lowest insoluble concentration,
and even if cytotoxicity occurs above the lowest insoluble concentration, it is required to test at only one
concentration producing turbidity, or with a visible precipitate, because artefactual effects may result from
the precipitate. Turbidity, or a precipitate visible by eye, or with the aid of an inverted microscope, should
be evaluated at the end of the treatment with the test chemical. Although it is not specifically included in
the TGs, care should be taken in interpreting a positive result that is only seen at the precipitating
concentration.
69. Previously, the recommended top concentration, in the absence of cytotoxicity/solubility issues,
was 10 mM or 5000 µg/ml (whichever is lower). The 10 mM limit was defined originally as a limit low
enough to avoid artefactual increases in chromosome damage and/or mutations due to excessive osmolality
and appeared high enough to ensure detection (Scott et al., 1991). Based on data from a number of
independent reports (Brunton et al. , 2002; Kirkland et al., 2007, 2008; Parry et al., 2010; Kirkland and
Fowler, 2010; Morita et al., 2012), there was unanimous agreement during the recent OECD TG revision
discussions that the top concentration could be lowered. The reduction should result in an improvement of
the specificity of the tests without losing sensitivity. An analysis of the data set generated by Parry et al.
(2010) suggests that 10 mM is still required to detect biologically relevant effects from lower molecular
weight non-cytotoxic chemicals, and that test sensitivity at 10 mM is more similar to 2000 than to 5000
µg/ml (Brookmire et al., 2013). Based on extensive discussion, the decision was made that if toxicity and
solubility are not limiting factors, the combination of 10 mM or 2000 µg/ml, whichever is lower,
represents the best balance between mM and µg/ml concentrations. [Note: these limits differ from those
published by the ICH (ICH, 2011)]. A document was prepared that details the analysis that was conducted
and provides the rationale for this new recommendation for top concentration (in the absence of
cytotoxicity or issues of solubility; see Appendix A).
70. However, when the composition of the test chemical is not defined [e.g. chemical of unknown or
variable composition, complex reaction products, biological materials (i.e. UVCBs), environmental
extracts, complex mixtures of incompletely known composition], the top concentration in the absence of
sufficient cytotoxicity may need to be higher (e.g. 5 mg/ml) to increase the concentration of each of the
components.
4.1.4 Treatment duration and sampling time
71. The treatment durations and sampling times for each of the in vitro assays is clarified in the TGs.
For both the chromosomal aberration and micronucleus assays, the cells should be exposed for 3 to 6 hours
without and with metabolic activation. The cells should be sampled for scoring at a time that is equivalent
to about 1.5 normal cell cycle lengths after the beginning of treatment for the chromosomal aberration
assay, and 1.5 to 2.0 normal cell cycle lengths after the beginning of treatment for the micronucleus assay.
In addition, an experiment should be conducted in which cells should be continuously exposed without
metabolic activation until they are sampled at a time equivalent to about 1.5 normal cell cycle lengths for
the chromosomal aberration assay and 1.5 to 2.0 normal cell cycle lengths for the micronucleus assay. The
reason for the difference in sampling times for chromosomal aberration and micronucleus analysis is that
more time is needed for the cells to divide in order to see micronuclei in the daughter cells. In addition the

ENV/JM/MONO(2016)33/REV1
25
in vitro micronucleus TG (487) permits the application of extended sampling times if it is known, or
suspected, that the test chemical affects the cell cycling time (e.g. when testing nucleoside analogues).
Sampling times may be extended by up to a total 3.0 to 4.0 cell cycle lengths after the beginning of
treatment, but care should be taken to ensure that the cells are still actively dividing during the extended
sampling time.
72. The gene mutation assays have different recommendations depending upon the locus used. For
assays using the Hprt or gpt gene, TG 476 indicates that 3 to 6 hours of exposure (both with and without
metabolic activation) is usually adequate. For the TK gene (TG 490), 3 to 4 hours of exposure (both with
and without metabolic activation) is usually adequate. There is a new recommendation for the MLA that if
the short-term treatment yields negative results and there is information suggesting the need for a longer
treatment (e.g. nucleoside analogs or poorly soluble chemicals) that consideration should be given to
conducting the test with a longer treatment (i.e. 24 hours without S9). Consistent with the 1997 version of
TG 476, there is, however, no requirement for the MLA that the longer treatment be routinely conducted if
the short treatment is negative; note that this differs from the ICH recommendation (ICH, 2011). Following
treatment, the newly induced gene mutations require time for the key enzyme levels (HPRT, XPRT or TK)
to decline before they can be successfully recovered as selective agent resistant colonies. Therefore, the
cells are cultured for a period of time that has been shown to provide for optimal phenotypic expression.
For both Hprt and xprt mutants the recommendation is to allow a minimum of 7 to 9 days post treatment
for expression. Newly induced TK mutants express much faster than Hprt or xprt mutants and because the
small colony/slow growing mutants have doubling times much longer than the rest of the cell population,
their mutant frequency actually declines once they are expressed. Therefore, it is important that the
recommended expression periods of 2 days (post treatment) for the MLA and 3 to 4 days (post treatment)
for TK6 are followed.
4.1.5 Concentration selection and minimum number of test concentrations/cultures
73. The revised/new in vitro TGs include updated recommendations on the selection and minimum
number of test cultures meeting the acceptability criteria (appropriate cytotoxicity, number of cells,
appropriate background frequency, etc) that should be evaluated. There is also additional guidance
identifying situations where it may be advisable to use more than the minimum number of concentrations.
The decision was made to continue to recommend at least 3 analysable test concentrations for the in vitro
cytogenetic assays, and four for the in vitro gene mutations assays. For all assays, the solvent and positive
control cultures are to be included in addition to the minimum number of test chemical concentrations. It is
now recommended that, while the use of duplicate cultures is advisable, either replicate or single treated
cultures may be used at each concentration tested provided the same total number of cells are scored in the
cytogenetic assays for either single or duplicate cultures. For the cytogenetic assays (as discussed further in
Section 4.3) the most important point is that the total number of cells scored at each concentration should
provide for adequate statistical power. Therefore, the results obtained for replicate cultures at a given
concentration should be reported separately, but they can be pooled for data analysis. Combining data
from the duplicate cultures is particularly relevant for cytogenetic assays where it is important to score the
recommended number of cells (either in the single or between the duplicate cultures). For test chemicals
demonstrating little or no cytotoxicity, concentration intervals of approximately 2 to 3 fold will usually be
appropriate. Where cytotoxicity occurs, concentrations should be selected to cover the cytotoxicity range
from that producing the top level of cytotoxicity recommended for the particular assay (see Section 4.1.2)
and including concentrations at which there is moderate to little or no cytotoxicity. Many test chemicals
exhibit steep concentration response curves. Accordingly, in order to cover the whole range of cytotoxicity,
or to study the concentration response in detail, it may be necessary to use more closely spaced
concentrations and more than 3 or 4 concentrations. It may also be useful to include more than 3 or 4
concentrations, particularly when it is necessary to perform a repeat experiment.

ENV/JM/MONO(2016)33/REV1
26
4.1.6 Metabolic Activation
74. While some chemicals are reactive and able to directly interact with the DNA and to exert their
genotoxic and/or mutagenic effects, many need to be metabolised and transformed into the reactive
metabolites that interact with DNA. Unfortunately, most commonly used cell lines lack the ability to
metabolise chemicals. The most commonly used activating system is the S9 fraction prepared from the
homogenised livers of rats pre-treated with PCBs, or other agents, which induce the P450 mixed function
oxidase (“phase I”) system. This practice arose due to the prevalence of studies available in the 1970s
suggesting that oxidative metabolism of pro-mutagens to metabolites capable of electrophilic covalent
modification of DNA was the major source of concern. In the absence of practical alternatives, this
remains the most common approach, particularly when screening chemicals for which there are no
preliminary data on which to base an alternative approach. Preparation of S9 liver homogenates from other
species is possible. Previously in vitro screening for genetic toxicity was commonly performed using
mouse or hamster S9, which substitutes for rat S9 preparations. Human liver S9 preparations are
sometimes used especially in the case of follow-up studies on chemicals with species-specific metabolic
differences, such as aromatic amines (Cox et al., 2016). S9 fractions prepared from homogenates of other
organs have been used, with kidney and lung being the most common reported in the literature (Bartsch et
al., 1982).
75. Metabolism, other than phase I metabolism, is required to metabolise some pro-carcinogens to
the carcinogenic/mutagenic form. For example, phase II sulfonation of phase I oxidation products is
known to activate some aromatic amines and alkenyl benzenes to carcinogenic metabolites. While the
phase II enzymes are present in the S9 fraction, the co-factors required for phase II metabolism are
generally not added because phase II metabolism is known to transform many phase I metabolites into
non-mutagenic metabolites. Moreover, there are no widely accepted protocols for studying the
genotoxicity of the products of other metabolic pathways. The use of metabolically competent cells has
shown promise for wider application in the future (Kirkland et al., 2007). The use of non-standard
metabolic systems is always appropriate provided scientific justification and appropriate controls are used.
4.2 Issues specific to in vivo TGs
4.2.1 Dose Selection
76. Measurement of toxicity is used for two objectives: (1) to better define the doses to be used; and
(2) to demonstrate sufficient exposure of the target tissues.
4.2.1.1 Range-finding study
77. Dose levels should be based on the results of a dose range-finding study measuring general
toxicity that is conducted by the same route of exposure and the same duration which will be used in the
main experiment, or on the results of pre-existing sub-acute toxicity studies. Any dose range-finding study
should be performed with due consideration to minimising the number animals used. Chemicals with
specific biological activities at low non-toxic doses (such as hormones and mitogens), and chemicals that
exhibit saturation of toxicokinetic properties may be exceptions to the dose-setting criteria and should be
evaluated on a case-by-case basis. The dose levels selected should cover a range from little or no toxicity
up to the Maximum Tolerated Dose (MTD).
4.2.1.2 Maximum Tolerated Dose (MTD)
78. When toxicity is the limiting factor, the top dose is usually the MTD, which is defined as the
highest dose that will be tolerated without evidence of study-limiting toxicity such that higher dose levels,
based on the same dosing regimen, would be expected to produce lethality or evidence of pain, suffering or
distress necessitating humane euthanasia (OECD, 2000). The MTD is established in range-finding studies

ENV/JM/MONO(2016)33/REV1
27
by measuring clinical effects and mortality, but it can also be identified from other toxicity studies in the
same animal strain. In keeping with the 3Rs principles, animal use in determination of the MTD should be
minimised; accordingly, a tiered range-finding study is recommended. The dose finding study should start
with the lowest dose in a pre-selected core dose range (Fielder et al 1992). If the MTD is not determined
with this first group of animals, a further group of animals should be exposed to a higher, or lower, dose
depending on the clinical effects of the first dose. This strategy should be repeated until the appropriate
MTD is found. Animals should be monitored for clinical signs of distress and excess toxicity, and
identified animals should be euthanatised prior to completion of the test period in this, and all other, phases
of the complete study (OECD, 2000).
4.2.1.3 Limit Dose
79. If toxicity from dose-finding investigations, or existing data from related animal strains, indicate
no observable toxicity, and if genetic toxicity is not expected based on data from in vitro genetic
toxicology studies, or structurally related chemicals, the limit dose is 2000 mg/kg bw/day for a treatment
period of less than 14 days, and 1000 mg/kg bw/day for a treatment period of 14 days or more. For certain
types of test chemicals covered by specific regulations (e.g. human pharmaceuticals) these limits may vary.
80. Furthermore, for TGs 474, 475, 486, and 488 the use of a single treatment at the limit dose (rather
than a full study using 3 dose levels) may be considered for chemicals meeting the above-mentioned non-
toxicity criteria. The single limit dose provision was retained in these revised in vivo TGs in order to strike
a balance between the need to prevent false negative results and reduce the number of animals used. This
provision does not include TGs 478, 483, and 489 for which the full 3-dose regimen applies.
4.2.1.4 Dosing and route of administration
81. In general, the anticipated route of human exposure should be used; however, other routes of
exposure (such as drinking water, subcutaneous, intravenous, topical, inhalation, intratracheal, dietary, or
implantation) may be acceptable where they can be justified. It should be noted that intraperitoneal
injection is specifically listed as not recommended in the revised TGs because it is not a physiologically
relevant route of human exposure, and should only be used with specific scientific justification, e.g. to
obtain historical positive control data. The maximum volume of liquid that can be administered by gavage
or injection at one time depends on the size of the test animal. The volume should not normally exceed 1
mL/100g body weight (note: this limitation is not mentioned in TG 488) except in the case of aqueous
solutions where a maximum of 2 mL/100g may be used. In rare cases, the use of volumes greater than this
may be appropriate and should be justified. Except for irritating or corrosive chemicals, which will
normally reveal exacerbated effects at higher concentrations, variability in test volume should be
minimised by adjusting the concentration to ensure a constant volume at all dose levels.
4.2.2 Proof of exposure (bioavailability)
82. One of the more challenging issues in in vivo genetic toxicology testing is to judge whether the
target tissues have received sufficient exposure when negative results have been obtained. Convincing
evidence is required in order to conclude that sufficient exposure to a tissue (i.e. bioavailability) has been
obtained to justify the conclusion that the test chemical is non-genotoxic or non-mutagenic in that test.
83. For studies investigating genotoxic effects in the blood, bone marrow, or other well-perfused
tissues, indirect evidence of target tissue exposure is generally sufficient to infer tissue exposure. Examples
are absorption, distribution, metabolism, and excretion (ADME or toxicokinetic) data obtained from
previous or subsequent studies. However, due caution should be applied when interpreting clinical signs as
indicators of systemic exposure. In addition, due consideration should be given to the possibility that short-
lived metabolites may not reach the tissue being investigated, even when the chemical or metabolites are
present in the circulatory system (Cliet et al., 1993). In such cases, it may be necessary to determine the

ENV/JM/MONO(2016)33/REV1
28
presence of test chemical and/or metabolites in samples of the target tissue(s) being studied. Consequently,
without the demonstration of bioavailability the value of a negative test is limited. Furthermore, if there is
evidence that the test chemical(s), or its metabolite(s) will not reach the target tissue it is not appropriate to
use the particular in vivo test. It should be noted that for short-lived reactive metabolites that initiate
mutagenicity/genotoxicity, it may be almost impossible to determine whether the metabolite can enter the
target tissue in reactive form or detoxified form. In this context “target tissue” refers to the tissue in which
genotoxicity is being measured in a particular test guideline. Prediction of genotoxicity in specific tissues
beyond those in which measurements are made is beyond the intended use of these TGs.
84. Direct evidence of target tissue exposure may be obtained from signs of toxicity in the target
tissue, from toxicokinetic measurements of the chemical or its metabolites in the tissue, or evidence of
DNA adducts. For the new TG 489 (comet assay), histopathological changes are considered a relevant
measure of tissue toxicity. Changes in clinical chemistry measures, e.g. aspartate aminotransferase (AST)
and alanine aminotransferase (ALT), can also provide useful information on tissue damage and additional
indicators such as caspase activation, terminal deoxynucleotidyl transferase dUTP nick end labeling
(TUNEL) stain, Annexin V stain, etc. may also be considered. However, there are limited published data
where these indicators have been used for in vivo studies to measure tissue exposure.
4.2.3 Tissue selection, duration of treatment and sampling time
85. The treatment duration is dependent on the requirements and limitations of each test endpoint, as
well as the relationship to the intended, or presumed, exposure of the test chemical, if there is a choice of
treatment duration in the TG. Appendix B shows the durations of treatment and sampling times for the in
vivo tests (other feasible regimens can be used if justified scientifically). In selecting exposure duration, it
should be noted that gene mutations in transgenic animals could accumulate over time because the genes
are “neutral”. That is, the mutant cells are at neither a selective advantage nor a disadvantage. For the
other endpoints, including chromosomal aberrations, micronucleus formation (except as noted in Section
4.2.4), and DNA damage (comet), most events are either repaired or eliminated through apoptosis.
Therefore, they do not accumulate over time and must be measured shortly after the last test chemical
administration. For such endpoints, even when measured in experiments with chronic exposure, most
events that are scored are those resulting only from the recent exposure and not the full duration of
exposure.
4.2.3.1 Chromosomal aberrations and micronuclei (TG 475, TG 474, TG 483)
86. The selection of tissues for analysis of somatic chromosomal aberrations or micronuclei is fairly
limited. Currently there are only test guidelines available for effects induced in the bone marrow that are
subsequently detected in the bone marrow per se, or in peripheral blood. Methods for measurement of
micronucleus induction in other tissues are being developed, but are not currently described in these TGs
(e.g. Uno 2015a and b).
4.2.3.2 Transgenic Rodent Somatic and Germ Cell Gene Mutation Assays (TG 488)
87. Mutations in transgenic rodents can be studied in any tissue from which sufficient DNA can be
extracted. The rationale for selection of tissue(s) to be analysed should be defined clearly. It should be
based upon the reason for conducting the study together with any existing ADME, genetic toxicity,
carcinogenicity or other toxicity data for the test chemical under investigation. Important factors for
consideration include the route of administration [based on likely human exposure route(s)], the predicted
tissue distribution and absorption, and the role of metabolism and the possible mechanism of action. Site of
contact tissues relevant to the route of administration should be considered for analysis. If studies are
conducted to follow up carcinogenicity studies, target tissues for carcinogenicity should be included. In
order to reduce the need for additional animal experiments, it is recommended that a number of tissues of

ENV/JM/MONO(2016)33/REV1
29
potential future interest (including germ cells), in addition to those of initial interest, should be collected
and frozen for later analysis.
88. Since the induction of gene mutations is dependent on cellular proliferation, a suitable
compromise for the measurement of mutant frequencies in both rapidly and slowly proliferating tissues is
28 consecutive daily treatments with sampling 3 days after the final treatment (i.e. 28+3 protocol);
although the maximum mutant frequency may not manifest itself fully in slowly proliferating tissues under
these conditions. It is important to note that TG 488 states that if slowly proliferating tissues are of
particular importance, then a later sampling time of 28 days following the 28 day administration period
may be more appropriate when justified (Heddle et al., 2003; Thybaud et al., 2003). In such cases, the later
sampling time would replace the 3 day sampling time.
89. TG 488 notes that the 28+3 protocol may not be optimal for detection of mutations in
spermatogonial stem cells, but can provide some coverage of cells exposed across the majority of phases of
germ cell development, and may be useful for detecting some germ cell mutagens. Therefore, for tests
focused on somatic tissues, it is recommended that, where possible, seminiferous tubules and spermatozoa
from the cauda epididymis also be collected and stored in liquid nitrogen for potential future use.
90. Accordingly, studies designed specifically to detect mutagenic effects in male germ cells require
additional considerations. In such cases when spermatozoa from the cauda epididymis, and seminiferous
tubules from the testes are collected, care should be taken to ensure that the treatment-sampling times are
appropriate and allow the detection of effects in all germ cell phases. Currently, TG 488 specifies that (in
addition to the 28+3 protocol) a 28+49 regimen (mouse) or a 28+70 regimen (rat), should be included to
provide the optimal time for collecting spermatozoa from the cauda epididymis that were stem cells at the
time of treatment. This requirement doubles the number of animals required. Accordingly, research is now
underway to establish a suitable single, compromise sampling time, such as the 28+28 regimen described
above for slowly proliferating tissues that would be suitable for both somatic and male germline tissues. It
is expected that this research will support a current OECD project directed at updating TG 488 in the near
future.
4.2.3.3 in vivo Mammalian Alkaline Comet Assay (TG 489)
91. DNA damage can be studied in most tissues using the comet assay provided that good quality
cells or nuclei can be prepared. Proliferation is not required to reveal effects in the comet assay; otherwise,
the discussion of tissue selection in the previous section also applies to the comet assay. However, care
should be taken, and ADME parameters considered, when selecting the sampling time(s) since the DNA
damage is rapidly repaired. A sampling time of 2-6 h after the last treatment for two or more treatments, or
at both 2-6 and 16-26 h after a single administration are specified in TG 489. It should be noted that there
is no consensus among experts about the validity of the use of tissue, or cell, suspensions that have been
frozen, rather than analysed immediately after necropsy (Speit 2015). It is thus described in Annex 3 of the
TG which presents the current limitations of the assay. This annex indicates that if used, the laboratory
should demonstrate competency in freezing methodologies and confirm acceptable low ranges of % tail
DNA in target tissues of vehicle treated animals, and that positive responses can still be detected. In the
literature, the freezing of tissues has been described using different methods. However, currently there is
no agreement on how to best freeze and thaw tissues, and how to assess whether a potentially altered
response may affect the sensitivity of the test.
4.2.4 Combination/integration of tests
92. There is a worldwide interest in reducing the use of experimental animals. In the spirit of the 3Rs
principles, the combination of two or more endpoints in a single genetic toxicology study is strongly

ENV/JM/MONO(2016)33/REV1
30
encouraged whenever possible, and when such combinations can be scientifically justified. Examples of
such test combinations are: 1) the in vivo bone marrow micronucleus test and liver comet assay (Hamada et
al., 2001, Madrigal-Bujaidar et al., 2008, Pfuhler et al., 2009, Bowen et al., 2011); 2) genetic toxicology
studies and repeated dose toxicity studies (Pfuhler et al., 2009; Rothfuss et al., 2011); and 3) the bone
marrow micronucleus test and the transgenic rodent gene mutation assay (Lemieux et al., 2011).
93. Ideally, the assays being combined should have similar treatment and sampling regimens (see
Appendix B). There are major considerations concerning the compatibility of test combinations with
respect to these factors: 1) the effective length of the administration time; 2) the longevity of the genetic
damage; and 3) the sampling time for the assays selected. For example, the micronucleus assay detects
only damage that occurs in the 24 to 72 hours prior to tissue sampling if PCEs are examined, so, when
combined with an assay using a 28 day sub-chronic administration time, the PCE/micronucleus assay will
detect only micronuclei induced in the last 72 hours of the 28-day treatment. However, the incidence of
NCEs sampled after a 28 day administration period in mouse peripheral blood provides a steady state
index of average damage during the full treatment period (Witt et al., 2000). Accordingly, the
NCE/micronucleus assay can be more readily incorporated into other assays using a 28 day treatment
period.
94. To combine the in vivo micronucleus assay with the TGR assay, two sampling times would be
needed to meet the sampling requirements of the standalone MN and TGR assays. While this can be
accomplished by drawing blood at 48 hour post-treatment for the flow cytometry MN assay and then
sampling the tissues from the animals at 72 hour for the TGR assay, it still does not overcome the issue of
the (arguably small) difference in the total effective dose delivered for the MN assay vs. the transgene
mutation assay. A better alignment of doses can be accomplished when all assays in a test combination
have the same effective “treatment window” and “endpoint enumeration window”, such as would be
accomplished with the MN assay and the comet assay. The possibility also exists to combine non-
genotoxicity assays, such as the Repeated Dose Oral Toxicity Study (TG 407), with genetic toxicology
tests (preferably with the same treatment protocol), but compromises with respect to treatment and
sampling times will still have to be made, since the oral toxicity test ends on day 28 and genetic toxicity
tests require a sampling time after day 28. Recommendations have also been made to integrate the
Dominant Lethal Test (TG 478) with the Combined Repeated Dose Toxicity Study with the Reproduction/
Developmental Toxicity Screening Test (TG 422; Yauk et al., 2015). In summary, while there is a residual
compatibility issue with respect to sampling times of most assays, this issue could be overcome if minor
changes in the sampling regimen of combined assays can be made that would not adversely affect the
sensitivity of these assays.
4.2.5 Use of one or both sexes
95. While there have been studies showing isolated examples of sex differences, in general, the
response of genetic toxicology tests is similar between male and female animals (Hayashi et al., 1994;
Ding et al., 2014) and, therefore, most studies using TG 474 and TG 475 could be performed in either sex.
While TG 488 can be performed using either sex, males are used if germ cell effects are a consideration.
Historically, most comet assay data have been collected using only males. Accordingly, there are little, if
any, data examining sex differences in comet response. Data demonstrating relevant differences between
males and females (e.g. differences in systemic toxicity, metabolism, bioavailability, bone marrow toxicity,
etc.) observed in a range-finding study would encourage the use of both sexes. When a genetic toxicology
test is incorporated into a test in which both sexes are being exposed, an increased statistical power can be
gained by analysing tissue from both sexes. Where human exposure to chemicals may be sex-specific, as
for example with some pharmaceuticals, the test should be performed with the appropriate sex.

ENV/JM/MONO(2016)33/REV1
31
4.2.5.1 Factorial design
96. In cases where both sexes are used, it may be advantageous to use a factorial design for the study,
because the analysis will identify interaction effects between sex and treatment, and, if there are no
interaction effects, it will provide greater statistical power. TGs 474, 475, and 489 provide a detailed
description for use and interpretation of factorial designed studies in Annex B of these TGs.
4.2.6 Age range of animals
97. The starting age range of animals (i.e. rodents) varies according to the TG. For the in vivo MN
(TG 474), in vivo CA (TG 475), and in vivo comet (TG 489) assays, it is 6 to 10 weeks. For the TGR assay
(TG 488) and the spermatogonial CA (SCA) assay (TG 483), it is 8 to 12 weeks to facilitate access to
sufficient numbers of transgenic animals from relatively small breeding colonies (TGR), and allow time to
reach sexual maturity (TGR and SCA). The Dominant Lethal Test (TG 478) specifies healthy and sexually
mature male and female adult animals.
4.3 Issues common to in vitro and in vivo TGs
4.3.1 Experimental design and statistical analysis considerations
98. As a part of the TG revisions, an extensive evaluation was undertaken to analyze how the
selection of specific parameters impact the overall ability of the various tests to detect induced genetic
damage. In particular, this analysis better defined an appropriate approach to using spontaneous
background frequencies both for individual experiment acceptability and data interpretation, and to
understand the impact of assay-specific background frequencies on the statistical power of the assay. This
analysis was used to develop the new recommendations for the number of cells to be treated for the in vitro
gene mutation assays and the number of cells to be scored for the cytogenetic tests (both in vitro and in
vivo). A discussion of this analysis can be found in OECD documents (OECD, 2014f).
99. Recommendations were included in the latest revisions to the TGs to discourage over-reliance on
p-values associated with the statistical significance of differences found by pair wise comparisons.
Statistical significance based upon a particular p-value is relevant, but is only one of the criteria used to
decide whether to categorise a result as positive or negative. For example, the confidence intervals around
the means for the controls and the treated cultures/animals should also be evaluated and compared within
an individual experiment.
100. One of the goals for the TG revisions was to include recommendations that would insure that test
results deemed to be positive would be based on biologically relevant responses. Initially it was proposed
that in the revised OECD genetic toxicology guidelines, studies should be designed to detect a doubling
(i.e. 2-fold increase) in the treated group responses over the negative control level. However, subsequent
discussions focused on the fact that the sample sizes needed to detect a doubling will depend upon the
background level; for example, a doubling from 1% to 2% is a smaller absolute change than one from 3%
to 6%. Furthermore, it was recognised that defining the level of response required to achieve biological
relevance, therefore, requires an appreciation of the nature of the endpoint, consideration of the
background (negative control) incidence, and whether an absolute or relative difference versus negative
control should be considered. These considerations are different for each of the assays and have been taken
into account in the new recommendations found in the individual TGs.
4.3.2 Size of samples and statistical power: in vitro tests
101. The TGs were evaluated, and in some cases revised, to increase the power of the various assays
to detect biologically significant increases. For the in vitro gene mutation studies, where the cell is the
experimental unit, power calculations showed that designs with relatively small numbers of cells per

ENV/JM/MONO(2016)33/REV1
32
culture had low power to detect biologically relevant differences. For the cytogenetic tests, an acceptable
level of statistical power (conventionally 80%) to detect 2 to 3 fold changes would only be achievable if
the number of cells scored were increased appreciably in some tests. For revisions to the recommendations
for the in vitro cytogenetic tests, consideration was given to both the ideal number of scored cells, and to
the technical practicalities of actually scoring that number of cells, particularly for the chromosome
aberration test.
102. TG 473: in vitro Mammalian Chromosomal Aberration Test. The 1997 version of TG 473
indicated that at least 200 well-spread metaphases should be scored and that these could be equally divided
among the duplicates (when duplicates were used), or from single cultures. Based on a desire to increase
the power of the assay, yet not make the assay too technically impractical, the number of cells to be scored
was increased in this revision to at least 300 metaphases to be scored per concentration and control. As
before, when replicate cultures are used the 300 cells should be equally divided among the replicates.
When single cultures are used per concentration at least 300 well spread metaphases should be scored in
the single culture. Scoring 300 cells has the advantage of increasing the statistical power of the test and, in
addition, zero values will be rarely observed (expected to be only 5%) (OECD, 2014f). It should be noted
that the number of metaphases scored can be reduced when high numbers of cells with chromosome
aberrations are observed and the test chemical is considered to be clearly positive.
103. TG 487: in vitro Mammalian Cell Micronucleus Test. Based on the statistical power
evaluations, a decision was made not to alter the recommendations for scoring from those made in the
2010 version of TG 487. Therefore, for the in vitro micronucleus test, micronucleus frequencies should be
analysed in at least 2000 target cells per concentration and control, equally divided among the replicates,
when replicates are used. In the case of single cultures per dose at least 2000 target cells per concentration
should be scored in the single culture. If substantially fewer than 1000 target cells per culture (for duplicate
cultures), or 2000 (for single culture), are available for scoring at each concentration, and if a significant
increase in micronuclei is not detected, the test should be repeated using more cells, or at less cytotoxic
concentrations, whichever is appropriate. When cytoB is used, a CBPI or an RI should be determined to
assess cell proliferation using at least 500 cells per culture
104. TG 476 and TG 490: in vitro Mammalian Cell Gene Mutation Tests. In the 1997 version of
TG 476, a general recommendation was made concerning the number of cells that should be used in all of
the in vitro gene mutation assays. The TG indicated that the minimal number of viable cells surviving
treatment, and used in each stage of the test, should be based on the spontaneous mutant frequency and that
number of cells should be at least ten times the inverse of the spontaneous mutant frequency. Furthermore,
at least 1 million cells were recommended. The revision to TG 476 and the new TG 490 continue to
recommend that the minimum number of cells used for each test (control and treated) culture at each stage
in the test should be based on the spontaneous mutant frequency. Emphasis is now, however, placed on
assuring that there is a minimum number of spontaneous mutants maintained in all phases of the test
(treatment, phenotypic expression and mutant selection). The expert workgroup chose to use the
recommendation of Arlett et al., (1989) which advocates, as a general guide, the treatment and passage of
sufficient numbers of cells in each experimental culture to maintain at least 10 but ideally 100 spontaneous
mutants.
105. TG 476: in vitro Mammalian Cell Gene Mutation Tests using the hprt and xprt genes. For the
HPRT assay, the spontaneous mutant frequency is generally between 5 and 20 x10-6
. For a spontaneous
mutant frequency of 5 x10⁻⁶
and to maintain a sufficient number of spontaneous mutants (10 or more), even
for the cultures treated at concentrations that cause 90% cytotoxicity during treatment (10% RS), it would
be necessary to treat at least 20 x 106 cells. In addition a sufficient number of cells (but never less than 2
million) must be cultured during the expression period and plated for mutant selection.
ENV/JM/MONO(2016)33/REV1
33
106. TG 490: in vitro Mammalian Cell Gene Mutation Tests Using the Thymidine Kinase Gene.
For the MLA, the recommended acceptable spontaneous mutant frequency is between 35-140 x 10-6
(agar
version) and 50-170 x 10-6
(microwell version). To have at least 10 and ideally 100 spontaneous mutants
surviving treatment for each test culture, it is necessary to treat at least 6 x 10⁶ cells. Treating this number
of cells, and maintaining sufficient cells during expression and cloning for mutant selection, provides for a
sufficient number of spontaneous mutants (10 or more) during all phases of the experiment, even for the
cultures treated at concentrations that result in 90% cytotoxicity (as measured by an RTG of 10%) (Lloyd
and Kidd, 2012; Mei et al., 2014; Schisler et al., 2013).
107. For the TK6, the spontaneous mutant frequency is generally between 2 and 10 x 10-6
. To have at
least 10 spontaneous mutants surviving treatment for each culture it is necessary to treat at least 20 x 106
cells. Treating this number of cells provides a sufficient number of spontaneous mutants (10 or more) even
for the cultures treated at concentrations that cause 90% cytotoxicity during treatment (10% RS). In
addition a sufficient number of cells must be cultured during the expression period and plated for mutant
selection (Honma and Hayashi 2011).
4.3.3 Size of samples and statistical power: in vivo tests
108. Sample sizes were also increased in the in vivo tests to improve the power to detect increases.
Statistical power increases with the number of cells scored and/or the number of animals per group
(OECD, 2014f). The challenge was to select these numbers to best achieve appropriate statistical power
while keeping cell numbers within practical limits, and avoiding excessive use of animals. With this goal
in mind, most in vivo genetic toxicology TGs have been revised to achieve enhanced statistical power. For
the cytogenetic tests, an acceptable level of statistical power (conventionally 80%) to detect 2 to 3 fold
changes would only be achievable if the number of cells scored were increased appreciably in some tests.
109. TG 474: Mammalian Erythrocyte Micronucleus Test. The previous version of this TG required
the scoring of 2000 or more cells per animal (5 animals per group). Statistical analyses (Kissling et al.,
2007; OECD, 2014f) have shown that in vivo designs for micronuclei with n = 5 animals have the power to
detect 2 to 3-fold effects with 80% power based upon counts of about 4000 cells per animal when the
background incidence is relatively high (0.1% and higher). Accordingly, the revised TG 474 now
recommends at least 4000 cells per animal. The power increases with higher background control
incidences. However, larger sample sizes, either as more animals and/or many more cells, would be needed
to have sufficient power to detect a 2-3 fold incidence when the background incidence is lower (i.e.
<0.1%).
110. TG 475: Mammalian Bone Marrow Chromosome Aberration Test. For similar statistical
reasons, the minimum number of analyzed cells has been increased from 100 to 200 cells per animal with 5
animals per group from the previous version of this TG. This sample size is sufficient to detect at least
80% of chemicals that induce a 2-fold increase in aberrant cells over the historical control level of 1.0%
and above at the significance level of 0.05 (Adler et al.,1998b).
111. TG 478: Rodent Dominant Lethal Test. The original version of TG 478 contained minimal
information on the conduct of this test. The revised TG 478 specifies that the number of males per group
should be predetermined to be sufficient (in combination with the number of mated females at each mating
interval) to provide the statistical power necessary to detect at least a doubling in dominant lethal
frequency (e.g. about 50 fertilised females per mating; formerly 30-50). A detailed description of the
recommended statistical analysis is now provided in the TG.
112. TG 483: Mammalian Spermatogonial Chromosomal Aberration Test. The minimum number of
analysed cells in TG 483 has also been increased from 100 to 200 cells per animal with 5 animals per
group (Adler et al., 1994).

ENV/JM/MONO(2016)33/REV1
34
113. TG 489: In vivo Mammalian Alkaline Comet Assay. This new TG 489 specifies that for each
sample (per tissue per animal), at least 150 cells (excluding hedgehogs) should be analysed. Scoring 150
cells per animal in at least 5 animals per dose (less in the concurrent positive control) provides adequate
statistical power according to the analysis of Smith et al. (2008).
4.3.4 Demonstration of laboratory proficiency and establishing an historical control database
114. The revised OECD genetic toxicology TGs now include a requirement for the demonstration of
laboratory proficiency. In consideration of the 3Rs, which place constraints on the use of animals, the
recommendations for demonstrating laboratory proficiency are different for in vitro tests, for in vivo cell
somatic tests, and for in vivo germ cell tests. It should be noted that the recommended methods to establish
proficiency do not apply to experienced laboratories that have already been able to do so by building
historical control databases of both positive and negative controls. Also, as a part of demonstrating
proficiency, both initially and over time, the new TGs introduce and recommend the concept of using
quality control charts to assess the historical control databases and to show that the methodology is “under
control” in the individual laboratories (see Section 4.3.5.3 for more information on control charts).
115. In order to establish sufficient experience with the test prior to using it for routine testing, the
laboratory should have performed a series of experiments using reference substances with different
mechanisms of action. Such experiments should indicate that the laboratory can discriminate between
negative and positive chemicals, and detect positive chemicals acting via different mechanisms, and
requiring or not requiring metabolic activation. TGs provide recommendations for the substances that
could be used for each test.
116. For in vitro tests and most in vivo somatic cell assays, a selection of positive (at least two in vivo)
and negative control substances should be investigated under all experimental conditions of the specific
test (e.g. short- and long-term treatments for in vitro assays, as applicable) and give responses consistent
with the published literature. The literature suggests that a minimum of 10 experiments may be necessary
but would preferably consist of at least 20 experiments conducted under comparable experimental
conditions (Hayashi et al., 2011). It is noted that this recommendation appears in most of the Test
Guidelines but is absent from two in vivo Test Guidelines (488 and 489).
117. For in vivo somatic cell TGs wherein multiple tissues can be used (e.g. the in vivo alkaline comet
assay and the transgenic rodent gene mutation assay) proficiency should be demonstrated in each tissue
that is being investigated. During the course of these investigations the laboratory should establish an
historical database of positive and negative control values, as described in Section 4.3.5.3.
118. For the TGR and SCA assays, and the DLT, there is currently no explicit requirement to establish
an historical control database. However, competency should be demonstrated by the ability to reproduce
expected negative and positive control results from published data when conducting any new study. The
positive and negative control literature on the TGR assay has been compiled and is readily available in an
OECD Detailed Review Paper (OECD, 2009); however, since such compiled sources are not available for
the DLT and SCA assays, summaries of negative control data for these assays are presented herein
(Appendices C and D respectively).
119. The negative control values for percent resorptions in the DLT varies widely, depending on the
parental strains used, from 3.3 [(SECxC57BL) F1 x (C3Hx101) F1] to 14.3 [T-Stock x (CH3x101) F1].
Thus, a recommended range for the negative control value cannot be easily identified. Furthermore, some
of the strains shown in Appendix C may not be generally available; therefore, laboratories should choose
an available strain with stable negative control variability when planning to perform the DLT.

ENV/JM/MONO(2016)33/REV1
35
120. The negative control values for the percent cells with chromosomal aberrations in the SCA assay
also varies among studies (Appendix D). Based on the data in this Table, TG 483 states that the
recommended range for negative controls is >0 to ≤ 1.5 % of cells with chromosomal aberrations.
4.3.5 Concurrent negative and positive controls
121. In addition to establishing laboratory competence, negative and positive historical control data
are important for assessing the acceptability of individual experiments, and the interpretation of test data.
In particular, it is necessary to determine whether specific responses fall within or outside the distribution
of the negative control. With the 3Rs principles in mind, the recommendations for positive controls differ
for in vitro and among various in vivo tests.
4.3.5.1 Concurrent negative controls
122. Negative control groups are important for providing a contemporaneous control group for use in
comparisons with the treated groups. This group can also be used to assess whether the experiment is of
acceptable quality by comparison with a set of historical control groups.
123. Negative controls usually consist of cells or animals treated with the solvent or vehicle (i.e.
without test chemical). They should be incorporated into each in vitro and in vivo test and handled in the
same way as the treatment groups. It should be noted that when choosing a solvent or vehicle the decision
should be based on obtaining maximum solubility of the test chemical without interacting with it or test
system.
124. In order to reduce unnecessary animal usage for in vivo tests, if consistent inter-animal variability
and frequencies of cells with genotoxicity are demonstrated by historical negative control data at each
sampling time for the testing laboratory, only a single sampling time for the negative control may be
necessary. Where only a single sampling time is used for negative controls, it should be the first sampling
time used in the study.
4.3.5.2 Concurrent positive controls
125. The inclusion of concurrent positive controls (reference controls/well-known genotoxic
chemicals) is designed to demonstrate the effectiveness of a particular genetic toxicology test on the day it
is performed. Each positive control should be used at a concentration or dose expected to reliably and
reproducibly result in a detectable increase over background in order to demonstrate the ability of the test
system to efficiently detect DNA damage, gene mutations and/or chromosomal aberrations depending on
the test, and in the case of in vitro tests, the effectiveness of the exogenous metabolic activation system.
Therefore, positive control responses (of both direct-acting chemicals and chemicals requiring metabolic
activation) should be observed at concentrations or doses that produce weak or moderate effects that will
be detected when the test system is optimised, but not so dramatic that positive responses will be seen in
sub-optimal test systems, and immediately reveal the identity of the coded samples to the scorer (i.e. for
tests using coded samples).
4.3.5.2.1 In vitro tests
126. For each of the in vitro genetic toxicology tests, positive control substances should be assayed
concurrently with the test chemical. Because in vitro mammalian cell tests for genetic toxicity are
sufficiently standardised, the use of positive controls may be confined to a chemical requiring metabolic
activation. Provided it is done concurrently with the non-activated test using the same treatment duration,
this single positive control response will demonstrate both the activity of the metabolic activation system
and the responsiveness of the test system. Long-term treatment should, however, have its own positive
control, as the treatment duration will differ from the test using metabolic activation. In the case of the in

ENV/JM/MONO(2016)33/REV1
36
vitro micronucleus test, positive controls demonstrating clastogenic and aneugenic activity should be
included. For the gene mutation tests using the TK locus, positive controls should be selected which induce
both large and small colony (i.e. normal and slow-growing) mutants.
4.3.5.2.2 In vivo tests
127. For in vivo tests, a group of animals treated with a positive control substance should normally be
included with each test. In order to reduce unnecessary animal usage when performing a transgenic rodent
gene mutation, micronucleus, bone marrow chromosomal aberration, or spermatogonial chromosomal
aberration test, this requirement may be waived when the testing laboratory has demonstrated proficiency
in the conduct of the test according to the criteria described in the TG for each test. In such cases where a
concurrent positive control group is not included, scoring of “reference controls” (fixed and unstained
slides, cell suspension samples, or DNA samples from the same species and tissues of interest, and
properly stored) must be included in each experiment. These samples can be collected from tests during
proficiency testing or from a separate positive control experiment conducted periodically (e.g. every 6-18
months), and stored for future use. For the dominant lethal test, concurrent positive controls are required
until laboratories have demonstrated proficiency, and then they are not required. Because of insufficient
experience with the longevity of alkali labile DNA sites in storage with the comet assay, concurrent
positive controls are always necessary.
128. Since the purpose of a positive control is primarily to demonstrate that the assay is functioning
correctly (and not to validate the route of exposure to the tested chemical), it is acceptable that the positive
control be administered by a route different from the test chemical, using a different treatment schedule,
and for sampling to occur only at a single time point provided, of course, that an appropriate positive
response is measured in all tissues being sampled. It is, however, important that the same route be used
when measuring site-of-contact effects.
4.3.5.3 Historical control distribution and control charts
129. Historical control data (both negative and positive) should be collected for each test. The
individual Test Guidelines provide recommendations for the specific parameters that should be used for
compilations (e.g. for each species, strain, tissue, cell type, metabolic condition). All control data of each
individual genetic toxicology test, strain etc. during a certain time period (e.g. 5 years), or from the last
tests performed (e.g. the last 10 or 20 tests) should be accumulated to create the historical control data set.
The laboratory should not only establish the historical negative (untreated, solvent/vehicle) and positive
control ranges, but also define the distribution (e.g. Poisson distribution 95% control limits) as this
information will be used for data interpretation. This set should be updated regularly. Any changes to the
experimental protocol should be considered in terms of their impact on the resulting data remaining
consistent with the laboratory’s existing historical control database. Only major changes in experimental
conditions should result in the establishment of a new historical control database where expert judgment
determines that it differs from the previous distribution. Further recommendations on how to build and use
the historical data (i.e. criteria for inclusion and exclusion of data in historical data and the acceptability
criteria for a given experiment) can be found in the literature (Hayashi et al., 2011).
130. According to the majority of the new and revised TGs, laboratories should use quality control
methods, such as control charts. Control charts are plots of data collected over a period of time with
horizontal lines established to define the upper and lower bounds of the range of acceptable values for the
particular assay. Control charts are long-established and widely-used methods for quality control
laboratories to monitor the variability of samples and to show that their methodology is 'under control'
rather than drifting over time. They also provide a visual presentation of the variability within a laboratory,
which can help put any possible treatment-related effects into context. There are many different types of
control charts. Examples are I-charts for plotting individual values, C-charts for plotting count data and

ENV/JM/MONO(2016)33/REV1
37
Xbar-charts for plotting the means of groups of individuals such as the individual units in a negative
control group (OECD, 2014f).
131. Most major statistical software packages (e.g. SAS, SPSS, Stata, Genstat. Minitab, JMP) have
procedures for producing control charts and provide guides for using the procedures. Software specifically
designed for quality control methodology in general is available. The software language R has a package
(qcc) that can produce control charts. In addition there are a number of textbooks describing the methods
(Ryan, 2000, Ryan, 2011, Henderson, 2011, Montgomery, 2005 & Mulllins, 2003). The US National
Institute of Standards and Technology (NIST) has a detailed online description and discussion of the
methodology (http://www.itl.nist.gov/div898/handbook/pmc/pmc.htm). There are also numerous online
discussion groups in areas related to Total Quality Management (TQM), Six-sigma methodology and
Statistical Process Control (SPC) that actively discuss issues in the Quality Assurance/Control field.
4.3.6 Data interpretation and criteria for a positive/negative result
132. In revising the TGs, the expert workgroup gave extensive consideration to providing more
guidance than was given in the previous TGs for interpreting test data. As a result, several new concepts
are included in the revised/new TGs. Prior to considering whether a particular experiment is positive or
negative, it is important to ascertain whether that experiment is properly conducted. Therefore, the revised
TGs clarify the acceptance criteria for each assay. In addition, guidance was developed to provide
recommendations as to what defines a biologically relevant positive result. Previous TGs indicated that
positive responses should be biologically relevant, but did not provide a means to determine biological
relevance. The revised/new TGs include 3 equal considerations when assessing whether a response is
positive or negative. First the test chemical response should be assessed as to whether there is a
statistically significant increase from the concurrent negative controls. Second, the response should be
concentration/dose related. Finally, a new concept, that utilises the historical negative control distributions,
is introduced to provide for assessing biological relevance. For the MLA, (TG 490) the use of the GEF to
define the biological relevance of the response is introduced (see below). It should be noted; however, that
TGs not revised in the current round of revisions (TG 471, TG 485 and TG 486) are not impacted by this
new approach.
4.3.6.1 Individual test acceptability criteria
133. The revised TGs clarify recommendations for individual assay acceptability as follows:
the concurrent negative control is considered acceptable for addition to the laboratory historical
negative control database, and/or is consistent with published norms (depending on the assay);
concurrent positive controls induce responses that are compatible with those generated in the
laboratory’s historical positive control data base, and produce a statistically significant increase
compared with the concurrent negative control;
for in vitro assays, all experimental conditions (based on the recommended treatment times and
including the absence and presence of metabolic activation) were tested unless one resulted in
clear positive results;
adequate numbers of animals/cells were treated and carried through the experiment or scored
(as appropriate for the individual test);
an adequate number of doses/concentrations covering the appropriate dose/concentration range
is analyzable;

ENV/JM/MONO(2016)33/REV1
38
the criteria for the selection of top dose/concentration are consistent with those described in the
individual TGs.
134. Apart from the above criteria, MLA-specific acceptability criteria have been defined based on the
IWGT MLA expert workgroup’s data evaluation for several negative control data parameters (Moore et
al., 2000; 2002; 2003; 2006). Consistent with the general approach to establishing acceptability criteria for
the revised genetic toxicology TGs, these recommendations are based on distributions of a very large
number of experiments from laboratories proficient in the conduct of the MLA. There are also MLA-
specific criteria for positive controls that assure good recovery of both small and large colony mutants. The
specific recommendations (i.e. acceptable ranges for the main parameters) for the MLA are detailed in TG
490.
4.3.6.2 Criteria for a positive/negative result
135. If a genetic toxicity test is performed according to the specific TG, and all acceptability criteria
are fulfilled (as outlined above), the data can be evaluated as to whether the response is positive or
negative. The new TGs recognise it is important that chemicals determined to be positive demonstrate
biologically relevant increases which are concentration/dose related. As with the acceptability criteria, the
assessment of biological relevance takes the distribution of the negative control data into consideration
(e.g. Poisson 95% control limits).
136. For both in vitro and in vivo assays (with the exception of the MLA—see below) a response is
considered a clear positive in a specific test if it meets all the criteria below in at least one experimental
condition:
at least one of the data points exhibits a statistically significant increase compared to the
concurrent negative control;
the increase is concentration- or dose-related at least at one sampling time when evaluated with
an appropriate trend test;
the result is outside the distribution of the historical negative control data (e.g. Poisson-based
95% control limits).
137. A test chemical is considered clearly negative if, in all experimental conditions examined, none
of the above criteria for a positive result are met.
138. Recommendations for the most appropriate statistical methods can be found in the literature
(Lovell et al., 1989; Kim et al., 2000).
139. For the MLA, the IWGT MLA expert workgroup recommendation for determination of a
biologically relevant positive result relies on the use of a predefined induced mutant frequency (i.e.
increase in MF above concurrent control), designated the Global Evaluation Factor (GEF) which is based
on the analysis of the distribution of the negative control MF data from participating laboratories (Moore et
al., 2006). For the agar version of the MLA the GEF is 90 x 10-6
, and for the microwell version of the
MLA the GEF is 126 x 10-6
. Responses determined to be clear positives should also demonstrate a
concentration response (which can be assessed using a trend test).
140. As outlined above, the revised/new TGs provide criteria for results that are clearly positive or
negative. If the response is neither clearly negative nor clearly positive the TGs recommend that expert
judgment be applied. Test results that do not meet all the criteria may also be judged to be positive or
negative without further experimental data, but they need to be evaluated more closely before any final
conclusion is reached. If, after the application of expert judgment, the results remain inconclusive (perhaps

ENV/JM/MONO(2016)33/REV1
39
as a consequence of some limitation of the test or procedure) they should be clarified by further testing,
preferably using modifications of experimental conditions (e.g. other metabolic activation conditions,
length of treatment, sampling time, concentration spacing etc.). In some cases re-examination of the test
results (e.g. counting more cells from archived slides or frozen samples) may resolve the ambiguity.
141. In rare cases, even after further investigations, the data set will preclude a definitive positive or
negative call. Therefore the test chemical response should be concluded to be equivocal (interpreted as
equally likely to be positive or negative).
142. For all of the tests covered in the genetic toxicology TGs, there is no requirement for verification
of a clear positive or negative response.
4.3.7 Chemicals that require specific approaches
143. There are some chemicals, such as nanomaterials, complex mixtures, volatiles, aerosols and
gases, which require special modifications of the TGs in order to: 1) properly characterise the test
chemical; 2) appropriately metabolise the chemical (see paragraphs 74-75), 3) adequately expose the
cells/animals; 4) conduct an adequate test; and 5) properly interpret the test data. Guidance for these
special chemicals is not described in the TGs.
4.3.8 Test batteries, weight of the evidence and interpretation of data
144. The OECD TGs provide recommendations on how to conduct the various genetic toxicology
tests. However, in some cases, regulatory organisations have recommended modifications to specific
guidelines appropriate for specific product types, [e.g. ICH (ICH, 2011)].
145. The OECD TGs do not make any specific recommendations as to which tests to use in a test
battery. Regulatory agencies publish their own recommendations, which should be consulted prior to
initiating testing. Generally, the recommended genetic toxicology test batteries include tests to detect gene
mutations and structural as well as numerical chromosomal damage (aneuploidy) in both in vitro and in
vivo tests; however, more recently, in some jurisdictions the emphasis has been on using only in vitro, and
no, or fewer, well-chosen, in vivo tests.
146. There are publications that provide basic information on using genetic toxicology information for
regulatory decisions (Dearfield and Moore, 2005; Cimino, 2006). In addition there have been expert
workgroup discussions concerning appropriate follow-up testing strategies from chemicals found to be
positive in vitro tests and/or in vivo tests (Dearfield et al., 2011; Thybaud et al., 2007; Thybaud et al.,
2011; Tweats et al., 2007a, b).
147. It is important to emphasise that the results from the different assays should be evaluated in line
with the applicable regulatory test strategy. The amount of data available for a weight of evidence
evaluation will vary enormously, particularly among different product categories. Data-rich packages
prepared for drug or pesticide regulations may permit analyses that would be impossible for chemicals
involving other uses for which less data are available.

ENV/JM/MONO(2016)33/REV1
40
REFERENCES
Adler, I. (1974), “Comparative cytogenetic study after treatment of mouse spermatogonia with
Mitomycin C”, Mutation Research, Vol. 23/3, pp. 369-379.
Adler, I. (1982), “Male germ cell cytogenetics”, in Cytogenetic Assays of Environmental Mutagens,
Editor: TC Hsu, Allanheld Osmun Publishers, Totowa, New Jersey, pp. 249-276.
Adler, I. et al. (1994), “International workshop on standardisation of genotoxicity test procedures”,
Summary report of the working group on mammalian germ cell tests. Mutation Research, Vol. 312, pp.
313-318.
Adler, I. et al. (1995), “Clastogenicity of diepoxybutane in bone marrow cells and male germ cells of
mice”, Mutagenesis, Vol. 10/6, pp. 535-541.
Adler, I. and A. El-Tarras (1989), Clastogenic effects of cis-diamminedichloro platinum. I. Induction
of chromosomal aberrations in somatic and germinal cells of mice. Mutation Research, Vol. 211/1, pp.
131-137.
Adler, I. et al. (1998a), “Dose response study for 1.3-butadiene-induced dominant lethal mutations
and heritable translocations in germ cells of male mice”, Mutation Research, Vol. 397/1, pp. 85-92.
Adler, I. et al. (1998b), “Recommendations for statistical designs of in vivo mutagenicity tests with
regard to subsequent statistical analysis”, Mutation Research, Vol. 417/1, pp. 19–30.
Adler, I. et al. (2002), “Induction of chromosomal aberrations by dacarbazine in somatic and germinal
cells of mice”, Mutagenesis, Vol. 17/5, pp. 383-389.
Amundson, S. and H Liber. (1992), “A comparison of induced mutation at homologous alleles of the
tk locus in human cells. II. Molecular analysis of mutants”, Mutation Research, Vol. 267/1, pp. 89-95.
Anderson, D. et al. (1998), “A comparison of male-mediated effects in rats and mice exposed to 1,3-
butadiene”, Mutation Research, Vol. 397/1, pp.77-84.
Anderson, D. et al. (1976a), “Dominant lethal studies with paraquat and diquat in male cd-1 mice”,
Mutation Research, Vol. 40/4, pp. 349-358.
Anderson, D. et al. (1976b), “Vinyl chloride: dominant lethal studies in male cd-1 mice”, Mutation
Research, Vol. 40/1, pp. 359-370.
Anderson, D. et al. (1977), “Dominant lethal studies with the halogenated olefins vinyl chloride and
vinylidene dichloride in male CD-1 mice”, Environmental Health Perspectives, Vol. 21, pp. 71-78.
Arlett, C. F. et al. (1989), “Mammalian cell gene mutation assays based upon colony formation”. In.
Statistical Evaluation of Mutagenicity Test Data, Kirkland, D.J. (Ed.), Cambridge University Press. Pp.66-
101.
Attia, S. (2012), “Dominant lethal mutations of topoisomerase II inhibitors etoposide and merbarone
in male mice: A mechanistic study”, Archives of Toxicology, Vol. 86/5, pp. 725-731.
Attia, S. et al. (2015), “Dominant lethal effects of nocodazole in germ cells of male mice”, Food and
Chemical Toxicology, Vol. 77, pp. 101-104.

ENV/JM/MONO(2016)33/REV1
41
Avlasevich, S. L. et al. (2006) “In vitro micronucleus scoring by flow cytometry: differential staining
of micronuclei versus apoptotic and necrotic chromatin enhances assay reliability”. Environ. Mol.
Mutagen., 47, 56–66.
Barnett, L. and S Lewis. (2003), “Chlornaphazine and chlorambucil induce dominant lethal mutations
in male mice”, Mutattion Research, Vol. 543/2, pp. 145-154.
Barnett, L. et al. (1992), “Ethylene dibromide: negative results with the mouse dominant lethal assay
and the electrophoretic specific-locus test”, Mutation Research, Vol. 282/2, pp. 127-133.
Bartsch, H. et al. (1982), Chapter 3: “Metabolic activation systems in vitro for carcinogen/mutagen
screening tests”, in Chemical Mutagens (Vol.7): Principles and Methods for Their Detection, de Serres, F.
and A. Hollaender (eds.), Plenum Press, New York, pp. 95-162 (NY: Plenum Press
Bateman, A. (1984), “The dominant lethal assay in the male mouse”, in Handbook of Mutagenicity
Test Procedures, 2nd Edition, Kilbey BJ, Legator M, Nichols W, Ramel C (eds.), Elsevier Scientific,
Amsterdam, pp. 471-484.
Bishop, J. et al. (1983), “Dominant lethal test response with IMS and TEM using different
combinations of male and female stocks of mice”, Mutation Research, Vol. 121/3-4, pp. 273-280.
Blaszkowska, J. (2010), “Induction of dominant lethal mutations by Ascaris trypsin inhibitor in male
mice”, Reproductive Toxicology, Vol. 29/1, pp. 113-119.
Bowen, D. et al. (2011), “Evaluation of a multi-endpoint assay in rats, combining the bone-marrow
micronucleus test, the comet assay and the flow-cytometric peripheral blood micronucleus test”, Mutation
Research, Vol. 722/1, pp. 7-19.
Brookmire, L. et al. (2013), “Evaluation of the highest concentrations used in the chromosome
aberrations assay”, Environmental and Molecular Mutagenesis, Vol. 54/1, pp. 36-43.
Brunton, L. et al. (2002), “Goodman and Gilman’s The Pharmacological Basis of Therapeutics”, 10th
Edition, McGraw-Hill, New York.
Cao, X. et al. (2014), “Quantitative dose-response analysis of ethyl methanesulfonate genotoxicity in
adult gpt-delta transgenic mice”, Environmental and Molecular Mutagenesis, Vol. 55/5, pp. 385-399.
Cimino, M. (2006a), “Comparative overview of current international strategies and guidelines for
genetic toxicology testing for regulatory purposes”, Environmental and Molecular Mutagenesis, Vol. 47/5,
pp. 362-390.
Cimino, M. (2006b), Erratum to “Comparative overview of current international strategies and
guidelines for genetic toxicology testing for regulatory purposes”, Environmental and Molecular
Mutagenesis, Vol. 47/9, pp. 746.
Ciranni, R. and I Adler. (1991), “Clastogenic effects of hydroquinone: induction of chromosomal
aberrations in mouse germ cells”, Mutation Research, Vol. 263/4, pp. 223-229.
Ciranni, R. et al. (1991), “Dose-related clastogenic effects induced by benzene in bone marrow cells
and in differentiating spermatogonia of Swiss CD1 mice”, Mutagenesis, Vol. 6/5, pp. 417-421.

ENV/JM/MONO(2016)33/REV1
42
Claxton, L. et al. (2001), “Methods for the Spiral Salmonella mutagenicity assay 32 including
specialised applications”, Mutation Research, Vol. 488/3, pp. 241-257.
Cliet, I. et al. (1993), “Lack of predictivity of bone marrow micronucleus test versus testis
micronucleus test: Comparison with four carcinogens”, Mutation Research, Vol. 292/2, pp. 105-111.
Clive, D. and J Spector. (1975), “Laboratory procedure for assessing specific locus mutations at the
TK locus in cultured L5178Y mouse lymphoma cells”, Mutation Research, Vol. 31/1, pp. 17-29.
COM (2011), “Guidance on a strategy for testing of chemicals for mutagenicity”, in Committee on
Mutagenicity of Chemicals in Food, Consumer Products and the Environment (COM), Department of
Health, London.
Corvi, R. et al. (2008), “ECVAM retrospective validation of the in vitro micronucleus test (MNT)”,
Mutagenesis, Vol. 23/4, pp. 271-283.
Cox, J. et al. (2016), “The utility of metabolic activation mixtures containing human hepatic post-
mitochondrial supernatant (S9) for in vitro genetic toxicity assessment”, Mutagenesis, Vol. 31/2, pp.117-
130..
Dearfield, K. and M Moore. (2005), “Use of genetic toxicology information for risk assessment”,
Environmental and Molecular Mutagenesis, Vol. 46/4, pp. 236–245.
Dearfield, K. et al. (2011), “Follow-up actions from positive results of in vitro genetic toxicity
testing”, Environmental and Molecular Mutagenesis, Vol. 52/3, pp. 177-204.
De Boeck, M. et al. (2005), “Flow cytometric analysis of micronucleated reticulocytes: Time- and
dose-dependent response of known mutagens in mice, using multiple blood sampling”, Environmental and
Molecular Mutagenesis, Vol. 46/1, pp. 30-42.
De Flora, S. and A Izzotti. (2007), “Mutagenesis and cardiovascular diseases: molecular mechanisms,
risk factors, and protective factors”, Mutation Research, Vol. 621/1-2, pp. 5–17.
Dertinger, S. et al. (2011), “Flow cytometric scoring of micronucleated erythrocytes: An efficient
platform for assessing in vivo cytogenetic damage”, Mutagenesis, Vol. 26/1, pp. 139-145.
Ding, W. et al. (2014), “Sex-specific dose-response analysis of genotoxicity in cyproterone acetate-
treated F344 rats”, Mutation Research, Vol. 774, pp. 1-7.
Doherty, A. et al. (2011), “A rapid, semi-automated method for scoring micronuclei in
mononucleated mouse lymphoma cells”, Mutation Research, Vol. 726/1, pp. 36-41.
Dunnick, J. et al. (1984), “Dimethyl methyl phosphonate induction of dominant lethal mutations in
male mice”, Mutation Research, Vol. 138/2-3, pp. 213-218.
Eastmond, D. et al. (2009), “Mutagenicity testing for chemical risk assessment: update of the
WHO/IPCS harmonized scheme”, Mutagenesis, Vol. 24/4, pp. 341–349.
ECHA (2008a), “Guidance on information requirements and chemical safety assessment, Chapter
R.4: Evaluation of available information”. European Chemicals Agency (ECHA), Helsinki.

ENV/JM/MONO(2016)33/REV1
43
ECHA (2008b), “Guidance on information requirements and chemical safety assessment, Chapter
R.7a: Endpoint Specific Guidance”, European Chemicals Agency, Helsinki.
EC (2009), “Regulation (EC) No 1223/2009 of The European Parliament and of the Council of 30
November 2009 on cosmetic products”, Official Journal of the European Union, L 342/59-209.
EC (2006), "Regulation (EC) No 1907/2006 of the European Parliament and the Council of 18
December 2006 concerning the Registration, Evaluation, Authorisation and Restriction of Chemicals
(REACH), establishing a European Chemicals Agency, amending Directive 1999/45/EC and repealing
Council Regulation (EEC) No 793/93 and Commission Regulation (EC) No 1488/94 as well as Council
Directive 76/769/EEC and Commission Directives 91/155/EEC, 93/105/EC and 2000/21/EC", Official
Journal of the European Union, L396/1-849.
Ehling. U. (1971), “Comparison of radiation- and chemically-induced dominant lethal mutations in
male mice”, Mutation Research, Vol. 11/1, pp. 35-44.
Ehling, U. and A Neuhäuser-Klaus. (1988), “Induction of specific-locus and dominant-lethal
mutations by cyclophosphamide and combined cyclophosphamide-radiation treatment”, Mutation
Research, Vol. 199/1, pp. 21-30.
Ehling, U. and A Neuhäuser-Klaus. (1989), “Induction of specific-locus and dominant lethal
mutations in male mice by chlormethine”, Mutation Research, Vol. 227/2, pp. 81-89.
Ehling, U. and A Neuhäuser-Klaus. (1991), “Induction of specific-locus and dominant lethal
mutations in male mice by buslfan”, Mutation Research, Vol. 249/2, pp. 285-292.
Ehling, U. and A Neuhäuser-Klaus. (1995), “Induction of specific-locus and dominant lethal
mutations in male mice by n-propyl and isopropyl methanesulfonate”, Mutation Research, Vol. 328/1, pp.
73-82.
Ehling, U. et al. (1968), “Induction of dominant lethal mutations by alkylating agents in male mice”,
Mutation Research, Vol. 5/3, pp. 417-428.
Erickson, R. (2010), “Somatic gene mutation and human disease other than cancer: An update”.
Mutation Research, Vol. 705, pp. 96-106.
Fielder, R. et al. (1992), "Dose setting in in vivo mutagenicity assays", Mutagenesis, Vol. 7, pp. 313-
319.
Fluckiger-Isler, S. et al. (2004), “Assessment of the performance of the Ames II assay: A
collaborative study with 19 coded compounds”, Mutation Research, Vol. 558/1-2, pp. 181-197.
Frank, S. (2010), “Evolution in health and medicine Sackler colloquium: Somatic evolutionary
genomics: mutations during development cause highly variable genetic mosaicism with risk of cancer and
neurodegeneration”, Proceedings of the National Academy of Sciences of the United States of America,
Vol. 107/Suppl 1, pp. 1725-1730.
Generoso, W. et al. (1975), “6-mercaptopurine, an inducer of cytogenetic and dominant- lethal effects
in premeiotic and early meiotic germ cells of male mice”, Mutation Research, Vol. 28/3, pp. 437-447.

ENV/JM/MONO(2016)33/REV1
44
Generoso, W. et al. (1982), “Lack of association between induction of dominant-lethal mutations and
induction of heritable translocations with benzo[a]pyrene in postmeiotic germ cells of male mice”,
Mutation Research, Vol. 94, pp. 155-163.
Generoso, W. et al. (1986), “Ethylene oxide dose and dose-rate effects in the mouse dominant-lethal
test”, Environmental Mutagenesis, Vol. 8/1, pp. 1-7.
Generoso, W. et al. (1995), “Dominant lethal and heritable translocation tests with chlorambucil and
melphalan in male mice”, Mutation Research, Vol. 345/3-4, pp. 167-180.
Generoso, W. et al. (1996), “Dominant lethal mutations, heritable translocations, and unscheduled
DNA synthesis induced in male mouse germ cells by glycidamide, a metabolite of acrylamide”, Mutation
Research, Vol. 371/3-4, pp. 175-183.
Generoso, W. and W Piegorsch. (1993), Chapter 8: “Dominant lethal tests in male and female mice”
in Methods in Toxicology (Vol. 3): Part A, Male Reproductive Toxicology, Academic Press, Inc., San
Diego, pp. 124-141.
Gollapudi, B. et al. (2013), “Quantitative approaches for assessing dose-response relationships in
genetic toxicology studies”, Environmental and Molecular Mutagenesis, Vol. 54/1, pp. 8-18.
Green, S. et al. (1985), “Current status of bioassays in genetic toxicology--the dominant lethal assay.
A report of the U.S. Environmental Protection Agency Gene-Tox Program”, Mutation Research, Vol.
154/1, pp. 49-67.
Guerard, M. et al. (2014), “Influence of experimental conditions on data variability in the liver comet
assay”, Environmental and Molecular Mutagenesis, Vol. 55/2, pp. 114-121.
Guo, C. et al. (2005), “The influence of aluminum exposure on male reproduction and offspring in
mice”, Environmental Toxicology and Pharmacology, Vol. 20/1, pp. 135-141.
Hamada, S. et al. (2001), “Evaluation of the rodent micronucleus assay by a 28-day treatment
protocol: Summary of the 13th collaborative study by the collaborative study group for the Micronucleus
Test (CSGMT)/Environmental Mutagen Society of Japan (JEMS)-Mammalian Mutagenicity Study Group
(MMS)”, Environmental and Molecular Mutagenesis, Vol. 37/2, pp. 93-110.
Hayashi, M., J.T. MacGregor, D.G. Gatehouse, D.H. Blakey, S.D. Dertinger, L. Abramsson-
Zetterberg, G. Krishna, T. Morita, A. Russo, N. Asano, H. Suzuki, W. Ohyama, and D. Gibson (2007), In
vivo erythrocyte micronucleus assay III. Validation and regulatory acceptance of automated scoring and
the use of rat peripheral blood reticulocytes, with discussion of non-hematopoietic target cells and a single
dose-level limit test, Mutat. Res., 627, 10-30.
Hayashi, M. et al. (2011), “Compilation and use of genetic toxicity historical control data”, Mutation
Research, Vol. 723/2, pp. 87-90.
Hayashi M. et al. (1994), “In vivo rodent erythrocyte micronucleus assay”, Mutation Research, Vol.
312/2, pp. 293-304.
Heddle, J. et al. (2003), “Treatment and sampling protocols for transgenic mutation assays”,
Environmental and Molecular Mutagenesis, Vol. 41/1, pp. 1-6.

ENV/JM/MONO(2016)33/REV1
45
Henderson, G. (2011), “Six Sigma Quality Improvement with Minitab”, 2nd edition, John Wiley &
Sons Inc., Chichester, United Kingdom.
Hoeijmakers, J. (2009). “DNA damage, aging, and cancer”, New England Journal of Medicine, Vol.
361/15, pp. 1475-1485.
Honma, M. et al. (1997) “Cytotoxic and mutagenic responses to X-rays and chemical mutagens in
normal and P53-mutated human lymphoblastoid cells, Mutation Research, Vol. 374/1, pp. 89-98.
Honma, M and Hayashi (2011), “Comparison of in vitro micronucleus and gene mutation assay
results for P53-competent versus P53-deficient human lymphoblastoid cells”, Environmental and
Molecular Mutagenesis, Vol 52/5, pp.373-384.
Hu, Q. and S Zhu. (1990), “Induction of chromosomal aberrations in male mouse germ cells by uranyl
fluoride containing enriched uranium”, Mutation Research, Vol. 244/3, pp. 209-214.
ICH (2011), "Guidance On Genotoxicity Testing And Data Interpretation For Pharmaceuticals
Intended For Human Use S2(R1)". ICH Harmonised Tripartite Guideline, International Conference on
Harmonization, Geneva, Switzerland, 2011.
Johnson, G. et al. (2014), “Derivation of point of departure (PoD) estimates in genetic toxicology
studies and their potential applications in risk assessment”, Environmental and Molecular Mutagenesis,
Vol. 55/8, pp. 609-623.
Kim, B. et al. (2000), “Statistical analysis of in vivo rodent micronucleus assay’, Mutation Research,
Vol. 469/2, pp. 233-241.
Kirkland, D, and P Fowler. (2010), “Further analysis of Ames-negative rodent carcinogens that are
only genotoxic in mammalian cells in vitro at concentrations exceeding 1 mM, including retesting of
compounds of concern”, Mutagenesis, Vol. 25/6, pp. 539-553.
Kirkland, D. et al. (2008), “Recommended lists of genotoxic and non-genotoxic chemicals for
assessment of the performance of new or improved genotoxicity tests: A follow-up to an ECVAM
workshop”, Mutation Research, Vol. 653/1-2, pp. 99-108.
Kirkland, D. et al. (2007), “How to reduce false positive results when undertaking in vitro
genotoxicity testing and thus avoid unnecessary follow-up animal tests: Report of an ECVAM Workshop”,
Mutation Research, Vol. 628/1, pp. 31-55.
Kirkland, D. and G Speit. (2008), “Evaluation of the ability of a battery of three in vitro genotoxicity
tests to discriminate rodent carcinogens and non-carcinogens III. Appropriate follow-up testing in vivo”,
Mutation Research, Vol. 654/2, pp. 114-132.
Kissling, G. et al. (2007), “Sensitivity of the erythrocyte micronucleus assay: Dependence on number
of cells scored and inter- animal variability”, Mutation Research, Vol. 634/1-2, pp. 235–240.
Kligerman, A. et al. (1994), “Cytogenetic and germ cell effects of phosphine inhalation by rodents: II.
Subacute exposures to rats and mice”, Environmental and Molecular Mutagenesis, Vol. 24/4, pp. 301-306.
Lang, R. and I Adler. (1977), “Heritable translocation test and dominant--lethal assay in male mice
with methyl methanesulfonate”, Mutation Research, Vol. 48/1, pp.75-88.

ENV/JM/MONO(2016)33/REV1
46
Lemieux, C. et al. (2011), “Simultaneous measurement of benzo[a]pyrene-induced Pig-a and lacZ
mutations, micronuclei and DNA adducts in Muta™ Mouse”, Environmental and Molecular Mutagenesis,
Vol. 52/9, pp. 756-765.
Liber, H. L, et al. (1989), “A comparison of mutation induction at the TK and HPRT loci in human
lymphoblastoid cells: Quantitative differences are due to an additional class of mutations at the autosomal
TK locus”, Mutation Research, Vol. 216/1, pp. 9-17.
Lloyd, M. and D Kidd. (2012), “The mouse lymphoma assay”, Methods in Molecular Biology, Vol.
817, pp. 35-54.
Lorenzo, Y. et al. (2013), “The comet assay, DNA repair and cytotoxicity: Hedgehogs are not dead”,
Mutagenesis, Vol. 28/4, pp. 427-432.
Lorge, E. et al. (2008), “Comparison of different methods for an accurate assessment of cytotoxicity
in the in vitro micronucleus test. I. Theoretical aspects”, Mutation Research, Vol. 655/1-2, pp. 1-3.
Lorge, E. et al. (in prep), “Standardized cell sources and recommendations for good cell culture
practices in genotoxicity testing”,
Lovell, D. et al. (1989), Chapter 7: “Statistical analysis of in vivo cytogenetic assays”, in Statistical
Evaluation of Mutagenicity Test Data (Part 3), D.J. Kirkland (Ed.), Cambridge University Press,
Cambridge, United Kingdom, pp. 184-232.
Lovell, D. et al. (1987), “The use of a battery of strains of mice in a factorial design to study the
induction of dominant lethal mutations”, Mutation Research, Vol. 187/1, pp. 37-44.
Luippold, H. et al. (1978), “The production of chromosome aberrations in various mammalian cells
by triethylenemelamine”, Genetics, Vol. 88/2, pp. 317-326.
MacGregor, J. et al. (2015a), “IWGT report on quantitative approaches to genotoxicity risk
assessment II. Use of point-of-departure (PoD) metrics in defining acceptable exposure limits and
assessing human risk”, Mutation Research/Genetic Toxicology and Environmental Mutagenesis, Vol. 783,
pp. 66-78.
MacGregor, J. et al. (2015b), “IWGT report on quantitative approaches to genotoxicity risk
assessment I. Methods and metrics for defining exposure–response relationships and points of departure
(PoDs)”, Mutation Research/Genetic Toxicology and Environmental Mutagenesis, Vol. 783, pp. 55–65.
Madrigal-Bujaidar, E. et al. (2008), “Micronuclei induced by imipramine and desipramine in mice: A
subchronic study”, Basic and Clinical Pharmacology and Toxicology, Vol. 103/6, pp. 569-573.
Manjanatha, M. et al. (2015), “Evaluation of cII mutations in lung of male Big Blue mice exposed by
inhalation to vanadium pentoxide for up to 8 weeks”, Mutation Research/Genetic Toxicology and
Environmental Mutagenesis, Vol. 789-790, pp. 46-52.
Marchetti, F. et al. (2004), “Paternally transmitted chromosomal aberrations in mouse zygotes
determine their embryonic fate”, Biology of Reproduction, Vol. 70/3, pp. 616-624
Mei, N. et al. (2014), Chapter 34: “Methods for using the mouse lymphoma assay to screen for
chemical mutagenicity and photo-mutagenicity”, in Optimization in Drug Discover: In Vitro Methods, 2nd
Edition, Caldwell, G. and Z Yan (eds), Humana Press, Totowa, New Jersey, pp. 561-592.

ENV/JM/MONO(2016)33/REV1
47
Miltenburger, H. et al. (1978), “The effect of isoniazid (INH) on Chinese hamster and mouse
spermatogonia”, Human Genetics, Vol. 42/1, pp. 44-49.
Montgomery, D. (2005), “Introduction to statistical quality control”, 5th Edition. John Wiley & Sons,
Inc, Hoboken, New Jersey.
Moore, M. and D. Clive. (1982), “The quantitation of TK-/-
and HGPRT- mutants of L5178Y/TK+/-
mouse lymphoma cells at varying times post treatment”, Environmental and Molecular Mutagenesis, Vol.
4/4, pp. 499-519.
Moore, M. et al. (2000), “Mouse lymphoma thymidine kinase locus gene mutation assay:
International Workshop on Genotoxicity Test Procedures Workgroup Report”, Environmental and
Molecular Mutagenesis, Vol. 35/3, pp. 185-190.
Moore, M. et al. (2002), “Mouse lymphoma thymidine kinase gene mutation assay: Follow-Up
International Workshop on Genotoxicity Test Procedures”, New Orleans, Louisiana, Environmental and
Molecular Mutagenesis, Vol. 40/4, pp. 292-299.
Moore, M. et al. (2003), “Mouse lymphoma thymidine kinase gene mutation assay: International
Workshop on Genotoxicity tests Workgroup report – Plymouth, UK 2002”, Mutation Research, Vol.
540(2), pp. 127-140.
Moore, M. et al. (2006), “Mouse Lymphoma Thymidine Kinase Gene Mutation Assay: Follow-up
Meeting of the International Workshop on Genotoxicity Testing – Aberdeen, Scotland, 2003 – Assay
acceptance criteria, positive controls, and data evaluation”, Environmental and Molecular Mutagenesis,
Vol. 47/1, pp. 1-5.
Moore, M. et al. (2008), “Analysis of in vivo mutation data can inform cancer risk assessment”,
Regulatory Toxicology and Pharmacology, Vol. 51/2, pp. 151-161.
Moore, M. et al. (2015), “Mutagenesis and Genetic Toxicology”, in Principles of Toxicology:
Environmental and Industrial Applications, 3rd Edition, Williams, P. et al. (eds), John Wiley & Sons, Inc.,
pp.235-258.
Morita, T. et al. (2012), “Effect of reducing the top concentration used in the in vitro chromosomal
aberration test in CHL cells on the evaluation of industrial chemical genotoxicity”, Mutation Research,
Vol. 741/1-2, pp. 32-56.
Mullins, E. (2003), “Statistics for the quality control chemistry laboratory”, The Royal Society of
Chemistry, Cambridge.
OECD (1987), “Introduction to the OECD Guidelines on Genetic Toxicology Testing and Guidance
on the Selection and Application of Assays”, in the Third Addendum to the OECD Guidelines for Testing
of Chemicals (10th edition). OECD Publications, Paris.
OECD (2000), “Guidance document on the recognition, assessment and use of clinical signs as
humane endpoints for experimental animals used in safety evaluation”, OECD Environmental Health and
Safety Publications, Series on Testing and Assessment, No. 19, Paris, ENV/JM/MONO(2000)7.
OECD (2009), “Detailed review paper on transgenic rodent mutation assays”, OECD Environmental
Health and Safety Publications, Series on Testing and Assessment, No. 103, Paris, ENV/JM/MONO 7.

ENV/JM/MONO(2016)33/REV1
48
OECD. (1986), Test No. 485: Genetic toxicology, Mouse Heritable Translocation Assay, OECD
Guidelines for the Testing of Chemicals, Section 4, OECD Publishing, Paris.
OECD. (1997a), Test No. 471: Bacterial Reverse Mutation Test, OECD Guidelines for the Testing of
Chemicals, Section 4, OECD Publishing, Paris.
OECD. (1997b), Test No. 486: Unscheduled DNA Synthesis (UDS) Test with Mammalian Liver Cells
in vivo, OECD Guidelines for the Testing of Chemicals, Section 4, OECD Publishing, Paris.
OECD. (2013), Test No. 488: Transgenic Rodent Somatic and Germ Cell Gene Mutation Assays,
OECD Guidelines for the Testing of Chemicals, Section 4, OECD Publishing, Paris.
OECD. (2014a), Test No. 473: In Vitro Mammalian Chromosomal Aberration Test, OECD
Guidelines for the Testing of Chemicals, Section 4, OECD Publishing, Paris.
OECD. (2014b), Test No. 474: Mammalian Erythrocyte Micronucleus Test, OECD Guidelines for the
Testing of Chemicals, Section 4, OECD Publishing, Paris.
OECD. (2014c), Test No. 475: Mammalian Bone Marrow Chromosomal Aberration Test, OECD
Guidelines for the Testing of Chemicals, Section 4, OECD Publishing, Paris.
OECD. (2014d), Test No. 487: In Vitro Mammalian Cell Micronucleus Test, OECD Guidelines for
the Testing of Chemicals, Section 4, OECD Publishing, Paris.
OECD. (2014e), Test No. 489: In Vivo Mammalian Alkaline Comet Assay, OECD Guidelines for the
Testing of Chemicals, Section 4, OECD Publishing, Paris.
OECD. (2014f), “Report on statistical issues related to OECD test guidelines (TGs) on genotoxicity”,
OECD Environmental Health and Safety Publications, Series on Testing and Assessment, No. 198, OECD
Publishing, Paris, ENV/JM/MONO(2014)12.
OECD. (2015a), Test No. 476: In Vitro Mammalian Cell Gene Mutation Tests using the Hprt and
xprt genes, OECD Guidelines for the Testing of Chemicals, Section 4, OECD Publishing, Paris.
OECD. (2015b), Test No. 478: Rodent Dominant Lethal Test, OECD Guidelines for the Testing of
Chemicals, Section 4, OECD Publishing, Paris.
OECD. (2015c), Test No. 483: Mammalian Spermatogonial Chromosomal Aberration Test, OECD
Guidelines for the Testing of Chemicals, Section 4, OECD Publishing, Paris.
OECD. (2015d), Test No. 490: In Vitro Mammalian Cell Gene Mutation Tests Using the Thymidine
Kinase Gene, OECD Guidelines for the Testing of Chemicals, Section 4, OECD Publishing, Paris.
Palo, A. et al. (2005), “Etoposide-induced cytogenotoxicity in mouse spermatogonia and its potential
transmission”, Journal of Applied Toxicology, Vol. 25/2, pp. 94-100.
Palo, A. et al. (2009), “Cytosine arabinoside-induced cytogenotoxicity in bone marrow and
spermatogonial cells of mice and its potential transmission through the male germline”, Mutation
Research, Vol. 673/1, pp. 29-36.

ENV/JM/MONO(2016)33/REV1
49
Palo, A. et al. (2011), “Vinblastine-induced cytogenotoxicity in spermatogonia and its transmission in
the germline cells of Swiss mice”, Journal of Environmental, Pathology, Toxicology, and Oncology, Vol.
30/2, pp. 113-121.
Parsons, B. et al. (2013), “Temporal changes in K-ras mutant fraction in lung tissue of big blue
B6C3F₁ mice exposed to ethylene oxide”, Toxicological Sciences, Vol. 136/1, pp. 26-38.
Parry, J. et al. (2010), “Analysis of published data for top concentration considerations in mammalian
cell genotoxicity testing”, Mutagenesis, Vol. 25/6, pp. 531-538.
Pfuhler, S. et al. (2009), “Reduction of use of animals in regulatory genotoxicity testing:
Identification and implementation opportunities- Report from an ECVAM workshop”, Mutation Research,
Vol. 680/1-2, pp. 31-42.
Rao, U. et al. (1994), “Studies on the effect of ethanol on dominant lethal mutations in Swiss,
C57BL6 and CBA mice”, Mutation Research, Vol. 311/1, pp. 69-76.
Rathenberg, R. (1975), “Cytogenetic effects of cyclophosphamide on mouse spermatogonia”,
Humangenetik, Vol. 29/2, pp. 135-140.
Rothfuss, A. et al. (2011), “Improvement of in vivo genotoxicity assessment: combination of acute
tests and integration into standard toxicity testing”, Mutation Research, Vol. 723/2, pp. 108-120.
Russell, W. and R Burch. (1959), “The principles of humane experimental technique”, John Hopkins
Bloomberg School of Public Health, Methuen, London.
Ryan, T. (2000), “Statistical Methods for Quality Improvement", 2nd edition. John Wiley and Sons,
Inc., New York.
Ryan, T. (2011), “Statistical Methods for Quality Improvement", 3rd edition. John Wiley and Sons,
Inc., New York.
Schisler, M. et al. (2013), Chapter 2: “In vitro mouse lymphoma (L5178Y TK+/--3.7.2C) forward
mutation assay”, in Genotoxicity Assessment: Part I, Methods and Protocols, Dhawan, A. and M Bajpayee
(eds.), Humana Press, New York City, pp. 27-50.
Scott, D. et al. (1991), “International Commission for Protection against Environmental Mutagens and
Carcinogens. Genotoxicity under extreme culture conditions. A report from ICPEMC Task Group 9”,
Mutation Research, Vol. 257/2, pp. 147–205.
Seager, A. et al. (2014), “Recommendations, evaluation and validation of a semi-automated,
fluorescent-based scoring protocol for micronucleus testing in human cells”, Mutagenesis, Vol. 29/3, pp.
155-164.
Shelby, M. et al. (1991), “Mouse dominant lethal and bone marrow micronucleus studies on methyl
vinyl sulfone and divinyl sulfone”, Mutation Research, Vol. 250/1-2, pp. 431-437.
Shelby, M. et al. (1986), “Dominant lethal effects of acrylamide in male mice”, Mutation Research,
Vol. 173/1, pp. 35-40.
Slatter, M. and A Gennery. (2010), “Primary immunodeficiencies associated with DNA-repair
disorders”, Expert Reviews in Molecular Medicine, Vol. 12, pp. e9.

ENV/JM/MONO(2016)33/REV1
50
Smith, C. et al. (2008), “Recommendations for design of the rat comet assay”, Mutagenesis, Vol.
23/3, pp. 233-40.
Speit, G. et al. (2015), “Critical issues with the in vivo comet assay: a report of the comet assay
working group in the 6th International Workshop on Genotoxicity Testing (IWGT)”, Mutation
Research/Genetic Toxicology and Environmental Mutagenesis, Vol. 783, pp. 6-12.
Styles, J. et al. (2001), “Automation of mouse micronucleus genotoxicity assay by laser scanning
cytometry”, Cytometry, Vol. 44/2, pp. 153-155.
Sudman, P. et al. (1992), “Bleomycin: female-specific dominant lethal effects in mice”, Mutation
Research, Vol. 296/1-2, pp. 143-156.
Sui, H. et al. (2009), "Improvement and evaluation of high throughput luctuation Ames test using
384-well plate with Salmonella typhimurium TA100 and TA98", Genes and Environment Vo. 31, pp. 47-
55.
Tates, A. and A Natarajan. (1976), “A correlative study on the genetic damage induced by chemical
mutagens in bone marrow and spermatogonia of mice. I. CNU-ethanol”, Mutation Research, Vol. 37/2-3,
pp. 267-278.
Thybaud, V. et al. (2003), “In vivo transgenic mutation assays”, Mutation Research, Vol. 540/2, pp.
141-151.
Thybaud, V. et al. (2007), “Expert working group on hazard identification and risk assessment in
relation to in vitro testing. Strategy for genotoxicity testing: Hazard identification and risk assessment in
relation to in vitro testing”, Mutation Research, Vol. 627/1, pp. 41-58.
Thybaud, V. et al. (2011), “Strategies in case of positive in vivo results in genotoxicity testing”,
Mutation Research, Vol. 723/2, pp. 121-128.
Tice, R. et al. (1990), “The single cell gel assay: A sensitive technique for evaluating intercellular
differences in DNA damage and repair”, Basic Life Sciences, Vol. 53, pp. 291-301.
Torous, D. et al. (2000), “Enumeration of micronucleated reticulocytes in rat 1 peripheral blood: a
flow cytometric study”, Mutation Research, Vol. 465/1-2, pp. 91-99.
Tweats, D. et al. (2007a), “Report of the IWGT working group on strategies and interpretation of
regulatory in vivo tests I. Increases in micronucleated bone marrow cells in rodents that do not indicate
genotoxic hazards”, Mutation Research, Vol. 627/1, pp. 78-91.
Tweats, D. et al. (2007b), “Report of the IWGT working group on strategies and interpretation of
regulatory in vivo tests II. Identification of in vivo-only positive compounds in the bone marrow
micronucleus test”, Mutation Research, Vol. 627/1, pp. 92-105.
van Buul, P. and J Goudzwaard. (1980), “Bleomycin-induced structural chromosomal aberrations in
spermatogonia and bone-marrow cells of mice”, Mutation Research, Vol. 69/2, pp. 319-324.
Wang, J. et al. (2009), “The mouse lymphoma assay detects recombination, deletion, and
aneuploidy”, Toxicological Sciences, Vol. 109/1, pp. 96-105.

ENV/JM/MONO(2016)33/REV1
51
Witt, K. et al. (2003), “Mouse bone marrow micronucleus test results do not predict the germ cell
mutagenicity of N-hydroxymethylacrylamide in the mouse dominant lethal assay”, Environmental and
Molecular Mutagenesis, Vol. 41/2, pp. 111-120.
Witt, K. et al. (2000), “Micronucleated erythrocyte frequency in peripheral blood of B6C3F(1) mice
from short-term, prechronic, and chronic studies of the NTP carcinogenesis bioassay program”,
Environmental and Molecular Mutagenesis, Vol. 36/3, pp. 163-194.
Yauk, C. et al. (2015), “Approaches for identifying germ cell mutagens: Report of the 2013 IWGT
Workshop on germ cell assays”, Mutation Research, Vol. 783, pp. 36-54.
Uno, Y. et al. (2015a), “Recommended protocols for the liver micronucleus test: Report of the IWGT
working group”, Mutation Research, Vol. 783, pp. 13-18.
Uno, Y. et al. (2015b), “Micronucleus test in rodent tissues other than liver or erythrocytes: Report of
the IWGT working group”, Mutation Research, Vol. 783, pp. 19-22.
Zhang, H. et al. (1998), “Chromosomal aberrations induced by 12
C6+ heavy ion irradiation in
spermatogonia and spermatocytes of mice”, Mutation Research, Vol. 398/1-2, pp. 27-31.
Zhang, H. et al. (2008), “Induction of cytogenetic adaptive response in spermatogonia and
spermatocytes by pre-exposure of mouse testis to low dose 12
C6+
ions”, Mutation Research, Vol. 653/1-2,
pp. 109-112.

ENV/JM/MONO(2016)33/REV1
52
APPENDIX A. DOCUMENT SUPPORTING THE WNT DECISION TO IMPLEMENT
REVISED CRITERIA FOR THE SELECTION OF THE TOP CONCENTRATION IN THE
IN VITRO MAMMALIAN CELL ASSAYS ON GENOTOXICITY (TEST GUIDELINES 473,
476 AND 487) - [ENV/JM/TG/RD(2014)20]
The Impact of the Top Concentration on the Sensitivity and the Specificity of the Assay
INTRODUCTION AND BACKGROUND
1. In the previous version of OECD Test Guidelines (TGs) for in vitro mammalian genotoxicity, the
top concentration for soluble compounds in the absence of cytotoxicity was 10 mM or 5000
μg/mL, whichever is lower. This top concentration was selected originally because it was
considered to be the highest concentration that induces no extremes of osmolarity and pH, with the
concern that changes in osmolarity and pH would induce artefacts/misleading positive results in
mammalian cells.
2. This rationale for the top concentration was challenged as early as a decade ago. It was suggested
that at such high concentrations the mammalian cell metabolism mediated through enzymes would
be overwhelmed; for example, as most enzyme Km are below 100 μM, higher concentrations
could result in non-physiological effects. It was thought that in this way misleading positive results
may be generated. Accordingly, it is possible that such positive results may require further,
possibly unnecessary, in vivo testing. In response to this issue, the OECD undertook to revise the
top concentration criteria to improve the specificity of the mammalian tests without losing
sensitivity for the in vitro Test Guidelines that are under revision.
3. An OECD expert group (EG) on genotoxicity discussed this issue in 2011 and 2012, and a large
majority of experts agreed on a reduced top concentration of 10 mM or 2000 µg/mL, whichever is
lower1. However, the 5000 µg/mL limit is maintained for mixtures. This recommendation was
approved subsequently by the WNT at its 24th meeting in April 2012. However, Japan strongly
recommended that a document be developed to provide information on the specificity and the
sensitivity for in vitro mammalian genotoxicity assays using the new top concentration rather than
the new ICH recommendation (S2(R1)).
4. Studies using different data sets and different approaches have attempted to quantify the sensitivity
and, to a much lesser extent, specificity of the tests using different top concentrations and to make
comparisons between them. Although most of these analyses used data from chromosomal damage
assays, the EG agreed that results and conclusions from such analyses should apply to all in vitro
mammalian cell assays. Two publications (Morita et al., 2012, and Brookmire et al., 2013) were
found to be particularly useful for the analysis presented in the sections below.
5. The ICH guideline S2(R1) recommends a maximum top concentration of 1 mM or 500 µg/mL,
whichever is lower when not limited by solubility in solvent or culture medium or by cytotoxicity.
However, for pharmaceuticals with unusually low molecular weight, that is, less than 200 Da,
higher test concentrations should be considered (ICH S2(R1) Footnote 2). The ICH Footnote 2)
wording does not specify an upper concentration limit. Accordingly, in the analysis below it was
assumed (based on the expert recommendation of pharmaceutical regulators), that the “WNT
1 For brevity, herein the WNT-approved OECD Top Concentration Criteria are referred to as “WNT-
approved OECD Criteria”

ENV/JM/MONO(2016)33/REV1
53
approved OECD top concentration criteria” would apply, by default, to chemicals covered by
Footnote 2).
6. While pharmaceuticals with molecular weights less than 200 Da are relatively rare, such is not the
case with the chemicals covered by OECD TGs (e.g. the majority of chemicals in Morita et al.
(2012)). Furthermore, a high proportion of the IARC human carcinogens have a relatively low
molecular weight (Fig. 1). Such information further indicates the need for a top concentration
scheme that deals adequately with such lower molecular weight chemicals.

ENV/JM/MONO(2016)33/REV1
54
SENSITIVITY AND SPECIFICITY OF THE ASSAY
Analysis of Sensitivity
7. Brookmire et al. (2013) examined the concentration-response curves for the same in vitro CA
assay data as used by Parry et al. (2010) (which included only carcinogenic chemicals, and
therefore, does not permit an analysis of specificity). They determined the lowest concentration at
which CAs were detected for each compound and they analysed with these concentrations the
sensitivity of the CA assay, and the fraction of compounds that would not be detected as positive
as a function of the top concentration limit selected for the assay. The results of this study indicate
that a top concentration of 5000 µg/mL detects 99% of rodent carcinogens. Setting the top
concentration between 1000 and 2000 µg/mL would detect 95% of rodent carcinogens, equivalent
to the fraction detected by using a top concentration of 10 mM. Therefore, if a lower µg/mL
concentration is sought to pair with 10 mM, 2000 µg/mL is better aligned with 10 mM than to
5000 µg/mL, based on CA test performance. They pointed out that this approach treats data
equally across the entire concentration response curve, as opposed to analyses that conduct
intensive analyses only of compounds at the high end of the concentration response curve. A flaw
in the latter approach is that one does not know the frequency with which compounds detected in
the assay at lower concentrations would be considered of lower concern.
8. Morita et al. (2012) analysed 249 high production volume (HPV) chemicals tested in the in vitro
CA test with CHL cells in accordance with Japanese or OECD Test Guidelines. 38 chemicals that
were positive for CAs at >1 mM, but negative at ≤1 mM and also negative in the Ames test were
identified. These are chemicals that would be missed in the standard genotoxicity test battery if the
highest concentration tested in mammalian cells was lowered to 1 mM.
9. The level of concern for human health risk was assessed for these 38 “missed” chemicals based on
a weight of evidence approach which included the following: evaluation of the effects of extreme
culture conditions (low pH, high toxicity, or precipitation); in silico structural alert analysis; in
vivo genotoxicity and carcinogenicity test data; mode of action or information from closely related
chemicals. After an exhaustive review, four chemicals with “some concern”, nine with “minimal
concern”, and remaining 25 with “negligible concern” were identified. This holistic approach for
the prediction of in vivo outcomes, makes the best use of the available information, when data (in
particular carcinogenicity data) for a full risk assessment are not available. However, such an
approach can sometimes rely on broad assumptions when direct supporting data are not available.
Furthermore, it should be noted that the 38 chemicals of Morita et al. (2012), which were used to
determine the sensitivity and specificity2 of various top concentration proposals, and used
subsequently herein in Tables 1 and 3 all have Lowest Effective Concentrations (LECs) for the CA
assay at 1 mM or above, and as such may result in outcomes that are not fully representative of all
chemicals.
10. Many top concentration limit options were discussed by the EG at their meeting in January 2012.
The table below presents the various options, including the rationale behind each option.
2 The sensitivity is thus defined in the rest of the report as the ability of the test to predict (in case of a
positive result) concern (“some” or “minimal” concern as defined by Morita et al., 2012) for human health
based on a weight of evidence approach. The specificity is defined as the ability of the test to predict (in
case of a negative result) “negligible” concern for human health (as defined by Morita et al., 2012).
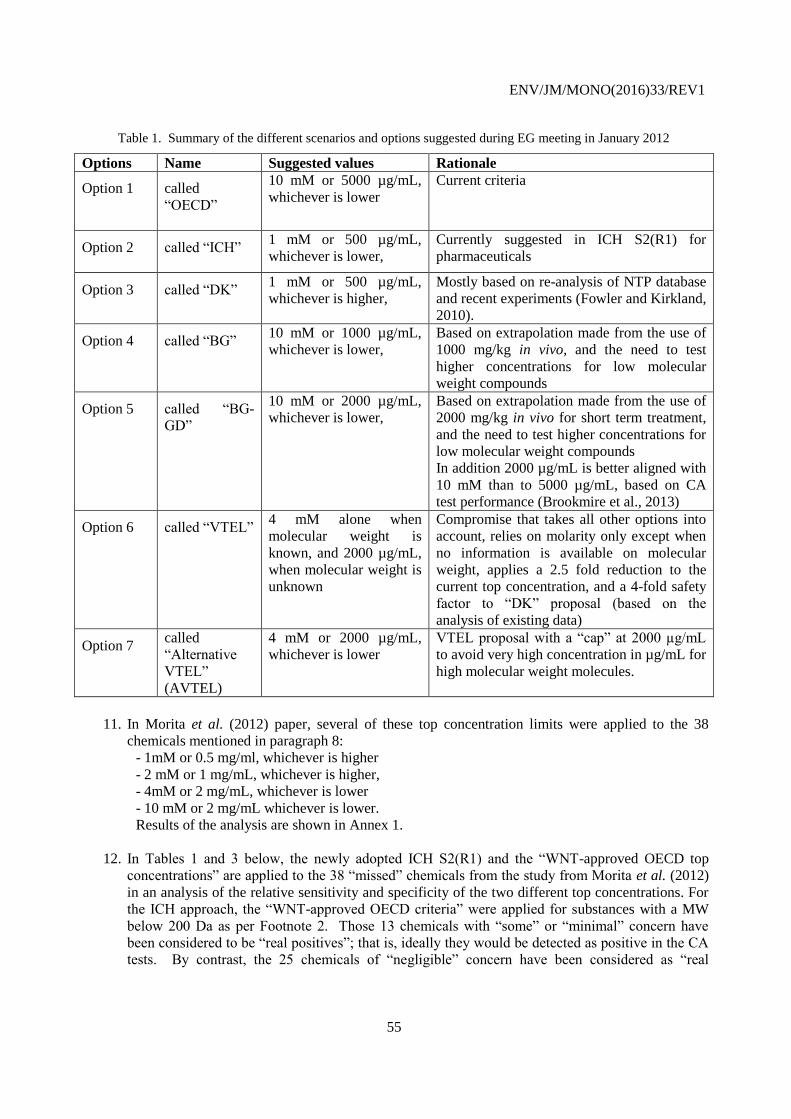
ENV/JM/MONO(2016)33/REV1
55
Table 1. Summary of the different scenarios and options suggested during EG meeting in January 2012
Options Name Suggested values Rationale
Option 1 called
“OECD”
10 mM or 5000 µg/mL,
whichever is lower
Current criteria
Option 2 called “ICH”
1 mM or 500 µg/mL,
whichever is lower,
Currently suggested in ICH S2(R1) for
pharmaceuticals
Option 3 called “DK”
1 mM or 500 µg/mL,
whichever is higher,
Mostly based on re-analysis of NTP database
and recent experiments (Fowler and Kirkland,
2010).
Option 4 called “BG”
10 mM or 1000 µg/mL,
whichever is lower,
Based on extrapolation made from the use of
1000 mg/kg in vivo, and the need to test
higher concentrations for low molecular
weight compounds
Option 5 called “BG-
GD”
10 mM or 2000 µg/mL,
whichever is lower,
Based on extrapolation made from the use of
2000 mg/kg in vivo for short term treatment,
and the need to test higher concentrations for
low molecular weight compounds
In addition 2000 µg/mL is better aligned with
10 mM than to 5000 µg/mL, based on CA
test performance (Brookmire et al., 2013)
Option 6 called “VTEL”
4 mM alone when
molecular weight is
known, and 2000 µg/mL,
when molecular weight is
unknown
Compromise that takes all other options into
account, relies on molarity only except when
no information is available on molecular
weight, applies a 2.5 fold reduction to the
current top concentration, and a 4-fold safety
factor to “DK” proposal (based on the
analysis of existing data)
Option 7 called
“Alternative
VTEL”
(AVTEL)
4 mM or 2000 µg/mL,
whichever is lower
VTEL proposal with a “cap” at 2000 µg/mL
to avoid very high concentration in µg/mL for
high molecular weight molecules.
11. In Morita et al. (2012) paper, several of these top concentration limits were applied to the 38
chemicals mentioned in paragraph 8:
- 1mM or 0.5 mg/ml, whichever is higher
- 2 mM or 1 mg/mL, whichever is higher,
- 4mM or 2 mg/mL, whichever is lower
- 10 mM or 2 mg/mL whichever is lower.
Results of the analysis are shown in Annex 1.
12. In Tables 1 and 3 below, the newly adopted ICH S2(R1) and the “WNT-approved OECD top
concentrations” are applied to the 38 “missed” chemicals from the study from Morita et al. (2012)
in an analysis of the relative sensitivity and specificity of the two different top concentrations. For
the ICH approach, the “WNT-approved OECD criteria” were applied for substances with a MW
below 200 Da as per Footnote 2. Those 13 chemicals with “some” or “minimal” concern have
been considered to be “real positives”; that is, ideally they would be detected as positive in the CA
tests. By contrast, the 25 chemicals of “negligible” concern have been considered as “real
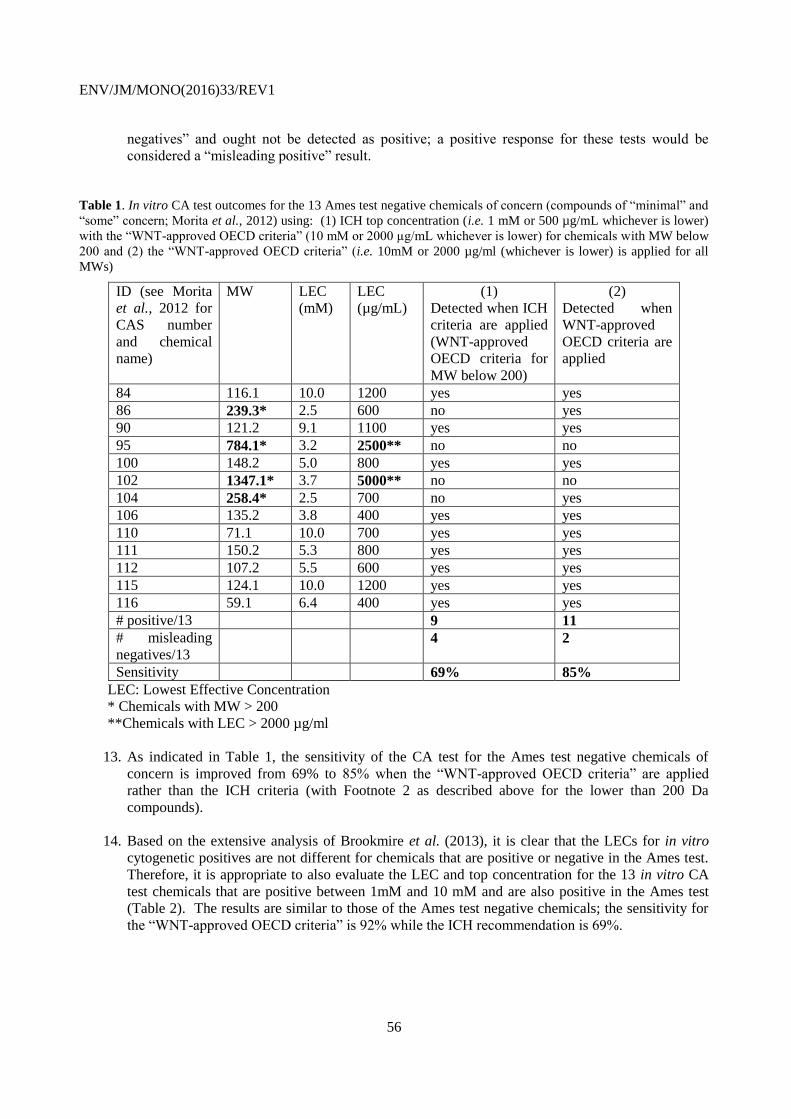
ENV/JM/MONO(2016)33/REV1
56
negatives” and ought not be detected as positive; a positive response for these tests would be
considered a “misleading positive” result.
Table 1. In vitro CA test outcomes for the 13 Ames test negative chemicals of concern (compounds of “minimal” and
“some” concern; Morita et al., 2012) using: (1) ICH top concentration (i.e. 1 mM or 500 µg/mL whichever is lower)
with the “WNT-approved OECD criteria” (10 mM or 2000 µg/mL whichever is lower) for chemicals with MW below
200 and (2) the “WNT-approved OECD criteria” (i.e. 10mM or 2000 µg/ml (whichever is lower) is applied for all
MWs)
ID (see Morita
et al., 2012 for
CAS number
and chemical
name)
MW LEC
(mM)
LEC
(µg/mL)
(1)
Detected when ICH
criteria are applied
(WNT-approved
OECD criteria for
MW below 200)
(2)
Detected when
WNT-approved
OECD criteria are
applied
84 116.1 10.0 1200 yes yes
86 239.3* 2.5 600 no yes
90 121.2 9.1 1100 yes yes
95 784.1* 3.2 2500** no no
100 148.2 5.0 800 yes yes
102 1347.1* 3.7 5000** no no
104 258.4* 2.5 700 no yes
106 135.2 3.8 400 yes yes
110 71.1 10.0 700 yes yes
111 150.2 5.3 800 yes yes
112 107.2 5.5 600 yes yes
115 124.1 10.0 1200 yes yes
116 59.1 6.4 400 yes yes
# positive/13 9 11
# misleading
negatives/13
4 2
Sensitivity 69% 85%
LEC: Lowest Effective Concentration
* Chemicals with MW > 200
**Chemicals with LEC > 2000 µg/ml
13. As indicated in Table 1, the sensitivity of the CA test for the Ames test negative chemicals of
concern is improved from 69% to 85% when the “WNT-approved OECD criteria” are applied
rather than the ICH criteria (with Footnote 2 as described above for the lower than 200 Da
compounds).
14. Based on the extensive analysis of Brookmire et al. (2013), it is clear that the LECs for in vitro
cytogenetic positives are not different for chemicals that are positive or negative in the Ames test.
Therefore, it is appropriate to also evaluate the LEC and top concentration for the 13 in vitro CA
test chemicals that are positive between 1mM and 10 mM and are also positive in the Ames test
(Table 2). The results are similar to those of the Ames test negative chemicals; the sensitivity for
the “WNT-approved OECD criteria” is 92% while the ICH recommendation is 69%.

ENV/JM/MONO(2016)33/REV1
57
Table 2. In vitro CA test outcomes for the 13 Ames test positive chemicals (Morita et al., 2012) using: (1) ICH top
concentration (i.e. 1 mM or 500 µg/mL whichever is lower) with the “WNT-approved OECD criteria” (10 mM or
2000 µg/mL whichever is lower) for chemicals with MW below 200 and (2) the “WNT-approved OECD criteria” (i.e.
10mM or 2000 µg/ml (whichever is lower) is applied for all MWs)
ID (see Morita et
al., 2012 for
CAS number and
chemical name)
MW LEC
(mM)
LEC
(µg/mL)
(1)
Detected when
ICH criteria are
applied (WNT-
approved OECD
criteria for MW
below 200)
(2)
Detected when
WNT-approved
OECD criteria are
applied
66 104.2 9.6 1000 yes yes
67 223.3* 4.9 1100 no yes
68 157.4 1.6 300 yes yes
69 157.2 4.0 600 yes yes
70 121.2 5.0 600 yes yes
71 121.2 2.5 300 yes yes
72 121.2 7.4 900 yes yes
73 580.1* 4.3 2500** no no
74 123.2 6.1 800 yes yes
75 358.4* 1.6 600 no yes
76 108.1 5.5 600 yes yes
77 174.2 1.8 300 yes yes
78 229.1* 7.0 1600 no yes
# positive/13 9 12
# misleading
negatives/13
4 1
Sensitivity 69% 92%
LEC: Lowest Effective Concentration
* Chemicals with MW > 200
**Chemicals with LEC > 2000 µg/ml
Analysis of Specificity
15. The analysis from Brookmire et al. (submitted) does not address the specificity of the CA assay.
However, the results for specificity as determined by the ICH top concentration with the “WNT-
approved OECD criteria” for MW below 200, and the “WNT-approved OECD criteria” based on
the data from Morita et al. (2012) are provided in the Table 3 below. The specificity determined by
the “WNT-approved OECD criteria” is lower than the specificity using the ICH criteria for this
selection of chemicals.

ENV/JM/MONO(2016)33/REV1
58
Table 3. In vitro CA test outcomes for the 25 Ames test negative chemicals of “negligible” concern using (Morita et
al., 2012): (1) ICH top concentration (i.e. 1 mM or 500 µg/mL whichever is lower) with the “WNT-approved OECD
criteria” (10 mM or 2000 µg/mL whichever is lower) for chemicals with MW below 200 and (2) the “WNT-approved
OECD criteria” (i.e.10 mM or 2000 µg/ml (whichever is lower) is applied for all MWs)
ID (see Morita et al.,
2012 for CAS number
and chemical name)
MW LEC
(mM)
LEC
(µg/mL)
(1) Detected when ICH
criteria are applied
(WNT-approved OECD
criteria for MW below
200)
(2) Detected when
WNT-approved
OECD criteria are
applied.
79 173.2 2.4 400 yes yes
80 221.5* 9.0 2000 no yes
81 187.2 5.1 1000 yes yes
82 218.2* 10.0 2200** no no
83 138.1 5.1 700 yes yes
85 186.2 9.1 700 yes yes
87 142.2 2.8 400 yes yes
88 147.0 1.6 200 yes yes
89 181.3 3.3 600 yes yes
91 130.2 5.0 700 yes yes
92 136.2 8.8 1200 yes yes
93 317.9* 6.3 2000 no yes
94 250.3* 1.6 400 no yes
96 128.1 2.5 300 yes yes
97 185.3 3.2 600 yes yes
98 144.2 5.0 700 yes yes
99 207.7* 10.0 2100** no no
101 128.6 2.0 300 yes yes
103 235.9* 2.3 600 no yes
105 173.3 1.9 300 yes yes
107 184.1 6.5 200 yes yes
108 116.2 3.4 400 yes yes
109 278.0* 1.8 500 no yes
113 161.1 3.8 600 yes yes
114 430.6* 2.5 1100 no yes
# negative/25 8 2
# potential misleading
positives/25
17 23
Specificity 32% 8%
LEC: Lowest Effective Concentration
* Chemicals with MW > 200
**Chemicals with LEC > 2000 ug/ml
The “WNT-approved OECD criteria” resulted in a reduction in specificity compared to the ICH (with
Footnote 2) of 32% to 8%.

ENV/JM/MONO(2016)33/REV1
59
Conclusions
16. For the chemicals studied in Morita et al. (2012) (of which ~80% have molecular weights below
200), detection of chemicals of concern (i.e. sensitivity) is 9/13 for ICH versus 11/13 for “WNT-
approved OECD criteria”; detection of compounds of negligible concern (i.e. specificity) is 17/25
for ICH versus 23/25 for “WNT-approved OECD criteria” (i.e. from 8/25 accurately detected as
negative to 2/25 accurately detected as negative). Thus, there is a marked increase in sensitivity
from 69% to 85% by using “WNT-approved OECD criteria” rather than ICH top concentration
limits. This outcome is balanced by a concomitant decrease in specificity from 32% to 8%,
respectively. These specificity values are low when either ICH (for chemicals with MW less than
200) or “WNT-approved OECD criteria” are used, but the deterioration in specificity is not
considered a major problem in light of: (a) the limited specificity in any case using ICH criteria;
(b) the marked increase in sensitivity.
17. The conclusion in the Morita et al. paper is that the top concentration of 2 mM or 1 mg/mL,
whichever is higher, is most effective, i.e., relatively higher (8/13) or lower (17/25) detection
among 13 or 25 chemicals, respectively, the other top concentrations showing less response to one
or both group of chemicals.
18. However, the “WNT-approved OECD criteria” was supported by the EG members as they
considered that, for industrial chemicals, for which negative in vitro results might not be followed
by further testing the most prudent course for public health is to maximize the sensitivity of the in
vitro test battery and thus maximise the sensitivity of each single test included in the test battery.
The drawback of maximizing the sensitivity of a test is at the expense of a lower specificity as
demonstrated by Morita et al. 2012. However, the EG members consideration was that the most
important issue was to obtain a higher sensitivity of the test. This is in contrast to pharmaceuticals
that are almost always evaluated in vivo.
19. Strategies for following up a positive result in the in vitro test battery vary widely, primarily
because the risk assessments for different regulatory programs diverge once data from the in vitro
screening battery are collected. Once the sensitivity of the assay to the intended endpoint is known,
this information can be used in a risk assessment tailored to risk/benefit analysis appropriate to the
specific test article being evaluated. An advantage of having a sensitive initial screen is that it
permits generation of the potentially relevant data while preserving options for follow-up based on
the specific needs of the ensuing risk assessment (Brookmire et al., 2013).

ENV/JM/MONO(2016)33/REV1
60
References
Parry JM, Parry E, Phrakonkham P, Corvi R (2010), Analysis of published data for top concentration
considerations in mammalian cell genotoxicity testing. Mutagenesis. 25:531-8
Morita,T., M. Honma, K. Morikawa (2012), Effect of reducing the top concentration used in the in vitro
chromosomal aberration test in CHL cells on the evaluation of industrial chemical genotoxicity, Mutation
research 741:32-56.
Brookmire L., J. Chen, R. Gudi and D.D. Levy (2013). Evaluation of the highest concentrations used in the
chromosome aberrations assay. Environmental and Molecular Mutagenesis 54: 36-43.
ICH Harmonised Tripartite Guideline (2011), International conference on harmonisation of technical
requirements for registration of pharmaceuticals for human use - Guidance on genotoxicity testing and data
interpretation for pharmaceuticals intended for human use S2(r1), Current Step 4 version dated 9
November 2011.
Kirkland D and Fowler P. (2010) Further analysis of Ames-negative rodent carcinogens that are only
genotoxic in mammalian cells at concentrations exceeding 1 mM, including retesting of compounds of
concern. Mutagenesis 25:539-553.

ENV/JM/MONO(2016)33/REV1
61
Annex 1
Application of Different Top Concentrations to 38 Missed Chemicals (from Morita at al., 2013)

ENV/JM/MONO(2016)33/REV1
62
APPENDIX B. TREATMENT AND SAMPLING TIMES FOR IN VIVO GENETIC
TOXICOLOGY TGS IN RODENTS (THE APPLICABLE TGS SHOULD BE CONSULTED
FOR MORE DETAILED INFORMATION).
Test Treatment Sampling
TG 474 (mammalian
erythrocyte micronucleus):
Single Bone Marrow: at
least 2x, 24 - 48 hr
after treatment
Peripheral Blood:
at least 2x, 36 -
72 hr after
treatment
2 daily BM: once 18 - 24
hr after treatment
PB: at least once
36 -48 hr after
treatment
3 or more daily BM: 24 hr after
treatment
PB: no later than
40 hr after
treatment
TG 475 (mammalian bone
marrow chromosome
aberration):
Single 2x: first; 1.5 cell cycle lengths after
treatment; second, 24 hr later
TG 478 (Rodent dominant
lethal):
1-5 daily 8 (mouse) or 10 (rat) weekly matings
following last treatment
28 daily 4 (mouse) weekly matings following
last treatment
TG 483 (Mammalian
spermatogonial chromosome
aberration):
Single Highest dose: 2x, 24 and 48 hr after
treatment
Other doses: 1x, 24 hr after treatment
Extended regimens
can be used (e.g. 28
daily)
Same as for single treatment
TG 488 (transgenic rodent
somatic and germ cell gene
mutation):
28 daily Somatic tissues: 3 days following last
treatment: however, for slowly
dividing tissues longer sampling times
(e.g. 28 days) may be used.
Germ Cells: seminiferous tubule cells,
3 days; sperm: 49 days (mouse); 70
days (rats).
TG 489 (mammalian comet) Single 2-6 hr and 16-26 hr after treatment
2 or more daily 2-6 hr after treatment

ENV/JM/MONO(2016)33/REV1
63
APPENDIX C. COMPILATION OF PUBLISHED NEGATIVE (VEHICLE) CONTROL
DATA FOR THE DOMINANT LETHAL TEST
Female Strain Male Strain
No. of
Femal
es
Total
implantations
Total
Resorptions
%
Resorptions St Dev
Reference
(101xC3H)F1 (101xC3H)F1 331 2441 189 7.7 3.0 Generoso et al. (1982)
(101xC3H)F1 (101xC3H)F1 294 3366 267 7.9 1.3 Ehling & Neuhauser-Klaus
(1989)
(101xC3H)F1 (101xC3H)F1 540 5830 581 10.0 1.0 Ehling & Neuhauser-Klaus
(1988)
(101xC3H)F1 (101xC3H)F1 169 1266 117 9.3 2.4 Ehling et al. (1968)
(101xC3H)F1 (101xC3H)F1 304 2123 148 7.0 3.3 Generoso et al. (1975)
(101xC3H)F1 (101xC3H)F1 506 5375 490 9.1 1.1 Ehling (1971)
(101xC3H)F1 (101xC3H)F1 438 4774 414 8.7 0.7 Ehling (1974)
Total or Mean 2582 25175 2206 8.81 1.1
(102xC3H)F1 (102xC3H)F1 116 1221 98 8.0 2.8 Adler et al. (1998a)
(102xC3H)F1 (102xC3H)F1 494 5467 466 8.5 1.6 Adler et al. (2002)
(102xC3H)F1 (102xC3H)F1 349 3965 359 9.0 1.7 Ehling & Neuhauser-Klaus
(1995)
(102xC3H)F1 (102xC3H)F1 353 4059 350 8.6 1.2 Ehling & Neuhauser-Klaus (1995)
(102xC3H)F1 (102xC3H)F1 229 2665 257 9.6 2.2 Adler et al. (1995)
(102xC3H)F1 (102xC3H)F1 449 4938 393 8.0 1.9 Ehling & Neuhauser-Klaus
(1994)
(102xC3H)F1 (102xC3H)F1 341 3921 403 10.3 1.9 Ehling & Neuhauser-Klaus (1991)
(102xC3H)F1 (102xC3H)F1 589 6528 525 8.0 1.3 Ehling & Neuhauser-Klaus
(1991)
Total or Mean 2920 32764 2851 8.71 0.8
(C3Hx101)F1 (C3Hx101)F1 90 704 44 6.3 1.5 Shelby et al. (1986)
(C3Hx101)F1 (101xC3H)F1 50 407 34 8.5 2.2 Generoso et al. (1982)
Total or Mean 140 1111 78 7.01 1.6
(C3HxC57BL)F1 (101xC3H)F1 67 713 47 6.6 0.9 Generoso et al. (1982)
BALB/c BALB/c 24 181 54 29.8 10.1 Lovell et al. (1987)
BALB/c BALB/c 60 562 25 4.4 1.2 Blaszkowska (2010)
Total 84 347 79 nd nd
B6CF1 Various 129 1296 71 5.5 4.3 Bishop et al. (1983)
B6C3F1 Various 128 1224 53 4.3 1.2 Bishop et al. (1983)
B6C3F1 (101xC3H)F1 388 4340 183 4.2 2.0 Witt et al. (2003)
B6C3F1 (101xC3H)F1 91 957 46 4.6 0.1 Witt et al. (2003)
B6C3F1 (101xC3H)F1 168 1855 89 4.8 0.6 Sudman et al. (1992)
B6C3F1 B6C3F1 290 2846 134 3.1 1.7 Kligerman et al. (1994)
Total or Mean 1065 11222 505 4.51 0.7
CBB6F1 CBB6F1 45 461 45 9.8 4.6 Lovell et al. (1987)
CBA/Ca CBA/Ca 24 198 23 11.6 1.1 Lovell et al. (1987)

ENV/JM/MONO(2016)33/REV1
64
C57BL/6J DBA/2J 129 1115 67 6.0 3.1 Barnett et al. (1992)
C57BL/6J DBA/2J 199 1832 118 6.4 2.6 Barnett & Lewis (2003)
C57BL/6J C57BL/6J 42 329 52 15.81 na Rao et al. (1994)
Total or Mean 370 3276 237 7.21 5.5 Rao et al. (1994)
CD-1 CD-1 46 572 37 6.5 na Anderson et al. (1998)
CD-1 B6C3F1 178 1983 131 6.6 3.1 Dunnick et al. (1984)
CD-1 CD-1 na na na 3.6 0.7 Guo et al. (2005)
CD-1 CD-1 447 5217 299 5.7 1.7 Anderson et al. (1976a)
CD-1 CD-1 323 4035 289 7.2 0.7 Anderson et al. (1976b)
CD-1 CD-1 702 8575 523 6.1 0.9 Anderson et al. (1977)
Total or Mean 1696 20382 1279 6.31 1.3
(SECxC57BL)F1 (C3Hx101)F1 39 359 8 2.2 na Shelby et al. (1986)
(SECxC57BL)F1 (C3Hx101)F1 733 7098 260 3.7 2.3 Generoso et al. (1995)
(SECxC57BL)F1 (C3Hx101)F1 613 5883 198 3.4 1.3 Generoso et al. (1986
(SECxC57BL)F1 (C3Hx101)F1 386 4021 115 2.9 1.1 Generoso et al. (1996)
(SECxC57BL)F1 (C3Hx101)F1 288 2969 91 3.1 1.3 Shelby et al.(1991)
(SECxC57BL)F1 (101xC3H)F1 50 514 20 4.0 1.5 Generoso et al. (1982)
(SECxC57BL)F1 (101xC3H)F1 200 2111 55 2.6 1.7 Sudman et al. (1992)
Total or Mean 2311 22955 747 3.31 0.6
NMRI (102xC3H)F1 103 1535 93 6.1 1.3 Adler et al. (1998)
NMRI NMRI 137 1692 83 4.9 0.5 Lang & Adler (1977)
Total or Mean 240 3227 176 5.51 0.8
Swiss Albino Swiss Albino 243 2693 282 10.5 1.3 Attia (2012)
Swiss Albino Swiss Albino 243 2672 274 10.3 1.0 Attia (2012)
Swiss Albino Swiss Albino 322 3541 357 10.1 1.3 Attia et al. (2015)
Total or Mean 808 8906 913 10.11 0.2
Swiss Swiss 275 2804 164 5.8 1.2 Rao et al. (1994)
Swiss C57BL 71 722 32 4.4 1.7 Rao et al. (1994)
Swiss CBA 76 710 26 3.7 2.5 Rao et al. (1994)
Total or Mean 422 4236 222 3.71 1.1
T-Stock (CH3x101)F1 755 6851 1125 16.4 3.1 Shelby et al. (1986)
T-Stock (CH3x101)F1 822 7713 935 12.1 2.6 Generoso et al. (1995)
T-Stock (CH3x101)F1 323 3116 472 15.2 2.6 Shelby et al. (1991)
Total or Mean 1900 17680 2532 14.31 2.2
1 weighted mean
na: not available
nd: not determined

ENV/JM/MONO(2016)33/REV1
65
APPENDIX D. COMPILATION OF PUBLISHED NEGATIVE (VEHICLE) CONTROL DATA
FOR THE MOUSE SPERMATOGONIAL CHROMOSOMAL ABERRATION TEST.
No.
of
mice
Strain No. of
cells
No of aberration/cell x 100 No. of
aberrations/
cell x 100
(excluding
gaps)
%
aberrant
cells
(excluding
gaps)
Ref.
Gaps Chromatid type Chromosome type
Breaks Exchanges Breaks Exchanges
24 (101x C3H)F1 1600 0.56 0.13 0 0 0 0.13 0.13 Adler, 1982
28 (101x C3H)F1 1400 0.79 0.14 0 0 0 0.14 0.14 Adler, 1982
10 (101x C3H)F1 20,000 0.63 0.14 0.005 0 0 0.15 0.15 Adler, 1982
4 (101x C3H)F1 400 0 0 0 0 0 0 0 Adler, 1982
35 (101 x C3H)F1 1750 0.97 0.11 0 0 0 0.11 0.11 Adler, 1974
6 CD1 700 NR 0.54 0 0 0 0.54 NR Luippold et al. 1978
1 CBA 300 NR 0.33 0 0 0 0.33 0.33 Tates and Natarajan, 1976
2 Swiss 250 NR 0 0 0 0 0 0 vanBuul and Goudzwaard, 1980
6 (101 x C3H)F1 600 6.0 0.5 0 0 0 0.50 0.5 Adler and El-Tarras, 1989
6 (102 x C3H)F1 600 5.0 0.83 0 0 0 0.83 0.83 Ciranni and Adler, 1991
20 Balb/c 2000 0.05 0.05 0 0 0 0.05 0.05 Hu and Zu, 1990
5 Kun-Ming 250 0 0.4 0 0 0 0.40 0.4 Zhang et al., 1998
7 Kun-Ming 350 0.29 0.29 0 0 0 0.29 0.29 Zhang et al., 2008
6 Swiss 274 3.65 1.46 0 0 0 1.46 1.46 * Palo et al., 2011; Palo et al., 2009, Palo et
al., 2005
5 Swiss 1000 4.9 1.20 0 0 0 1.20 1.20 Ciranni et al., 1991
6 NMRI 300 0.33 0.33 0 0 0 0.33 0.33 Rathenberg, 1975
8 (101 x C3H)F1 800 0 0 0 0 0 0 0 Miltenburger, et al. 1978
6 A-AJAX 560 0.90 0 0 0 0 0 0 Miltenburger, et al. 1978
32 NMRI 3200 0.34 0.13 0 0 0 0.13 0.13 Miltenburger, et al. 1978
* These three papers report the same control data. NR: Not reported

ENV/JM/MONO(2016)33/REV1
66
APPENDIX E. DEFINITIONS
Administration period: the total period during which an animal is dosed.
Aneugen: any chemical or process that, by interacting with the components of the mitotic and meiotic
cell division cycle, leads to aneuploidy in cells or organisms.
Aneuploidy: any deviation from the normal diploid (or haploid) number of chromosomes by a single
chromosome or more than one, but not by entire set(s) of chromosomes (polyploidy).
Apoptosis: programmed cell death triggered by DNA damage and characterised by a series of steps
leading to the disintegration of cells into membrane-bound particles that are then eliminated by
phagocytosis or by shedding.
Base pair substitution: a gene mutation characterised by the substitution of one base pair for another
in the DNA.
Cell proliferation: the increase in cell number as a result of mitotic cell division. Reduction in cell
proliferation is generally considered a marker of cytotoxicity, a key parameter in genotoxicity assays.
Centromere: the DNA region of a chromosome where both chromatids are held together and on
which both kinetochores are attached side-to-side.
Chromatid-type aberration: structural chromosome damage expressed as breakage of single
chromatids or breakage and reunion between chromatids.
Chromosome-type aberration: structural chromosome damage expressed as breakage, or breakage
and reunion, of both chromatids at an identical site.
Clastogen: a chemical that causes structural chromosomal aberrations in populations of cells or
organisms.
Clonal expansion: the production by cell division of many cells from a single (mutant) cell.
Cloning efficiency: the percentage of cells plated in a mammalian cell assay which are able to grow
into a colony that can be counted.
Comet: the shape that nucleoids adopt after submitted to one electrophoretic field; the head is the
nucleus and the tail is constituted by the DNA migrating out of the nucleus in the electric field. The shape
resembles a comet.
Cytogenetic assay: a test that detects damage to chromosomes (i.e. cytogenetic damage) either as
chromosome anomalies per se that can be visualised microscopically at metaphase (i.e. TGs 473, 475,
483), or as micronuclei that can be detected microscopically, or with flow cytometry, (i.e. TGs 474, 487).
Chromosomal aberrations include breaks in chromosomes that result in deletion, duplication or
rearrangement of chromosome segments, or a change (gain or loss) in chromosome number (i.e.
aneuploidy).
Cytokinesis: the process of cell division immediately following mitosis to form two daughter cells,
each containing a single nucleus.

ENV/JM/MONO(2016)33/REV1
67
Cytokinesis-block proliferation index (CBPI): a measure of cell proliferation consisting of the
proportion of second-division cells in the treated population relative to the untreated control.
Cytotoxicity: cytotoxicity is defined for each specific test (see individual TGs).
Deletion: a gene mutation in which one or more (sequential) nucleotides is lost from the genome, or a
chromosomal aberration in which a portion of a chromosome is lost.
Dominant lethal mutation: a mutation occurring in a germ cell, or is fixed after fertilisation, that
causes embryonic or foetal death.
Endoreduplication: a process in which after an S period of DNA replication, the nucleus does not
go into mitosis but starts another S period. The result is chromosomes with 4, 8, 16, ...chromatids.
Erythroblast: an early stage of erythrocyte development, preceding the immature erythrocyte, where
the cell still contains a nucleus.
Fertility rate: the number of mated pregnant females expressed in relationship to the number of
mated females.
Forward mutation: a gene mutation from the parental type to the mutant form which gives rise to an
alteration of the activity or the function of the encoded protein.
Frameshift mutation: a gene mutation characterised by the addition or deletion of single or multiple
(different from three or multiples of three) base pairs in the DNA molecule.
Gap: an achromatic lesion smaller than the width of one chromatid, and with minimum misalignment
of the chromatids.
Gene mutation assay: a test that detects heritable (to daughter cells or organisms) alterations to the
gene specific to the particular assay. These alterations can either activate or inactivate the specific gene.
Gene mutation include changes in a single or multiple nucleotide base pairs which can be substitution of
one base for another or addition or deletion of one or more bases in the base pair sequence and in some
assays, the deletion of the entire gene.
Genotoxicity: a general term encompassing all types of DNA or chromosomal damage, including
DNA strand breaks, adducts, rearrangements, mutations, structural chromosome aberrations, and
aneuploidy. Not all types of genotoxic effects result in mutations or stable (transmissible) chromosomal
damage.
Insertion: a gene mutation characterised by the addition of one or more nucleotide base pairs into a
DNA sequence.
Interphase cells: cells not in the mitotic stage.
Kinetochore: a protein-containing structure that assembles at the centromere of a chromosome to
which spindle fibers associate during cell division, allowing orderly movement of daughter chromosomes
to the poles of the daughter cells.
Mating interval: the time between the end of exposure and mating of treated males. By controlling
this interval, chemical effects on different germ cell types can be assessed. Effects originating in testicular

ENV/JM/MONO(2016)33/REV1
68
sperm, condensed spermatids, round spermatids, pachytene spermatocytes, early spermatocytes, dividing
spermatogonia, and stem cell spermatogonia are detected by using mating intervals of different lengths.
Micronuclei: small fragments of or an entire nuclear chromosome, separate from and in addition to
the main nuclei of cells, produced during telophase of mitosis (meiosis) by lagging chromosome fragments
or whole chromosomes.
Mitogen: a chemical that stimulates a cell to commence cell division, triggering mitosis (i.e. cell
division).
Mitotic index: a measure of the proliferation status of a cell population consisting of the ratio of the
number of cells in mitosis to the total number of cells in a population.
Mitosis: division of the cell nucleus usually divided into prophase, prometaphase, metaphase,
anaphase and telophase.
Mitotic recombination: A type of genetic recombination that occurs in somatic cells during their
preparation for mitosis. Mitotic recombination between homologous alleles can result in loss of
heterozygosity (LOH) which is an important genetic event during human tumorigenesis.
Mutagen: a chemical that induces genetic events that alter the DNA and/or chromosomal structure or
number and that are passed to subsequent generations.
Mutagenicity: a subset of genotoxicity. Mutagenicity results in events that alter the DNA and/or
chromosomal number or structure that are irreversible and, therefore, capable of being passed to
subsequent cell generations if they are not lethal to the cell in which they occur. Thus, mutations include
the following: 1) changes in a single base pairs; partial, single or multiple genes; or chromosomes; 2)
breaks in chromosomes that result in the stable (transmissible) deletion, duplication or rearrangement of
chromosome segments; 3) a change (gain or loss) in chromosome number (i.e. aneuploidy) resulting in
cells that have not an exact multiple of the haploid number; and, 4) DNA changes resulting from mitotic
recombination.
Mutant frequency (MF): the number of mutant colonies observed divided by the number of cells
plated in selective medium, corrected for cloning efficiency (or viability) at the time of selection.
Mutation frequency: the frequency of independently generated mutations. Generally calculated as
the number of observed independent mutations divided by the number of cells that are evaluated for the
presence of mutations. In the context of the TGs it is used for the transgenic mutation assays in which
mutants are sequenced and the mutant frequency is corrected based on the number of mutants found to be
siblings (from clonal expansion).
Normochromatic or mature erythrocyte: a fully matured erythrocyte that has lost the residual RNA
that remains after enucleation and/or has lost other short-lived cell markers that characteristically disappear
after enucleation following the final erythroblast division.
Numerical chromosome aberration: a chromosomal aberration consisting of a change in the number
of chromosomes from the normal number characteristic of the animals utilised (aneuploidy).
Phenotypic expression time: the time after treatment during which the genetic alteration is fixed
within the genome and any preexisting gene products are depleted to the point that the phenotypic trait is
altered and, therefore, can be enumerated using a selective drug or procedure.

ENV/JM/MONO(2016)33/REV1
69
Polychromatic or immature erythrocyte (PCE): a newly formed erythrocyte in an intermediate
stage of development, which does not contain a nucleus. It stains with both the blue and red components
of classical blood stains such as Wright’s giemsa because of the presence of residual RNA in the newly-
formed cell. Such newly formed cells are approximately the same as reticulocytes, which are visualised
using a vital stain that causes the residual RNA to clump into a reticulum. Other methods, including
monochromatic staining of RNA with fluorescent dyes or labeling of short-lived surface markers such as
CD71 with fluorescent antibodies, are now often used to identify the immature erythrocyte. Polychromatic
erythrocytes, reticulocytes, and CD71-positive erythrocytes are all immature erythrocytes, though each has
a somewhat different developmental distribution.
Polyploidy: a numerical chromosomal abnormality consisting of a change in the number of the entire
set(s) of chromosomes, as opposed to a numerical change in part of the chromosome set (cf. aneuploidy).
Reticulocyte: a newly formed erythrocyte stained with a vital stain that causes residual cellular RNA
to clump into a characteristic reticulum. Reticulocytes and polychromatic erythrocytes have a similar
cellular age distribution.
Relative cell counts (RCC): measure of cell proliferation that is the ratio of the final cell count of the
treated culture compared to the final cell count of the control cultures expressed as a percentage. Revised
TGs do not include this as an acceptable measure of cytotoxicity.
Relative increase in cell count (RICC): a measure of cell proliferation that is the ratio of the increase
in number of cells in treated cultures (final − starting) compared to the increase in the number of cells in
the control cultures (final - starting) expressed as a percentage.
Relative population doubling (RPD): a measure of cell proliferation that is the ratio of number of
population doublings in treated cultures (final – starting) compared to the number of population doublings
in control cultures (final – starting) expressed as a percentage.
Relative survival (RS): a measure of treatment-related cytotoxicity; the cloning efficiency (CE) of
cells plated immediately after treatment adjusted by any loss of cells during treatment compared with the
cloning efficiency in negative controls (which are assigned a survival of 100%).
Relative Total growth (RTG): RTG is used as the measure of treatment-related cytotoxicity in the
MLA. It reflects the relative (to the vehicle control) growth of test cultures during the, treatment, two-day
expression and mutant selection cloning phases of the test. The relative suspension growth of each test
culture is multiplied by the relative cloning efficiency of the test culture at the time of mutant selection to
obtain the RTG.
Replication index (RI): a measure of cell proliferation consisting of the proportion of cell division
cycles completed in a treated culture, relative to the untreated control, during the exposure period and
recovery.
S9 mix: mix of the liver S9 fraction (supernatant of liver homogenate after 9000g centrifugation, i.e.
raw liver extract.) and cofactors necessary for cytochrome P450 metabolic enzyme activity.
Solvent control: general term to define the negative control cultures receiving the solvent used to
dissolve the test chemical.
Structural chromosomal aberration: a change in chromosome structure detectable by
microscopic examination of the metaphase stage of cell division, observed as deletions and fragments,
intrachanges or interchanges.

ENV/JM/MONO(2016)33/REV1
70
Untreated control: cultures that receive no treatment (i.e. neither test chemical nor solvent) but are
processed concurrently and in the same way as the cultures receiving the test chemical.