unclassified mettttttttttitteitt hurricane havens facility ... · 29b1 aircraft carrier lant (cv)...
TRANSCRIPT

AD-A130 264 HURRICANE HAVENS HANDBOOK FOR THE NORTH ATLANTIC OCEAN 1/3
CHANGE I(U) NAVAL ENVIRONMENTAL PREDICTION RESEARCH
FACILITY MONTEREY CA R d TURPIN ET AL. dUN 83
UNCLASSIFIED NEPRF-TR-82-03-CHG-1 F/G 4/2 NLmEttttttttttittEIttmhEitthhEEEtttthtthItEEIIEEEEEEIIIEE-EEIIEIIIIEIIIEIIIImEu-I.' m
I-...I
1.8
11111125 I~~ l .
MICRCCP RLSOLUT iN '

DEPARTMENT OF THE NAVY "NAVAL ENVIRONMENTAL PREDICTION RE.EARCH FACILITY ki
MONTEREY, CALIFORNIA 93940
NEPRF/SBB :wc5600Ser: 19117 May 1983
From: Commanding Officer
To: Distribution
Subj: Change 1 to NAVENVPREDRSCHFAC TR 82-03; forwarding of
Ref: (a) CINCLANTFLT Itr 3100/FF1-2/N37A ser 2374 of 13April 1982
(b) NAVENVPREDRSCHFAC transmittal cheet 5600 NEPRF/SBB:sbser 171 of 25 May 1982
Encl: (1) Change 1 to NAVENVPREDRSCHFAC Technical Report82-03, Hurricane Havens Handbook for the NorthAtlantic Ocean
1. The basic volume of NAVENVPREDRSCHFAC TR 82-03, whichcontains Sections I-XI (less port of Newport, RI, Section IX),was distributed to units of the U.S. Atlantic Fleet by refer-ence (a) and to additional NAVENVPREDRSCHFAC addressees byreference (b).
2. Enclosure (1) is hereby forwarded to all holders of thebasic volume as specified in the distributions of references(a) and (b). Instructions for entering these change pages andadditional sections into the basic volume are provided as partof enclosure (1).
3. Development of TR 82-03 by this command is a continuingproject; distribution of future port evaluations and/or otherchanges will be made automatically to all holders of thepublication.
/z .. DTICENN E H L. VAN SICKLE
CD.. JUL 983
U3.
_ 83 07 06 099
f pubLIc fejeg aund h o; its!( l~ i~ b u i si u . l / te d .
CINCLANTFLT Distribution: Change 1, TR 82-03
V
SNDL21Al CINCLANTFLT (5)22AI Fleet Commander LANT (2)23AI Naval Force Commander LANT (2) .a ,,d23BI Special Force Commander LANT (2) - "'
24A1 Naval Air Force Commander LANT (2)24DI Surface Force Commander LANT (2)24E Mine Warfare Command24GI Submarine Force Commander LANT (2) *-
24HI Fleet Training Command LANT24J1 Fleet Marine Force Command LANT26AI Amphibious Group LANT (2)26E1 Amphibious Unit LANT (COMSPECBOATRON Only) f26H1 Fleet Training Group LANT (2) I26J Fleet Training Unit _.
26VJ Landing Force Training Command LANT26W Cargo Handling and Port Group %26DDI Mobile Diving and Salvage Unit LANT26JJ1 Fleet Area Control and Surveillance Facility LANT26QQI Special Warfare Group LANT26VV1 Submarine Force Representative LANT26XX1 Oceanographic Unit LANT26KKK1 Tactical Training Group LANT28AI Carrier Group LANT28B1 Cruiser-Destroyer Group LANT28C1 Surface Group LANT28DIl Destroyer Squadron LANT28G1 Mine Squadron and Division LANT28JI Service Group and Squadron LANT28K1 Submarine Group and Squadron LANT28L1 Amphibious Squadron LANT28M Patrol Combatant Missile (Hydrofoil Squadr-.n)29A1 Guided Missile Cruiser LANT (CG) (CGN)29B1 Aircraft Carrier LANT (CV) (CVN) (2)29CI Destroyer LANT (DD), Less 931/945 and 963 Classes29D1 Destroyer LANT (DD), 931/945 Class29EI Destroyer LANT (DD), 963 Class29F1 Guided Missile Destroyer LANT (DDG)29G1 Guided Missile Frigate LANT (FGG)29H1 Frigate LANT (FF), Less 1040/1097 Class291 Frigate LANT (FF 1098)29JI Frigate LANT (FF), 1040/1051 Class29KI Frigate LANT (FF), 1052/1077 Class29L1 Frigate LANT (FF), 1078/1097 Class29N1 Submarine LANT (SSN)2901 Fleet Ballistic Missile Submarine LANT (SSBN)29AAl Guided Missile Frigate LANT (FFG) 7 Class and Fleet
Introduction Team29BB Guided Missile Destroyer (DDG) 993 and 99529DD Patrol Combatant Missile (Hydrofoil) (PHM)30A1 Minesweeper, Ocean LANT (MSO)30B Saudi Naval Expansion Program31A1 Amphibious Command Ship LANT (LCC)31B1 Amphibious Cargo Ship LANT (LKA)31GI Amphibious Transport Doc LANT (LPD)31HI Amphibious Assault Ship LANT (LHA), (LPH) (2)

32X1 Salvage Ship LANT (ARS)32DD1 Submarine Tender LANT (AS)32EE1 Submarine Rescue Ship LANT (ASR)32GG1 Fleet Ocean Tug LANT (ATF)32KK Miscellaneous Command Ship (AGF)320Q Salvage and Rescue Ship LANT (ATS)32TT Auxiliary Aircraft Landing Training Ship (AVT)40B Control of Shipping Officer (LANT Only)41A Commander, MSC41B Area Commander, MSC (COMSCLANT Only)41D Offices, MSC (Less PAC and 10)FA2 Fleet Intelligence CenterFA7 Station LANTFAI0 Submarine Base LANTFAI3 Submarine Support Facility LANTFAI8 Amphibious Base LANTFA24 Base LANT
Copy to:21A2 CINCPACFLT21A3 CINCUSNAVEUR22A3 Fleet Commander EUR28A2 Carrier Group PAC29B2 Aircraft Carrier PAC (CV), (CVN)31H2 Amphibious Assault Ship PAC (LHA). (LPH)50A Unified Commands (CINCPAC and USCINCSO Only)50C Subordinate Unified Commands (COMUSFORCARIB Only)51A Supreme NATO Commands (SACLANT Only)51D2 Western Atlantic NATO CommandsT100 Mastezs of USNS Ships Operated by MSC (LANT Only)T1OI Masters of USNS Tankers Operated by Commercial ContractorsA3 Chief of Naval Operations (OP-64 and OP-952 Only)B2 Defense Agencies (Secretary, Joint Chiefs of Staff for
DDOES Only)B5 U.S Coast Guard (Less PAC Area)C40 COMNAVOCEANCOM Shore Based Detachments (FPO NY and CONUS
East Coast/Gulf Coast Only)FDI Oceanography Command (2)FD2 Oceanographic OfficeFD3 Fleet Numerical Oceanography CenterFD4 Oceanography Center (NAVEASTOCEANCEN 5 copies)FD5 Oceanography Command CenterFD6 Oceanography Command FacilityFF38 Naval AcademyFF44 Naval War CollegeFKAlA Air Systems Command HQFKR8C Environmental Prediction Research FacilityFT35 Amphibious School (LANT Only)FT43 Surface Warfare Officers School CommandFT73 Naval Postgraduate School31J1 Dock Landing Ship LANT (LSD)31K1 Tank Landing Ship LANT (LST)32A1 Destroyer Tender LANT (AD)32C1 Ammunition Ship LANT (AE)32GI Combat Store Ship LANT (AFS)32HI Fast Combat Support Ship LANT (AOE)32NI Oiler LANT (AO)3201 Replenishment Oiler LANT (AOR)32SI Repair Ship LANT (AR)
-2-

NAVENVPREDRSCHFAC Distribution: Change 1, TR 82-03
CINCLANIFLT COMMAN)ING UF I
L R ,IF if NAVAL OPERATIONS
NSAP S [. AOV., CODE N04L ATTN: 31 4q JL.'., OP-986
NORFOLK, VA d3',1 OCEANO. OEVEL. S3UN. 8-XN-6 wASHINGTON, DC 20350
NAVAL AIR STATION
COMMANDER IN CHIEF PATUXENT RIVER, MO 2dbi CHIEF OF NAVAL OPERATIONS
ATTN: METEORO. OFFICER DR. R. W. JAMES, OP-952DI
U.S. NAVAL FORCES, EUROPE COMMANDING OFFICER U.S. NAVAL OBSERVATORY
FPO NEW YORK 09510 AIR TEST & EVAL. SQUN. 1-VX-i 34TH & MASS. AVE., NW
NAVAL AIR STATION WASHINGTON, DC 20390
CINCUSNAVEUR PATUXENT RIVER. MD 20670
NAVELEX OCT. CHIEF Or NAVAL OPERATIONS
ATTN: NSAP SCI. ADV. COMMANDING GENERAL kGR) OR. RECHNITZER, OP-952F
Box 100 FLEET MARINE FORCE, ATLANTIC U.S. NAVAL OBSERVATORYB O X LO 03
T H 1, M AS S . AVE .
FPO NEW YORK 09510 NSAP SCIENCE ADVISOR ATON. C209NOPOLK , VA 23511
WASHINGTON, OC 20390
COMSECONDFLTNSAP SCIENCE ADVISOR COMMANDING GENERAL
Dfl. 2, HO, AWS
FPO NEW YORK 09501 2ND MARINE AIRCRAFT WING THE PENTAGON
MARINE CORPS AIR STATION WASHINGTON, DC 20330
COMSIXTHFLT/COMFAIRMED CHERRY PT., NC 28533
SCIENCE ADV. OFFICE (032) NAVAL DEPUTY TO THE ADMIN.
FPO NEW YORK 09501 CINCLANT
NOAA RM. 200, PAGE BLDG. 01
NAVAL BASE 3300 WHITEHAVEN ST. NW
COMMANDER NORFOLk, VA 23511 WASHINGTON, DC 20235
U.S. NAVAL FORCES, CARIBBEAN
FPO MIAMI 34051 SACLANT
OFFICER IN CHARGE
ASW RESEARCH CENTER NAVOCEANCOMDET
COMMANDER APO NEW YORK 09019
MONTEREY, CA 93940
NAVAL AIR FORCE COMMANDING OFFICER
U.S. ATLANTIC FLEET SURFACE EFFECTS SHIPS
NSAP SCIENCE ADVISOR (30F) PROJECT OFFICE NAVAL RESEARCH LAB
NORFOLK, VA 23511 tPMS 304-30) LIBRARY, CODE 2620
BOX 34401 WASHINGTON, DC 20390
COMNAVSURFLANT BETHESDA, MD 20084 COMMANDING OFFICERNSAP SCI. ADV. (NO09)
CMADN FIE
NORFOLK, VA 23511 DEPUTY SACLANT OFFICE OF NAVAL RESEARCH
CD SACLANT C-O1 EAST/CENTRAL REGIONAL OFFICE
BRITISH EXCHANGE OFFICE NORFOLK, VA 23511 BLDG. ME SECTION 0
COMNAVSURFLANT STAFF 459 SUMMER ST.
CODE N615 (AAW OFFICER) HQ SACLANT, C-331 BOSTON, MA 02210
£ NORFOLK, VA 23511 NORFOLK, VA 23511 COMMANDING OFFICER
BRITISH EXCHANGE OFFICE SENIOR UK GOVERNMENT NORDA, CODE 101
COMSTRKFLTLANT QUALITY & SAFETY OFFICER NSTL STATION
FPO NEW YORK 09051 (SP551), AIR FORCE BAY ST. LOUIS, MS 39529EASTERN TEST RANGE
COMMANDER CAPE CANAVERAL, FL 32925 COMNAYOCEANCOM
NAVAL SURFACE FORCE J. W. OWNBEY, CODE N542
U.S. PACIFIC FLEET BRITISH NAVY STAFF (2) NSTL STATION
NSAP SCI. ADY. (005/NN P.O. BOX 4855 BAY ST. LOUIS, MS 39529
SAN OIEGO, CA 9215-5 WASHINGTON, 0C 20008 COMMANDING OFFICER
COMMANDER BRITISH DEFENCE STAFF
NAVOCEANO, LIBRARY
MINE WARFARE COMMAND BRITISH EMBASSY
NSTL STATION
NSAP SCI. ADV. CODE 007 3100 MASSACHUSETTS AVE., NW BAY ST. LOUIS, MS 39522
CHARLESTON, SC 29408 WASHINGTON, DC 20008 CONAVOCEANO
CONSUBFORCE SPECIAL ASST. TO THE ASST. S. HAEGER, CODE 7122
U.S. ATLANTIC FLEET SECNAV (RMD) NSTL STATION
NSAP SCI. ADV. R013) ROOM 4E741, THE PENTAGON BAY ST. LOUIS, MS 39522
NORFOLK, VA 23511 WASHINGTON, OC 20350 CHAIRMAN
BRITISH EXCHANGE OFFICE CHIEF OF NAVAL RESEARCH (2) OCEANOGRAPHY DEPT.
STAFF OF COMMANDER LIBRARY SERVICES, CODE 734 U.S. NAVAL ACADEMY
S/N DEVELOPMENT SQON 12 RM. 633, BALLSTON TOWER #1 ANNAPOLIS, MD 21402
NAVAL S/M BASE, NEW LONDON 800 QUINCY ST.
GROTON, CT 06340 ARLINGTON, VA 22217
PRESIDENTNAVAL WAR COLLEGE
COMMANDER CHIEF OF NAVAL OPERATIONS ATTN: GEOPHYSICS OFFICER
OPIEVFOR LANT (OP-622C) NAVY DEPT. NEWPORT, RI 02840
NSAP SCIENCE ADVISOR WASHINGTON, DC 20350 COMMANDER
NORFOLK, VA 23511 COMMANDANT NAVAL SAFETY CENTER
OFFICER IN CHARGE MARINE CORPS HDQ.
NAVAL AIR STATION
TEST & EVAL. FORCE DET. U.S. MARINE CORPS NORFOLK, VA 23511
NEW LONDON LABORATORY WASHINGTON, OC 20380 COMNAVAIRSYSCOM (2)
NEW LONDON, CT 06320 CHIEF, ENV. SVCS. DIV. ATTN: LIBRARY, AIR-DOD'
COMMANDER OJCS (J-33)
WASHINGTON, DC 20361
SURFACE WARFARE DEVEL. GROUP RM. 2877K, THE PENTAGON
NAVAL AMPHIBIOUS BASE WASHINGTON, OC 20301 COMNAVAIRSYSCOM
LITTLE CREEK AIR-330
NORFOLK, VA 23521 WASHINGTON, DC 20361
-3-

... .. .. .,I.
5 M. N- K". " ^ '
, MMNU . -." .. . 5.., .
N %,A .tN , .M.
.T:UM AJN 'i,,M L.. ), .9 i ; -,v -,ARM:N5TEN, PA -H'i T N .U T2 2K', 2.KCNE
CUJMMA.JNO .: %6 of K NTN E *P 6 k .KU.jAT.$H t~'~ NNAVAL AN ILi .NA V..TNTZ K 1 F F ENE4 PUET, J 'MANJ u . r 'K R ' N "J.,TC0N k
A, , q y LR N , uoKk ,Ky ," NCJMMANJER M, -y N N TE.A YNAVAL ,E,,P .N )N LL ,T E,,F -t A - t 7NkA T 1 D%ATTN: DR 6. SH-ANTA 9 A MAN N A4 P A , I iTv 4CHINA AK.E, CA 9J3s,
COMMANDER -KA? uSM ArV.I Fl AE 'KFE SNNAVAL SUId RSFACc. wEAON CEN . ,)L , r I GK EN ; 3D129 TH L k A TjtuC'OVE 5220 KIT'4 A LA"T NS JLPT.6ETHESDA, MD 2i4! NF , k ,2A w KuPL A TON IN e
CCA52.E.N, :tCS4 LEFENA- TlCH. CN~j ENTERCOMMANDER AMEkON STATIUNNAVAL SHIP RCS. & OERAE. EN. , -.. MAqINt COH6 A NE SAN DAIA, VR z2314SURFACE SHIP DYNAMICS TRANCH "AC I wS-N0
ATTA: S. 306/ES AHN6%N, DL 1'COU oIRECTORBETHESDA. MD 20334 OFFIC E OF ENV. & LFEE SCIENCES
EMMA N'N GENERALE OFFICE LiF THE uNDERSEC OFCOMMANDER N3AP SKI. AV. , FLEE MAYNEFENSE FOR RSCH & ENG (EELS,NAVAL SURFACE WEAPONS CENTER FARCE, ATLANTIC iG4 ROOM 329, THE PENTAGONDAHGREN, VA 22443 NORFOLK, FA 2OSI WASHINGTON, DC 20301
DIRECTOR MMANDLER ENkAL INTELLIGENCE AGENCYNAVY SCIENCE ASST. PROGRAM AwS/D ATTNA: CR STANDARD DIST.NASLuRFWEAEN, WHITE OAKS SCOTT Fo, IL OTRi WASHINGT.ON DC 20505SILVER SPRING, MO 20910
uSAFETAC/Ty, DIRECTORCIVIL ENGINEERING LAOMNCEC SCOTT AF , L 622 8 TECHNICAL INFORMATIONENERGI PROGRAM OFFICE 1LJAE4, DEFENSE ADVANCE RSCH PROJECTSPORT HUENEME, CA 93043 SUPERINTENDENT 1400 WILSON BLVD.
ATTN: ISAFA (OEG . ARLINSTON, VA 22209COMMANDER USAF ACADEMF, CO 80840NAVAL AIR TEST CENTER COMMANA
S RV;J L 00 OMMANDCOMMANDANT FIE
PATURENT AIVER, MD 20670 U3,0TH TECH. TRNG GROUP U.S. COAST GUARDTTGNA-wSTOP 623 oASHCOTON. DC 20226
COMMANDER CHANUTE AFB, IL 61668PACMISTESTCEN CHILY, MARINE SCIENCE SECTIONGEOPHYSICS OFFICER. CODE 3250 AFAC/RAPY U.S. COAsT GUARD ACADEMYPT. MUO, CA 93042 .FFUTT AF6, NE biL1 NEA LONDON, CT 06320
CHIEF OF NAVAL EDUCATION & nFGL/. Y COMMANDING OFFICERTRAINING ,H;NSKOM AF6, MA lin 1KG AESTRACEN
NAVAL AIR STATION YORKTOWN, VA 23690PENSACOLA. FL 3636,)t OFFICER ;N CHARGE
SERVICf ULKHOOL COMMfAND COMMANDING OFFICERCHIEF OF NAVAL AlR TR AI NI NG U:T. F''sNstE/sTOP r?, USCG RSCH & bEVEL CENTERNARAL AIR )TTIJ N AR d _'0 AROTJN ,.T 0b343CORPUS 'HRISTi, TA ,4, " IL
b IUIL
M 1 ~T V q F 'qEFEtNL EAMEHRI 'AN ME T, : qJC I TV Y 'qt - A NVA X540 ALP A TM i NTATEOVO. & GEOAIRH. A 6ATHA1 t PY MNTIOR I,, T Y U fARCH L46P.'. BOA 1 6.o A * ,Ty JF OtFEN0i TEL[INATON, "fDORoASH;N-T(T.N, l .' 113 I WAR I)FFIK RUG. 1NG LANj
AN:JON, I .W. 1. FNGLHN')MILD Mt J. (HUN. 'ATI IN .JMANoIA :N -4IEF -L tAT1 ', iI V ON s'uN . JAl I. K 'N: 4f tME T tOR3( 3u2>
%ol'I flNV*', U( .'K'4.: ANU~iR4P',lv Of F tf VR'.1
6K4 'Nt . , N04..P4 N:T IdWOO.)
R t CT 0R P' M' 2'' 10. (N M ISEt HAt, J;FLIEB AL F Mt u 4Ut V 'RN",," NI %1 NO. ANDA,E NI'Y fi MApI
-4-

. .N F I - , A ..,
jM-A" AN, A' %,,LJF L LV. I ' N- .q
.. .,, .. , [ j ; :, N A
RAY ,. N-N-
MMNCT'TFF: . ..,H| , t A N"" IC" t
,JMMADING OFFICER NAV!GAT; N
AY BONEF I S -S2 HYI. lN, AP !L /).. '%ATFPO MIAMI 04090 AO HiNUl JN, J, N' AN': ELAA Itp ;V
RT:C A , AT i F F I L I % g , NIA
COMMANOING OFFICER 4; MARINE OBSERVATION PRGRAM 3 .J N. E. LUYP
41 0
:S', R. K. TURNER CG-ZO ) LEADER N. -RA wN 6LDG, SUITE i0'
FO MIAMI, FL 34093 ATTN: J. A. NICkERON AN ANTUNI, H 7 209NWS/NOAA. GRAMAX BLDG.
COMMANDING OFFICER 20) 8060 13TH STREET NATIONA. HURRICANE CENTER .7
NAVEASTOCEANCEN (N.E. SMITH? SILVER SPRING, MO 20910 NAS/NOAA
FLEET LIAISON SUPPORT GABES ONE TOnER, RM 631
MCADIE BLDG (:U-117) NATIONAL WEATHER SERVICE ( 6 1320 S. DIXIE HIGHWAY
NAVAL AIR STATION MARINE SERVICES BRANCH WIl? CORAL GABLES, FL 33146
NORFOLK, VA 23511 GRAMAX BLDG. ROM 1213SILVER SPRING, MD 20910 UNIVERSITY OF WISCONSIN
COMMANDER SPACE SCIENCE & ENG. CENTER
NAVAL AIR SYSTEMS COMMAND NATIONAL WEATHER SERVICE ATTN: JAN-HWA CHU
AIR-OOD4 (H. GRICE) METEOROLOGICAL SERVS. DIV. 1225 W. DAYTON STREET
WASHINGTON, DC 20361 58S STEWART AVE. MADISON. WI 53706GARDEN CITY, NY 11530
OFFICER IN CHARGE COMMANDER, DET. 10
NAVOCEANCOMDET NATIONAL WEATHER SERVICE 2D WEATHER SQON (MAC.
ATTN: B. L. WALLACE SCIENTIFIC SERVICES DIV. EGLIN AFB, FL 32542
FEDERAL BUILDING 585 STEWART AVE.
ASHEVILLE, NC 28801 GARDEN CITY, NY 11530 DAVID T. BERNARDINIBOX 446 AUTEC
COMNAVOCEANO NATIONAL WEATHER SERVICE FPO MIAMI 34058
T. R. FRONTENAC METEOROLOGICAL SERVS. DIV.
CODE 1122, NSTL STATION 819 TAYLOR ST., RM IOEIT9 RENOIX FIELD ENGINEERING CORP.
h BAY ST. LOUIS, MS 39522 FT. wORTH, TX 76102 MARINE SCIENCE SERVICESATTN: W. HACK
OFFICER IN CHARGE (2) NATIONAL WEATHER SERVICE P.O. BOK 2205
PERSONNEL SUPPORT ACTIVITY FORECAST OFFICE. NOAA SOUTH HACKENSACK, NJ 07606
DETACHMENT FEDERAL BLDG.NAVAL WEAPONS STATION P.O. BOX 3563 UNION CARBIDE CORP.
CHARLESTON, SC 29408 PORTLAND, ME 04104 ATTN: F. W. WYATTP.O. BOX 4488
DIRECTOR. CODE 41 NATIONAL WEATHER SERVICE CHARLESTON, WV 25304
MANAGEMENT PLANNING DIV. FORECAST OFFICE, NOAA
NAVAL SUPPLY CENTER GENERAL AVIATION ADMIN BLDG MR. MOTOHIRO MIYAZAKI
CHARLESTON, SC 29408 LOGAN INTERNATIONAL AIRPORT 1-11 MYOHOJI-TAKEMUKAI
EAST BOSTON, MA 02128 SUMA-KU, KOBE 654
DIRECTOR (2) JAPAN
LOGISTICS/SUPPLY DEPT. NATIONAL wEATHER SERVICEFLEMINEWARTRACEN FORECAST OFFICE, NOAA MR. RICHARD GILMORE
NAVAL BASE, BLDG 647 30 ROCKEFELLER PLAZA 1530 W. COUNTRY CLUB LANE
CHARLESTON, SC 29408 NEW YORK, NY 10020 OAK HARBOR, WA 98277
COMBAT SYSTEMS OFFICER (2) NATIONAL WEATHER SERVICE COMMANDER (25)
CODE 190, CHARLESTON NAVAL FURECAST OFFICE, NOAA 5th COAST GUARD DISTRICT
SHIPYARD, NAVAL BASE FEDERAL BLDG., RM 925B FEDERAL BLDG, 431 CRAWFORD
CHARLESTON, SC 29408 600 ARCH STREET PORTSMOUTH, VA 23705PHILADELPHIA, PA 19106
COMMANDER (25) COMMANDER (22)
Ist COAST GUARD DISTRICT LOMMANDER (25) 7th COAST GUARD DISTRICT
150 CAUSEWAY ST. ',' COAST GUARD DISTRICT FETrRAL BLDG, 51 SW FIRST
BOSTON, MA 02114 GOVIRNORS ISLAND MI;MI , FL 33130',LW YORF, NY 10004
COMMANDER (25)8th COAST GUARD DISTRICTHALE BOGGS, 500 CAMP ST.NEW ORLEANS, LA 70130
I -5-

ft!" r, N
ft jf t t' f t
'3 . -4 ' t f' ft
'4A'.i L 0A' .F.t'.t J I.3,. '3 .. ''A'.. --Rt
NNJ. NA.N .Mt~t ,'t '"I f
NCE.,NNkADPH 1C OtR I J I v,4 .'M A i 06,. mduo' ,T If .T ~ p~.. H j.t)ji LYXIC uTIYV dLAO I Vf. ,'I'. M4. -it 1 1NL-V..F .'jYOU~I 1 1.LtE, M40 2035 1
ILttfJ, 'IJ, 5IN Lt L .. J,.tI. <.FENLRAL ,OOR I NATNV F jR !iAT I )N4L F NILFN'.T 1N40NUNS 'HU E u''s1N INT' 1 T
METENAD. ELRV . & J". R AI. N-).- M. jft N6310 EYECQT 1VE BAGO. Aff.N NYDCKV1.LE., M U s? j '4' N ,'E PNU T tT Iuj N
,;ABNVA OYY FOA 4'M~O. EI lN EN S 1 kAA'DIRECTNOR NA.'. NNJUA'ju u"'. FL1H -,I,. ENTR :NST NF u '.N'.QftA-fYOFFICE OF PROGRAMS AzY GR' NiAFT I o MO /17' J'.A '. 92NDNOAA RESEARCH .A'.BOYULDER, (,0 du3N NATION-S CLN. FUR AIMNO . Lft. E TN!,
- : ,RAR Y A QjJIS. 1J N OCUutANGAAP.I- I Ns I fT TDIRECTOR ?7.30. bN LJx 47 u - I NN'1N'J )N j N I VES1TFNATIONAL H.RHIS'.NE CENT/A nO.,UEY, '.3J 3)) NORFOLK 'A 13b36NOAA, GABLES ONE TN4ERi32N S. DIXIE HWY. ,NOYI)ADQ ,TMT jNIVLSI TY SRu,'H. "EN.CORAL GABLES. FL. 33146 ATMOSPHEIL S I N::FS )Ed'. NEA vN4, S>TATE UN;gERsITY
ATTN: -SYANIAN 14iv ,'.,,.N.. N AVE.NATIONAL WEATHER SERVI CE F C OLLINsl NCo s '.~ ALANY, NY 1i2 2WORLD WEATHER BLDG.ROOM 307 'HA.IRA Lm'..AFAN, MARINE sCIENCE NEA'T.5200 ADIR ROAO METEDAOLO..Y DEPT. VIRGINIA INST. OF MARINE SdI.LAMP SPRINGS, MO 20023 t'tNT. sT TA ANIEA.3' Ty v T, POINT, N'. 30tY:
sOD NEIKE ALDG.NATIONAL CLIMATIC CENTER A V/U r,!Y PA'RN, &.. -ss*R.3.ATTN: L. PRESTON 0542N? N;VLH'ITY AF MIAMIFEDERAL BLDG. -LIBRARY HI'..AsN No, ,H.ENbA~itk U,,ASHEVILLE, NC 28801 MtLL)YOLO.Y -L'i. vIkjN: AK.Y
MA55'.%HT. IF NA ir n. . .M;' F. 33143DIRECTOR CAMBAIN"Y 1jNATIONAL OCEANO. OATH CENTERAr,.NE'ARNOAA, DEPT. OF COMMERCE jikt-DA M'AIT Mt LOLLEGtROCKVIL.LE, MO JUN52 INSTI Ti, NF NED r iY3lL> To' N,NIENSITY ,F NE, HcA'.
NATIONAL WEATHER SERAIC'E. LOS ANJELES, 'A 900;4 N oNN4, NYDOoEASTERN REGION
ATTN: BEN uIN I wI T 11Y OF AAHSHINGTuN DIA/UTNA585 STEWART ARE. AkTMJS-PHEHIC SCIENCES DEPT. CUASTAL AU ;t NAIT.-TEGARDEN LATY, NF 11530 A'' TA .,w A HGS Q5-USANktA STATE LNIvERsI I,
ATTN: D. HUH, CLARK. HA1 ,CHIEF, SCIENTIFIC SERVICES FLOAD;) At UNiNERSITY dUNTN ROUGE, LA '0H33NWS, SOUTHERN REGION EINOIANNMINT , SC IENCES DEPT.NOAA, ROOM lOEUA TA.,AHASNEE, F, 32306 CHAIRMAN, .24405. 'S.1. N/PT.Al9 TAYLOR STREET DNIWENSITY OF VlINGINIAFT. WORTH, TX lo102 PI,-YTF-,HN' I NsT . DF Nt 4 YORK CL.ARK HALL
ME TtOYD. 4 N IFANS. 'DE PT. LHAU UTtsRVI.LE, N. >HNOAD RESEARCH FACILI TIES CE.NTtR 331 DAY uT.P.O. VON .211/ RD)r..YN, N' 'o J;).MIAMI, F, 3315? ATMONPA/AIC S-A LN.:5 CLT.
DNI A' 4 1 I I3 ) :'A WA1 I Is HI, "AD q AL .M U-I ) ). ,,I1T N %.HARI MI''AOR ' tA IT. -I LS, C A HA0 ANW' L OR L,.A , .f3F1.t '55l -. 'Y'A' H ..TELHNYJLOGY I I, N's') "U'N). -ft HI4b t .L T1V I Dv; H,;q)jANEW TO0t !IN IRVPIHT Y A'4 k2 I M -T/EDYRDj. S0.1 tT YN"3R) NVX, N Y 1 ;)4" .".H iN. "I) ).I. ft 4, 3L--
ji'NN
H: ,' J , ) '<A ';'""
ft )I. Oft 4W-

Instructions for entering Change 1 to NAVENVPREDRSCHFAC Technical Report
TR 82-03, Hurricane Havens Handbook for the North Atlantic Oceant
Page Number/Section: Action:
DD 1473 of Change 1 Replace DO 1473 originally provided
Pp iii, iv of Change I Replace p iii originally provided
P vii of Change I Replace p vii originally provided
Text Sections XII-XVII with Insert in numerical order into publi-tab dividers, of Change 1 cation originally provided, after
Section XI (Gulfport, MS)
9
)
UNCLASSIFIEDSECURITY CLASSIFICATION OF THIS PAGE fWhen Dete Entered)
REPORT DOCUMENTATION PAGE BEFORE COMPLETING FORM
I. REPORT NUMBER NAVENVPREDRSCHFAC 2. GOVT ACCESSION NO. 3 RECIPIENT'S CAT OG NUMBER
Technical Report TR 82-03 A., X4. TITLE (end Subtitle) S. TYPE OF REPORT & PERIOD COVERED
Hurricane Havens Handbook Finalfor the North Atlantic Ocean 6 PERFORMING ORG. REPORT NUMBER
TR 82-037. AUTHOR(f) 6. CONTRACT OR GRANT NUMBER(@)
N00228-80-C-Y402LCDR Roger J.Bo Turpin, RN, & Samson Brand
N00228-8-C-K12N00228-81 -C-KS 23
S. PERFORMING ORGANIZATION NAME AND ADDRESS 10. PROGRAM ELEMENT. PROJECT, TASK
AREA & WORK UNIT NUMBERS
Naval Environmental Prediction Research FacilityMonterey, CA 93940 NEPRF WU O,M&N-I
II. CONTROLLING OFFICE NAME AND ADDRESS 12. REPORT DATE
Naval Oceanography Command June 1982, June 1983NSTL Station ,. NUMER OF PAGESBay St. Louis, MS 39529 45414. MONITORING AGENCY NAME 6 AOORESS(II different from Controllinj OffIce) 15. SECURITY CLASS. (of this report)
UNCLASSIFIEDIS&. DECLASSIFICATION, DOWNGRAOING
SCHEDULE
1i. DISTRIBUTION STATEMENT (of this Report)
Approved for public release; distribution unlimited.
17. DISTRIBUTION STATEMENT (of the abstract entered In Block 20, if different frmee Report)
I. SUPPLEMENTARY NOTES
(1) Qualified requestors may obtain additional copies from the Defense
Technical Information Center (DTIC); all others should apply to the NationalTechnical Information Service (NTIS).(2) Printing history of this publication given on reverse.
19. KEY WORDS (Continue on reverse side It neceeeary and Identify by block nue.ber)
Hurricane WarningsTropical cyclone ForecastsHurricane haven Strike probabilityTropical meteorology
20. AUSTRACT (Continue on mvooe side If necessary and Identify by block number)
This handbook is a ready-reference decision-making aid for commandingofficers and other personnel responsible for the safety of ships facing ahurricane threat. Guidance on assessing a hurricane threat and choosingappropriate countermeasures at specific North Atlantic ports is provided in
-'A the port evaluations in Sections If-onward. The handbook is not directedexclusively to ships at these ports, however, and the general guidance inSection I will assist ships at other ports or at sea.
DD , JAN 1473 EDITION OF 1 NOV S5It .5eLL UNCLASSIFIEDS/N 0102"014" O(C6ae CURITY CLASSIFICATION Of THIS PAGE (When Dete ft,.eoeE)

UNCLASSIFIEDSECURITY CLASSIFICATION OF 7HIS 'AGECI3em Cate EPIeNe)
Block 18, Supplementary Notes, continued.
Printing history of TR 82-03:
(1) Advance draft copies of Sections II, III, IV, V, and VIIprovided to CINCLANTFLT between 20 May and 8 September 1981.
(2) Basic volume containing Sections I-XI (less port of Newport, RI,Sec. IX) published and distributed June 1982,
(3) Additional port evaluations, Sections XII-XVII, published anddistributed as Change One June 1983.
IJ
UNCLASSIFIEDSECURITY CL ASIPICATION OP THIS PAGE(Wen Dee Intere)

CUNTENT', CO NTINUED
IX. NE WPORT , RHOLt iSLAND . . . . . . . . . . . . . . . . . to be pub I isned J
X. PENSACOLA, FLOR IDA . . . . . . . . . . . . . . . . . . . . . . Y-
Sumim a ry . . . . . . . . . . . . . . . . . . . . . . . . . . . X - iI. Location and Topography . . . . . . . . . . . . . . . . . X-22. Port and Harbor Fac i ties ........................... -?3. Analysis of the Tropical yclone Threat at Pensacola .',-.4. The Decision to Evade or ,emain in Port .. ... . . ....... -
t) . Advice to Shallow Draft Vessels . . . . . . . . . . . . .References .............. ...........................
XI. GULFPORF, M>4 ,SI SIPPI . . . . . . . . . . . . . . . . . . . . .
Summary ................ ............................ -1. Gieographic Location and Topography . . . . . . . . . . . .2. Port and Harbor Facilities ......................3. Analysis of the Tropical Cyclone Threat at 2u fpor . . .4. The Decision to Evade ur Remain in Port . . . . . . . . .o. Advice to Shallow Draft Vessels ... .. .. . ............ ,-References . . . . . . . . . . . . . . . . . . . . . . . . . .
XN. V URLL ,S , L0OU ,: iA . . . . . . . . . . . . . . . . . . . . ,-
Suommary .............. .............................1. Geographic Location and Topography ... .. ............. X 22. Port and Harbor Facilities . . . . . . . . . . . . . .. x::"3. Analysls of the Tropical Cyclone Threat aL New jrleans .
4. The Decision to Evade or Renain in Port. . .. ... ...... 2o. Advice to Shallow Draft Vessels . . . . . . . . . . . . .References . . . . . . . . . . . . . . . . . . . . . . . . . .
xIV. PORI -RfHUR, TEXAS . . . . . . . . . . . . . . . . . . . . . .
Summary .............. ............................ XII iGeograpn1,i Location and Topography . . . . . . . . . . . .
2. Port and Harbor Facilities .... . ... ................ XI-43. A-lysis of the Tropical Cyclone Threat at Port Arthur . XI>-94. ,ne Decision to Evade or Remain in Port .... ......... X 1 1-2t. Aovice to Shal low Draft Vessels . . . . . . . . . . .. . XI',-31References ............ .......................... i,-33
XIV. TAMPA, VLORI3A ... . . .... ..... . . . ...... V-!
u111.1a ry ................ ............................ x iV-IGeographic Location and Topography ... ............ XIV-2
2. Port and Harbor Facilities ......................3. Analysis of the Tropical Cyclone Threat at Tampa . . . . .4. The Decision to Evade or Remain in Port .... ......... xV-5. Advice to Shallow Draft Vessels .... ............. XIV-3dReferences ............. .......................... XiV-32
Change I iii

JNTN , C 0 IT INUL
XV. BOST)N, MASSACHUw LFr .s . . . . . . . . . . . . . . . . . . . .
Su11m a ry . . . .1. Geojraphic Location and Topography . . . . . . . . . . . .2 . Ine Harbor , Approaches and Fd i e t es . ... ..... xV-3. Heavy Weather Facilities and Hurricane Anch ora'jes . . . . XV-.4. Tropical Cyclones Affecting Bosto)n . . . . . . . . . . . . ,U-i5. Tne Decision to Evade or Rer nin i n Port . . . . . . . . . X '-b Ratiuna1- for Evasion at Sej . .v-2,
ferences . .- /
XVI. NL W Y . . ..K .A. ..u , NEW YJK ....
S JIlId ry ............ ............................ V-I.. 'eoyrjphi LocaLion and T poyrdphy ...... . . .......... XV -2. Tie Harbor Area Lnd its Faci I ties ........................... -23. Heavy Weatne,- Consijerdtin .............................. .....4. Tropical Cycon s ffectng Ijew Yor' Harbur ... ....... U'). Tne Decision to Evade or Re. ain in Port .... ......... V-2References .............. ......................... . -32
x 14. PH 1A ' L P A, P L N Y'_ V . :i . . . . . . . . . . . . . . . . . .
,1,h;1Id ry ............ ............................ ...oeodraphi - L ocati n and opo jrapny ...... ............ X
2. Harbor Facilities ............ .................... x v3. Heavy Weatier Plans . . . . . . . . . . . . . . . . . . . XV4. Tropical Cyclones Affectin3 Philadeiphia .... ......... ''
.n Deci sian t t va I, or ke.;Ia1i q i Port .References ........... .......................... x. 2
iv

IY TR ()1) tATI () N
CAUTION:
None of the deep-water harbors evaluated in Sections II-XVII possessthe exceptional qualities needed to safeguard ocean-going vesselsfro-: damage in a "worst-case" direct hurricane strike.
Tne impact of a hurricane strike at a particular port varies widely and can,
to sorne degree, be forecast according to the particular threat's circumstances.
This handbook provides guidance on assessing a particular hurricane threatin such a way that a reasonable choice can be made between two options -- remainingin port or putting to sea -- with this decision based on a reasoned comprorisebetween a harbor's protective qualities . and unnecessary, wasteful sorties.
This handbook is not dedicated exclusively to vessels located at the portsevaluated as nurricane havens in Sections II-XVII. The general guidance provided inSection I will be of value in the decision-makino processes aboard ships threatenedby hurricanes at other non-evaluated ports or' at sea in the North Atlantic Oceanand Gulf of Mexico.
Locations of evaluated ports are shown in the figure below. Roman numerals onthe locator map correspond t; the nui-erals designating handbook sections/ports.
XV
.- _ 400
!=5- X \vi
SXV SEC PORT
-I NORFOLK,VA- I I CHARLESTON,SC
I V KE wEST,FL
- ___ I _ V MAYPORTFLVI KINGS BAY,GAVII MOREHEAD CITY,NC
Si VIII NEW LONDON,CT,I IX NEWPORT,RI
I X PENSACOLA,FLV XI GULFPORT,MSV 0 xII NEW ORLEANS,LA
300 XIII PORT ARTHURTXXIV TAMPAFLXV BOSTON,MAXVI NEW YORK,NYXVII PHILADELPHIA,PA
900 IV-~ 800V
,-- 20° ..
Ports evaluated in Sections II-XVII.
Change I vii
44

2c
I-o3E
CD
2c.

XII: CONTENTS
1. Geographic Location and Topography XII-2
2. Port and Harbor Facilities ........... XII-4
3. Analysis of the Tropical CycloneThreat at New Orleans ... ........ XII-7
4. The Decision to Evade or Remain In Port o XII-21
5. Advice to Shallow Draft Vessels . . . .. XII-25
References . 0 0 XII-26

XII. NEW ORLEANS. LOUISIANA
SUMMARY
New Orleans' location in the hurricane belt, and theabsence of sheltered facilities and anchorages, render it apoor hurricane haven. It is recommended that deep draftvessels evade at sea when New Orleans is threatened byhurricane force winds (greater than 63 kt). Early threatassessment is absolutely essential due to the distance thatmust be traveled to reach open water (as much as 135 miles)and to the limited number of evasion routes in the Gulf ofMexico.
Advice to small craft is to remove from the water.Otherwise, seeking shelter in the Pearl River on theLouisilana-Mississ ippi border is recommended. Little shelterfrom wind or tidal surge is available at the Port of NewOr leans.
New Orleans i the largest port in the Jnlited t teand the third largest in the world. It is an extrene y t isyshipping terminal that handles vessels wit'i dra> 's to 40 ftas well as a multitude of smaller vessels enqaqe' 1variety of marine transportation and service activ it ies.River barge traffic is particularly evident as New Orleansis the southern terminus of the Mississippi River naviqationsystem.
History has demonstrated that the hurricane seasonposes a real and serious threat to marine activities at NewOrleans. New Orleans has been affected by tropical cycloneactivity at an average frequency of 1.2 events per year.One out of 7 tropical storms/hurricanes passinq within
180 n mi of New Orleans has caused sustained winds greaterthan 33 kt in the New Orleans area. One out of 15 tropicalstorms/ hurricanes has caused winds gusting to hurricaneforce (64 kt or greater).
The hurricane season extends from late May throughearly November, with September being the major threat month.The principal threat to New Orleans is from tropicalcyclones approaching from the southeast, south, or south-west. Eighty percent of all tropical cyclones entering the180 n mi critical area in the 109 year period of 1871through 1979 approached from these directions.
This hurricane haven evaluation was prepared byR.D. G;ilmorc Cocean Data Systems, Inc. (ODS1),Monterey, CA 3940.
Change 1 XII-I

N W (ORILANS. IA'
1. GEOGRAPHIC LOLATION AND TOPOGRAPHY
As shown in Figures XII-1 and XI-2, the Port of New Orleans is located on
both banks of the Mississippi River in the southeast section of Louisiana. The
lower and upper limits of the Port are approximately 81 and 115 miles above Head
of Passes, a common reference point on the Mississippi River which is located at
the junction of Southwest Pass and South Pass, the two main channels leading to
the Mississippi River. Head of Passes is 20 miles above the seaward entrance to
Southwest Pass (Figure XII-3).
The banks of the Mississippi River comprise the highest terrain in the
area, with much of the developed land area along the river actually being below
sea level. An elaborate levee system has been constructed by the U.S. Army
Corps of Engineers to protect low lying areas from flooding.
N
ORLEAS . " ""MISSISSIPPI
.... ' "-.:;"OUTLET,
HEAO OF 4
, PAS3ES
(MILE 0)
SOUTHWEST "PASS SOUTH PASS
Gulf of Mexico SCALE.OF,..U0 iG 20) 30
Figure X1l-1. Mississippi River delta.
XII-2
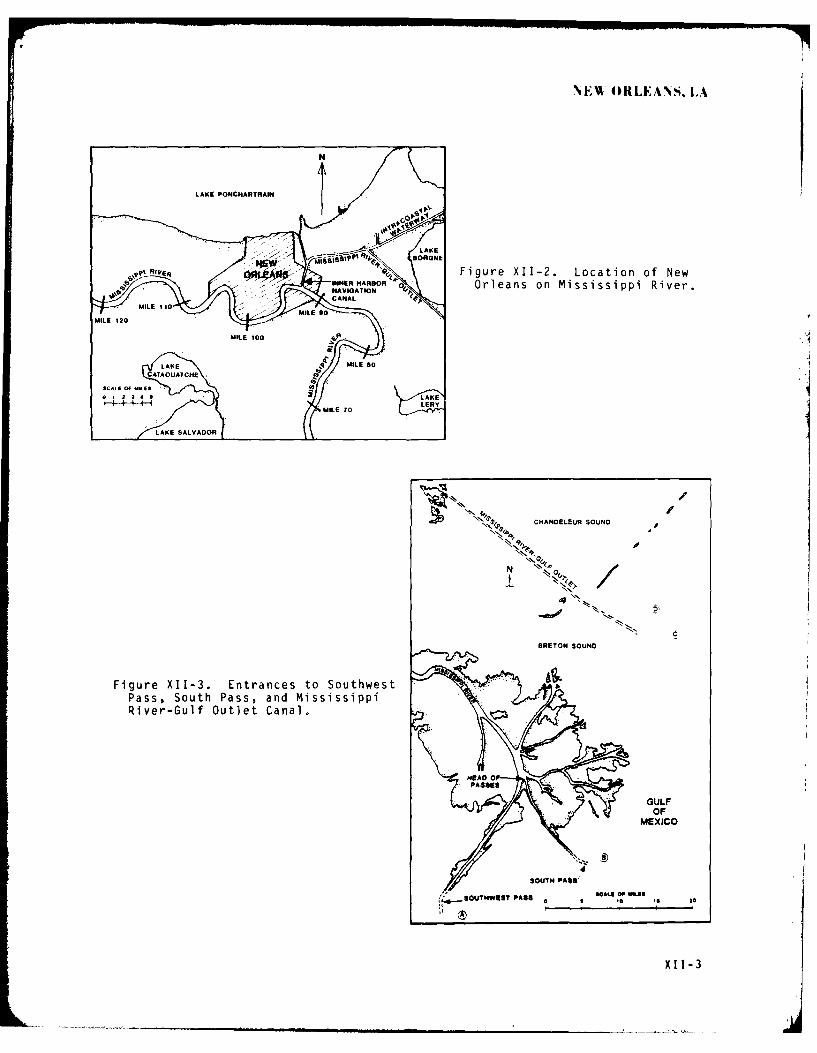
NEW41IRLEANS, LA
N
LAKE PONCbHARTRAIN
- LAKE
Q'%Ri RFigure XIJ-2. Location of New
INNER ARBO Orleans on Mississippi River.
CNALAIN G
AILE 90
SCLE 120~S
LERY,MIL.E TO
LAKE SALVADOR ___________________________________
""T CHANDELEUR SOUND
-boo,
N RTN ON
Figure~ ~ ~ ~ ~ /I-.Etacst otwsPassSout Pass andMissisipp
Rive-Gul Outet Cnal
mEAD OPREON OUN
GULF
MEXICO
I...SOUThW2ST PASS 8CL OP %WEB0
XI 1-3
NEW ORLEANS. LA
The Port of New Orleans can be reached from the Gulf of Mexico by two main
routes. The first, and primary, route is via the Mississippi River, which may
be accessed by ships using Southwest Pass or South Pass (Figure XII-3). A
Federal project provides for a 40-ft channel over the bar and through Southwest
Pass, and a 17-ft channel over the bar and through South Pass, to Head of
Passes. The project further provides for a 40-ft channel from Head of Passes to
New Orleans (U.S. Department of Commerce, 1980).1
A second route to the Port of New Orleans is via the Mississippi River-Gulf
Outlet Canal (Figure XII-3), a 66-mile channel that extends northwest from deep
water in the Gulf of Mexico to the Inner Harbor Navigation Canal at New Orleans.
The Federal project provides for channel depths ranging from 36 to 38 ft. Final
access to the Mississippi River is via a 640-ft lock at New Orleans. Sill depth
at the lock is 31.5 ft at low water (U.S. Department of Commerce, 1980).2
There are no bridges or cables across the Mississippi River below New
Orleans, but two bridges cross the river at New Orleans. A high level fixed
highway bridge connecting Algiers and New Orleans, 0.6 mile above Canal Street,
has a clearance of 150 ft over a central 750-ft width. The Huey P. Long Bridge,
a combined highway and railroad bridge crossing the river 9.6 miles above Canal
Street, has a clearance of 135 ft for a channel span width of 500 ft (U.S.
Department of Commerce, 1980).
One bridge and two cables cross the Mississippi River-Gulf Outlet Canal
below the junction with the Inner Harbor Navigation Canal at New Orleans. The
Paris Road Bridge, a fixed bridge with a clearance of 135 ft, is located about
4.3 miles east of the junction with the Inner Harbor Navigation Canal. The
overhead power cables across the canal near the Paris Road Bridge have a
clearance of 170 ft (U.S. Department of Commerce, 1980).
2. PORT AND HARBOR FACILITIES
2.1 BERTHS FOR DEEP DRAFT VESSELS
The Port of New Orleans hasmore than 180piers and wharves located on both
sides of the Mississippi River, the Inner Harbor Navigation Canal, and the
Mississippi River-Gulf Outlet Canal. In addition, over 100 additional facili-
ties for small vessels and barges are located on adjacent waterways. Approxi-
mately one-half of the deep-draft facilities are for public use and operated by
the Board of Commissioners of the Port of New Orleans. Alongside depths on the
Mississippi River facilities generally equal or exceed 30 ft, and deck heights
average 22 ft. Some alongside depths and deck heights are less.
iContact the New Orleans District, Corps of Engineers, for controlling depths.
2 See Notice to Mariners and latest editions of charts for controlling depths.
XII-4

NEWM(RIEANS. IA
The primary reason for the unusually high deck heights is the variation in
water levels of the river. At New Orleans the extreme difference between high
and low stages of the river is 20 ft with the mean difference near 14 ft. The
average dates of high-river stage and low-river stage occur in April and October
respectively. Zero on the Carrollton river gage (near mile 103) is Mean Sea
Level (U.S. Department of Commerce, 1980).
Alongside depths and deck heights for facilities on the Inner Harbor
Navigation Canal, the Mississippi River-Gulf Outlet Canal, and adjacent
waterways have little uniformity. Complete details of berthing facilities at
the Port of New Orleans are to be found in Port Series No. 20 published in 1981
by the U.S. Army Corps of Engineers. The publication also provides details of
55 diesel-operated tugs, ranging from 750 to 4,000 horsepower, used for docking
and undocking vessels on the Mississippi River.Facilities at Naval Support Activity, New Orleans are located near mile
92.8 on the river (Figure XII-4) where the Navy maintains a 374-ft pier on the
west bank. With a deck height of 20 ft and an alongside depth of 35 ft, the
pier is normally occupied by the USS William C. Lawe (D-763). Several U.S.
Navy small craft utilize facilities located on the shore (south) side of the
east end of the main pier structure.
rN
Z
-
0*
O49%
U.S. NAVY Pln
'He.
Figure XII-4. Location of U.S. Navy
Pier facilities on Mississippi River.
XII -5

NI'NN 0RLEAN'S, LA
The U.S. Government also owns and operates the Poland Street Wharf on theeast bank of the river opposite the Naval Support Activity pier just described.
The Poland Street Wharf has a 2,193-ft face with alongside depths of 32 to 75ft, and a deck height of 25.5 ft. It is used primarily by the Military Sealift
Command, but a section of the pier is ]eased to a private steamship corporation.
2.2 HEAVY WEATHER FACILITIES AND ANCHORAGES
The Port of New Orleans offers little shelter from heavy weather. The
winding course of the Mississippi River makes some portion of the port
vulnerable to wind regardless of direction. The low elevation of the
surrounding terrain eliminates any protection that orographic features usually
provide, so the only barriers to wind flow are the buildings at or near the
piers.Anchorages for large vessels include the Southwest Pass Anchorage located
southeast of the entrance to Southwest Pass, South Pass Anchorage located
northeast of the entrance to South P..ss, and the Mississippi River-Gulf Outlet
Canal Fairway Anchorages located east and north of the Mississippi River-Gulf
Outlet Approach Light Horn Buoy. These anchorages are indicated by letters "A"
through "D" respectively on Figure XII-3. There is a 4.5 mile long anchorage
off the west bank of the Mississippi River opposite Pilottown (1.7 miles aboveHead of Passes) for vessels which cannot proceed to sea because of fog at the
Gulf entrances to the passes, or are unable to proceed upriver for the same or
any other reason (U.S. Department of Commerce, 1980).
DMA Map 11368 specifies a quarantine anchorage on the west bank of the
Mississippi River at mile 91 above Head of Passes, and a general anchorage at
mile 90.
Temporary anchorages may periodically be prescribed between Head of Passes
and mile 223 above Head of Passes by the U.S. Coast Guard District Commandant(U.S. Department of Commerce, 1980). Several such anchorages are indicated on
the DMA map series for the Mississippi River. Although the river anchorages
have mud bottom with generally good holding qualities, none are recommended asheavy weather anchorages due to heavy river traffic and restricted navigation
room in the river channel. If heavy weather anchoring is indicated, it should
only be considerel for heavily ballasted vessels in designated areas on the
widest portions of the river.
As specified by Captain of the Port New Orleans Information Bulletin No.
26A, 1 June 1982, and in accordance with Title 33 Code of Federal Regulations
(CFR) 165 (Safety Zones), the following areas are designated as Safety Zones
upon implementation of Hurricane Condition Four -- hurricane winds possible
within 72 hours; vessels are not to be moved or anchored:
XII-6

NE% ORLEANS. 1,A
(1) Within the Mississippi River:
Within 500 ft of any water intake.
The forebays or tailbays of all locks.
The lower 400 yards of the New Orleans General Anchorage.
(2) Within the Inner Harbor Navigation Canal:
On both the east and west banks, approximately 100 yards southof Florida Avenue Bridge and 50 ft channelward.
On the West Bank, south of the Seabrook Bridge approximately200 yards, and 50 ft channelward.
(3) Within Lake Ponchartrain (for commercial marine traffic only)
Tugs are normally used for assisting in docking, undocking, towing in the
harbor and canals, and towing to sea. Two tugs must be employed on all towing
to and from drydocks and should be employed on all ships towed around Algiers
Point when the traffic lights are operating, and by large vessels going through
the Inner Harbor Navigation Canal (U.S. Department of Commerce, 1980). Tugs are
generally in plentiful supply, but in view of likely increased demand when heavy
weather is expected, arrangements for tug services should be made as early as
possible.
In the event of damage, complete facilities are available for making
repairs to hulls and machinery.
2.3 FACILITIES FOR COASTAL AND IN-SHORE VESSELS
The Port of New Orleans is generally free of pleasure boats and commercial
fishing boats. Most of these type vessels utilize the docks and marinas
located away from the Port area on Lake Ponchartrain, and on numerous small
canals and bayous that permeate the entire Mississippi River delta area.
Coastal shipping vessels are accommodated in the Port of New Orleans at the
many facilities constructed for that purpose. Docking, bunkering, repairs,
food, water, ice and marine supplies are all available.
The Naval Support Activity can provide, or arrange for, all necessary
facilities for supporting U.S. Navy vessels visiting or stationed at New
Orleans.
3. ANALYSIS OF THE TROPICAL CYCLONE THREAT AT NEW ORLEANS
3.1 INTRODUCTION
By examining relevant characteristics of tropical cyclones such as track,
speed of movement, intensity, month of occurrence, etc., some insight may be
gained into their typical behavior. This background knowledge and understanding
allows attention to be focused on those storms most likely to have a serious
XII-I

N%% (ORLEA.NS. LA.
effect on New Orleans. However, the historical behavior of storms and their
impact on New Orleans should not be regarded as a reliable guide to the detailed
behavior and impact of a particular storm as it approaches the port.
3.2 CLIMATOLOGY
For the purpose of this study, any tropical cyclone approaching within
180 n mi of New Orleans is considered to represent a threat to the port.
The outstanding feature of the U.S. Gulf Coast region is its location on
the north shore of the Gulf of Mexico and its orientation perpendicular to
normal tropical cyclone tracks as they move more or less northward out of the
tropics. Also of importance is the region's position between 25 and 30 degrees
north latitude; this is within the normal locus of tropical cyclone recurvature,
which oscillates between latitudes 25N and 35N during the tropical cyclone
season. This latter factor is significant since it is the character of tropical
cyclones to slow and intensify during the recurvature stage. During this phase
of the tropical cyclone life cycle, it is difficult to predict with great
accuracy the rate of recurvature, the storm speed of movement subsequent to
recurvature, and obviously the storm's precise future position at a point in
time.
The hurricane season along the Gulf Coast is late May through early
November. During the 109 year period between 1871 and 1979 there were 134
tropical cyclones that met the 180 n mi threat criteria for New Orleans, an
average of 1.2 per year. Table XII-1 shows the monthly totals and percentages.
These dati are graphically presented in Figure XII-5.
Table XII-1. Monthly totals of tropical cyclones passing within
180 n mi of New Orleans during the period 1871-1979.
Month Number % of Total
May 2 1.5
June 11 8.2
July 15 11.2
August 24 17.9
September 59 44.1
October 22 16.4
November 1 0.7
Figure XII-6 illustrates 128 events as a function of compass octant from
which tropical cyclones have approached New Orleans.* The numbers in
parenthesis represent the percentage of cyclones from the sample approaching
from a particular octant. This figure shows that the major threat sector
extends from the southeast through the southwest.
Some tropical cyclones developed with ln 180 n mi of New Orleans, so an approachdirection is therefore not included for those storms.
XII-8

\EEN 0HRIEA\S. IA..
64
56
48
z0Figure XII-5. Seasonal distribution
40 of tropical cyclones passing within
180 n mi of New Orleans, May-November (based on data from the
0 32- period 1871-1979).
0
Ix 24-U&
0*
j F M A U J J A S , N 0
MONTH
/ /
Figure XII-6. Directions ofapproach of tropical cyclones N
that passed within 180 n miof New Orleans during theperiod 1871-1979. Numbers of 6 o. W E 17
storms approaching from each (5%)octant (eog., 43) and percentof the total approachingfrom that octant (e.g., 34;)are shown.
/L(17%) /(2943 (J4%)
i / 4a j,, ! \

It is significant to note that a small number of tropical cyclones
developed within a 180 n mi radius of New Orleans. Three developed quickly into
hurricanes while in the threat area.
Records of tropical cyclones passing through the 180 n mi critical area
during the 80 year period for which cyclone intensity data are available are
tabulated in Table XII-2 by intensity and month of occurrence. Of the 102 such
occurrences it can again be seen that September is by far the principal threat
month in terms of numbers of tropical cyclones affecting New Orleans. October
and November, however, have a slightly higher percentage of the more dangerous
classes of storms 12 out of 15). Overall 72 out of 102 tropical cyclones (71%)
affecting New Orleans in this century were in the strong (over 47 kt) category.
Table XII-2. Classification of 102 tropical cyclones which passed
within 180 n mi of New Orleans during the 1900-1979 period.
Maximum May- Oct.-Intensity* June July Aug. Sep. Nov. Totals
Hurricane 2 3 9 21 5 40
IntenseTrop1cal 5 3 2 732Storm
!eak
sropical 19Storm
Tropical 1 3 2 4 1 II
Depression
TOTALS 1i 12 18 46 15 102
*Intensity values reflect the maximum intensity while in the final
approach phase of the tropical cyclone track. Upper limit of a WeakTropical Storm is 47 kt.
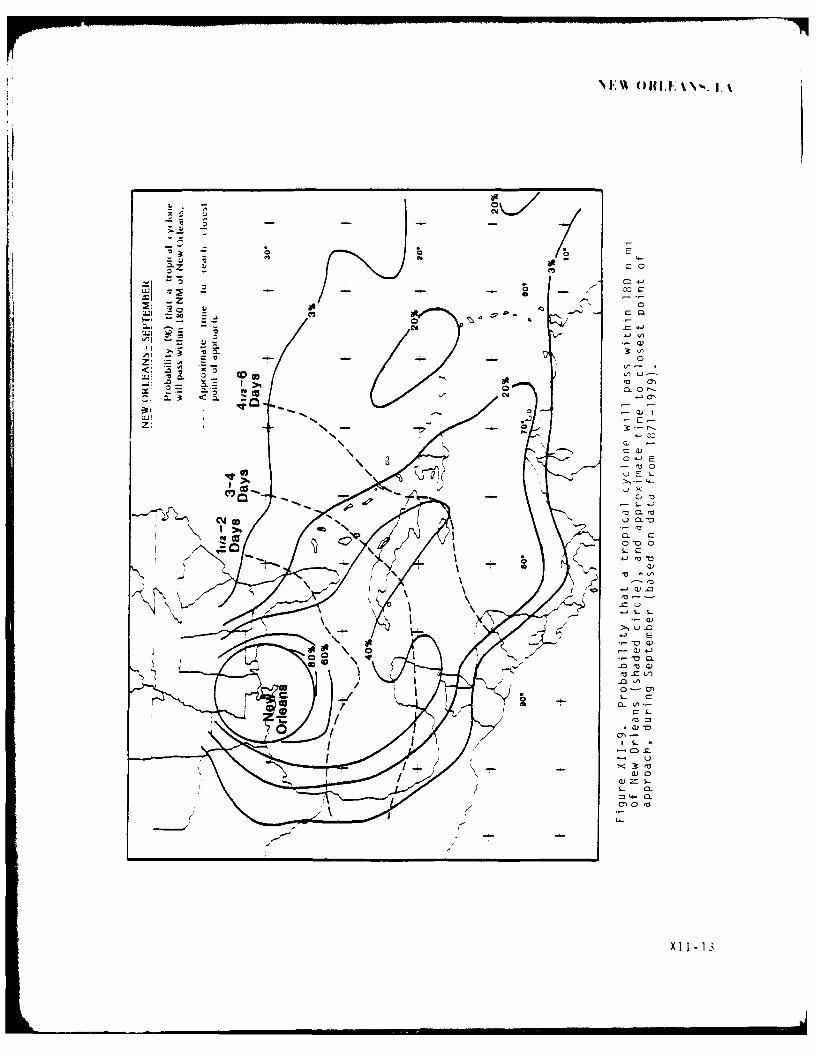
Figures XII-7 through XII-11 are statistical summaries of threat
probability for the years 1871 through 1979. These summary data are presented
in five charts, each representing data encompassing specific periods during the
year: tropical cyclones occurring during May and June, July and August,
September, October and November, and all tropical cyclones of record during the
109-year period.
The solid l ines in these figures represent the "Percent Threat" for any
storm location. The dashed 1ines represent approximate approach times to New
Orleans based on the climatological approach speed for a particular location.
For example, in Figure XII-7, a tropical cyclone located over the northwest
corner of the Yucatan Peninsula has a 40% probability of passing within 180 n mi
of New Orleans and will reach New Orleans in 72 to 96 hours (3 to 4 days).
X1 1-10

aa C
u 0
0 00
3.. 0S.
Z~~ E -o~ ~a
Cn e
L3.~-. L0 N)W
a 0WWca
ThZ CJ
0) e
LL.

300
ClC
5 0 C
-- x -0
Z0 A
Cl C)
40\~T 0 -
I I, - 12-
C- 0
C.,)
at 0Lu CL - Q
3J-
,~ ~cu- -: 0
o o
Q 0
- L -
Z: S
S- c
X I

N FA. O)RLENS IA
C 4
fi 0
UJ~4 I~-
4.- 0-
'A
0 S-
3: E~. 4
-0. E -
L) . Q '
-0 3 2- '
0.. 0)
00,
.0
CS..
L
.. 0 a

* k * N1 _ At L It AN
.. If-2*d *~ is" NM " 0
3-4Days 4,,a-6
t Days/ 7'
,' /
j 01 // ) *- '
AnI
40% ' ,
k t
20% /20%
3% -- -~ --
Figure XII-11. Annual probability and CPA curves for alltropical cyclones passing within 100 n mi (shaded circle)of New Orleans, based on data from 1871-1979,
The average speed of advance for all tropical cyclones with winds of at
least 34 kt that have threatened New Orleans is 8 kt, with a 7 kt speed evident
in June and July increasing to 10 kt during October and November (Neumann and
Pryslak, 1981).
A comparison of the figures suggests some distinct differences in threat
axis according to time of year. Early in the season (Mdy and June, Figure
XII-7) the main threat to New Orleans is a track from just south of Jamaica
northwest across the western tip of Cuba to the central Gulf of Mexico then
northward to New Orleans. A secondary threat axis extends from the western
portion of the Yucatan Peninsula northward to New Orleans.
As the season progresses into July and August (Figure XI-8) the main
threat axis shifts northward, following the Bahama Islands northwestward across
Florida, thence west-northwestward across the northern Gulf of Mexico to New
Orleans. A secondary threat axis is located from the western Caribbean Sea just
east of northern Nicaragua north-northwestward through the Yucatan Channel to
New Orleans.
In September (Figure XII-9) the main storm threat shifts southward, and
extends from the Lesser Antilles northwestward across Cuba and Gulf of Mexico to
New Orleans. A secondary threat axis extends northwest from the Yucatan
Penin:ula to the western Gulf of Mexico thence northeastward to New Orleans.
XI I-15

The primary threat axis for October and November (Figure XII-10) starts at
the north end of the Lesser Antilles and extends westward, passing over the west
end of Cuba to the central Gulf of Mexico, recurving northward to New Orleans.
A minor threat axis extends across central Florida westward to New Orleans.
Figure XII-1i represents a composite picture of threat probability and time
to CPA curves for the entire year and is derived from all tropical cyclone
tracks passing within 180 n mi of New Orleans during the period 1871-1979.
3.3 WIND AND TOPOGRAPHICAL EFFECTS
Wind data for this evaluation have been extracted primarily from hourly
records of the New Orleans Airport Station with supplemental data extracted from
hourly records of Naval Air Station, New Orleans. Data from other, more remote,
stations were reviewed but were considered to be non-representative of condi-
tions in the port area. A comparison of records for coincident time periods
showed that, although the landscape around New Orleans is of generally low
elevation, it does reduce wind speeds from that experienced at exposed locations
around the peripnery of the Mississippi River Delta.
In the 48-year period (1932-1979) for which wind data are dvailable, 68
tropical cyclones approached within 180 n mi of New Orleans, an average of 1.4
per year. A tabular breakdown based on intensity of these cyclones while within
the 180 n mi radius is shown in Table XII-3.
Table XII-3. Classification of the 68 tropical cyclones which passed within
180 n mi of New Orleans during the period 1932 through 1979.
Hurricane Tropical Storm Tropical Depression Total (No.)
(,63 kt) (34 to 63 kt) (-34 kt)
24 36 8 68
Of the 60 hurricanes and tropical storms, 9 caused sustained winds greater
th n 33 kt in the greater New Orleans area, based on hourly wind observations
from 1932 through 1979. Three of the 9 caused sustained winds of 50 kt or
greater and 4 of the 9 caused gusts reaching hurricane force. Only one storm,
the hurricane of September 1947 which passed directly over New Orleans, caused
sustained winds of hurricane force. That particular storm originated east of
the Cape Verde Islands near the west coast of Africa, and had traveled
approximately 4,000 n ml before causing winds of 95 kt with gusts to 109 kt at
New Orleans. Based on the 1932 through 1979 wind data, gale force winds can be
expected from 1 out of every 7 tropical storms/hurricanes passing within
180 n mi of the port.
XII-16
I I H I II I II , . . . . .

Figures XII-12 through XII-14 display the tracks of all 9 tropical cyclones
(Neumann et al., 1978 and Hebert, 1980) that produced sustained winds greater
than 33 kt at New Orleans. Three figures are used simply to reduce clutter.
Five of the tropical cyclones occurred in September, two in August, and one each
in July and October. Also depicted are the tracks of 10 of the more signiticart
storms producing sustained winds of over 22 kt at New Orleans. It is signifi-
cant to note that 16 of the 19 cyclones approached from a general south or
southeasterly direction.
As was mentioned in Section 2.2, the winding course of the Mississippi
River makes a portion of the port of New Orleans exposed to the vagaries of the
wind regardless of direction. The low elevation of surrounding tprradin ettec-
tively eliminates orographic barriers, so the buildings at or near the piers
provide the only real barriers to wind flow. In general terms, however, tne
east-west orientation of the river in the most heavily utilized areas ut the
port renders the port most vulnerable to winds with strong east or west coripo-
nents. The port would be most protected from north or south winds becaase ,* tnie
frictional effects of terrain and the protection the buildings along the rive,-
could provide.
4 WAUG JUN
1134
JUN LAU
trck93394,hoin ost/n
-- --- -r e \," ,_.,-- . .-"103 " I ,
SEP"i ' ,
..")<. '. Figure Xll-12. Tropical cycloneY : - 7 ' - "'- _ ' tracks 1934-40 showing positions
of storms when winds greaterthan 22 kt (thin solid segment)and greater than 33 kt (broadsolid segment) occurred at New
t/" - i"--"".Orea s bae on hourly.. ._-
xI-l
x 17

NE%% OhIEANS. IA'
,SSap/, -i
063 ace
I I/ . . -
w Figure XlI-13. Tropical cyclonesap. tracks 1941-53 showing positions
, *of storm centers when winds
P /A- greater than 22 kt (thin solid-- segment) and greater than 33 kt(broad solid segment) occurredat New Orleans, based on hourly
. - wind data,
-JUL. SEP
AGN.- /
se, -7 ' \! New - oc" ,.I ga-15
19?4 M#an 18
Figure XII-14. Tropical cyclonetracks 1956-79 showing positionsof storm centers when winds --- --..greater than 22 kt (thin solidsegment) and greater than 33 kt(broad solid segment) occurredat New Orleans. based on hourly <'-wind data. ! i I---
'S
XIl-18

3.4 WAVE ACTION ON THE MISSISSIPPI RIVER
Ocean waves are a factor on the Mississippi River only in cases of
ex trem elIy h igh t idalI surge when the l evees are topped or broken. The potential
for this occurrence is greatest in the lower reaches of the river and negligible
in the port area. Wave action in the port is therefore limited to locally
generated wind waves.
The winding course of the river in the port area effectively reduces fetch
length to no more than approximately 8 miles. If channel depth of 40 ft and
tidal surge heights of 10 ft are assumed, giving a water depth of 50 ft, the
maximum waves generated by an 85 kt wind in the port area of the Mississippi
River would be about 10.3 ft with a period of 6.3 seconds. Given the same water
depth and fetch length, calculations indicate a sustained wind of 25 kt can
generate 2.9 ft wind waves; 35 kt winds, 4.3 ft wind waves; 50 kt winds, 6 ft
wind waves; and 75 kt winds, 9 ft wind waves (U.S. Army Corps of Engineers,1973) .
At a more realistic fetch length of 5Smiles, the wind wave heights are
reduced by about 10-15 percent. Eliminating tidal surge and basing calculations
on a 40 ft water depth has litt le effect on the result with wind wave heightsremaining essentially the same until the wind speed exceeds 75 kt. Maximum wave
heights for an 85 kt wind are then reduced to about 9.5 ft.
It should be noted th t the preceding calculations are based on a uniform
depth over an assumed relatively flat bottom. Uniform depths are not realistic
in the Mississippi River, as the channel is invariably deeper than the river
bottom adjacent to it, and the channel depth varies greatly from one location to
another -- as deep as 192 ft in one location in the port area. Consequently,
the calculated values given above are for use as a guide only and should not be
regarded as absolute values.
3.5 STORM SURGE AND TIDES
Storm surge may be visualized as a raised dome of water, moving with the
storm, and centered a few miles to the right of its path. This dome height isrelated to local pressure (i.e., a barometer effect dependent on the intensity
of the storm) and to local winds. Other significant contributing factors are
storm speed, direction of approach, bottom topography, and coincidence with the
astronomical tide. The worst circumstances (Harris, 1963) would include thefol lowing:
(1 Intense storm approaching perpendicular to the coast with landfallwithin 30 n mi to the west.
(2) Broad, shallow, slowly shoaling bathymetry.
(3) Coincidence with high astronomical tide. XII-19

The coastal waters surrounding the Mississippi River delta fulfill these
criteria during hurricane season.
Two instances of storm surge that caused extensive flooding to the
Mississippi River delta occurred during September. Hurricane Carmen, a 150 mpn
storm, occurred in September 1974, and, although severe flooding was experienced
in several outlying parishes, water rises caused by Carmen caused little flood
damage in the Port of New Orleans. Tidal surge increased water levels along the
coast at Terrebonne Parish (some 60 miles southwest of New Orleans) to 11.64 ft
MSL, nearly 10 ft above normal. Water rises in the Mississippi River were limited
to 3 to 4 ft in its lower reaches, so the Port of New Orleans was not adversely
affected (U.S. Army Corps of Engineers, 1975).
Hurricane Betsy, which occurred in September 1965 was another story,
however. Betsy followed what is essentially a "worst case track," moving inland
just west of the mouth of the Mississippi River on a northwesterly course. ThIs
track brought the brunt of the 125 mph winds along the length of the river to
New Orleans, and into the relatively shallow waters of Lake Borgne, Lake
Ponchartrain, Breton Sound, Chandeleur Sound, and Mississippi Sound. Except for
Orleans Parish and Jefferson Parish, most of the Mississippi River Delta was
inundated by flood waters. Although not as strong as Carmen, Betsy played havoc
with interests along the Mississippi River from the Port of New Orleans
southward. Tidal surge increased water levels on the Mississippi River to
12.61 ft above MSL at Chalmette (near mile 88), 15.25 ft above MSL at West
Pointe a la Hache (near mile 49), and 6.57 ft above MSL at Head of Passes (U.S.
Army Corps of Engineers, 1965).
A new storm surge forecast model has been developed by the National Oceanic
and Atmospheric Administration's (NOAA) National Weather Service. It is
referred to as SLOSH and estimates the Sea, Lake, and Overland Surges from
Hurricanes (Jelesnianski and Chen, 1979) as discussed by Schexnayder and Barnes
(1980) and Crawford (1979). Values have been computed for the New Orleons area
using a SLOSH model with a 4 n mi grid. Eighteen storm tracks were evaluated,
comprising six directions of travel, with three parallel tracks for each
direction. Three storm intensities were chosen, with the weakest having a
central pressure of 970 mb. The medium strength storm corresponded to about 940
mb, similar to Hurricane Betsy in 1965. The strongest one, a 910 mb storm, is
similar to Hurricane Camille in 1969 (Schexnayder and Barnes, 1980).
In general, storms from the southeast were calculated to bring the most
severe flooding to the Mississippi River delta. Selected points with
corresponding maximum calculated surge values for a 910 mb storm moving from
southeast to northwest and tracking over the Mississippi delta just west of the
Mississippi River are given in Table XII-4 (New Orleans Area Weather Service
Forecast Office, 1980).
XII-20
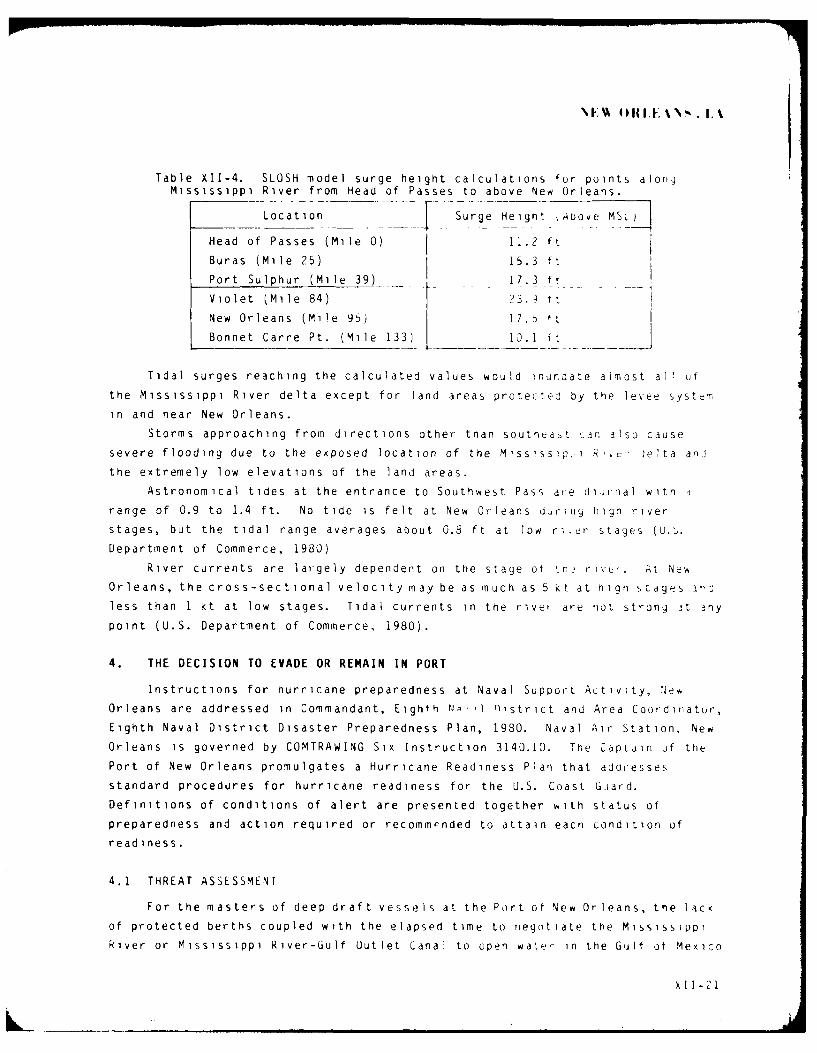
\F;% (llA':\ . I.A
Table XII-4. SLOSH model surge height calculations for points alon.gMississippi River from Head of Passes to above New Orleans.
Location Surge Height kAuove MSL)
Head of Passes (Mile 0) 11.2 ft
Buras (Mile 25) 15.3 ft
Port Sulphur (Mile 39) 17.3 ft
Violet (Mile 84) 23. f-
New Orleans (Mile 95) 17.t ft
Bonnet Carre Pt. (Mile 133) 10.1 ft
Tidal surges reaching the calculated values would inundate almost all of
the Mississippi River delta except for land areas protected by the levee system
in and near New Orleans.
Storms approaching from directions other than southeast zdln also cause
severe flooding due to the exposed location of the Mississip. i R Je ta an-
the extremely low elevations of the land areas.
Astronomical tides at the entrance to Southwest Pass aye diirnal with j
range of 0.9 to 1.4 ft. No tide is felt at New Orleans drinry hinh river
stages, but the tidal range averages about 0.5 ft at low ri.er stages [U.S.
Department of Commerce, 1980)
River currents are largely dependent on the stage ot t n2 ry-'. At Ne%
Orleans, the cross-sectional velocity may be as much as 5 kt at high stages a--
less than 1 kt at low stages. Tidal currents in the river are not strong it any
point (U.S. Department of Commerce, 1980).
4. THE DECISION TO EVADE OR REMAIN IN PORT
Instructions for hurricane preparedness at Naval Support Activity, New
Orleans are addressed in Commandant, Eighth NA -.l nistrict anu Area Coordinator,
Eighth Naval District Disaster Preparedness Plan, 1980. Naval Air Station. New
Orleans is governed by COMTRAWING Six Instruction 3140.1D. The Oaptain if the
Port of New Orleans promulgates a Hurricane Readiness Plan that ado,'esses
standard procedures for hurricane readiness for the U.S. Coast Giard.
Definitions of conditions of alert are presented together with status of
preparedness and action required or recommpnded to attain each condition of
readiness.
4.1 THREAT ASSESSMENT
For the masters of deep draft vessels at the Port of New Orleans, the lack
of protected berths coupled with the elapsed time to negot iate the Mississippi
River or Mississippi River-Gulf Outlet Canal to open water in the Gulf ot Mexico
xl 1-21

NEA 4)RI.EANS. I%
make early assessment of each tropical cyclone threat absolutely essential.
This assessment should be related to the setting of hurricane conditions of
readiness by U.S. Navy, U.S. Coast Guard, and civil authorities and conducted
using current advisories and forecasts issued by the Navy and National Weather
Service, as well as climatology as presented herein.
Tne greatest threat to New Orleans in terms of severity is tropical
cyclones that have ar, origin outside the Gulf of Mexico and approach from the
southwest, south, or southeast with a forecast landfall within 100 n mi of the
port. A greater threat of storm surge occurs when tropical cyclones approach
more or less peroendicu lar to the coast and make landfall within 100 n mi west
and 75 n mi east of New urieans. Of course tne individual storm intensity and
speed of movement affect the extent of damage which can De expected from any
given storm. As a general rule, any intense tropical storm or hurricane
approachini from :ne Gjit of Mexico such that New Orleans is located in the
dangerous right front quadrant of the storm can result in severe wind and storm
surge Londit ions. ie mu,,ths of mayimum threat in terms of frequency and
severity are August, September, and October. All four of the tropical cyclones
that caused sistained winds or gusts to hurricane force 3t New Orleans occurred
in September.
4.2 EVASION AT oEA
Evasion at sea is the recommended course of action for all seaworthy deep
draft vessels when the port is under threat from a hurricane (winds greater than
63 kt) approaching from the Gulf of Mexico and forecast to pass within 00 n mi
of the Port of New Urleans. Timing of this decision is affected by:
I) ihe t r,,aru spted of tne tropical cyclone.
(2) The radius Ot hazardous winds and seas that can impact on a vess l's
capabh 1ty to reach open water and then maneuver to evade.
(3) The elapsed tire to make preparation to get underway.
(4) lhe elapsed time to reach open water.
For example:
The worst case situation would be an intense cyclone moving more or less
directly toward New Orleans from the southeast. Assume 6 hours are required to
make preparations for leaving port after the decision to evade at sea is made.
Approximately 8 hours are required to transit the M1ssissippi River and reach
open sea, and once open sea is reached, the vessel would be approximately 80
miles further south and closer to the storm. A tropical cyclone approaching at
an average Speed of 10 kt w111 have moved 140 mn iles closer to New Orleans by the
time open water i reached. Add to this the radius from the tropical cyclone
center of strong w1nds likely to hamper port operations, say 1100 n ini. Sumnm ng
th, -,e valuevs give-, 420 mi les (140 + 80 + ?00) or 42 hours as the minimum
S1 -2?
L

tropical cyclone displacement froin New Orleans in distance or time when the
decision must be made to evade at sea successfully. A greater margin may be
applicable depending on greater cyclone speed and i ntensity, ano snip spned
a p a h i 1 ty
Hurricane Condition Ill is set when hurricane force winds are possib le
within 48 hours. It Is apparent that the decision to prepare for surtle should
be made soon after setting Hurricane Condition I[I. Although at this time the
storm may be more than bOO miles distant, it should be remember jd that the
average tropical cyclone forecast error over a 48 hour period is on the orde r of
220 n mi for those tropical cyclones threatening New drleans.
Tne destroyer USS Wi 1iam C. Lawe (DD-763) is homeported at New Orleans
and makes for open sea whenever Hurricane Condition of Readiness III 'hurricane
force winds expected withni 48 hours) is set. This is considered tu be the wise
and safest course of action. Later departures than this wager the accuracy of
information on the storm's be, 3vior against mounting risks of heavy weather
damage.
Once sea room is attained on departure fronm New Orleans, the tactics
employed w11 depend, of course, on the location of the tnreat-: ng *ro:i cal
cyclone, its speed of advance, and its direction of novement. Up-to-date
information is essential if sound decisions are to be made. Tropical cyclone
location and intensity information with today's satell ite technology is accurate
and timely. Forecasts and warnings are issued at 6-hourly intervals and updated
as necessary to reflect important changes in position, intensity, and movement.
Ship masters with access to these advisories/warnings are in the Uest
possible position to modify evasion routes and tactics to successfully evale the
storm. The cardinal rule of seamanship is to avoid the dangerous right-hand
semicircle. The following guidelines are offered.
(1) For tropical cyclones approaching from the east or southeast: Steam
southwest to increase distance from the storm taking advantage of northerly
winds and seas.
(2) For tropical cyclones approaching from the southwest or west: After
an early departure to escape worst effects of head winds and seas, steam south
or south-southeast to reach a latitude south of the storm center.
(3) For tropical cyclones approaching from the south: Tropical cyclones
moving through the Gulf of Mexico from this octant present the most vexing of
evasion problems. Early in the season many storms move directly into the coast,
but in September and October there is a strong likelihood of cyclone recurvatu-
to the northeast while still centered over the Gulf. An evasion route decided
on earlier may have to be altered based on unexpected changes in cyclone
movement. Evasion tactics must be based on the latest tropical cyclone forecast
position and movement.
XI 1 -?3

oI \ ~lI.. VV'. IA\
4.3 RETURNING TO PORT
The damage and disarray at a port rtsulting from a tropical cyclone strike
may include navigation hazards such as displaced channel markers, wrecks lin the
cnannel, or channel depths that no longer feet project specifications. Because
tht Port of New Orleans can only be accessed by long, narrow chann-Is sucn as
th e Mississippi River and Mississippi River-Gulf Outlet Canal, tne potential for
such nazaras Is large. Harbor fac 1ities may be so damaged as to preclude
offering even min imal services. Check with the Port Autnority before attem pting
to return.
4.4 REMAINING AT NEW ORLEANS
Rema;nng in port it New Orleans is an option tnat siould receive serious
consideraLion only in a se':ondary tnr t-3t situation ',o in those instances wrien a
ves e 1 1 ,Icapao e ot s Jccecstul evasion at sea. Tne s-coniary tnreat
Si tu3t )n n I cUdes:
]) A tropical cycioe developing within the 1 3U nii radius c i cai
area .
2; , weak ti ,pisal cyclone niaxlm um winds less than 46 "t,) is approacninq
from tuhe G.ait uf Mex-,c , and is forecast not to intensify.
(3) A tropica i cyclone with winds greater than 47 ,t approaching fo r1 tne
Gulf is forecast to pass more than 100 miles from New Orleans and the forecast
50-kt wind radius does not encompass the Port of New Orleans.
(4) A tropicai cyclone, approaching overland from the east or west.
If the decision is to remain in port at New Orleans, the f Ii r in
recommendations are offered:
1) If tihe vessel is of a type that cannot easily be ballasted Aown to
maximiAm draft, such as a man-of-war or cargo ship, remain at the p ier secjrej
with sufficient lines to withstand hurricane force winds, yet allow for water
height fluctuations of the predicted surge amounts. Bow and stern "insurance
lines" of heavy wire rope are recommended.
'2) If the vessel is a tanker type that can be ball asted down to maximum
draft, it can go to anchor utilizing two anchors with 6 shots of chain. The
vessel should thei be ballasted down to maximum draft, resting on the mud bottom
of the river if possible.
(3) A third possibility is to proceed upriver to Baton Rouge. Channel
depths of 40 ft are maintained to Baton Rouge, and because it is further from
the Gulf of Mexico, winds are likely to be weaker and hurricane surge heights
will be reduced if not eliminated. Baton Rouge facilities are limited, however,
and river barge traffic is much heavier than at New Orleans. Consequently,
congestion is likely and the threat of waterborne hazards due to broken
moorings, etc., is greater.
XI f-24

Sn,) 1. a mit er choose to remain in port, it should be borne in m nd that
SIs vess l i I be xposed to dangers beyond that of wind and surge.
Invarj ., r ,,j barges ind other vessels are broke, loose from their moorings
on the h t, b c : l e o at i n g hazards, r e s u I t n g i n ho I i n g s of so m e hu I 1 s.
Also, because tle cn.,nnels from the Port of New Orleans to the open sea are
relativelv 13r rro , the risk is considerable that one or both of the channels
could be blockei by Jamaued or sunken vessels, thereby trapping shipping in the
port for some time after a storm has passed.
5. ADVICE TO SHALLOW DRAFT VESSELS
Shallow draft vessels should, if feasible, be removed from the water and
firmly secured ashore at an elevation of at least 20 ft to avoid possible high
water. For those vessels that cannot be removed from the water, few options
remain. The Miss-sippi River offers little protection. Tug boats and otner
similar vessels usually seek shelter in Chalmette Slip (near mile 90.5 on tne
east bank), and in Harvey Canal (near mile 98.3 on the west bank). Space Ir
these waterways is limited so early access is recommended if their use is
desired.
The Naval Support Activity removes as many of its small craft from the
water as can be accommodated by its pierside crane. The remaining vessels are
sent via the Intra-coastal Waterway to the Pearl River, on the border between
Louisiana and Mississippi, where they seek shelter upriver near Pearlington.
This alternative requires in excess of 6 hours, and because small craft are
involved, must be completed before the onset of heavy weather.
Riding out a tropical cyclone on the Mississippi River is not recommended.
Although the twistinq course of the river largely precludes wave action of
significance to larger vessels, wind driven waves to 10 ft are possible in some
areas of the river and smaller vessels could be severely damaged or sunk.
Additional hazards are posed by floating debris resulting from the effects of
waves, high water, and strong winds.
The prudent small boat operator will have selected several potential havens
beforehand in which to take shelter in vailous tropical cyclone threat
situations. He will proceed to his haven well in advance to avoid the chaos and
congestion endured by other 'skippers who delay until the onset of destructive
conditions is imminent.
XI I-25
\ ol |1I.1: Vv . I.\
REFERENCES
aptain Ot the Port, New OrI earl, LA, 193 : Hurricane Readiness Plan. Captairof tile Port, New Or I eans I nforr r at I n lTe tin N P__26.7 .-
Co mmnander Training Air ving lx, 9Wi: Aircraft Hurricane Evacuation HuRELPlan. COMTRA ING SIK IN TRUCTION jil0.1D.
Crawtord, r-. C., 1979: Hurricane ourqt Potentials Over Soutneast Louisiana asRevva led ya Storm -Sure Furecast Mude I A Pre lminary Studl. I.S.Depart;nent or ,oirnerce, National Oceanic and Atmospneric Adm instratlon,N ational W etner Ser viLe Forecast Office, New 'orlern s, A.
narr , I . L., 19 t : rid acteristic cs of the_ H urri1cane S torm _Surqe. U.S..Seatier Barea: , TecnnIc iI Paper No. 48, u.S. Departrient of Commerce,wash ngton, D.C.
Headq t artrs E q ntn )Nasal 1 str ct, 1930: Ikt DisasterPrep aredress Plan.Headq art rs Eignth Naval District, New Orleans, LA.
rebert, P. t.. 1930: At :nti. Hu,'icane Season of 1979. Mon. Wea. Rev., 163,7, pp. 973- 9 J.
;e es ans' T 1, -. . an . heti , 191 9 SLOSH Sea, Lake, and Overland Surgestrom Hurr ic anes. n pr-epar, t on.
N t inn .,I. , G. Lry, E 3so, and o. Jarv1nen, 1973: Tropical Cycjlones oftne North Atlantic Ocean 1-1917. National Climatic Center, Asheville,NC in cooperation witn toe National Hurricane Center, Coral 'ables, FL,7 j pp.
, anJ M. j. Prysla3K, 198,: Frequency and Motion of AtlanticTrpal Cyclones. .. Department of Commerce, National Oceanic and
Atmospheric Administration, National Hurricane Center, Coral Gables, FL.
New orleans Area Weatner Service Forecast Office, 1980: Hurricane SurgePotentials Over Southeast Louisiana as Revealed by a Storm-Surqje ForecastModel: 54 Selected Cases. New Orleans Area Weather Service ForecastOffice, I [ 0d---- -panish Trail, Slidell, LA.
Schexn ayder, J. S. and D. P. Barnes, Jr., 1980: Use of a Hurricane Storm-SurgeForecast Model for Southeast Louisiana. National Oceanic and AtmosphericAdministration, Scientific Services Division, Southern Region, Fort Worth,
U.S. Army Corps of Engineers, 1973: Shore Protection Manual. U.S. Army Coast,Engineering Research Center, Kingman Buildling, Fort Belvoir, VA.
-i__ 1965: Hurricane Betsy, September 8-11, 1965. U.S. ArmyEngineer District, New Orleans, LA.
, 1975: Hurricane Carmen 1974. Department of the Army, U.S.Army Engineer District, New Orleans, LA.
1 1981: The Port of New Orleans, Louisiana, Port Series No. 20.The Water Resources Support Center, Kingman Building, Fort Belvoir, VA.
U.S. Department of Commerce, 1980. United States Coast Pilot 5, Atlantic Coast:Gulf of Mexico,Puerto Rico, and VirIn Islands. National Oceanic andAtmospheric Administration, National Ocean Survey, Washington, D.C.
X II-26

-CCS-4
S-4=CS
-4

XIII: CONTENTS
1. Geographic Location and Topography . o XIII-2
2. Port and Harbor Facilities .. .. . . XIII-4
3. Analysis of the Tropical CycloneThreat at Port Arthur o * . XIII-9
4. The Decision to Evade or Remain In Port . o XIII-28
5, Advice to Shallow Draft Vessels . . XIII-31
References XIII-33

XIli. IORT ARTIIIR, T IXAS
SUMMARY
While each port has specific advantages, none of theports of Port Arthur, Beaumont, or Orange has the qualitiesrequired of a good hurricane haven. Consequently, it isrecommended that deep draft vessels evade at sea when thearea is threatened by an intense tropical storm (windsgreater than 47 kt) or hurricane (winds greater than 63 kt2 .Early threat assessment is essential due to the elapsed timenecessary to reach open water -- especially from Beaumontand Orange -- and the limited number of evasion routesavailable in the Gulf of Mexico.
Advice to small craft is to remove from the water.Otherwise, seeking shelter in the upper reaches of theSabine and Neches Rivers above Oranqe and Beaumont isrecommended.
Port Arthur is a small but important and active commer-cial shipping port. The Sabine-Neches Canal, on which thePort of Port Arthur is located, is also the deep wateraccess to the nearby port of Beaumont arid Orange. Becajseof their mutual access and close proximity to each other,all three ports are considered in this evaluation of PortArthur as a hurricane haven.
History has demonstrated that the hurricane seasonpresents a serious threat to marine activities in the PortArthur area. Port Arthur has been affected by tropicalcyclone activity at an average frequency of 0.9 events peryear during the 109-year period 1871-1979. Since 1929, whenhourly wind data was first recorded in the area, I out of 5tropical storms/hurricanes passing within 180 n mi hascaused sustained winds of 34 kt or greater at or near PortArthur, but only I of the 56 tropical storms/hurricanesentering the 180 n mi threat radius caused winds ofhurricane force to be recorded.
The hurricane season is late May through early Novemberwith September being the major threat month. The principalthreat to Port Arthur is from tropical cyclones approachingfrom the southeast and south. Seventy-seven percent of alltropical cyclones entering the 180 n mi critical area in the109-year period 1871 through 1979 approached from thesesectors.
This hurricane haven evaluation was prepared byR.D. Gilmore of ocean Data Systems, Inc. (ODSI),Monterey, CA 93940.
Change I XIII-I

111l', % 11, 11I It. Tl' X-___
1. GEOGRAPHIC LOCATION AND TOPOGRAPHY
As shown in Figure XIIIL-i. the ports of Port Arthur, Beaumont, and Orange
are located in the coastal section of extreme eastern Texas. Port Arthur is
situated on the west bank of the Sabine-Neches Canal which borders the western
edge of Sabine Lake (Figure XIII-2). Beaumont is located some 15 miles
northwest of Port Arthur on the Neches River, while Orange is about 18 miles
northeast of Port Arthur on the Sabine River. Sabine Pass, which is the seaw~ard
entrance to Sabine Lake, Sabine Lake itself, and the Sabine River form the
southern portion of the Texas-Louisiana border.
From the Gulf of Mexico, Sabine Pass is entered from a Safety Fairway
passing through Sabine Bank Channel, a sea bar channel and a jetty channel.
Federal project depths are 42 ft in the outer bar channel, thence 40 ft through
the jetty channel and Sabine Pass.* Inside the Jetties, Sabine Pass extends
northwest about 6 miles to Sabine Lake, and the entrance to Port Arthur Canal.
With an average depth of 6 ft, Sabine Lake is used only by small recreation and
fishing vessels. Port Arthur Canal extends northwest for about 6 miles from
Sabine Pass to Taylor Bayou, with project depths of 40 ft (U.S. Department of
Commerce, 1980).
The Neches River extends in a general west-northwesterly direction from its
junction with the Sabine-Neches Canal for about 18.5 miles to the Port of
Beaumont. Federal project depths on the Neches River are 40 ft to a 34-ft
turning basin at Beaumont (U.S. Department of Commerce, 1980).
The Sabine River e:(tends northeastward from its junction with the Sabine-
Neches Canal to the Port of Orange. The Federal project provides for depths of
30 f t in the channel to Orange, with 25 f t maintained in the channel aroundOrange Harbor Island (U.S. Department of Commerce, 1980).
No bridges cross Sabine Pass, Port Arthur Canal, or Sabine-Neches Canal
below Port Arthur. At Port Arthur, a fixed highway bridge with a clearance of
136 ft crosses the Sabine-Neches Canal approximately 1.8 miles above the
entrance to Taylor Bayou. A highway bridge (Rainbow Bridge), with a clearanceof 172 ft, crosses the Neches River about 1.5 miles above its mouth. No other
bridges exist between Port Arthur and the turning basin at Beaumont, but over-
head power cables with clearances of 164 ft cross the Neches River 50 yards east
of Rainbow Bridge. Additional power cables cross the Neches River between its
mouth and Beaumont but, in each case, the vertical clearance equals or exceeds
164 ft. No bridges cross the Sabine River between its mouth and Orange. An
overhead power cable with a vertical clearance of 172 ft crosses the river about
3 miles below Orange (U.S. Department of Commerce, 1980).
*See Notice to Mariners and latest editions of charts for controlling depths.
X I II- 2

N
TEXAS LOUISIANA
Figure XIII-1, Locations of PortPR RM LAKE Arthur, Beaumont, and Orange in
SA&M southeast Texas.
GULF OF MEXICO
SCALE OP MILE
ORANGE /lit
BEAUMONTC / INTRACOASTAL.
S WATERWAY
SASINE- /PORT ARTHUR CANAL.
k
SCALE Of &*KES TAYLORi
0 to B0AYOU
S t Av
AA~hUAGULF OF8A9IE~ :AS MEXICOPASS
Figure XIII-2. Greater Port Arthur, Beaumont, and Orange area.
XII 1-3

POR'IT *ART'H. TX
2. PORT AND HARBOR FACILITIES
2.1 BERTHS FOR DEEP DRAFT VESFELS
2.1.1 Port of Port Arthur
The Port of Port Arthur has over 50 wharves and piers, but only 12 are deep
draft facilities. Of these, 11 are privately owned and operated, with alongside
depths ranging from 27 to 43 ft (34-38 ft predominating), and deck heights of 6
to 15 ft .
The Port of Port Arthur Public Ocean Terminal Wharf (Figures X1I-3 and
XIII-4) is owned and operated by the Port of Port Arthur Navigation District of
Jefferson County, Texas. Located on the west side of Sabine-Neches Canal, it
has a 1200 ft face with an alongside depth of 36 ft and deck height of 15 ft.
More complete details of the piers, wharves, and docks at the Port of PortArthur can be found in Port Series No.22 published in 1980 by the U.S. Army
Corps of Engineers. The publication also provides details of 11 diesel tugs
ranging from 1600 to 3900 horsepower used for towing, docking, and undocking
vessels in Port Arthur, Beaumont, and Orange Harbors.
Other than a small U.S. Coast Guard pier, the U.S. Government does notmaintain any harbor facilities at the Port of Port Arthur.
2.1.2 Port of Beaumont
The Port of Beaumont has over 60 wharves and piers, but only 18 are deep-
draft facilities. Of these, all but 8 are privately owned and operated, with
alongside depths ranging from 32 to 40 ft and deck heights ranging from 10 to16 ft.
The Port of Beaumont Navigation District owns and operates the remaining 8
deep-draft facilities (Figures X1II-5 and XIII-6). Located on the west bank of
the Neches River, alongside depths range from 30 to 40 ft with an averagealongside depth near 36 ft. Deck heights are a uniform 16 ft.
More complete details of the piers, wharves, and docks at the Port of
Beaumont can be found in Port Series No. 22 published in 1980 by the U.S. Army
Corps of Engineers.
No U.S. Government harbor facilities are maintained at the Port of
Beaumont.
2.1.3 Port of Orange
The Port of Orange has over 40 wharves and piers, but most are privately
owned and not suitable for deep-draft vessels. Except for facilities owned and
operated by Levingston Shipbuilding Company and the Port of Orange, most harbor
facilities have alongside depths of less than 20 ft.
XII 1-4

PORT
ARTHUR
N
ATSEP.
TAYLOR*.*. XU4 J Figure XIII-3. Location of the port ofPort Arthur on the Sabine-Neches Canal.
PLSASLIME ISLAND
AU
- AW
SABINE LAKE
SCALE IN WES
SCALE N FEET
a 300 600 000 12004
SABINE-NEC.HES CANAL
Figure XIII-4. Port of Port Arthur.
XII 1-5

P0k'!' A 'UII I'R. TX'
SEE FIUR
Figure XII1-5. Location of the Port of Beaumont on the Neches River.
TRANST SHE --4 LOCATION OF PORT
OF BEAUMONTNAVIGATION OIITRICT
TRA1TANSI SHEHED-
Figure XIII-6. Port of Beaumont-.XII 1-6

I' KTA}'", R'I'II1 R . '1A
The Port of Orange owns and operates the Alabama Street Wharf located on
the Orange Municipal Slip, about 2 miles below the city on the west side of the
Sabine River (Figures XIII-7 and XIII-8). Five berths are located on a 2300 ft
wharf along the southwest side of the slip. Alongside depth is 30 ft with deck
heights of 12 to 14.5 ft. In addition to the wharf at the Orange Municipal
Slip, the Port of Orange has a Lay Berth Facility on the Sabine River about 2.7
miles above the slip (Figure XIII-9). Located on the west bank of the river,
the facility consists of 9 (of 12) concrete piers previously owned by the U.S.
Government and operated as part of the U.S. Navy Atlantic Fleet Reserve Base.
Ranging in length from 480 to 900 ft, the piers have deck heights of 10 ft and
minimum alongside depths of 18 ft, with depths near the river channel somewhat
deeper. Maintenance of the river channel to a 30 ft depth ceases below the Lay
Berth Facility, so exact channel depth adjacent to the piers is not specified.
More complete details of the piers, wharves, and docks at the Port of
Orange can be found in Port Series No. 22 published in 1980 by the U.S. Army
Corps of Engineers.
U.S. Government facilities at the Port of Orange are limited to Pier #10,
with the piers being numbered sequentially starting with number 1 at the
upstream end. It is used as a utility pier by the U.S. Navy and Marine Reserve
Center, Orange, Texas. Piers 11 and 12 are used by Lamar University.
2.2 HEAVY 'WEATHER FACILITIES AND ANCHORAGES
None of the ports of Port Arthur, Beaumont, and Orange offers adequate
shelter from heavy weather. The low elevation of the land surrounding the port
limits the protection that orographic features usually provide and exposes the
region to flooding in high water situations.
Anchorages for large vessels include the Sabine Fairway Anchorage outside
the entrance to Sabine Pass as indicated by the letter "A" in Figure XIII-1.
Vessels of light draft can find good holding ground along the coast 7 to 8 miles
west of the jetties as close inshore as drafts will permit (U.S. Department of
Commerce, 1980).
Additional anchorages include an anchorage basin, indicated by the letter
"A" in Figure XIII-2, on the east side of Sabine Pass Channel. Federal project
depth for the anchorage is 40 ft. Temporary anchorages exist in 29 ft of water
in the bends of the old Neches River between the Sabine-Neches Canal and
Beaumont and are indicated by the letter "B" on Figure XIII-2. With the
exception of these temporary anchorages, only emergency anchorage is permitted
in the Neches River. Vessels may tie up to the banks of the Neches and Sabine
R ivers for a imited period provided permission is obtained from the Corps of
Engineers (U.S. Department of Commerce, 1980). No anchorages exist on the
Sabine River.LX I I- 7
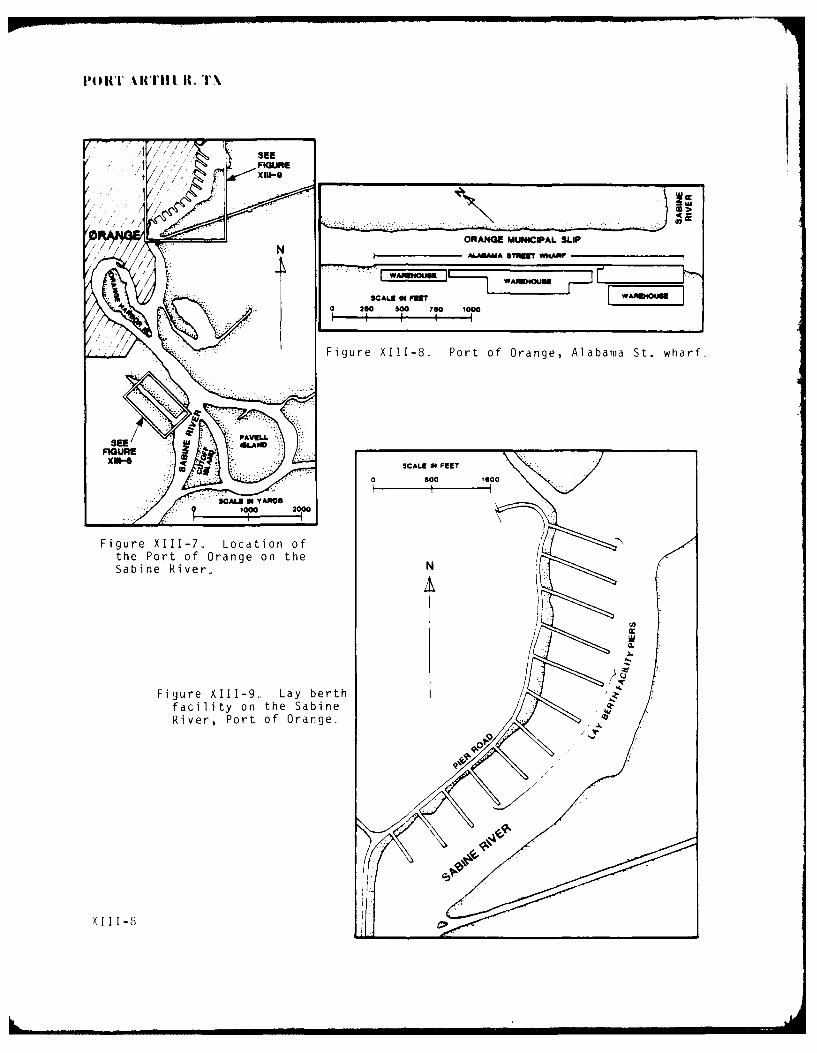
I' 11Tl A KTI I I I TX
FiueSEE8 oto ragAaam t hr
SCALE IN FME0 20 Boo6 1600
Sabi ..e Ri...N
River, X1-.Port of OrangeAa maS.w rf
PAVIL.
SEEi -8AN

The Maritime Adrninrstraticn has a restricted anchorage rn the Neches 0 I.'er
about 7 miles below Beaumont at the McFa,ld-ri Send Cut-off, a, Indicated Ly the
letter "C" on Figure XIII-2. Capable of holding over 200 large vessels, it
provides good holding ground in nid ani silt, but maximum drft is 1 , , 1 t 6
ft. Use of the Mar it ime Admin istrition an oloraqe is restricted to v e ss e I s
consigned to the Marltime Administration Reserve Fleet.
In the event of damage, faci it es are avai lable at Port Srtnur f,
repairs to hulls and machinery, i n c Ii d1i nq r V- d.. K n q ,
tons/650 ft (U.S. Department of Commerce, 9 .
2.3 FACILITIES FOR COASTAL AND IN-SHORE VESSELI"
Toe nain facility for recreational boaters in the Pc,-t Artriur area I i-
alon, the west shore of Sabine Lake on P)easure Is 1 and a ;t c-ent to toe r .e
Port Art inur, ais und cated by the letter "A" on Figure onl1 -3. LaIIec elIe s
Island Marina, its use is intended for boats drawing only 2 'o 3 ft.
S'nall boats in the Sabine-Neches Canal can get fuel, oil, Aater ani
supplies along tne Port Arthur city waterfront. Above Port Arthur, a matina an
boaty yJ are located on the Neches River just west of the south end of Raior, o
3' Idqe. Normal supplies are available, and the boatyard can handle vessels to
33 ft for hull and enqine repairs. Depths of approximately 5 ft are carr
the marina and boatyard.
The city of Orange has a marina located on the west side of tie cha
opposite the north end of the Orange Harbor Island. Supplies, berths, a, noV
accommodations are available. Alongside depths of 12 ft are repo ted ,
fuel pier of the marina (U.S. Department of Commerce, 1980).
3. ANALYSIS OF THE TROPICAL CYCLONE THREAT AT PORT ARTHUR
3.1 INTRODUCTION
By examining relevant characteristics of tropical cyclor . , a-' t,-
speed of movement, intensity, month of occurrence, etc., a. t .11 , '-
gained into their typical behavior. This backQround know! ,
allows attention to be focused on those storms most 1 ikelv t .
effect on the Port Arthur area. However, t e i ,t, I I ie v .i . .I t )rm 7" 1 ,
their impact on Port rthur should not i re i ,, i. ,, t2 • .( 1
detai led behavior and impact Of a part It

3. 2 CLiN TUIL GY
F cr t h e o I, p u t tlI s ,t ;(, d ly tropical C'C [one approaCC n g AIthlfl
lo ,r mi ot Port Artnd. i, conqidered to represent a tnreat to the area.
Tnt ut.stan A 1 fqt1, - f t he U. s. u f f uast 1 its 1 c location on the nor t h
store ct inn Aulf of 1.. ic,. and its orientation perpendicular to normal cyclone
trjck s aS they move Iiare or less northwdri out of the tropics. Also of
importance is tht ra ion's position between 25 nd 30 derees north lat tuae;
t i4 W T! I1 ! V! e forid I 101 US Of t 1 l 0 c i ornne r -. v a t e t,, vi ,i c n' a; -, i -
lates between lInituars H5N and 35N durinj tre tropical cyclone season. This
latter factor is significant since it is tne character of tropical cyclones to
slow and intensify during the recurvature stage. Da"lng this phase of the
trupical cyclone life cycle, it s diff icult to predict with great accaracy the
,dt- of re-carvature, the storm, speed of 'ovement subsequent to recur. tire, anil
Ouvioas 1, onie stnrn 's precise future position at a point in t ime.
The ,.rricuc ; r., . along tie Gulf Coast is late Ma, trro.,oh Carl,
November. urinu the 1l0-year period from 1371 through 1979 trre Aere lI:
trop cI cyu lrm,;l that met the 10 n m1 threat criteria for Port Ar-th r, ar
,is erdg- ot i L; r 1 03 per year. Table XII 1-1 shows the monthly totals ar,
Percr nti s. Tnese data dre graphically presented in Figure X111-10. it is
ra?71 rpm-:O-iK t a tne frequency of tropical cyclone0 tWreat irc,"e ses Qo!,
May t icul;h September. then decreases significantly in October.
Table x1Il . , Monthly totals of tropical cy lc nes ps i A m
,< n ,i' of Port Arthur during the period IS71-1979.
North Number k :f Toti.l
June 14 12.:
July 14
August 20 'o :
eptember 40 39. 7
October 12 11 .9
Fiq re XIII-i11 illustrates the 101 events during the 109-year period as a
function of compass ctant from which tropical , yrlones hie approache I Port
Arthur. The numbers in parenthesis represent the perce', aq, )f vc 1 ones from
the sample approachinq roiI a particular octant. The , iquru show., that tne
preimininip threit vector exten(is from sou' h throw lc n uth tst . Seventy-sev,;
percent nt the tropi 4a y clones attect ing P t ,Arthi,, ha,- approaithed from
thosr oct ahnLs, w '0 tho jr,atnst percent aq, (40%) app, .,a,' iI frm, t h,
snuthr ist.
XT I 1 -10
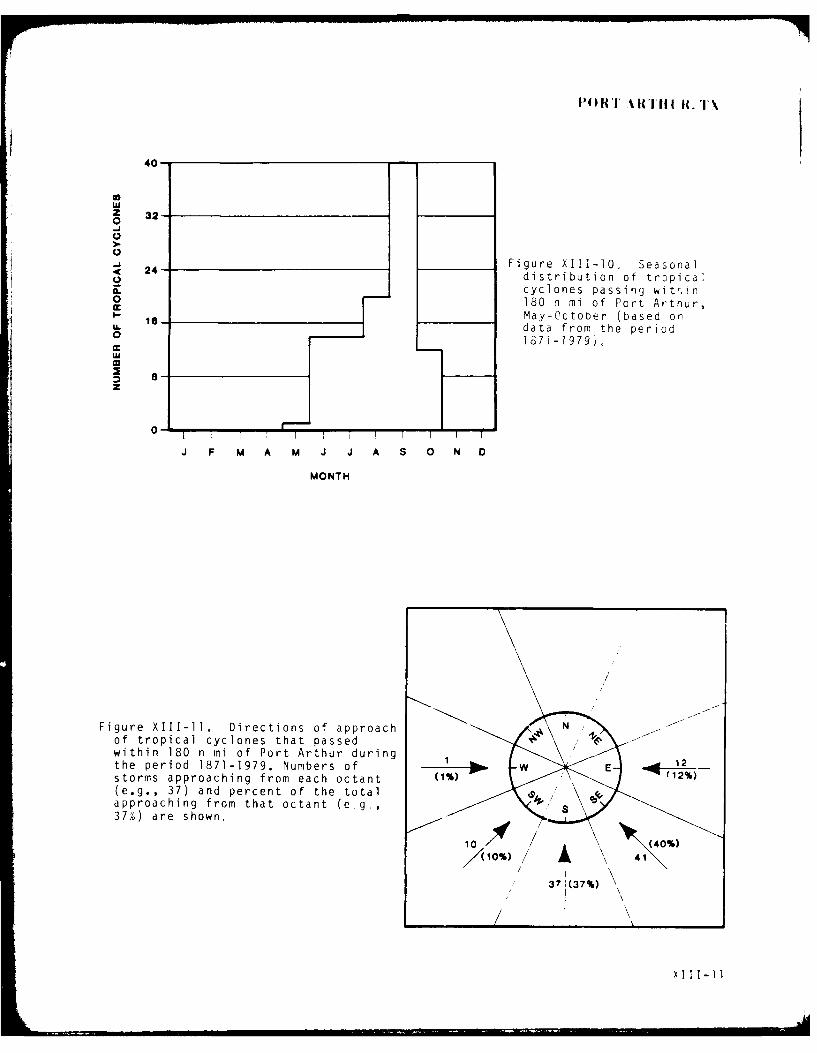
40-,
0WZ 32-0
24- Figure Xi11-1o, Seasonal< 24- ylnspsigitndistribution of tropical
~~cyclones passing witr, n0 180 n mi of Port Arthur,c .
May-October (based onLLdata from the period0 1871-1979),
w0
z
O - L t [ I l ] iI I !
J F M A M J J A S 0 N 0
MONTH
Figure XIII-11. Directions of approach Nof tropical cyclones that passedwithin 180 n mi of Port Arthur duringthe period 1871-1979. Numbers of 1 W E 1%storms approaching from each octant (1%)(e.g., 37) and percent of the totalapproaching from that octant (eog,,37%) are shown,
10 11
37 (37%) \

One tropical cyclone formed within 180 n mi of Port Arthur, and developed
quickly into hurricane strength after initial formation.
Records of tropical cyclones entering the 180 n mi critical area around
Port -rthjr during the 80-year period of 1900 through 1979 for which cyclone
inltt iity data ar ava ila le are tabulated in Table X1i1-2 by intensity and.cnth of )ccurrence. Of tnie 74 occurrences, it can again be seen that September
1 ty f3r the principal threat month in terms of tropical cyclones affecting
-. ,,t Artnhjr, Lcit the mo i nest monthly percentage of the more dangerous classes of
tor i cifnsnes and intense tropical stor'TIs) is in August (13 of 16).
Jve, i 47 f 74 tr ooical cyclones (64%) affecting Port Arthur in this
ertr. Ae ' r n these stcm categories.
a , X .. " -ssification of 74 tropical cyclones which passed', t. 'in C" r I of Port rthIr during the 1900-1979 period.
intensit , ,,n- July Sep. Oct. Totals
H 5 10 12 3 34
T 0 _ 0 3 6 1 13
,eaKT- 1 6 3 11 3 25
Ca I0 u10 2
I.1T1 1 16 30 7 74
*Intens ity values reflect the maximum intensity while in the final
apuroacn pnase of the tropical cyclone track. Upper limit of a weakt rap i c a 1 s t o rim i s 47 k t.
F igures xlI1-12 through XIII-16 are statistical summaries of threat
proauin;lty for the years 1871 through 1979. These summary data are presented
in five chrts, each representing data encompassing specific periods during the
year: tr)pical cyclones occurring during May and June, July and August,
September, ind October, and all tropical cyclones of recorA' dur ing the 109-year
peri 0d.
The tolid line, in the figures represent the "Percent Ihreat" f-r an st , o
1oCat Ior.. The da',he.-i ines represent approximoate approaih 1 1' to Port Arth,,-
cased )n the rIi,7ato1 .a lto Ipproach speed fo- !,art ri lar storm location. For
exanr3if, ;n Fi ,ro XI" -12, a trop ical cyclon, e o(.ated ov e- the northwest corner
rf tne hVucat in P e, mc t, ; has a 30% probab ility of pass nq w I hin 14 n mm of
Port Arthur and w 11 redch Po t Arthur in Z-%6 hokurs (3 to 4 days).
IT 1I- I

0 0
z c
x -0
C.~c M-" CQ)
~za
A . 3 4- -Z-0--
X II -z 3

0 z
0m CD C
cy 0
oz
-~~~ 0
IV 0 w~
u~ 1- k
**~'~S' C)0
.~ 0.* ~_ea
-Z m
0 0
X) I I -14~

00
oI 00Ccc--
LLIi co -. 0
0.
C'0,
0.O
o to+Q -
-ti-
cm.
0r t
cvC 0 0-0~
IL w~
C- 0

PjORT AI(RTHUR . TIX
~ £ ±+ * +0 E
0 UC
'ayV
cacL+ E
X 10
a) C)4
0 O
CL 0 L
0C -
fo> Lr C-
> - C-'
Q) Cc'V '
XL 6

PORT ARTHUR - ALL YEAR__ Probability (%) thdt a yroi~ l re
will p withj, 180 NM ,f 11 .
lu - 3-4a Days -- - Approxeate tmi to 1--i
41po-6 pint o1 aNod, h• , Days
0+ %4 + +
+ 4 20
•go go%0%.- ....
C1 3%
Figure XIII-16. Annual probability and CPA curves fo all tropicalcyclones passing within 180 n mi (shaded circle) o" Port Arthur,based on data from 1871-1979.
The average speed of advance for all tropical cyclones that nave tnreateried
Port Arthur is 7 to 8 kt, with little variation during the season. The most
severe storms -- those with winds of 100 kt or greater -- moved at an avarage
speed of 11 kt (Neuman.i and Pryslak, 1981).
A comparison of the figures suggests some distinct differences in the
threat axis according to the time of the year. Early in the season (May and
June, Figure XIII-12), the primary threat to the Port Arthur area is a track
from the northern Caribbean Sea south of Jamaica westward along the coast of
Honduras, across the southern Yucatan Peninsula into the Gulf of Campeche,
thence northward across the western Gulf of Mexico to Port Arthur. A secondary,
minor threat axis extends west-northwestward from the southern tip of Florida to
Port Arthur.
By July and August (Figure XIII-13), the primary threat axis has shifted
northward, originating in the eastern Caribbean Sea near tne Lesser Antiiles.
It then extends west-northwestward, passing between Jamaica and Cuba before
crossing the western tip of Cuba, thence into the Gulf of Mexico to Port Arthur.
In September (Figure XIII-14), the most active mor.th, the primary track has
shifted southward again, progressing westward from the coastline of northern
Venezuela to the waters east of Nicaragua, thence northwestward across eastern
Honduras to the Yucatan Peninsula. It then curves northward across the Gulf of
Mexico to Port Arthur. A secondary but prominent axis approximates the primary
XIII -17

P() RI' A RTiII R, TX
axis for July and August, passing through the waters between Jamaica and Cuba,
thence west-northwestward across western Cuba and the Gulf of Mexico to Port
Arthur.
By October (Figure XIII-15), the axis of greatest threat originates in the
Gulf of Campeche and extends northward across the Gulf of Mexi~o to Pnrt Arthur.
A secondary threat axis originates north of the Lesser Antilles. and extends
west-northwestward along the Greater Antilles to the Gulf of Mexico, thence
northwestward to Port Arthur.
Figure XIII-16 presents a composite picture of threat probability and time
to CPA curves for the entire year and is derived from all tropical cyclone
tracks passing within 180 n mi of Port Arthur during the period 1871 through
1979.
3.3 WIND AND TOPOGRAPHICAL EFFECTS
A continuous record of wind data for any one location in the Port Arthur
area is unavailable for the period 1929-1979. Therefore, tropical cyclone
statistics contained herein are based on records as follows:
Sabine July 1935-June 1954September 1973-September 1979
Beaumont June 1929-September 1943
Port Arthur September 1944-September 1979
Consequently, tropical cyclone wind data are not based on records from a
single location, but are considered to be representative of conditions
experienced in the greater Port Arthur-Beaumont-Orange area.
In the 51-year period (1929-1979) for which wind data are available, 58
tropical cyclones approached within 180 n mi of Port Arthur. A tabular
breakdown on intensity of these cyclones is shown in Table XIII-3.
Table XIII-3. Classification of the 58 tropical cyclones which passedwithin 180 n mi of Port Arthur between 1929 and 1979, based on themaximum intensity observed while within the 180 n mi radius.
Hurricane Tropical Storm Tropical Depression Total No.)
(.63kt) (34 to 63 kt) (-34 kt)
27 29 2 58
Out of the 56 tropical storms and hurricanes, 12 caused sustained winds
greater than 33 kt in the Port Arthur area. Sixty-seven percent (8 of 12)
approached from the southeast, with the remaining 33 percent approaching from
the south. Only one tropical cyclone, Hurricane Audrey in June 1957, had wind
gusts of hurricane strength recorded. Official hourly records since 1929 reveal
XIII -18

that no sustained hurricane force winds were experienced, but according to U.S.
ArmyCorp ofEngineers publication Sabine Lake Study Segment, Texas Coast
Hurricane__Study published in 1979, "On 8 August 1940 a minimal hurricane passedinland between Port Arthur and Sabine with sustained winds of 75 mph and peakgusts up to 95 mph." Based on official records only, gale force winds (34 kt or
greater) can be expected from 1 out of every 5 tropical storm s/hurr icanespassing within 180 n mi of Port Arthur, and hurricane force winds fromn 1 out ofevery 56 tropical storms/hurricanes passing within 180 n mi.
Figure XIII-17 depicts the tracks of the 12 tropical cyclones that caused
gale force winds in the Port Arthur area during the period 1940-1979 (Neumann,
et a)., 1978, Hebert, 1974, and Hebert, 1980). It should be noted that,
although hourly wind data records were first maintained in 1929, no sustained
gale force winds associated with tropical cyclones were recorded until 1940.
Two-thirds (8 of 12) of the storms passed to the west of Port Arthur as theymoved inland. Figure XIII-18 defines the tracks of the storm centers while
winds of gale force were recorded at Port Arthur, Beaumont, or Sabine andclearly shows that the majority of tropical cyclones causing gale force winds in
the area move inland west of Port Arthur, thereby placing Port Arthur in themore dangerous right-hand semicircle. It is significant to note that the region
has not recorded gale force winds for any storm moving inland more than about30 n mi east of Sabine Lake. Figure XII 1-19 shows the direction from whichrecorded gale-force winds emanated. It supports a conclusion that Port Arthur
is more likely to experience gale force winds from a southeasterly direction
than any other.
3.3.1 Port Arthur
The Port of Port Arthur is exposed to winds from north-northeast clockwise
to south-southwest. The only barrier to unimpeded wind f low from these direc-tions is Pleasure Isl and, a long, narrow strip of l and which forms the eastshore of the Sabine-Neches Canal. Elevations of Pleasure Island are generally
in the 5 to 15 ft range, with some smallI rises exceeding 20 f t. The onlyimpediments to wind flow from south-southwest clockwise to north-northeast
directions are the buildings of Port Arthur and the frictional effects of the
surrounding marshlands.
3.3.2 Beaumont
The Port of Beaumont is exposed to winds with an easterly component.
Limited protection is provided for winds from other directions by the buildingsin the port area and the city of Beaumont, and by the frictional effects of the
surrounding terrain. Low marshlands with elevations less than 5 ft lie to the
east of the port and somewhat higher terrain with elevations exceeding 20 ftexists to the west.
X II I1- 19

AUG1940
PORTARTHUR•,:
JULFr-. i od1"3
frc we r 194
X 1-E JUL
" 8EP
since 1929, no g1 or e w n s e e r co d d u ti29 0
i gueII-20Tak f h 2topc lcconsd rn tepro
1940........ tha ca s d s s ai e i d o 4 k r gr a e in t e P r
XIII-20 N I~i

IOKLA'HOMA
ARKANSAS
NMISSISSIPPI
/ LOUISIANA
/ TEXAS/ PORT \
//
/
GULFg - . 34 KT WINDS BEGI OF
MEXICO 34 2 U KT WINoS CEASE MEXICO
Figure X111-18. Track segments of tropical cyclones 1940-79 showingstorm positions when winds of 34 kt or greater were recorded in thePort Arthur area. Some bias in direction of movement and passing sideis evident during the period, producing the predominance of south-easterly winds depicted in Figure XIII-19 (following page).
XIII-21
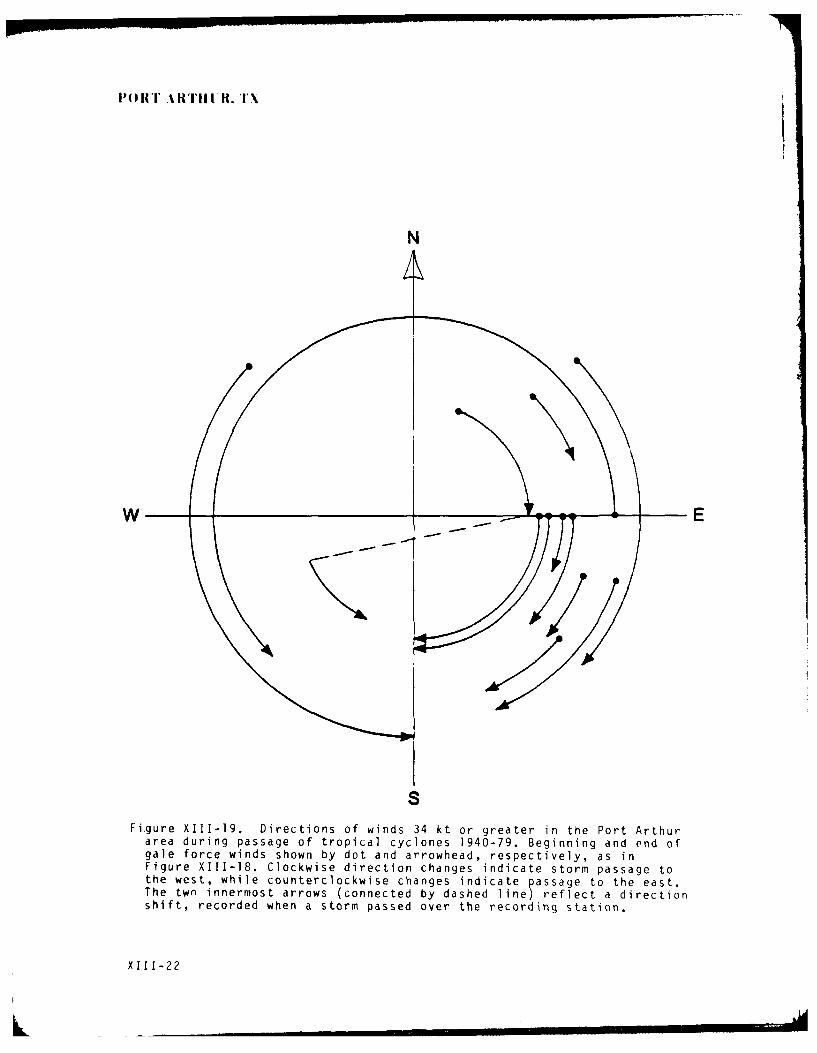
I14) 1T A1'I'III It. 'I'X
N
S
Figure XIII-19. Directions of winds 34 kt or greater in the Port Arthurarea during passage of tropical cyclones 1940-79. Beginning and end ofgale force winds shown by dot and arrowhead, respectively, as inFigure XIII-18. Clockwise direction changes indicate storm passage tothe west, while counterclockwise changes indicate passage to the east.The twn innermost arrows (connected by dashed line) reflect a directionshift, recorded when a storm passed over the recording station.
X I I I-22
L ... .. m I- h

NI')l' AKWI'll R. T
3.3.3 Orange
The Port of Orange is most vulnerable to southeasterly winds, as the Orange
Municipal Slip is open in that direction. The expansive marshlands (with
elevations generally less than 5 ft above MSL) opposite the slip on the east
side of the Sabine River would provide only limited frictional effects to reduce
wind speed. Slightly higher terrain north and west of Orange would furnisn
increased frictional effects and corresponding decreased wind speeds.
Low marshlands dominate the terrain in the eastern semicircle around the
Lay Berth Facility. Consequently, the facility would be exposed to more-or-less
unimpeded flow from any winJ having an easterly component.
3.4 WAVE ACTION
Due to the locations of the Ports of Port Arthur, Beaumont, and Orange on
relatively narrow waterways rather than on open bays and harbors, wave action is
not considered to be a critical element in hurricane preparation planning for
large vessels, but should be considered in any evolution involving small craft.
The wave height calculations in the following paragraphs are based on a
uniform depth over a relatively flat bottom. Uniform depths are not realistic
in the waterways serving the ports, as the channel is invariably deeper than the
waters bordering it and the channel depth varies from one location to another.
Consequently, the calculated values are for use as a guide only and should not
be regarded as absolute values.
3.4.1 Port Arthur
The location of the Port of Port Arthur on the Sabine-Neches Canal prevents
significant wind waves if the wind is from any direction other than northeast.
The canal, which is oriented on an approximate 040/220 degree axis, extends
about 9 miles northeast of the port. Given a channel depth of 40 ft and a tidal
surge of 5 ft for a water depth of 45 ft, and a wind blowing directly down the
canal (northeast to southwest), the following wave calculations can be made:
25 kt winds, 3 ft wind waves; 35 kt winds, 4.5 ft wind waves; 50 kt winds,
6.5 ft wind waves; 75 kt winds, 9.6 ft wind waves; and 85 kt winds, 10.3 ft wind
waves (U.S. Army Corps of Engineers, 1973).
It is emphasized that a slight change in wind direction, say 20 to 30
degrees in either direction, so that it is not blowing directly down the canal,
would significantly reduce wave heights to a 2-3 ft chop.
XI! I-?;

3.4.2 Beaumont
The winding course of the Neches River east ut Beaumont preclbdes long wind
wave fetches. The maximum effective fetch length for wind waves in the Port of
Beaumont is abo1t ? m lIes. With a channel depth of 40 ft and a tidal surge
heiqht of 5 ft for a water depth of 45 ft, and an easterly wind, the fol lowing
wave calculations can be made: 25 kt winds, 1.7 ft wind waves; 35 Kt winds,
2.5 tt wind waves; 50 kt winds, 3.9 ft waves; 75 Kt winds, 5.9 ft wind waves;
and 35 kt wind , 6.9 ft winds waves (U.S. Army Corps of Engineers, 1973). The
heights qiven wold occur only at the west end of the port with reduced heights
elsewhere.
3.4.3 Oranae
The ocatiorl of the Port of Orange oi, the Orange Municipal Slip effectively
precludes significant wave action at the port. With a channel depth of 30 ft
and a 5 ft tidal surge for a water depth of 35 ft, and a soutneasterly wind
blowing through the slip parallel to the pier, the following wave calculations
can be made: 25 kt winds, 1.3 ft wind waves; 35 kt winds, 1.9 ft wlnd waves;
50 kt winds, 2.9 ft winds waves; 75 kt winds, 4.3 ft wind waves; and 85 kt winds,
5 ft wind waves (U.S. Army Corps of Engineers, 1973). The wave heights Qiven
would occur only at the northwest end of the slip with reduced heights else-
where. Similar heights would be expected in the river channel adjacent to the
Lay Berth Facility with northeast or southwest winds, hut, ,ecause the plers are
oriented cross-channel, alongside areas of the piers would be protected frol any
significant wave action.
3.5 STORM SURGE AND TIDES
Storm surge may be visualized as a raised done of water, ioving wit'i tie
storm, and centered a few miles right of its path. This dome heiQht is related
to local pressures (i.e., a barometer effect based on intensity of tht storm.
and to the local winds. Other significant contributing factors are st-.orn speel,
direction of approach, bottom topography, and coincidence with the astronlcicil
tide.
The worst circumstances (Harris, 1963) would include the tollowing:
1. Intense storm approaching perpendicular to the coast with landfall
w thi n 30 n ml to the west.
2. Broad, shallow, slowly shoaling bathymetry.
3. Coincidence with high astronomical tide.

I'i4 1{ ' 1i 1 I I . T \
The Gulf Coast snore1ne aijjacent to Port Arthur f.Afl lS tI- frIS r t h
criteria and renders the Port Arthur area sjsceptbIle to storm sur r .
History has shown tnat the Po rt A rth r area is vilneranle to *,
of destructive storm surge assoc rated 1tnh tropica cyclones. Tne , jnrac t
of the area has been proven by t9.o sto r-is t ecert memory, .y rr cHnr i :,i n,
June 1957, and Hurricane Carla in Se otesDer 1961. u rey , hicn c)oved
s om e 16 -n l es east of Sabine Pass, w s on u o- t ') - T t , e v er h i r r c i a e s t
strike the oast of the United States in the 'ionth June. It Deneratel a
surge of 9.4 ft above MSL at Sabine Pass, .t, U.n t .Zoe MSL ec rre d a
Arthur and 4.5 ft above MSL recorded at 5ea jr ant . Seera 1 ites Are ;st , a r.
over 1.5 mill ion dollars of damage was iuffnre r. the area. Hurrcane ' ,
the largest storm to strike the Texas coast since 190-, crosse. tn c r:as*
approximately 200 m les southwest of Sabine pass, bit s,- ge ne Iqhts Of 9.4 ft
above MSL at Sabine Pass, 7.6 ft above MSL at Port Artnjr, U." ft asove YS at
the mouth of the Neches River, 3.1 ft above X! SL on tm ncrth sniore cd Sa -1,e
Lake, and 7.4 ft above MSL on the Sabine River at ')r an ie . tre recr deI. Cne
surge inundated 40 percent of the Port Arth ir- tea, witn i 7 Ilions o f ml -c '
damage suffered (U.S. Army Corps of Engineers, I,,9 .
Sixteen tropical cyclones have nad significant -tects ,)n tht. P r-t
area since 1900. Of these, 4 have caused sirces of ft o "',re at ve .
Sabine Pass, with 3 exceeding 9 ft. Fo r tn cse cajsI 1 n , , r t a
MSL at Sabine Pass, Port Arthur recorded surges exceei:ing 7 ft I . 9.
instances and over 5 ft in the other, witn these occurrir g i n c '4
1961. Figure X1-120 shows the tracks of the thr-ee hurricanes.
Several similarities exist between Hurricane Carla and te 191
Bet!, originated outside the Gulf of Mexico and, after ente,-ni, tne G ii
Mexico through the Yucatan Channel, maintained nurricane strerqtfh as ,
followed parallel tracks to the Texas coast; and both recurver afte ,e ,
landfall. Hurricane Audrey, an early season storm, develiped i n tnr 8 .6 If
Campeche and moved northward, crossing the coast just east of :r, ;as
recurving northeastward. Audrey's track closely approx ',ates te " , jr
probability threat track shown in Figure X[[1-1?.
iI i-'5

F i ure ;.1iI-20. Track~s of
ORANGE 6
BEAUMONT7 V K 00 / TRACOASJAIWAIERWAY
PORT ARTHUR CNL
0 S
AN14GLF Oa HINE' SABIEt
.4 PASS MEXICO
1 -26 Fiqur i i-o t' 1j , l a ions a,~, list ed 1n 0 1a bl1e X111I -4-
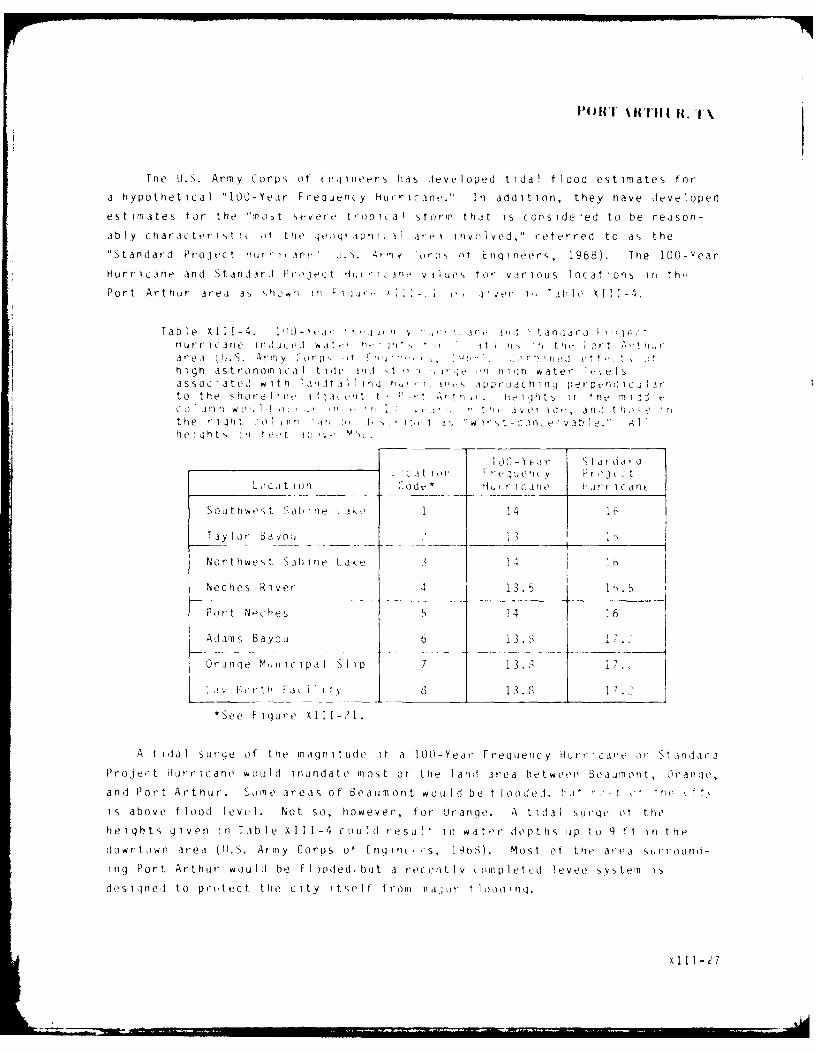
IOR{T1 %1111TII i. 'Ix
The U.S. Army Corps of Lnqtlieers has developed tidal flood estimates for
a hypothetical "100-Year Frequency hurrL cane." In addition, they have developed
estimates for the "most ,tvert tr op i a) storm that is cons ide-ed to be reason-
ably character, ilt i it the qeoqr aphlcl rt, InVOlved," referred to as the
"Standard Project Hurr icar " U.s. Army 'i "'p Vt [nqineers, 1968). The 100-Year
Hurricane and StandarJ Project Iur , re I v j jIes to" various locations iri th :
Port Arthur area as ShOwi ri l , n, -I ,, jije1i t ,n Table XII-4.
jTable XIII-4. J -tn ' i j 'i v ,i 3 'il t a n ar j f ,'eHi i r t' I C a rl e i n d i c t, al A t1 '! 'I r t o , t fl'Q 4 i
ar ea !J.S. Atr 1y ' rps ;1 Li '' ' '', PI-- J'' rj t''': ,
h gh astronomical tilt iii 't ' . i<' 'n iiilh water e'.elsassociated with a'iIt al I in 1 , ' I i,1's 3 p roachl1nl perpendlicj arto the shore 1lre i,, ,, ritt I '. 1 It . ieiqht n nC m 1! I eC oa 1 n w o I I o( ' I ' 'i j Vi a v r I jn r) t hhe i h t t e )tn § : ' w rst-cnv
I JO- ear Stdlida-ca t 1o it re j e T1 y V r I. j ' t,
Locat iOn odt,* fir c jre iurr ic an e
Southwest Sah1ne Lak 1 14 16
Tay 1or Bayou ' 13
Northwest Sab in Lak . 14
Neches River 4 13.5 1 .
Port Noc he s 5 14 16
Adams Bayou 6 13.3 .
Orange Mj 1ci pa SlIp 7 13.
f) aert a ilI i 8 13.8
*See F i gUre XIII -I .
A tidal surge of the magnitude of a 100-Year Frequency Hiurricant or St indarJ
Project HLJrr i rCne wo'ld inundate most ot the land area betwe n Beaumiiont, Oran(e,
and Port Arthur. Some areas of Beaumont would be flooded, t-(I ,,il :' tie '
is above flood level. Not so, however, for Orange. A tidal su rge at the
heights g1ven i n Table XIII-4 could result in water depths p to 9 tt In the
downtown area (U.S. Army Corps ot rig int , s, 196 ). Most of the area surround-
1ing Port Arthur would be f I )oded. but a recent Iv oliipletcd levee systeii is
desiqned to peitect the city itself from ma ir' t" boa inq.
Xii-27
I'EPlI %4T III It. TI\
Astronomical tides at tne jetti ed entrance to Sabine Pass range about 2.5 ft
and 1.5 ft at Port Arthur. Period1c tides are negligible on the Sabine and
Neches Rivers. Tidal currents between the jetties at Sabine Pass average 1.1 kt
at flood tide and 1.6 kt on the ebb, with a maximum velocity of 2.5 kt observed
(U.S. Department of Commerce, 1980). Current velocities on the Sabine and
Neches rivers depend largely on water runoff from precipitation. Maximum
channel velocities on the Sabine River that would occur as a result of flooding
have been calculated to be about 4.6 kt (8 ft per second). Because tropical
cyclones are usually accompanied by heavy precipitation, similar maximum
velocities are possible with the passage of a tropical cyclone. Velocities
resulting only from floods caused by hurricane tides, rather than precipitation,
are not expected to be significant (U.S. Army Corps of Engineers, 1968).
4. THE DECISION TO EVADE OR REMAIN IN PORT
4.1 THREAT ASSESSMENT
For the masters of deep-draft vessels, the lack of protected alongside
berths and the elapsed time required to negotiate the ship channels leading to
open water in the Gulf of Mexico make early assessment of each tropical cyclone
threat essential. This assessment should be related to the setting of hurricane
conditions of readiness by U.S. Navy, U.S. Coast Guard, and civil authorities,
and conducted using current advisories and forecasts issued by the Navy and
National Weather Service, and climatology presented herein.
As can be seen in Figures XIII-12 through X1II-16, the greatest threat of
strong winds in the Port Arthur area comes from tropical cyclones which follow
one of two main tracks. Seventy-five percent (9 of 12) of the tropical cyclones
which caused sustained winds of gale force (Figure XIII-17) followed these
tracks, with 5 entering the Gulf of Mexico from the Caribbean Sea and following
a northwesterly course to the Texas coast. Four storms, including Hurricane
Audrey, orig inated in or near the Gulf of Campeche and moved northward to the
coast. Hurricane Audrey is the only tropical cyclone to cause winds of
hurricane force to be recorded in the Port Arthur area.
While the greatest threat of storm surge occurs when tropical cyclones
approach more or less perpendicular to the coast and make landfall within
75 n mi west and 30 n mi east of Sabine Pass, any storm causing sustained winds
with a strong southerly component in the Port Arthur area could produce a
significant storm surge. A prime example of this situation is Hurricane Carla
of September 1961 (Fiqure XII -20). Carla made landfall some 200 miles
southwest of Sabine Pass, yet caused a tidal surge of near record levels in the
Port Arthur are.i.
X I I I - 28

The individual storm intensity and speed of movement affect the extent ofdamage that can be expected from any given storm. As a general rule, any
intense tropical storm or hurricane approaching from the Gulf of Mexico such
that Port Arthur is located in the dangerous right front quadrant of the storm
can result in severe wind and storm surge conditions. The months of maximum
threat in terms of frequency and severity are August and September.
4.2 EVASION AT SEA
Evasion at sea is the recommended course of action for all seaworthy deepdraft vessels when the port is under threat from an intense tropical cyclone
approaching from the Gulf of Mexico and which threatens to landfall within10O n m i west or 50 mi1les east of Sabine Pass. Timing of this decision isaffected by:
,I) The forward speed of the tropical cyclone.
(2) The radius of hazardous winds and seas that can impact on a vessel'scapacity to reach open water and then maneuver to evade.
(3) The elapsed time to make preparation to get underway.
(4) The elapsed time to reach open water.
For example:
The worst case situation would be an intense tropical cyclone movingmore or less perpendicular toward Port Arthur from the south. Assume
6 hours are required to make preparations for leaving port after thedecision to evade at sea is made, and assume another 4 hours arerequired to transit the channels enroute to deep water in the open
sea. (If the vessel were departing Beaumont or Orange, the transit
time would increase by 3-5 hours.) A tropical cyclone approaching atan average speed of 10 kt w ill have moved 10O n mi1 c loser to PortArthur by the time open water is reached and the vessel is about20 n mi closer to the cycinne. Add to this the radius from the
tropical cyclone center of strong winds likely to hamper harbor
operations, say 200 n mi. Summing these values gives 320 m iles(20+100+200) or 32 hours (at a 10 kt speed of advance) as the minium
tropical cyclone displacement from Port Arthur in distance or time
when the decis ion must be made to evade at sea successf ulIly. Agreater margin may be applicable depending on greater cyclone speed and
intensity, and speed capability of the vessel.
Hurricane Condition III is set when hurricane force winds are possible
within 48 hours. It is apparent that the decision to prepare for sortie should
be made soon after setting Hurricane Condition 111. Although at this time the
X1 1 1-119

storm center may be more than 500 miles distant, it should be remembered thatthe average tropical cyclone forecast error over a 48-hr period is on the order
* of 220 miles for those tropical cyclones threatening Port Arthur. Later
departures wager the accuracy of information on the storm's behavior against
;nounting risks of heavy weather damage.
Once sea room is attained, the tactics employed will, of course, depend onthe location of the threatening tropical cyclone, its speed of advance, and its
direction of movement. Up-to-date information is essential if sound decisions
are to he made. Tropical cyclone location and intensity information withtoday's satellite technology is accurate and timely. Forecasts and warnings are
issued at 6-hourly intervals and updated as necessary to reflect important
changes in position, intensity, and movement.
Ship masters wit access to these advisories/warnings are in the bestpossible position to modify evasion routes and tactics, as required, to
successfully evade the storm. The cardinal rule of seamanship is to avoid the
dangerous right-hand semicircle. The following guidelines are offered:
(1) For tropical cyclones approaching from the east or southeast: Steam
southwest to increase distance from the storm while taking advantage of
fol lowing winds and seas. Because of the shape of the Texas coastline west of
Port Arthur, maneuvering room is restricted; a fact which must be considered
before an e~asion to the southwest is attempted.
(2) For tropical cyclones approaching from the southwest: After an early
departure to avoid the worst effects of headwinds and seas, steam south or
southeast to reach a latitude south of the cyclone center.
(3) For tropical cyclones approaching from the south: Tropical cyclones
moving across the Gulf of Mexico in a northerly direction present the mostvexing of evasion problems. Many storms move directly into the coast early in
the season, but in September and October there is a strong likelihood of cyclone
recurvature to the northeast while still centered over the Gulf. An evasion
route decided on earlier may have to be altered based on unexpected changes in
cyclone movement. Evasion tactics must be based on the latest tropical cyclone
forecast position and movement.
4.3 RETURNING TO HARBOR
The damage and disarray at a port resulting from a tropical cyclone strike
may include navigation hazards such as displaced channel markers, wrecks in thechannel, or channel depths that no longer meet project specifications. Also,
since each of the Ports of Port Arthur, Beaumont, and Orange is accessed by
narrow channels, the potential for such hazards is large. Harbor facilities may
be so damaged as to preclude offering even minimal services. Check with the
Port Authority before attempting to return.
X II I -30

4.4 REMAINING IN PORT
Remaining in port at Port Arthur, Beaumont, or Orange is an option that
should receive serious consideration whenever a vessel is incapable of
successful evasion at sea or in secondary threat situations, including:
(1) A tropical cyclone developing within the 180 n mi radius critacalarea.
(2) A weak tropical cyclone approaching from the Gulf of Met-iiu and
forecast not to intensify.
(3) A tropical cyclone approaching overland from the east or west.
(4) A tropical storm/hurricane expected to approach within 280 n mi andmake landfall more than 100 n mi west or 50 miles east "if Sabine Pas.
If a decision is made to remain in port, and if vessel draft is
sufficiently shallow, use of the Port of Orange Lay Berth Facility (Figure
XII-9) is recommended. The strength of the concrete piers makes it 'fore
acceptable than the marginal wharfs at the Orange Municipal Slip and Port
Arthur. Wind speeds at Beaumont would be somewhat reduced die to f irction, but
local authorlties express concern regarding the strength cf thf, t aI ;rd s an-!
bits on all but one wharf at Rcaumont, and consider them .;nacceptable in a
hurricane wind situation. If vessel draft or non-availability precludes use of
the Lay Berth Facility at Orange, few desirable options -emain. Securing the
vessel to the most structurally sound wharf available is recommended, using
sufficient lines to withstand hurricane forcL winds yet allow for water heignt
fluctuations of the predicted n ,unts. Bow and stern "insurance lines" ot heavy
wire rope are recommended.
Riding out a tropical cyclone at anchor is an alternative that shoul I tJ e
considered only in an extremely weak tropical cyclone threat situation. Except
for the Maritime Administration anchorage, none ot the anchoraqes shown on
Figure XIII-2 have the qualities necessary for a good heavy-weather anchoraiqe.
Since Maritime Administration permission would have to be obtained, and drafts
are limited to 16 ft or less, use of the Maritime Administratinn anchorage would
be restricted to only the most exceptional cases.
5. ADVICE TO SHALLOW DRAFT VESSELS
Shallow draft vessels should, if feasihle, be removed from the wattr a id
firmly secured ashore at an elevation of at least 20 ft to avoid possible high
water. Short of this i t is recommended that smal I craft seek shelter- 1n t he
upper reaches of the Neches River above Beaumont or the Sabine River above
Orange. The U.S. Coast Guard at Port Arthur, upon the setting of Hurricane
Condition One by the Eighth Coast Guard District, sends its small craft to the
XII-31

Sabine River at Orange. It should be borne in mind that southerly winds and
somsurge, coupled with upriver precipitation runoff, may cause extensive
flIoodi1ng .
The following extract from U.S. Coast Pilot 5 (U.S. Department of Commerce,
1980) is relevant: "Hurricane moorings. On receiving advisory notice of a
tropical disturbance small boats should seek shelter in a small winding stream
whose banks are lined with trees, preferably cedar or mangrove. Moor with bow
and s tern lines fastened to the lower branches; if possible snug up with good
chafing gear. The knees of the trees will act as fenders and the branches,
havi1ng m ore g ive than the trunks, will ease the shocks of the heavy gus ts. I fthe banks are lined only with small trees or large shrubs, use clumps of them
within each hawser loop. Keep clear of any tall pines as they generally have
shallow roots and are more apt to be blown down."
Using open water anchorages to ride out the passage of a tropical cyclone
is extremely hazardous. Virtually no protection is afforded except near the lee
shore. Wind wave activity can be quite destructive, not to mention the hazards
of floating debris resulting from the effects of wind waves, high water, andh igh wi nds .
The prudent small boat operator will have selected several potential havens
beforehand in which to take shelter in various tropical cyclone threat situa-
ti1ons. He will proceed to his haven well in advance to avoid the chaos and
congest ion endured by h is f e Iluw boaters who del1ay until the onset of
destructive conditions is imminent.
XII 11-32
REFERENCES
Harris, 0. L., 1963: Characteristics of the hurricane storm surge. U.S.Weather Bureau, Technical Paper No. 48, U.S. Department of Commerce,Washington, DC.
Hebert, P. J., 1974: North Atlantic tropical cyclones, 1973. Mar. Wea. Loq,18, 1, pp. 8-16.
1980: Atlantic hurricane season of 1979. Mon. Wea. Rev., 108,7, pp. 973-990.
Neumann, C. J., G. Cry, E. Caso, and B. Jarvinen, 1978: Tropical cyclones ofthe North Atlantic Ocean, 1871-1977. National Climatic Center, Asheville,NC, in cooperation with the National Hurricane Center, Coral Gables, FL,170 pp.
, and M. J. Pryslak, 1981: Frequency and motion of Atlantictropical cyclones. U.S. Department of Commerce, National Oceanic andAtmospheric Administration, National Hurricane Center, Coral Gables, FL.
U.S. Army Corps of Engineers, 1968: Flood plain information, Sabine River andAdams Bayou, Orange, Texas area. U.S. Army Engineer District, Galveston,TX.
, 1973: Shore Protection Manual. Coastal Engineering ResearchCenter, Kingman Building, Fort Belvoir, VA.
1 1979: Sabine Lake study segment, Texas coast hurricane study.U.S. Army Engineer District. Galveston, TX.
S 1980: The ports of Port Arthur, Beaumont, and Orange, Texas_Port Series No. 22. Water Resources Support Center, Kingman Building, Fort
Belvoir, VA.
U.S. Department of Commerce, 1980: U.S. Coast Pilot -5 Atlantic Coast: Gulf ofMexico- Puerto Rico, and Virain Islands. National Oceanic and AtmosphericAdministration, National Ocean Survey, Rockville, MD.
XII1-33

acaI

XIV: CONTENTS
1. Geographical Location and Topography . . XIV-2
2. Port and Harbor Facilities XIV-4
3. Analysis of the Tropical CycloneThreat at Tampa XIV-7
4. The Decision to Evade or Remain In Port . . XIV-26
5. Advice to Shallow Draft Vessels . . . XIV-30
References . . . . .XIV-32

X I V. "r:t mP. F L ( RII) A
SUMMARY
Tampa's location in the hurricane belt, lack ofsheltered facilities, and vulnerability to storm surgerender it a poor hurricane haven. Evasion at sea isrecommended for all seaworthy deep-draft vessels when Tanpais threatened by an intense tropical storm or hurricaneapproaching from the Gulf of Mexico, or hurricaneapproaching overland across the Florida Peninsula.
Small craft should be removed from the water and firmlysecured above the predicted high water line. Otherwise,seeking shelter in the upper reaches of the Hillsborough,Alafia, or Little Manatee Rivers is recommended.
Located on the west coast of the Florida Peninsula,Tampa is the largest port in Florida and the 7th largesLport in the United States. No U.S. Navy ships are home-ported in Tampa, but MacDill Air Force Base is a prominentmilitary presence.
Tampa has been threatened by an average of 1.6 tropicalcyclones per year, of which I out of 5 caused sustainedwinds of gale force in the Tampa area. While there are 4recorded instances of sustained 50 kt winds during the years1932-1979, only one tropical cyclone caused sustained windsof hurricane strength.
The hurricane season is late May through earlyNovember, but Tampa has been threatened by tropical cyclonesas early as February and as late as December. The months ofmaximum occurrence are September and October, but June is astrong threat month for tropical cyclones moving northwardfrom the western Caribbean Sea.
Although the landmass of the Floridd Peninsula lieseast of Tampa, it affords little protection from tropicalcyclones. History has shown that Tampa is vulnerable totropical cyclones approaching from all directions. Forty-two percent of all t,-opical cyclones causing sustained windsof gale force to be recorded in the area had trajectoriesthat carried tnem over a large portion of the landmasssoutheast of Tampa prior to affecting Tampa.
This hurricanu havon evaluaLion wa; irepvar, A I yR.D. Gilmore o Icedn Dita Yst 12m ;, Inc. (()D; I),Monterey, &'A I) 4. XI V- I
Change 1

1. GEOGRAPHICAL LOCATION AND TOPOGRAPHY
Tampa is located at the approximate mid-point on the w st cLast of t,
Florida Peninsula. As shown in Figure XIV-1, the city 3a Part 't +aip ;
the north end of Hi 1 lsborough Bay, an arm of Tampa 6ay. OApPro il t I 'T h ttI,
ti les wide and some 20 mi les long, Tampa Bay serves not only as ac e .
Port of Tampa, but also the Port of St. Petersburg, Port Taipa, j i ,rt
Manatee.As is the case with many of the areas on the Gulf Coast, the 1 anis
surrounding Tampa Bay are generally low in elevation, and mucn of tre h -it
real estate has been developed for homesites or industrial purposes. E,,z ,t '-t
a section of southern Pinellas Peninsula, few elevations reacn 30 ft withlii;
miles of the bay.
For deep-draft vessels, the main ship channel passes between E uot nt ,,v
Mullet Key into a dredged cut that enters Tampa Bay (Figure XIV-1). Fele]
project prov ides for depths of 36 ft in the entrance from tne Sulf of L1,e i ,c
thence 34 ft to Tampa and Port Tampa (U.S. Department of Commerce, 19SC'. *
Southwest Channel, a natural passage south of Egmont Key, has c0 e
depth " about 16 ft but is subject to shoal ing (U.S. Department of 7om ,,r-C ,
1980). Use of Southwest Channel is not recommended for ocear Qo iriq t_ S
except those with very shallow drafts.
Water depths in Tampa Bay vary significaritly froi one locatici ta aoth r,
out are generally shallow with depths less than 15 ft outside tne nritur a
channel through which the dredged channel is cut.
The waters of Old Tampa Bay (Figure XIV-1) are uniformly shallow wit,
depths of less than 12 ft predominating. Depths of 15 to 17 ft are loc.ato:,. tt .-
the center, while 18 to 24 ft can be found in a small area in the soutnoas.t
corner of the bay. Water depths in Hil sborough Bay IF qure XIV-1 are is1
shallow with depths outside the dredged channel generally less than _' it.
One bridge crosses the channel at the entrance to Tampa Say. Ca iled t It
Sunshine Skyway, it is a land-filled causeway for most of its length, UtJI
becomes an 800-ft fixed span over the main ship channel with cIearaI im s i, t
149 ft at the center and 140 ft at the fenders (U.S. Department of Comm ert, ,
1980). Originally constructed as a twin span bridge, it yas reduce1 t , I . i
span after the westward structure was downed when struck Ly i, inrp Ijr n
storm. No other bridges cross the ship channel. Three low-c lcvar 1o i ., C ,a,
and bridge combinations cross Old Tampa Bay between Tampa and PineIlas Po11 1 n
but do not cross the ship channel arid, therefore, do not impact snip m)ivy.rio1nt.
*See Not ice to Mariners and latest edi tions of chatts for cont rol I d rpthi
XIV-2

CLEAR WATERPOTFTAA
HILLSBOROUGH4
RIVER
'~HP HA$~-~ -- N.PENINSULA
GULF PORT Of: ST,11 MACDILL AFB
OF PETERSBURG ,4I'
MEXICOBAMATE
MULLET KEY
NAUTCART MANATSCAL
~~i(Jure~31 (SV-E FIGUREoo oftmaBi ot ai tf X Irti CI ,
EGMONT---------

,,,,,,,.,,
TAMPAXo REVCTOR
0 U.S. NAVY C TURNINGRESERVE CENTER BASIN0 WHAR F
4!.
SEOOON MCKAY BAY13LAND
NDAVIS3
ISLANDHOOKERS POINT
Figure XIV-2 r T
PORT SUTTON/
00 oLP POINT
HILLSBOROUGH BAYz
SCALE IN YARDS CD
0 1000 2000 3000
Two ow-elevition, f xe d, n , qh oiay br 1 dges cross the sha I I ow A 3 a , o, t
Davis Islands (,Figure XIV-?). With a width of 34 ft and clearance of ,iv
the bridges 1 1 t the use of the waterway to small craft. r I ., Ia :
with an unoptne ! clearance of 5 ft crosses Garrison Channel nuorth .
I lan t- iq jre X I-2 U.S. Department of Commerce, 1980).
2. PORT AND HARBOR FACILITIES
. iEPIHe FOR DEEP DRAFF VESSELS
>.1. Port of. Tampa
Tqe P-)ort of T.ampa inc ludes the facl ities at Tampa orop< , 9 ort Tr"a 1- t
i tt)n, an, I ast Tampa (Alafia River). 0Of the 96 pierS, wharv:o , .i t d atthe Port if Tampa, only 19 are owned h the Tampa Port Authority. f th, o
hIve Iln i sIde de pt hs of less tha n ?) ft, and art ni;t cons1i d reJ to !e lct, p-
draft fac I I tIes. The remaining 16 ir te l ,cat aroind the pe, I phery if Hoo4,,t-
Point and on Yhor Channel. With 1 l1nsiIde dPpt:,.s of 2) to 1 ft %30-. 34 ft
predominan g), thI facilitite have uf(I k he1Ihts ran(inq fromin 6 t, , t, wit
most ldeck hI Ihts In the 6 to 8 ft ran ( .
X IV-4

*i ri t .i ip i 4 o t r o
r :i I I 4 ri J
'b r iinrle ] 1 r Al - . tO Ir ' 'i I ,- : trl '- ft. arl r . *' (q
o l 1- }I r; ' rto l q f l i - s at t o t of T op a can j
in ri ,t r- I qn in 9i y tn .S op f Eri~Te nli i in aaIS r, i I I a I f , e'Ie e-t , t tus an tjWboats.
q~i~i fi S I ii w 0 C K fa jokn 13rIo aol ind o Kln i nT A *37 a 'ii towirl t )tile points Oj rhe Iulf of Mexico.
.> [. Prt M~nt "
Pot ,i , teE, i ,n- I n ,);er atd ny tn- anatee io~rlty Port >utio it,, ]
A- 1. !,. t e , ,tnie t ri' ~ 0 .a 3ay sne e i ,es east ,f Egmont e!
,t 'Ai t , 1 S~- 0y a pciliately dredIpl e d ia n ia annel tlat
n - -! T snfi b n n- app ro imately 'iii7 s above Sfnsln ./Ay.
" t e a 0 n'ij *L .t, t e 4JQ-0t e channel leads to a 3b-ft e
I Vt . ., s n ,iV-3. The o, t i s a 35-ft deep
t f IA~i i e detos eahc e of 3cCcomm n I'-s ft 41th deck heights of 6 to 9 ft
, 1-.
' ' alaras, soine S-ton ba lards and 3-tI n as
ia-:. e f nerth ino barqes to 6 . ft 0ong in j 1 f
j,, . - an n at toe nrth sle of tne entrance )lanatee
" .. 1 4 ........
T
x I.
TURNINGBASIN TRANSIT
SHED
- APPROXIMATE CHANNEL LIMITS
- .... PORT MANATEE WHARFS
\ SCALE IN FEETa00 1000 1800
\ r I F, o r M anata tleb

'\ ' . Fl.
Port Manatee has two 2000 horsepower diesel-operated tugs ava1lable fordocking, undocking, and vessel movement as necessary.
?.1. 3 Port of St. Petersbur
The Port of St. Petersburg is not considered to be a true deep water port.
Although, according to U.S. Department of Commerce, 1980, "A draft of 25 ft can
be taken within 0.5 mile of St. Petersburg by following the main snip channel
through the west reach leading to Port Tampa, then turning southwest into the
natural deep water area extending toward St. Petersburg," the controllI ng depthl
in the port aasin is only 15 ft. The Port of St. Petersburg has 1500 ft of
ber t ing space with an alongside depth of 17 ft and a deck height of 3 ft ;U.S.
Department of Commerce, 1980).
Tne J.S. Coast Guard maintains two shallow-draft 210-ft cutters at the Port
of St. Petersburg.
2_1 HEAVY WEATHER FACILITIES AND ANCHORAGES
Tampa Bay offers little shelter from heavy weather. The generally low
eIevat ,)ns of the surrounding terraln afford only limited protection fron strong
wInds. The configuration of the bay m. akes it most vulnerable to winds from the
soiti or southwest, but the area is liable to the effects of wind fron any
-e-tion.
ee.eral anchnrages are available in or near Tampa Bay. Accord irig to -. S.
ieoa' t, n t of inerce, 1980, "Vessels with good ground tackle should ancho" 7n
tne Tampa Anchorages, N and S of the Tampa Safety Fairway I eading to Egmont
Channel .... These anchorages can be used to ride out any gale short of a
hurricane." The approxi:mate positions of these anchorages are indicated by the
ietter "A" on Figure XlV-i. )ther commonly used anchorages are indicated by the
letter "B" on Figure XIV-I out, according to local authorities, they are
recommended as fair weather anchorages on ly and should not he used for ridino
out a storm.
Facilities are avallable for making repair to hulls and machinery.
Included in this capability are two graving docks, one measuring 900x150 ft (the
largest on the Gulf Cost), and a second measuring 546x76 ft (Tampa Port
Authority, 1981).
Tugs are normally used for assisting in docking, undocking, and towing.
They are in plentiful supply for normal operations, but since some may be out of
the area on towing jobs to other ports, and in view of likely increased demand
when heavy weather is expected, arrangements for tug services should ce made as
early as possible.
XI V-6

Tt PA .. FLI
2.3 FACILITIES FOR COASTAL AND IN-SHORE VESSELS
Tampa Bay is located in an important shipping and fishing area and serves
many fishing vessels. The region is also a major winter resort area and home to
thousands of recreational boaters, so Tampa Bay and surrounding waters are busy
1wtn small craft of many sizes and types.
Numerous marinas permeate the entire region, offering a complete range of
accommodations and services, including repair, fuel, ice, water, and food for
recreational boaters, and in some instances, small commercial fishing vessels.
Several commercial facilities for serving coastal, inshore and fishing vessels
are described in Port Series No. 17 published in 1979 by the U.S. Army Corps of
Engineers.
3. ANALYSIS OF THE TROPICAL CYCLONE THREAT AT TAMPA
3.1 INTRODUCTION
By examining relevant characteristics of tropical cyclones such as track,
speed of movement, intensity, month of occurrence, etc., some insight may be
gained into their typical behavior. This background knowledge and understanding
allows attention to be focused on those storms most likely to have a serious
effect on Tampa. However, the historical behavior of storms and their impact on
Tampa should not be regarded as a reliable guide to the detailed behavior and
impact of a particular storm as it approaches the port.
3.2 CLIMATOLOGY
For the purpose of this study, any tropical cyclone approaching within
180 n mi of Tampa is considered to represent a threat to the port.
The location of Tampa on the west coast of the Florida Peninsula is
significant, since the coastline is nearly parallel to normal tropical cyclone
tracks as they move more or less northward out of the tropics. Also of
importance is Tampa's latitude of about 27.8N; this is within the normal locus
of tropical cyclone recurvature which oscillates between latitudes 25N and 35N.
This latter factor is important, because it is the character of tropical
cyclones to slow and intensify during the recurvature stage. During
recurvatLue, it is difficult to predict with great accuracy the rate of
recurvat -e, the storm speed of movement subsequent to recurvature and,
obviously, the storm's precise future position at a pcint in time.
The hurri(ane season extends irom late May through early November, but
tropical cyclones occur occasionally outside of that period, with Tampa
recording storms in February and December. During the 109-yea, period from 1871
through 1979 there were 171 tropical cyclones that met the 180 n mi threat
XIV-7

T 1 PII k. I'I.
criteria for Tampa, an average of nearly 1.6 per year. Table XIV-1 shows the
monthly totals and percentages. These data are graphically presented in Flgjre
X I V -4.
Table XLV-1. Monthly totals of tropical cyclones passing
within 180 n mi of Tampa during the period 1871-1979.
Month Number % of Total
February 1 0.5
May 4 2. 4
June 21 12. 3
July 12 7. 0
August 28 16.4
September 50 29.3
October 52 30.4
November 2 1.2
December 1 0. 5
Figure XiV-5 illustrates the 171 events as a fanrction of compass octant
from which trop'cal cyclones have approached Tampa drting the years 1871-1979.
The numbers in parentheses represent the percentage of cyclones from the sample
approaching from a particular octant. The figure shows that the major threat
sector extends from the southeast through southwest, as 67 percent of the
cyclones approached from those sectors. It is significant to note that tropical
cyclones have approached from all of the octants; no octant is "safe" from a
storm's approach. Of the 12 tropical cyclones that have caused winds of gale
force (34 kt or greater) to be recorded at Tampa since hourly wind records 6ere
first maintained in 1932, 5 have had trajectories that carried them over a large
portion of the land mass southeast of Tampa.
Six tropical cyclones have formed within 180 n mi of Tampa, of which 2
developed rapidly to hu ricane strength.
Records of tropical cyclones penetrating the 130 n mi critical area during
the 81-year period for which tropical cyclone intensity data are available are
tabulated in Table XIV-2 by intensity and month of occurrence. Whereas Table
XIV-1 showed that October had a slightly higher percentage of tropical cyclone
actIvIty when all of the 171 tropical cyclones occurrng durinq the period 1371-
1979 wer considered, Table XIV-2 shows September to he the month of greatest
activity for the years 1899-1979. Of 53 hurricanes recorded during this perind,
34 (64%) )ccurred in September and October. Overa' 1, 79 n it of 1I] (69%)
t-opical cyclones occurring during this 31 -year period jere of tne two strono,.,st
atoqor les
XI V-8

48- -
0Z 40-0
32- Figure ,! '-4, Seasona< .Jdistribution of tropicai
0 _cyclones passing wi ifn0r 180 n mi of Tawpc (based'" 24 on data from 1 71-1979).
0Co
z
J F M A M J J A S 0 N D
MONTH
\ /
4 6
(2%) / (%
Figure XIV-5. Directions of N
approach of tropical cyclonesthat passed within 180 n miof Tampa during the period1871-1979. Numbers of storms 23% Z-W E- 23
approaching from each (1 ) (13%)
octant (e.g., 35) and per-cent of the total approach-ing from that octant (e.g.,21%) are shown.,
3/ '\\ 323%)(23%
35 (21%)
x I v -9

TI' P-. H'.
Table XIV-2. Classification of 115 tropical cyclones whicri passedwithin 180 11 mi of Tampa during the period 1899-1979.
Mdxlmum Feb- f Nov-Intensity' June July Aug Sep Oct Dec Totals
Hurricane 5 4 8 19 15 2 53
Trop 1 cal . i 6 6 5 K) 26Sto rin
WeakTrupicd 3 3 2 4 7 1 VS to rm
Trop caDepressitn 5 2 3 6 1 0 17
TOTALS 9 19 35 28 3 115TOTALS _ _ __ __ __ _ _ _ _ _ _ _ _ _ _ _ _ _ _
*Iritens I ty va iuS reflect the maximum intensity while in the 130 n mli
t , .j ra Ius )f Tam a . Upper 1lim it of a weak tropical storm 's 47 kt.
ij ures X TV-6 tnrough XIV-I0 are statistica' summar ies of threat proDabi1-
ity for the yeJ s L71 through 1979. These summary data are oresenttd in fi e
hnarts, ech reoresenting data encompassing specific period s d IrIfnq the year:
tropical cyclenes occurring during February through June, July and August,
Septem ur, October through December, and all tropical cyclones, of record du,-ni
the 109-year period.
The 591 id I Irie 11 n hese figures represent the "Percent tT :at" t or any
storm icat ion. 'he dashed lines represent approximate approach t-05 t j Tmapa
has e on the cl a t.ologlcal approach speed for- a particular I ,caI on. Fur
exaIple, n Figure A IV-6, a tropical cyclone located over western Cuba has an
0% probabi 1 i ty of pas-s, ng within 130 n m of Tampa, and wou 1 r e ac h Tam )a II IC
to 43 hour , (1 1/2-? ,lays).
The average speed of advance near Tampa of all tropical cyclones with winds
of at least 34 kt that have threatened Tampa is about 8 kt. Early season May
to mfi -July) speeds are somewhat higher, averaglng 9 to 10 kt, while nid-se3son
(mid-July to mid-August) speeds are about 7 kt (Neuiann and Pryslak, 1931).
A comparison of Figures XIV-6 through XIV-9 shows some distinct differenice -
in threat axis accordi ng to time of year. Early in th, seasor: trnovi fenrhuir
through Jun e ( (Fig - XIV-6), the pri :narv thru,-at axis x i iates in t h, w-stern
Caribbean Sea past of Nicararjua, and exiends northward acrnss west ori r b A t
Tampa. A ,secondary tireat axis or iginates north of the estern ahama Isli d
and *xtends west-northwrisIward across Flor ida t.o Taill, .
y I u I v a Id 11 s 9 I F I I r, Xl V - I!, t lie in a ! t hr e at a l, ha c f, f t o (I
iraiat i ra 1 j nor tt. Ii t. ward( to po i i) It I r 1'U h f t ti t a ly ra I
,ec ondar tra k. (lr iqi, at Inr n thu LCser AnIt 1 e, n ir s I ( t o I I I' 7a 1 Il
xIV- io

LLI P
K z -
0 I v -

CY.
m CLc
CL ~
C,3'
<n
- C-.- Y
-- o-
rC

0
000
C
U.) 0. c0./ ~ 4
-~ cc;
CV))
CMC
cv ca
c
c7
x I v- 13

4j 0- C"
m 0. ~ X co
c c
I V- 1

track progresses northwestward across Puerto Rico, tie Banama Islands, and
F1orida Peninsula to Tampa. A seconj extension of tiie sa' e ta at ,
the Atlantic Ocean wel I east of the Banama Islands and fo] l!ows a West
until It merges with the first axis near the Baham as.
The ialn threat axis for September 'Flgure XIV- os eSy te !
extension of the primary axis for duly-August. oriinat i jis n rit', 1 tin
Lesser Antilles, it passes north of the Greater Anti lles, ' e i, Ln
Islands and the Florida Peninsula to Tampa. A secondarY trIe t , s '
in the western Caribbean Sea and extends northward ac',<ss ,j a t 3 3jpa, be,
strong resemblance to the primary track for early season s 'o I FeI)rja v
through June.
The threat analysis for October through December Fd.rts KV9 rgv'. Is
more complex pattern than that shown for other nontris, ti t 'i-- -
tracks evident. The most prominent of the tracks otn ii tiO, :a, '
Anti 1 lIs and extends westward across the Car ibbea'i Sea, tn , 's n e '
across western Cuba to Tanpa. A second ix1s starts tI - i -t.. -,1 3 '1
Islands north of the Dom nlcar Repu bl i-c and e teor.js w st- ',t -I f0 I
Florida to Tampa, while the thiri axis or 1q i a t i 1 tnt, 4 t . , I
Campeche, and extends northeastward across tn" Guli: ,* Xe ic t T- l.
Figure XIV-1O represents a composite plctire of th,,It , ti '
to CPA curves for the entire year and is derived fro, .al t v 1 3 cy
tracks passing within 130 n mi of Tampa during the period 1 -i979.
TAMPA -ALL _1 M1
11,,-2 3-4 ,',, bi,,,, ,*, , ., . .
aye Days w0il I ss -. Its 8 N I .I ...
polO t of dppr',, h
S -Days
TA A'.~-
I -t33
40% 77"
\ o ' e o ' , o
22o.
4-" -t , 20%
26% so 060
Figure XIV-10. Probability and CPA curves for all trupical (yclones
pas;ing within 180 n iii of TaIiipa (shaded circle), based on data XIV-15from 1871-1979

3.3 WIND AND TdPOGRAPH':cAL EFFECTS
Rec,)ris of hourly wind data for location s in tl' gr- ,atrr Taipa Bay ar_ Oe
vi liale for the pe-rod 1!93? througn 1979. One ,,.tton -- St. Pet-rsbu --
has recorjs available for the entirt 4,3-year period, 1 hle Tampa i 3nJ YacD A7
Fcr:e 3ase have recoros for" shorter per ds. The hiOur y recr s that Yrre !nd
n thi s study are:
Tampa Nove'nber i935 tnrog Septe'mber I379
St. Petersburg Agust 1932 through September 1979
MacDi I I AF3 September 1941 through September 1979
The locations of the observing stations for Tampa, St. Petersburg, and
Ma,,-.Dill AFB are i nd cated by tie n mbers "I" tnrouqh 3" respectively on FIg jrXIV-i.
In the 43-year perod for" which wind data are avallable, 75 topical
cy. o nes approached .ith~n i10 n mi of Tampa, an averaqe of 1.6 per lea,;.
tabul ar breakIown based on intensity of these cyclones vhihle within tle -
radius is shnwn in Table XIV-3.
Table XIV-3. C1assif icat ion of the 75 tropical cyclones which
passed within 180 n mi of Tampa during the periol I32-1979.
Hurricane Tropical Storm Tropical Depression63_kt) 334 to 63 kt) ( 34_ kt Total 'I No.'
31 28 16 75
Of the 59 tropical storms and hurricanes, 12 caused sustained winds of
34 Kt or greater in the Tampa area, based solely on hourly wind observations
durinq the period. Four of the 12 caused sustained winds of 50 kt or ore1 ter,
with I causing sustained winds of hurricane force (64 kt or greater,. Two of
the rem a in ing 3 caused gusts to hurr icane force. Based on the 193? throuqn 19 9
wind data, gale force winds can be expected from I out of every 5 tropical
itorms/hurricanes passing within 180 n mi of Tampa, and hurricane force nds
can be expected from I out of every 20 tropical storms/hurricanes.
Figure XIV-11 depicts the tracks of all 1? storms that ca :sed gale force
w inds in the Tampa area (track information from Neumann et a]., 1978). F igure
XIV-12 shows the location of each storm center when winds of 23 kt or greater
and 34 kt or greater were recorded. Figure XIV-13 depicts the wind directio)
distribution for the same 12 storins while winds of gale force were recorded. It
is interesting to note that while gale force winds were recorded from all
directions, 11 of the 12 gale force occurrences started when the wind direct:on
fell within very narrow boundaries -- from n)rth-northeast through northeast,
and from south-southwest through southwest.
XIV-16
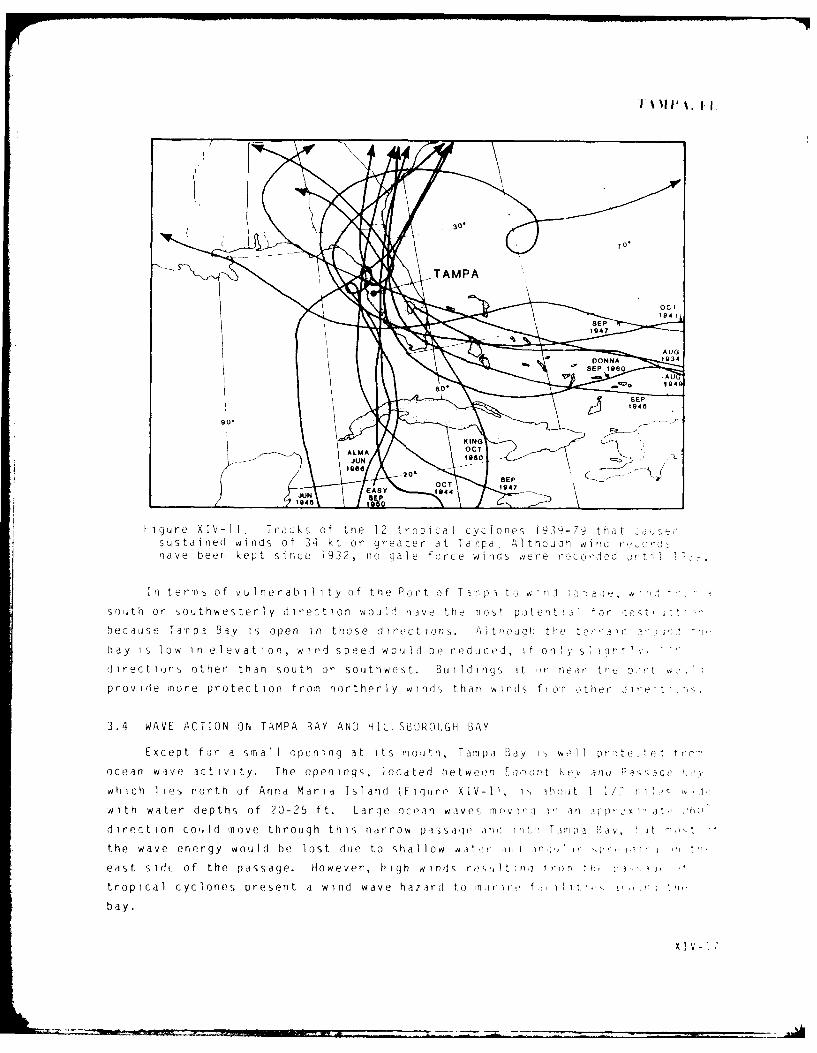
1006 2O~SSEOCT 10471947
JUNSE EASY104
19461SEP
Fiue I-] rck fto 2 rpca ycoe go-, nt ~osustinedwins of34 k orureaer t Tapa. ltn~oKINGn
nave ~~LM benkpOic 92 oql o C Tio eercre .113
in ers o vlneablit o te Prtof imi tw naJUNirsooh r sutwesery iretin wo .1hav te mstpae't ~ lessil
Exce fur- a s Tia ?,L k1 opein te1 it ou , ma Ia iy n s wol 13 79 riato 1 a.! I,ocen swveacivty.i The openingsor loated hatwoon~pa Atvrot _ wiv nd Pis-c-sqe
r h c h 1 i es ri ep ti c h9 of An a M a rq a I s 1 a ri c e i n in XIV- l s w o et 1 e r c o r d e d u
iTh wat er deth s i o20 uIn -2 f 11t Larg ne nPo wiv) rnvi~ it ao if'x Tt i p
diret ori ouldwe toer thrugh tisn ndo.. w ph si mo v h u t T,) t ev or-t les
th wIv enrg wol be los due to shloari 1 i 'p-n .t
e ast s Ido o thne epasa ge Howevind pPedw, ! hIg ind b v en . ifo n 1 y t Iniq
trop icalir cyc oe t prsnt arownd wael wa1nd -,toh ar tond f r IT iti h mrAw
ba. W V AC IN O TA P BA AN 1.S0 lG BA
Except ~ ~ ~ ~ ~ ~ ~ ~ ~ 1- fo 2ml1oeigi t ~oh Mp

GEORGIAATLANTIC
FLORDA -- I OCEAN
WW *23 KNOTS BEGAN I0
SWINO *234 KNOT3 CEANED
SWIND t34 KNOTS CEASED /
Ils S Sjvjn are track seoce-tc cf cI d rdisred lines,)
N
Figure X.IV-13 Directions of winds34 k t or uirea ter in the Tarpri are-aduring trcpi cal cycl one rassages,193q-79. Tejinninq and end of galeforce winds Shown Dy dot and drrow-nead, respectively, a s i n F igu r e w ------ ----- * EXIV-12. Clockwise di r eci o nchanges indicate ctorm pa3ssage tothe west, while crunterciockwise1bchanges indicate passages to tneea st - *

AD-A130 264 HURRICANE HAVENS HANDBOOK FOR THE NORTH ATLANTIC OCEAN 2/1CHANGE l(U) NAVAL ENVIRONMENTAL PREDICTION RESEARCHFACILITY MONTEREY CA R 0 TURPIN ET AL. dUN 83
UNCLASSIFIED NEPRF-TR-82-03-CHG-1 F/G 4/2 NL
mIIIIEIII IIlllmlllliimIEIIEEIhlllE-- U-omoomo

- _ 11111225
-.0 IIIIL2
11111125 1. 16
= = = = E
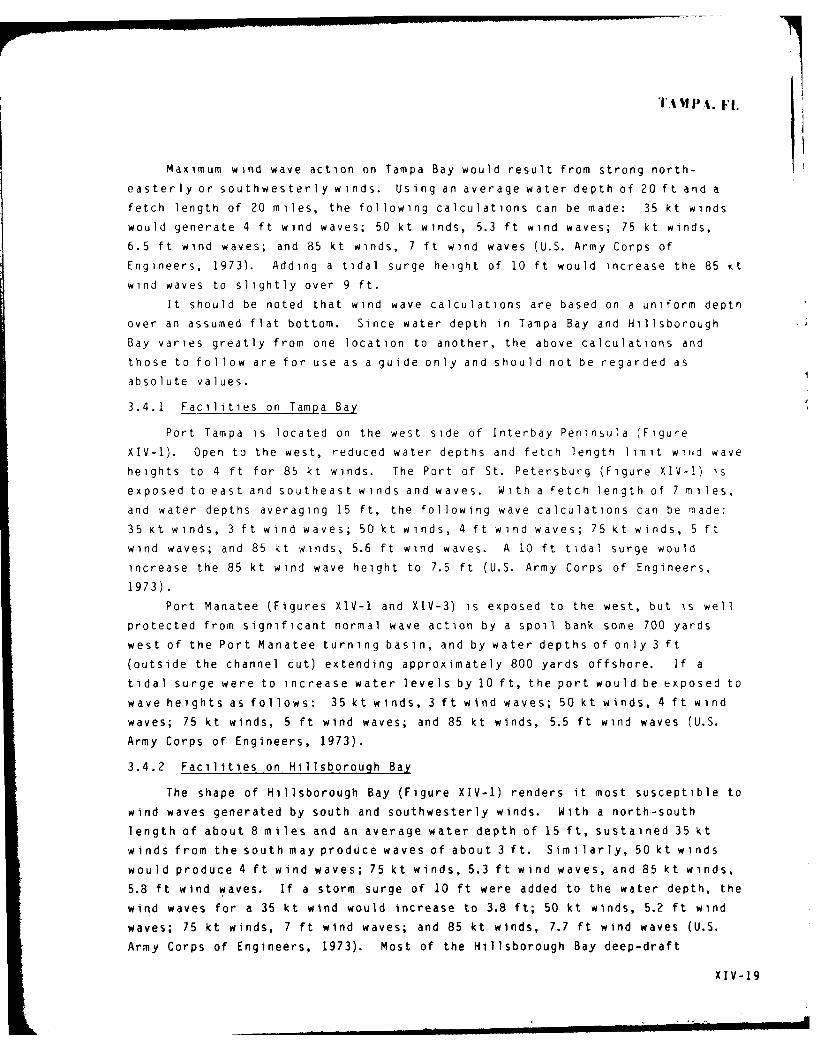
TA' II! A) .. F I.
Maximum wind wave action on Tampa Bay would result from strong north-
easterly or southwesterly winds. Using an average water depth of 20 ft and a
fetch length of 20 miles, the following calculations can be made: 35 kt winds
would generate 4 ft wind waves; 50 kt winds, 5.3 ft wind waves; 75 kt winds,
6.5 ft wind waves; and 85 kt winds, 7 ft wind waves (U.S. Army Corps of
Engineers, 1973). Adding a tidal surge height of 10 ft would increase the 85 kt
wind waves to slightly over 9 ft.
It should be noted that wind wave calculations are based on a uniform depth
over an assumed flat bottom. Since water depth in Tampa Bay and Hillsborough
Bay varies greatly from one location to another, the above calculations and
those to follow are for use as a guide only and should not be regarded as
absolute values.
3.4.1 Facilities on Tampa Bay
Port Tampa is located on the west side of Interbay Peninsula (Figure
XIV-I). Open to the west, reduced water depths and fetch length limit wuld wave
heights to 4 ft for 85 kt winds. The Port of St. Petersburg (Figure XIV-I) is
exposed to east and southeast winds and waves. With a fetch length of 7 miles,
and water depths averaging 15 ft, the following wave calculations can be made:
35 kt winds, 3 ft wind waves; 50 kt winds, 4 ft wind waves; 75 kt winds, 5 ft
wind waves; and 85 kt winds, 5.6 ft wind waves. A 10 ft tidal surge would
increase the 85 kt wind wave height to 7.5 ft (U.S. Army Corps of Engineers,
1973).
Port Manatee (Figures XIV-1 and XIV-3) is exposed to the west, but is well
protected from significant normal wave action by a spoil bank some 700 yards
west of the Port Manatee turning basin, and by water depths of only 3 ft
(outside the channel cut) extending approximately 800 yards offshore. If a
tidal surge were to increase water levels by 10 ft, the port would be exposed to
wave heights as follows: 35 kt winds, 3 ft wind waves; 50 kt winds, 4 ft wind
waves; 75 kt winds, 5 ft wind waves; and 85 kt winds, 5.5 ft wind waves (U.S.
Army Corps of Engineers, 1973).
3.4.2 Facilities on Hillsborough Bay
The shape of Hillsborough Bay (Figure XIV-1) renders it most susceptible to
wind waves generated by south and southwesterly winds. With a north-south
length of about 8 miles and an average water depth of 15 ft, sustained 35 kt
winds from the south may produce waves of about 3 ft. Similarly, 50 kt winds
would produce 4 ft wind waves; 75 kt winds, 5.3 ft wind waves, and 85 kt winds,
5.8 ft wind waves. If a storm surge of 10 ft were added to the water depth, the
wind waves for a 35 kt wind would increase to 3.8 ft; 50 kt winds, 5.2 ft wind
waves; 75 kt winds, 7 ft wind waves; and 85 kt winds, 7.7 ft wind waves (U.S.
Army Corps of Engineers, 1973). Most of the Hillsborough Bay deep-draft
XIV-19

facilities are protected from wave action by Davis Islands, Seddon Island,
HooKers Point and Pendola Point (Figure XIV-2). Port Sutton is exposed to the
west, but limited fetch length and water depth preclude significant wave action
from that direction. East Tampa (Alafia River) is also exposed to westerly
Ninds and waves. With a maximum fetch length of about 3.5 miles, the maximum
wind wave height generated by an 85-kt wind would be on the order of 5.5 ft.
3.5 STORM SURGE AND TIDES
Storm surge may be visualized as a raised dome of water, moving with the
storm, and centered a few miles to the right of its path. The dome height is
related to local pressure (i.e., a barometer effect dependent on the intensity
of the storm) and to local winds. Other significant contributing factors are
storm speed, direction of approach, bottom topography, and coincidence with
astronomical tide.
The worst circumstances (Harris, 1963, Pore and Barrlentos, 1976, and Tampa
Bay Regional Planning Council, 1981) would include:
(1) An intense storm approaching perpendicular to the coast with theharbor within 30 n mi to the right of the storm's track.
(2) Broad, shallow, slowly shoaling bathymetry.
(3) Coincidence with high astronomical tide.
The waters along the west coast of the Florida Peninsuia in the vicinity of
Tampa Bay meet the bathymetry criteria. This factor, coupled with the charac-
teristics of Tampa Bay (i.e., large mouth exposed to seaward and shallow
depths), render Tampa Bay exceptionally vulnerable to storm surges.
Documents on file at the National Weather Service Office in Ruskin, Florida
indicate that the Tampa Bay area has recorded storm surges as early as 1848.
Some excerpts from the records are given in Table XIV-4
Figure XIV-14 shows the tracks of the storms causing the water level
changes listed in Table XIV-4 for the years 1910 through 1972. (Track informa-
tion from Neumann et al., 1978, and DeAngelis, 1973.) Tracks for the 1848
storms are unavailable.
The values given in Table XIV-4 show that a tidal surge of 5 ft or more is
not an uncommon occurrence in Tampa Bay, and that surges of devastating propor-
tions (such as the one in 1848) are possible. Also of significance is the
record for October 18, 1910 when the water level in Hillsborough River fell 9 ft
below MLW. This circumstance was caused by a tropical cyclone of tropical storm
intensity passing to the east of Tampa while on a northward course, causing
offshore winds that forced much of the water from the bay, resulting in the
water level drop. The same effect was observed when Hurricane Betsy passed well
south of Tampa on a westward course in 1965. According to local authorities
"about a mile of shoreline" was exposed when Betsy passed.
XIV-20

'FA M I A. F 1,
Table XIV-4. Water Level data for Tampa Bay and adjacent waters during nearpassages of tropical cyclones as extracted from records maintained by theNational Weather Service Office, Ruskin, FL.*
Date Water Level Data
1848 Sep 25 Tide 15'**
1848 Oct 16 Tide 1I0'**
1910 Oct 18 Water 9' below MLW in Hilisborough Riverusual depression 1'.
1921 Oct 25* Tide 10.5'** highest since 1848
1935 Sep 2-4 Tide 5.3' above MLW
1944 Oct 18-19 Tide 3.1' above MLW
1945 Jun 24 Tide 5.2' above MLW
1950 Sep 3-6 Tide 6.5' above MLW
1966 Jun 8-9 Tide 4.5'**
1972 Jun 18-19 Tide 5.6' above MSL*He ght for October 25, 1921 was measured at the "local office of United
States Engineers" at the waterfront of Tampa on Hillsborough Bay. Thespecific locations of other measurement sites were not recorded.
**Zero reference not specified.
TAMPA
19212i/
JUN ZII
D- 1946
AGNSIG lost
JUN 0G
107| O T 04
Figure XIV-4. Tracks of tropcal cyclones that caused significantchanges in water levels in Tampa Bay during the years 1910-72.
XIV-21

T AM 1A. FL
Wind records during the passage of Betsy show that the Tampa Bay region
experienced winds in the 20 to 30 kt range with gusts about 10 kt higher. The
winds had a strong offshore component for about 72 hours -- a duration factor
that contributed heavily to the water level drop.
An excellent example of the susceptibility of Tampa Bay to water level
rises occurred on June 18, 1982, when a small, subtropical low pressure center
moved northward along the west coast of the Florida Peninsula. Tampa Airport
(location #1 on Figure XIV-1) recorded gusts to 39 kt, while maximum sustained
winds observed along the coast were near minimal gale velocity. Despite these
relatively low wind velocities, water rises of 4 to 5 ft were recorded in Tampa
Bay. Local authorities express the opinion that, if the wind had not ceased an
hour before the time of high astronomical tide, the water rise would have been
higher.
Recent advances in storm surge prediction techniques have led to the
development of an improved storm surge forecasting tool. Developed by the
National Oceanic and Atmospheric Administration's (NOAA) National Weather
Service, it is called SLOSH and estimates the Sea, Lake, and Overland Surges
from Hurricanes (Jelesnianski and Chen, 1979 and Tampa Bay Regional Planning
Council, 1981). Tampa Bay values were computed for 3600 grid points on a
"telescoping" polar grid system. The level of resolution varies from one grid
square representing approximately 1.6 square miles on the coast to 0.6 square
miles inland. Several storm tracks were evaluated, comprising 4 directions of
travel with 3 to 8 parallel tracks for each direction. Five storm intensities
were used, each corresponding to a category on the "Saffir/Simpson Scale," which
was developed by Herbert Saffir and Dr. Robert H. Simpson. Table XIV-5 outlines
the Saffir/Simpson scale.
Table XIV-5. Saffir/Simpson scale.
Central Pressure Wind
ScaleNumber Millibars Inches MPH Knots Damage
1 >980 >28.94 74-95 64-83 Minimal
2 965-979 28.50-28.91 96-110 84-95 Moderate
3 945-964 27.91-28.47 111-130 96-113 Extensive
4 920-944 27.17-27.88 131-155 114-135 Extreme
5 -920 <27.17 155+ 135+ Catastrophic
XIV-22
TAMPA, FL
Data printouts for several computer runs of the SLOSH model were reviewed,and surge height calculations for 11 selected points in Tampa Bay were extracted
for 18 storm tracks. These values are given in Table XIV-6. Saffir/Simpson
categories 1, 3 and 5 are given where available, otherwise only category 3 is
given. Figure XIV-15 depicts specific storm tracks used for the SLOSH model
calculations while Figure XIV-16 shows each of the selected locations for which
data was extracted.
A review of the values given in Table XIV-6 reveals that the surge heights
for locations in the upper reaches of Tampa Bay, especially in the main port
area in Hillsborough Bay, are significantly higher than those near the mouth ofthe bay. The highest water levels would result from category 5 storms moving
inland just north of the main portion of Tampa Bay -- tracks LST, LTC and LCL.
Water levels resulting from what is essentially a "worst case" storm (such
as a category 5 storm following track LTC), would inundate all of the InterbayPeninsula (Figure XIV-16), Davis Islands, Seddon Island, Hookers Point (Figure
XIV-2), and the land area around greater Tampa Bay to a distance of as much as 4
miles inland in some areas.
Also of significance is the effect that westward tracking storms such as
ET or EN would have on water levels. In both cases, a category 3 storm
would cause water rises of near 10 ft in Hillsborough Bay, which would inundate
Davis Islands, Seddon Island, Hookers Point and about 50 percent of the Interbay
Peninsula, including most of MacDill AFB.
Astronomical tides in Tampa Bay are semi-diurnal with a range of about
2.3 ft. According to U.S. Coast Pilot 5, 1980 published by the U.S. Department
of Commerce, "A strong offshore wind sometimes lowers the water surface at Tampaand in the dredged channels as much as 4 ft, and retards the time of high waterby as much as 3 hours. A continued SW wind raises the water by nearly the sameamount and advances the time of high water by as much as 1 hour."
Tidal currents of 3 kt or more at the strength of the greater ebb of theday may occur in Egmont Channel, Passage Key Inlet, and off Port Tampa, but
flood velocities seldom exceed 2 kt. The tidal currents are greatly affected by
winds. A clockwise rotary tidal current with considerable daily variation is
observed 6.7 miles west of Egmont Key Light (U.S. Department of Commerce, 1980).
XIV-23
TA M PA. FL
Table XIV-6. SLOSH surge height calculations for selected locations inTampa Bay. All heights in feet above MSL. 1
Iaf Location3
2 aff iriS impsonII I I I I ITrack 2 Scale Number 2 4 5 6 7 8 9 10 1
LNN 1 ub 1 2°3 6.5 7.8 8.3 9.7 10.4 8.9 6.9 6.0 6.0 5.8 7.5
LNP 1 4.0 3.1 4.9 5.7 6.2 5.5 4.3 3.6 3.6 3.4 4.73 7.7 8.9 9.7 11.7 12.5 10.8 8.3 7.0 7.0 6.9 9.15 7.4 10.9 9.7 11.2 12.1 10.4 7.9 6.9 6.8 6.7 8.7
LTN 1 4.3 4.1 5.5 6.6 7.2 6.4 4.8 3.8 3.9 3.7 5.23 8.7 9.5 11.0 13.8 15.1 13.0 9.4 8.1 7.7 7.8 10.35 9.9 11.7 13.0 15.7 17.0 14.5 10.5 8.9 8.5 8.6 :1.5
LCL 1 4.6 4.7 5.8 7.2 8.1 7.2 5.2 3.9 3.8 3.6 5.63 9.8 9.7 11.9 16.2 17.8 15.2 10.7 8.9 8.0 8.4 11.85 11.4 13.2 15.1 18.7 21.0 17.5 12.2 9.9 8.8 9.8 13.4
LTC 1 4.6 2. 3 5.5 7.1 8. 1 7. 3 5.3 3.9 3.5 3.4 5.73 10.2 9.3 11.6 16.7 18.7 16.4 11.1 9.3 7.2 8.4 12.45 13.3 12.1 16.0 22.8 25.7 22.6 14.9 11.4 8.4 10.8 16.6
LST 1 4.0 1.0 4.5 5.8 6.7 6.7 4.8 3.6 3.3 3.1 5.13 8.2 7.0 8.8 13.8 15.7 14.8 9.8 8.7 6.4 7.2 10.75 12.8 11.1 14.3 22.2 25.2 23.4 14.2 11.6 7.9 9.9 15.8
LKE 1 2.4 1.0 2.4 1.9 4.2 4.4 3.2 2.8 2.2 2.1 3.33 4.3 1.0 4.2 7.3 8.2 8.6 6.3 6.0 3.5 3.9 6.25 4.8 1.0 3.5 7.5 9.7 10.2 8.8 9.9 3.7 5.4 7.1
LTS 1 1.3 1.0 1.0 1.0 1.9 2.4 2.0 1.9 1.5 1.5 1.73 1.5 1.0 1.1 1.0 3.5 3.9 3.0 3.2 2.3 1.9 2.45 1.6 1.0 1.0 1.0 2.4 3.2 2.8 4.9 2.7 2.4 1.7
N30 3 5.0 5.8 5.5 6.7 6.7 6.0 4.9 4.5 5.0 4.6 5.3
N15 3 5.6 7.8 6.9 9.0 9.1 7.9 5.5 5.4 6.0 5.4 6.3
NOO 3 5.1 6.6 6.4 9.3 9.6 8.1 5.3 4.7 5.1 4.4 6.1
P30 3 3.6 1.5 4.0 2.7 4.8 4.3 3.5 3.1 3.5 3.2 3.8
P15 3 4.1 3.9 4.9 6.0 6.4 5.5 4.1 3.6 4.7 3.9 4.6
PO0 3 4.4 5.2 5.4 8.5 8.1 6.6 4.5 4.1 4.5 4.4 5.1
ET 3 4.4 5.1 4.9 10.1 9.7 6.5 3.9 3.6 2.9 3.6 4.4
EN 3 5.5 7.7 6.3 11.3 9.4 6.5 4.8 4.5 3.9 4.3 5.3
EC 3 3.8 3.0 4.3 2.3 4.5 4.0 3.1 4.0 3.2 3.2 3.7
ES 3 1.3 1.0 1.0 1.0 1.4 1.4 1.2 1.4 1.9 1.5 1.2
1 SLOSH values are estimated to be within plus or minus 15% of observedwater levels. Values do not consider wave set-up, rainfall, or astronomicaltidal effects (Tampa Bay Regional Planning Council, 1981)"
2 Track codes are keyed to Figure XIV-15-
3Location numbers correspond to locations listed below and are keyed toFigure XIV-16.1 Port of St. Petersburg; 2 Safety Harbor (Upper Old Tampa Bay); 3 Port Tampa;4 Upper Hillsborough Bay; 5 McKay Bay; 6 Alafia River; 7 Little Manatee
XIV-24 River; 8 Port Manatee; 9-11 Anchorages
TAl M' P4. F 1,
N
Figure XIV-15. Selected tracks ofhurricanes simulated by SLOSHnumerical storm surge model forTampa Bay. (Tampa Bay Regional
ET Planning Council, 1981.)
ST.
L TAP
Figur N1V6 6 SLOSH- nueicl
I TAP
in~~IV Tal25V6

7'rTAM PA. FL
4. THE DECISION TO EVADE OR REMAIN IN PORT
Instructions for hurricane preparedness at the U.S. Naval Reserve Center at
Tampa are addressed in COMSEABASWINGSLANT COMNAVBASE JAX OPORD 2000. Macill
AFB is governed by MacDill OPLAN 355.1. The Tampa Port Authority promulgates
its Hurricane Peparedness Plan as Section 14 of the Port of Tampa OperationsManual .
4.1 THREAT ASSESSMENT
A review of the tropical cyclone threat analysis presented in Section 3 of
this evaluation indicates that Tampa Bay is at considerable risk to damage
resulting primarily from tropical cyclone storm surge, but also from high wind.
The absence of sheltered berths or anchorages makes evasion at sea the safest
course of action for all seaworthy deep-draft vessels as soon as it can be
established that a particular tropical cyclone poses a threat to Tampa Bay.Early assessment of each potential threat is essential, and should be related tothe setting of hurricane conditions of readiness by military and civil authori-
ties, and conducted using current advisories and forecasts issued by the Navy
and National Weather Service, as well as climatology as presented herein.
As can be seen in Figures XIV-6 through XIV-11 and Figure XIV-14, the
greatest threats to Tampa are posed by tropical cyclones moving northward out ofthe western Caribbean Sea, or westward out of the Atlantic Ocean just north of
the Greater Antilles, and which approach Tampa from the southeast, south, or
southwest. A greater threat of storm surge occurs when a tropical cyclone
approaches Tampa from the southwest quadrant, and makes landfall within 100
miles north of Tampa Bay. A storm making landfall south of Tampa Bay such that
strong winds with a significant offshore component would cross Tampa Bay would
be expected to cause a significant lowering of the Tampa Bay water level.
The individual storm intensity and speed of movement will affect the extent
of damage which can be expected from any given storm. As a general rule, anyintense tropical storm or hurricane approaching from the Gulf of Mexico suchthat Tampa is located in the dangerous right front quadrant of the storm canresult in severe wind and storm surge conditions. It must be remembered,
however, that Tampa is vulnerable to storms from the east as well as the west,
and a westerly moving storm crossing the Florida Peninsula can cause significant
damage in the Tampa vicinity. The months of maximum threat in terms offrequency are September and October. Of those storms causing sustained winds of
34 kt or greater to be recorded in the Tampa area (Figure XIV-11), sixty-seven
percent (8 of 12) occurred in September or October; but the 4 storms that caused
sustained winds of 50 kt or greater occurred in the separate months of June,August, September and October.
XIV-26

TA MPA. FL
4.2 EVASION AT SEA
Evasion at sea is the recommended course of action for all seaworthy deep-draft vessels when Tampa is under threat from an intense tropical storm (48 kt
or greater) or hurricane (64 kt or greater) approaching from the Gulf of Mexicoand forecast to make landfall within 100 n mi of Tampa, or threatened by a
hurricane approaching the Tampa area from the south or southeast across the
Florida Peninsula. Timing of the decision to evade is affected by:
(1) The forward speed of the tropical cyclone.
(2) The radius of hazardous winds and seas that can impact on a vessel'scapability to reach open water and then maneuver to evade.
(3) The elapsed time to make preparation to get underway.
(4) The elapsed time to reach open water.
For example:
A worst case situation would be an intense tropical cyclone moving
toward Tampa Bay from the southwest (similar to track LTC in Figure
XIV-15). Assume 6 hours are required to make preparations to get
underway after the decision to evade at sea is made. Approximately 3
to 4 hours are required to transit the channels leading to the open
sea. A tropical cyclone approaching at an average speed of 10 kt will
have moved 100 miles closer to Tampa Bay by the time sea room is
attained. Add to this the radius from the tropical cyclone center of
strong winds likely to hamper port operations, say 200 n mi. Summing
these values gives 300 miles (200 +100) or 30 hours as the minimum
tropical cyclone displacement from Tampa in distance or time when the
decision must be made to evade at sea successfully. A greater margin
may be applicable depending on greater cyclone speed and intensity,
and ship speed capability.
Hurricane Condition III is set when hurricane force winds are possible
within 48 hours. It is apparent that the decision to prepare for sortie should
be made soon after setting Hurricane Condition 111. Although at this time the
storm center may be more than 500 miles distant, it should be remembered that
the average tropical cyclone forecast error over a 48-hour period is on the
order of 210 n mi for those tropical cyclones threatening Tampa (Neumann and
Pelissier, 1981). Departures coincident with the setting of Condition III are
considered to be the wise and safest course of action. Later departures than
this wager the accuracy of information on the storm's behavior against mounting
risks of heavy weather damage. It is pertinent to note that the U.S. Coast
Guard advises that all ships in good condition should put to sea upon the
setting of Hurricane Condition 111.XIV-27

Once sea room is attained upon departure from Tampa, the tactics employedwill depend on the location of the threatening tropical cyclone, its speed of
advance, and its direction of movement. Up-to-date information is essential if
sound decisions are to be made. Tropical cyclone location and intensity
information with today's satellite technology is accurate and timely. Forecastsand warnings are issued at 6-hourly intervals and updated as necessary to
reflect important changes in position, intensity, and movement.
Ship masters with access to these advisories/warnings are in the best
possible position to modify evasion routes and tactics to successfully evade the
storm. The cardinal rule of seamanship is to avoid the dangerous right-hand
semicircle. The following guidelines are offered.
(1) For tropical cyclones approaching from the west or northwest: After
an early departure to escape worst effects of head winds and seas, steam south
or southeast along the coast until clear of the storm.
(2) For tropical cyclones approaching from the south or southwest:
Tropical cyclones approaching from these directions pose the most perplexing of
evasion problems due to the possibility of storm track changes to the west ornorthwest. If a vessel were capable of making a reasonable SOA, say 15 kt, and
could depart sufficiently early so as to take advantage of following winds and
seas, yet avoid the hazardous conditions close to the main portion of the storm,
one option would be to steam west or northwest. Once sufficient maneuvering
room was attained clear of the storm, a course change to the south or southwest
may then be made to bring the vessel to a latitude south of the storm center.
Short of this course of action, few options remain. In no case should a vessel
be placed in the position of being "trapped" between a tropical cyclone and the
Florida coastline north of Tampa. An evasion route may have to be altered based
on unexpected change,. in cyclone movement. Evasion tactics must be based on the
latest tropical cyclone forecast position and movement.
(3) For tropical cyclones approaching from the east or southeast (across
the Florida Peninsula): Steam west-southwestward until sufficient maneuveringroom is attained, tnen southward until reaching a latitude south of the storm
center.
4.3 RETURNING TO PORT
The damage and disarray at a port resulting from a tropical cyclone strike
may include navigation hazards such as displaced channel markers, wrecks in the
channel, or channel depths that no longer meet project specifications. Harbor
facilities may be so damaged as to preclude offering even minimal services.Check with the Port Authority before ttemptin- to retuirn.
XI V-2ES

IATMIPA. F1,
4.4 ASSUMING A "WAIT AND SEE" POSTURE AT ANCHOR
A marginal threat may dictate a"wait and see" posture as areasonable
course of action to follow. A marginal threat situation would include those
situations where an intense tropical storm or hurricane is a considerable
distance away from Tampa and not likely to cause severe conditions at Tampa
within 48 hours (a pre-Condition III situation but still potentially
threatening), or situations where the storm is meandering with no established
direction of movement. As was mentioned in Section 2.2, the Tampa Anchorages
located north and south of the Tampa Safety Fairway leading to Egmont Key can be
used to ride out any gale short of a hurricane. Leaving the pier for anchorage
to await later developments in storm intensity and/or movement offers the
advantage of decreasing the time required to reach open sea should evasion at
sea become necessary.
4.5 REMAINING AT TAMPA
Remaining in port at Tampa is an option that should receive serious
consideration in secondary threat situations or in those instances when a vessel
is incapable of successful evasion at sea. Secondary threat situations include:
(1) A tropical cyclone developing within the 180 n mi radius critical
area.
(2) A weak tropical cyclone (mraximum winds less than 48 kt) approaching
Tampa and forecast not to intensify.
(3) A tropical cyclone with winds greater than 47 kt forecast to pass more
than 100 miles from Tampa and the forecast 50 kt wind radius does not encompass
T am pa.
If the decision is to remain in port at Tampa, the following recommendation
are offered:
( 1) Since SLOSH storm surge calculations (Table XIV-6) show that PortManatee has significantly lower storm surge heights than those calculated for
the main Port of Tampa facility in upper Hillsborough Bay, and the facilities atPort Manatee are of new construction, Port Manatee would be the preferred port
facility in which to ride out a tropical cyclone at Tampa. Local port officials
indicate that many shallow draft vessels that cannot put to sea, such as dredges
and tOarges that work in Tampa Bay, usually use Port Manatee during tropical
cyclone threat situations. For this reason, dock space may be limited, and
early arrangements for accommodations are desirable.
(2) If spare at Port Manatee is not available or it is not feasible to use
Part Manatee for other reasons, utilization of the main Port of Tampa facility
in upper Hillsborough Bay is suggested.
XIV-29
T 1II' . FI.
Little protection ;uni wind is offered in either of tne above situations.
It is roc-,,Iended that in each case, vessels be ballasted down as much as
possible, and secured to the dock with sufficient lines to withstand predicted
wind forces, yet allow water height fluctuations of the predicted amounts.
Should a master choose to remain in port it should be borne in nind tnat
his vessel will be exposed to dangers beyond that of wind and storm surge.
Other vessels may be broken loose from their fnoorings, and become floating
hazards. Also, the danger is ever present that a damaged or sunken vessel coild
effectively block the narrow ship channels in the bay, thereby trapping shipping
in the port for some time after a storm has passed.
5. ADVICE TO SHALLOW DRAFT VESSELS
Shallow draft vessels should, if feasible, be removed fromn the wate, a-nd
firmly secured ashore at an elevation of at least 20 ft (30 ft if the storm is
posing a "worst case" tnreatl to avoid possible high water. Short of thi S, sal
craft should seek shelter in the Hillsborough River, Alafla River, or Little
Manatee River.
Table XIV-7 lists channel depths and bridge data for the lower reachrs of
the rivers. If a drawbridge clearance is indicated, that clearance will most
I iKely prevail in a storm threat si tuation, as draw bridges are left in the down
position to tacilitate evacuation of area residents.
Table XIV-7. River channel and bridge data for the Hillsborough, Alafiaand Little Manatee Rivers (U.S. Department of Comnerce, 1980).
River Controlling Brid eDepth Clearance Miles Above Bay
Hillsborough 4.5 ft I 40 ft 0.1
35 ft 3.210 ft2 4.3
7 ft2 6.0
Alafia 3.0 ft 4 28 ft 3 1.06 ft 1.1
Little Manatee 3.0 ft j 12 ft 2.35
1 - Maintained to 2.5 miles above mouth. Depths above 2.5 nilepoint are not specified.
2 - Draw bridge
3 - Swing bridge
4 - With local knowledge at high water
5 - Height of adjacent railroad span not specified.
XIV-30

Seeking shelter at berths or marinas around the periphery of Tampa Bay is
riot recommended because of the potential for storm surge, and using open
anchorages in Tampa Bay to ride out a tropical cyclone would be extremely
hazardous. Virtually no protection is afforded except near the lee shore, and
even tnen it is n iinmal. Wind wave activity can be quite destructive, not to
mention the hazards of tioating debris resulting from the effects of wind waves,
high water, and hilh winds.
The fl IIowing extract from U.S. Coast Pilot 5, Atlantic Ocean: Gulf of
Mexico, Puerto Rico, and Virgin Islands, as published hy the U.S. Department of
Commerce in 1990 is relevant:
"Hurri-:ane Moorings. On receiving advisory notice of a tropical
disturbance small boats should seek shelter in a small windinq stream
whose banks are lined with trees, preferably cedar or mangrove. Moor
with bow and stern lines fastened to the lower brarlches; if possible
snug up with good chafing gear. The knees of the trees will act as
fenders and the branches having more give than the trunks, wi11 ease
the shocks of the heavy gusts. If the banks are lined only with small
trees or large shrubs, use clumps of them within each hawser loop.
Keep clear of any tall pines as they generally have shallow roots and
are apt to be blown down."
The ,,rudent small boat operator will have selected several potential havens
neforehand in which to take shelter in various tropical cyclone threat
tuations. He will proceed to his haven well in advance to avoid the chaos and
congestion endured by his fellow boaters who delay until the onset of
destructive conditions is imminent.
XI V-31

11
REFERENCES
DeAngelis, R. M., 1973: Nortn Atlantic tropical cyclones, 1972. MarinersAeater_Lo , 17, 1, pp. 6-14.
rHaris, . ., 1963: Cnaracteristics of the hurricane storm siry . J.S.oeather Bureau, Techinical Data Report No. 48, U.S. Departent t r, t rcWashington, DC.
S !! 3n S K I, C. P. and J. Chen, 1979: SLOSH (Sea, Lake, and Over-l3nJ S ,r sfri _urrica ne sj. Nat onal Oceanic and Atonosphe'- i Adi inistra i'1n,
e i: 7l1 aI Devolropient Lab, in p,'eparition.
ln tee County Port Auit rity, 1931: Port Manatee. Manatee County PortAuthority, Ro ti I, Palmetto, FL 33561.
eLJn ann, C. J., G. Cry, E. Caso, and B. Jar wi nen, 1978: Tropical_ C clones ofthe North Atlantic Ocean, 1871-1977. National C limatic Center, Asheville,NC in cooperation with the National Hurricane Center, Coral Gables, FL,170 pp.
and J. M. Pelissier, 1981: An analysis of Atlantic tropicalcyclone forecast errors, 1970-1979. Mon. Wea. Rev., 109, pp. 1248-1266.
, and M. J. Pryslak, 1981: Frequency and Motion of Atlantic.... o a) Cyclones. U.S. Department of Comerce, National Oceanic and
Atmospheric Administration, National Hurricane Center, Coral Gables, FL.
Pore, N. A., and C. S. Barrientos, 1976: Storm surge. Marine EcoSystemsAnalysis (MESA) Program, MESA New York Bight Project, New York Sea GrantInstitute, Albany, NY.
Tampa Bay Regional Planning Council, 1981: Hurricane evacuation plan,_Tampa BayRegion, Florida. Technical Data Report, U.S. Army Corps of Engineers,Jacksonville, FL.
Tampa Port Authority, 1981: Tampa Port Handbook, 1981: Howard Publications,Inc., 33 South Hogan St., Jacksonville, FL 32201.
U.S. Army Corps of Engineers, 1973: Shore Protection Manual. U.S. Army CoastalEngineering Research Center, Kingman Building, Fort Belvoir, VA.
1979: The Ports of Tampa and Port Manatee Florida, Port Series.No.- . The Board of Engineers for Rivers and Harbors, Kingman Building,
Fort Belvoir, VA 22060.
U.S. Department of Commerce, 1980. United States Coast Pilot 5, Atlantic Coast:Gulf of Mexico, Puerto Rico, and Virgin Islands. National Oceanic andAtmospheric Administration, National Ocean Survey, Washington, D.C.
X IV-32

C4.'-4C=

XV: CONTENTS
1. Geographic Location and Topography .oXV-2
2. The Harbor, Approaches and Facilities * . XV-3
3. Heavy Weather Facilities andHurricane Anchorages ... ........ . XV-7
4. Tropical Cyclones Affecting Boston . XV-9
5. The Decision to Evade or Remain In Port XV-22
6. Rationale for Evasion At Sea .... . XV-25
References . . . . . XV-27
XV. BOSTON, MASSACHUSETTS
SUMMARY
This study concludes tnat the inner harbor of Boston isa hurricane haven. This conclusion is based on thefollowing factors:
(1) New England is not in the primary hurricane belt,and hurricane force winds associated with tropical cyclonesare uncommon in the Boston drea.
(3) The terrain surrounding the river-type harborprovides protection from wind and wave action.
Historically the tropical cyclones that have causedwidespread damage in the area have tracked northward at highspeeds (>30 kt). The normal track is northeastward at some-what lower speeds. These major threat events are associatedwith a particular circulation pattern with two key features:a deep tropospheric trough over tne eastern United States,and a much stronger than normal high pressure system off theeast coast. This circulation pattern is not common durnrgthe peak hurricane season (September).
The high speed (>30 kt) northward movement of tropicalcyclones under this type of circulation pattern creates adual problem for vessels that sortie. First, there isminimum time available to clear the harbor and shoal areas;and second, the high speed cyclone is difficult to outrunonce at sea.
Tropical cyclones that make l andfallI south of LongIsland and approach Boston Harbor from overland are notconsidered a hazard to seagoing vessels. Storms of thistype can create flooding problems.
The outer portions of the harbor (anchorage 1 and sea-ward) and the outer harbor anchorage areas are notconsidered haven areas. The outer harbor is generallyunprotected from winds and seas, particularly those from aneasterly direction. The anchorage areas do not have excep-tional holding, they are restricted in size, and there arenumerous shoals and ledges throughout the outer harbor area.
This hurricane haven evaluation was prepared byR.E. Englebretson and J.D. Jarrell of ScienceApplications, Inc. (SAI), Monterey, CA 93940.
Change I XV- 1

B()'ON. MA
1. GEOGRAPHIC LOCATION AND TOPOGRAPHY
Boston, the largest city and harbor in the New England region, is located
on the western shore of Massachusetts Bay about 40 n mi west-northwest of the
northern tip of Cape Cod (Figure XV-1). The City of Boston and its surrounding
area are generally hilly, with maximum elevations of approximately 500 ft
reached within 10 statute miles of the main harbor. The surrounding terrain,
peninsulas and islands provide some protection to the harbor area, except for
cases where the winds are from the east. There are numerous dangers in the
approaches to the harbor: islands, shoals and rocks extend 3-4 n mi from shore
through all approaches.
N
VAS5ACHu ETS __0 5 10 15 20
BAI STATUTE
MILES
S ATLANTIC OCEAN
Figure XV-l. Locator map of the
Boston and Cape Cod region.
C APEA CO) CO
MASSACHUSETTS
Several outstanding landmarks mark the various approaches to the main
Boston Harbor area. A tall red, white, and blue standpipe on Winthrop Head is
conspicuous when approaching from the northeastward. The most prominent island
in the entrance as viewed from easterly approaches is Great Brewster. A
turreted tower on Point Allerton is markedly visible when approaching from the
south. Two illuminated radio towers are located two miles south of Point
Allerton; these are useful for night approaches.
XV-2

BOSTON. MA
2. THE HARBOR, APPROACHES AND FACILITIES
The harbor includes all the tidewater area lying within a line from the
southern extremity of Deer Island to Point A IIerton, about 4 n mi to the south-
eastward (see Figure XV-2). Important tributaries that flow into and form part
of the main harbor are the Charles, Chelsea and Mystic Rivers. The harbor
region extends to the south of the main harbor and Boston proper, where the
Weymouth Fore River and Dorchester and Hingham Bays comprise the more important
harbor areas.
2.1 APPROACHES
A buoyed Traffic Separation Scheme has been established in the approach to
Boston Harbor (see charts 13270, 13267; 13246, 13260 and 13200). The inbound
and outbound traffic lanes are 2 n mi wide and extend about 125 n mi east-
southeast to seaward from the precautionary area. The precautionary area has a
radius of 5 n mi centered on the Boston Lighted Horn Buoy B (42'22'42"N,
700 47'00"W), which is about 7.8 n mi east-northeastward of Deer Island.
The principal entrance for deep-draft vessels from the precautionary area
to Boston Harbor is via Boston North Channel to President Roads to Boston Main
Channel (see charts 13270 and 13272). Because of the numerous islands, shoals
and rocks, extreme caution should be used in approaching Boston Harbor.
According to Coast Pilot 1, when approaching Boston from the Cape Cod
sector, soundings of 20 fathoms or more ensure a distance of 5 n mi from the
shore and a position well outside of outlying rocks. Inside the 20 fathom
contour, the soundings are very irregular and cannot be depended upon as a rule
to keep a vessel out of danger. Deep-draft vessels should use the Boston
Traffic Separation Scheme route for approaching Boston Harbor.
When making an approach in fog, a course should be laid to clear the Boston
Lighted Horn Buoy B and the water should not be shoaled to less than 20 fathomsuntil the buoy is positively located. The Boston North Channel, Boston South
Channel, and the Narrows Channel are the main entrances from the sea to
President Roads. Several other channels of less importance are used by local
vessels.
2.2 ANCHORAGES
General, explosives, and special anchorages of Boston Harbor are shown on
chart 13272. The most commonly used general-purpose anchorage is on the north
side of Presi dent Roads. The anchorage in Nantasket Roads, westward of the
southern entrance to the Narrows, has depths up to 50 ft. The anchorage on the
westerly side of Georges Island provides some shelter from easterly winds and
XV-3
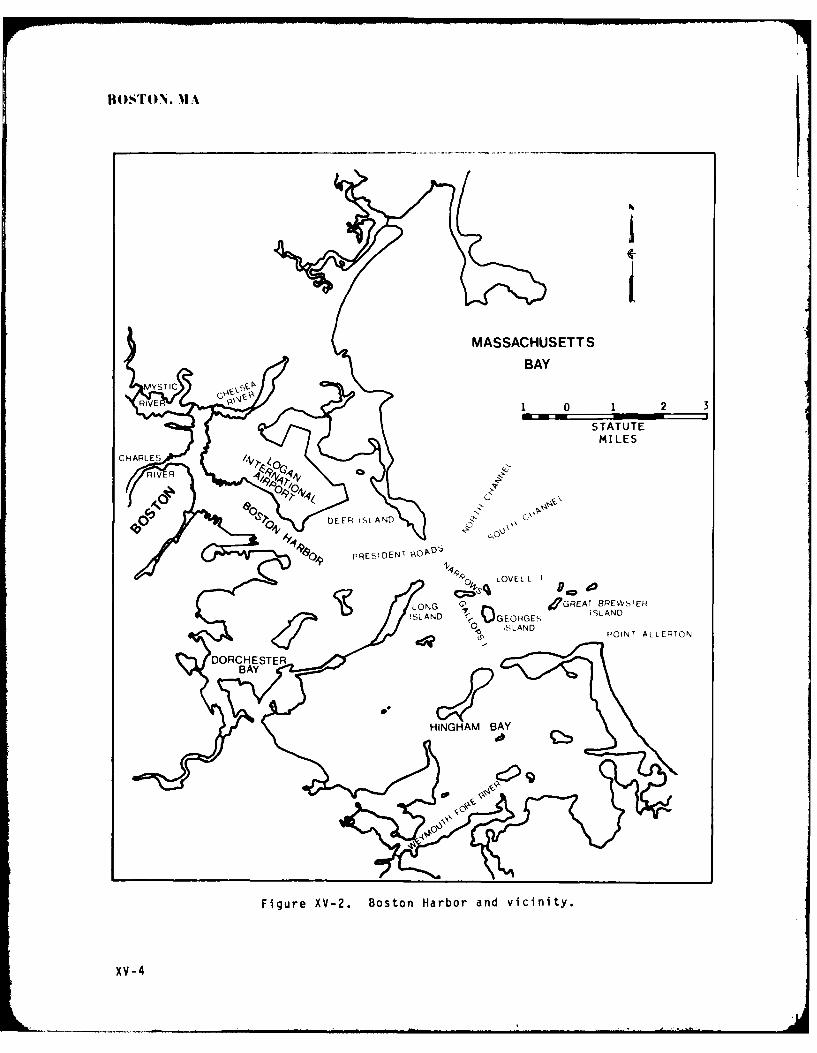
B 0S'I'O N. 11A
MASSACHUSETTSBAY
RIIE1 0 1 2 3STATUTEMILES
CHARLES V
PI RESD
0 DEFRISSLAND
LNGHA BAYT RWSE
Figue XV2. BstonHarbr an!vicnity
ISANV-4OGE

B 0S TO N. WA
has depths up to 36 ft. The anchorage area along the northern side of the
channel in the inner harbor is quite exposed to the wind and would have noprotection fromD debris during a storm.
2.3 BERTHS (see Figure XV-3)
The Corps of Engineers Port Series No. 3 report for the Port of Boston
describes 129 piers, wharves and docks. Many of these wharves are used for
multiple purposes;, the fuel and container wharves are the principal specialpurpose facilities.
Navy use of port facilities for docking is usually restricted to the
following areas and piers:
(1I) South Boston: Economic Development and Industrial Park (EDIC) northjetty, Army Base Terminal and Commonwealth pier.
(2) Boston: Coast Guard piers.
(3) Charlestown: Navy Shipyard piers 1 and 2 and the Boston National
Historical Park.
2.3.1 Economic Development and Industrial Park (EDIC).
The EDIC jetties are located on the south side of the inner harbor entrance,
across the channel from Lo.9an International Airport. This berth is used by
carriers and other large ships. It is concrete-capped with steel-sheet pile
bulkheads and is solid filled. The alongside depth is 40 ft and the deck height
is18 ft, both measurements relative to mean low water (MLW). It is bordered byan open apron inboard and the channel outboard.
2.3.2 Army Base Terminal
The Army Base berths are in the Reserved Chan nelI, whose entrance is l ocatedimmediately outside the EDIC jetty in South Boston. They are constructed from
concrete, faced with steel piling and solid filled. The alongside depths are
35 ft and deck heights are 17.8 ft relative to MLW. They are bordered by appro-
ximnately 50-ft aprons and storage warehouses.
2.3.3 Commonwealth South Boston Pier No. 5
This pier is in South Boston about 4000 ft above the EDIC jetty. Both the
northern and southern sides are available for berthing. It is constructed of
concrete with solid fill and steel pile face; concrete-decked extensions runalIo ng sides and face. This berth is frequently used by visiting Navy ships.The alongside depths are 40 ft, with 18 ft deck heights relative to MLW. A two-story steel-frame reinforced-concrete warehouse sits astride the pier. Apron
width is 20 ft. Both sides have alongside lengths of 1200 ft and can handle
l arge shi ps.
XV-5

BOSTON, MA
1 1/2 0
Nautical Miles
Mystic River
CHARLESTOWN
%,j .~ EAST BOSTON
, % (.-, Logan International
BOSTON ,, irr Airport
L '
]a
JN..Reserved Channel
Pleasure
SOUTH BOSTON" ~Bay
Figure XV-3. Boston Harbor and main berthing facilities.Boldface lowercase letters denote general locations of:
a - Army Base Terminal (EDIC Jetty) g - Hess Oil Co.b - Coast Guard piers h - Amoco Oil Co.c - Commonwealth Pier i - Texaco Oil Co.d - Navy Shipyard j - Gibbs Co.e - Moran Docks k - Belcher, Inc.
XV-6 f - LNG Terminal 1 - Bethlehem Steel

BOSTON, MA
2.3.4 U.S. Coast Guard Support Center
The USCG Support Center is in Boston proper about a mile above the
Commonwealth pier on the west bank of the inner harbor. There are five steel-
piled, concrete-decked piers suitable for small te medium ships. Alongside
depths range from 20 to 35 ft, with a 16-ft deck height relative to MLW. The
piers are bordered by open aprons. Alongside lengths range from 260 to 550 ft.
2.3.5 Boston National Historical Park (Boston Navy Shipyard)
The Boston National Historical Park piers are located on the north side of
the confluence of the Charles River with the inner harbor in Charlestown about
1600 ft above the Coast Guard Center. They are steel-piled, concrete-decked
piers bordered by open aprons. Alongside lengths are less than 400 ft, which
limits use of this area to frigate class or smaller ships.
2.3.6 Other Berthing
There are more than 100 other berths available throughout the Boston
Harbor. The majority are located above the piers normally used by Navy ships.
The main container wharf is the Morin Docks on the west bank of the Mystic
River, just beyond the area of confluence of the Chelsea and Mystic Rivers. The
LNG terminal is on the opposite bank (east side) of the Mystic River just
upstream of the container wharf, Other well constructed berths in the Mystic
River include Distrigas, Exxon, Prolerized Scrap, Amstar Sugar, Revere Sugar,
and Atlantic CemenL. Several well constructed tanker wharves are located along
the north bank of the Chelsea River (Hess Oil, Amoco Oil, Gulf Oil, and Texaco).
There are also three finger piers used for receipt of petroleum products
located nedr the turning basin in the upper Chelsea River (Gubb Co. and Belcher,
Inc.) which are not considered suitable during high winds. Both the
Massachusetts Port Authority piers and Bethlehem Steel Corporation pier I are
located in East Boston near the outer portion of the inner harbor. These piers
are adjacent to the airport, across the channel from the Commonwealth pier site.All of the above mentioned piers, except for the three finger piers in the upper
Chelsea River, are well constructed.
3. HEAVY WEATHER FACILITIES AND HURRICANE ANCHORAGES
3.1 HURRICANE PLANS AND PREPARATION
SOPA will direct action to be taken by ships present during heavy weather
preparations. The Commanding Officer, NAS, South Weymouth is assigned as Third
Area Weather Coordinator by COMNAVBASEPHILINST 3140.1.
XV-? J

3.2 TUG~ AVALABILITY
There are two tug companies servicing the Boston Harbor. Boston Tow biat
Company and Boston Fuel Transportation, Inc. each have six tugs. These 12 tugs
are adequate for normal operations, but could be hard-pressed during heavy
weather condi tions.
3.3 HURRICANE BERTHING (see Figure XV-3 for locations)
All of the berths normally used by the Navy are considered suitable for use
during a hurricane except the EDIC jetty berth. This berth is very exposed
with little or no protection from winds or wave action. The open spaces of the
airport to the north, and outer harbor and bay to the east and south, provide
very limited protection from the wind. The berth is totally exposed to the wave
action in the channel which opens to the east.
In general all substantially constructed berths above the Coast Guard
Center are considered suitable as hurricane berths because of the protection
from winds provided by the surrounding terrain and the protection from high seas
provided by the configuration of a river type harbor. However, finger piers and
weakly constructed wooden piers are not considered suitable berths during any
high wind situation.
In addition to the general construction of a berth, the height of the pier
and allowable scope of lines should be considered in judging the suitability of
a berth for use in high wind situations.
3.4 HURRICANE ANCHORAGES
There are no designated hurricane anchorages in the Boston Harbor. Among
the genieral anchorages, only the area west of Georges Island (Anchorage 5)
provides protection from the easterly winds. However, the approaches are narrow
and there are numerous ledges and shoals in the area. In addition the bottom is
generally covered with boulders which provide uncertain holding. The best area
1use for anchorage during hurri canes i s wellI to the southeast of Boston in
Cape Cod Bay inside the hook of Cape Cod (Figure XV-1). This area is about 40 n
mi from Boston Harbor and has been used by Coast Guard and local pi lots to rideout storms. The usual problems related to vessels dragging anchor and to
congested traffic must be anticipated.
X V -8

4. TROPICAL CYCLONES AFFECTING BOSTON
New Enuland is not considered to be in the primary nurricane belt; however,
some of the most destructive hurricanes of record have occurred there. Dunn and
Miller 1964) noted eight intense New England storms which occurred in 16LD,
1638, 1815, 1938, 1944, 1954 (two) and 1955 that are related to tropical
cyclones. In general, tides and flooding are of greater concern than wind.
During the period of 1815 to 1938 no really extreme tropical cyclones
affected the New Englano area. The 1938 tropical cyclone, however, is note-
worthy for several reasons. It can be considered a typical Cape Verde storm.
After moving across the entire subtropical north Atlantic, it recurved about
300 n mi east of southern Flurida and accelerated northward in the southerly
flow in advance of a strong miolatitude trough. The 1936 storm produced wide-
spread damage throughout New England. Five minute average winds of b4 kt (and
one minute average of 76 kt) were recorded at Boston during the passage.
The atmospheric and synoptic conditions favorable for a major hurricane to
strike New England have been described by Dunn and Miller (1964;. Such a
tropical cyclone typically develops southeast of the Antilles, gradually
recurves towards the vicinity of Lape Hatteras, and then accelerates very
ra,)idly toward New England. The conditions that will support this type of event
I) A strong east/west atmospheric steering current over the tropical!
subtropical North Atlantic.
(2) Moist tropical air that has been advected poleward over the western
Atlantic providing an extended region of atmosphere favorable for maintaining a
tropical circulation.
(3) The tropical cyclone does not make landfall until it reaches the
northern U.S. east coast.
(4) A well developed and intensifying large amplitude, long-wave trouqh is
located over the east central United States.
Under the above synoptic conditions the tropical cyclone moves at speeds
slightly above normal across the tropical Atlantic, feeding on the abundantmoist tropical air; recurves northward prior to landfall while remaining in a
moist warm environment; and then accelerates rapidly north to northwestward ir
the southerly flow in advance of the midititude large scale trough.
4.1 CLIMATOLOGY
For the purposes of this study, any tropical cyclone that approached within
180 n mi of Boston is considered a threat. It is recognized that a few tropical
cyclones that did not approach within 180 n mi may have affected Boston in some
XV-9
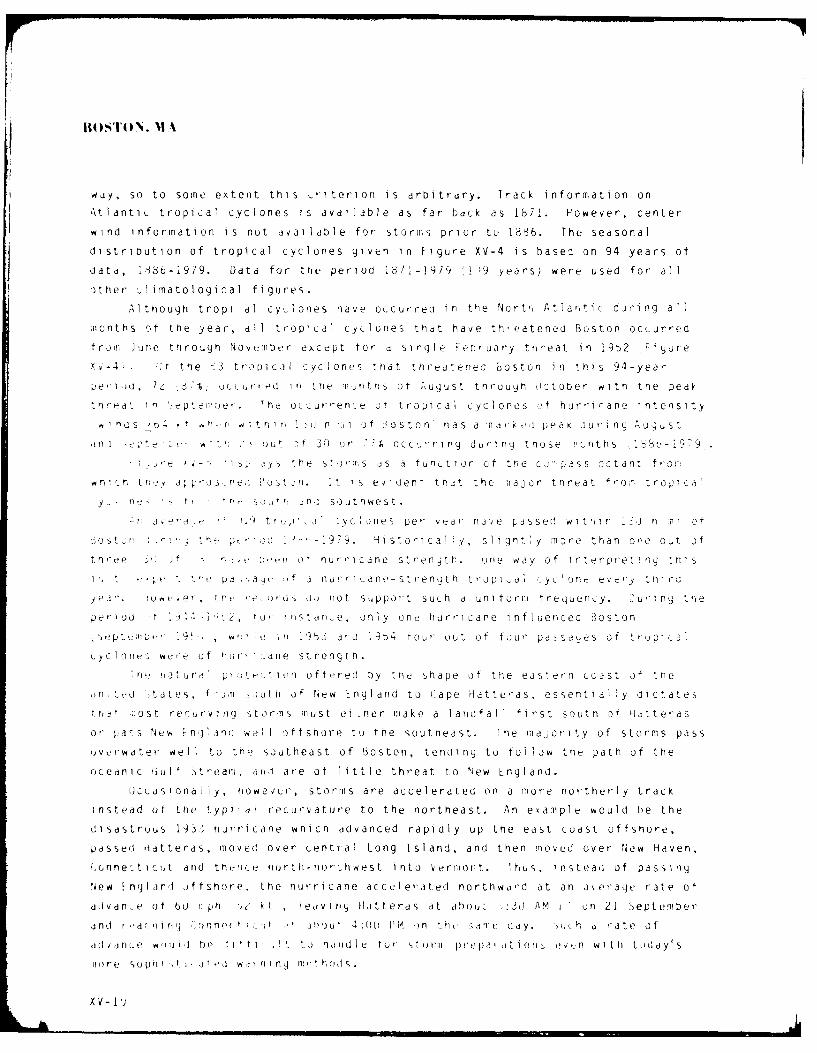
BOSTONI'I. NIA,.
wdy, so to some extent this criterion is arbitrary. Track information on
Atlantic tropical cyclones Is dvd7iable as far back as 187b . However, center
wind information is not avai ldble for storms prior to 1866. The seasonal
distrioution of tropical cyclones given in Figure XV-4 is based on 94 years of
datd, 16 b-1979. Data for the period 18/1-1919 1 19 years) were used for all
other ,ilimatological figures.
Although tropi al cyclones nave occurred in the North Atlantic during a'I
months of the year, all tropical cyclones thdt have th'eatenec Boston occurred
froi J une through November except for d si njle Febiruary threat in 1952 F yure
fl-4 . , the 3 troolci I cyc ones that threatenec Boston in this 94-year
p e,- z I m . , occurred in the m,,ntns of AuguSt through october wlth tne peav
threat In 0npte f er. The occurrence oT tropical cyclones of hurrirane intenslty
o! hA -r i i t riir i n u n i1 of '§oston nas a tar d , peak jurn q Au,,ust
,in I pte ;.* . ': out 3 or ') r occ.,ring durlnQ those icnths 1'36n--9"9
. -' bi a s th s t ims ds a fun ti or of tne cj" i, ass octant f or.
wn cn tno-v J p,-oi nei '"o0t )n. :t is evident that the major threat f,-om tropical
Y -~ e t r~ h ' S F1 soutn~west.
, t' i y. y i nes per year nj de passe wi tr, n I n mi of
;ost~r .,- t7 , , c .- c-9 9. Historically, slignt y more than ore o t of
tne - e n :ii' i ff nur,-icane strength, one way of interpreting thIs
l -, " r 1, ', e pa ,,ae Uf r' Iurri ane-strengith tropi aI cy4 on c eve y tnlrd
jea. Ieer, t ,re rds o not sppirt such a uni form trequency. Cu ng ne
period 41.4 -I' , ta, i nstan e, only onf hur,'icane influenced Boston
rlptcmb- 9 . , ,) n 353 ac 1954 four out ot ffur passes o t upic a
cyCiOnlcz wtr'e of t' r d } ane stren gt h.
!ri ! ,atur ' pl , tIo) offt2red Oy tnt shape of tole eastern Coast of tne
,n d atates, f.),i ,outh of New England to Cape Hatte,-as, essentially oictates
:ra ) uost recurring storms must ei ner make a landfall first soutl of Htteras
or pars lew -nj ani(: well of fshore to.) tne southeast. he majority of storms pass
ovtrwater well to the southeast of Boston, tending to follow the path of te
Oceanic Gulf 3trea , anr are of little threat to New England.
Jccasiona iy, nowevcr, storms are accelerated on a more northerly track
instead of the Lyp , d recurvature to the northeast. An example would be the
disastrous 193.3 hurricane which advanced rapidly up the east coast offshore,
passed Hatteras, moved over central Long Island, and then moved over lNew Haven,
(.onne-t icut arid tn,i',C norti-northwest into Veriont. lhus, instead of passin)g
New [ nglan1 .ffshore the hurricane accelerated northward at an a eraqe rate of
ddvan,. of 6o i ph -,' kt verng r lItt eras at ab uo ,:30 .AM j on 21 September
and r,,ar , ln, .lIonn(i ,t ,, 1 ! ' U ! :0 f P M ) n h i t, s i u, day. h rh d ,ate of
dIl Wdnl e , wi I1 he I i5 I t t , t. o n(rdu I ti to' st o rii p re pa a t 1iioi ev tn w i th t day' s
iio r e so p n t. i t 0 rin i n g m d rrd
X V - Ig
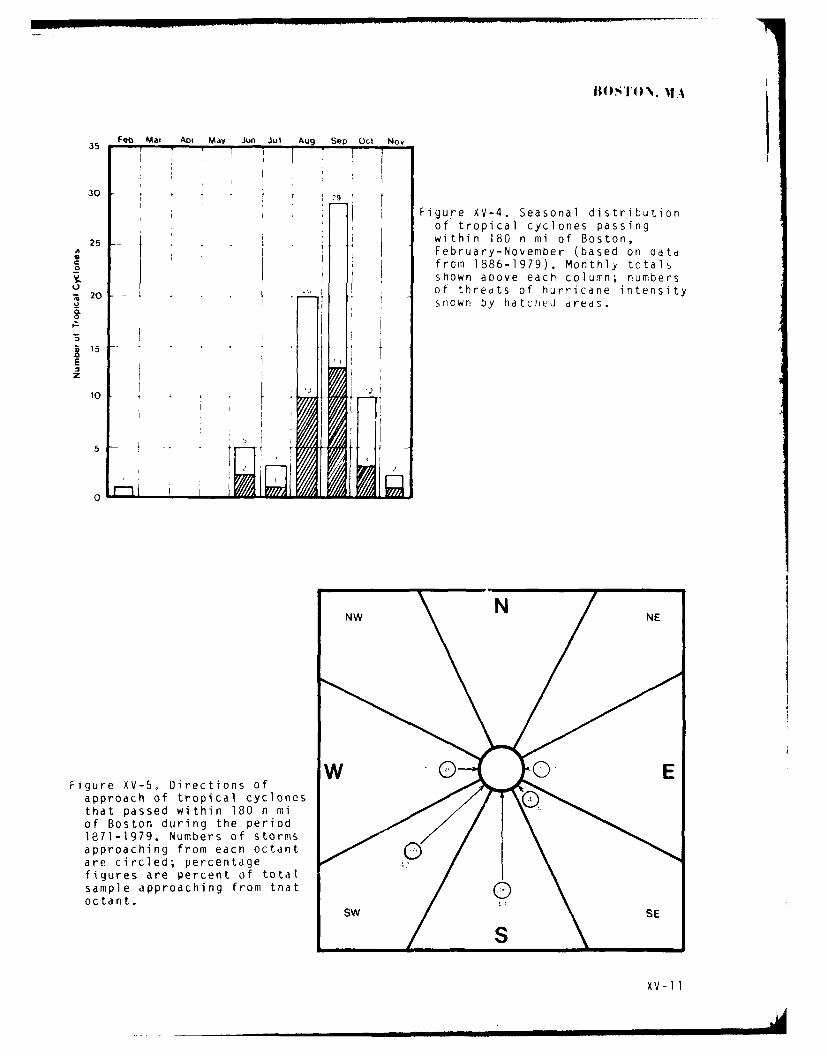
BOS 1"TN. II.
35 Feb Mar Apt MayI Jun Jul Aug Sep Oct Nov
30
SFigure XV-4. Seasonal distributionof tropical cyclones passing
25 - I within 180 n mi of Boston,2 I February-November (based on datao from 1886-1979). Monthly totals
shown above each column; numbers
- of thredts of hurricane intensity2 shown by hatched areas.
E
zt10 ,'
W N©E
Figure XV-5. Directions ofapproach of tropical cyclonesthat passed within 180 n miof Boston during the period1871-1979. Numbers of stormsapproaching from each octantare circled; percentagefigures are percent of totalsample approaching from thatoctant.
SW SE
S
XV-ll1
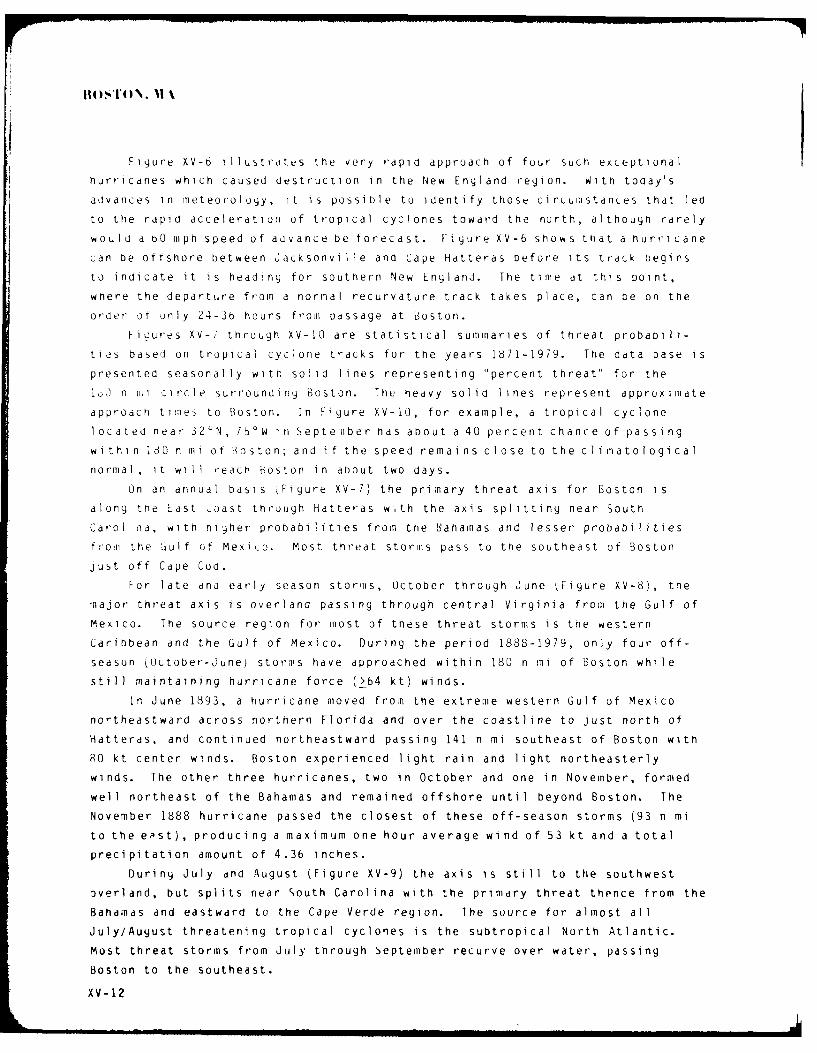
II)O 'l'qN. M1 l
Figure XV-6 illustrates the very rdpid approach of four such exceptional
hurricanes which caused destruction In the New England region. With today's
advances in meteorology, It is possible to identify those circumstances that led
to the rapid acceleration of tropical cyclones toward the north, although rarely
would a bO mph speed of advance be forecast. Figure XV-6 shows that a nurricane
can be offshore between Jacksonville and Cape Hatteras before its track begirs
to indicate it is heading for southern New England. The time at this point,
where the departure from a normal recurvature track takes place, can be on the
order of unly 24-3b hours from pdssage at Boston.
Ficures XV-7 through XV-10 are statistical summaries of threat probabili-
ties based on tropical cyclone tracks for the years 1871-1979. The data base is
presented seasonally with solid lines representing "percent threat" for the
1 0 n 1i circle surrounding Boston. The heavy solid lines represent approxilmate
approach times to Boston. In Figure XV-10, for example, a tropical cyclone
located near 32'N, 7OW i n epteimber has about a 40 percent chance of passing
within 180 n mi of Boston; and if the speed remains close to the climatological
normal, it will reach Boston in about two days.
On an annual basis Figure XV-7) the primary threat axis for Boston is
along the Last joast through Hatteras with the axis splitting near South
Carol na, with nigher probabilities from the Bahamas and lesser probabilities
f -mII the fu I f of Mexico. Most threat storms pass to the southeast of Boston
just off Cape Cod.
For late and early season storms, October through June Figure XV-8), the
major threat axis is overland passing through central Virginia from the Gulf of
Mexico. The source region for most of these threat storms is the western
Caribbean and the Gulf of Mexico. During the period 1888-1979, only four off-
season (Uctober-June) storms have approached within 180 n ini of Boston while
still maintaining hurricane force (>64 kt) winds.
In June 1893, a hurricane moved from the extreme western Gulf of Mexico
no'theastward across northern Florida and over the coastline to just north of
Hatteras, and continued northeastward passing 141 n mi southeast of Boston with
80 kt center winds. Boston experienced light rain and light northeasterly
winds. The other three hurricanes, two in October and one in November, formed
well northeast of the Bahamas and remained offshore until beyond Boston. The
November 1888 hurricane passed the closest of these off-season storms (93 n mi
to the e'st), producing a maximum one hour average wind of 53 kt and a total
precipitation amount of 4.36 inches.
During July and August (Figure XV-9) the axis is still to the southwest
overland, but splits near South Carolina with the primary threat thence from the
Bahamas and eastward to the Cape Verde region. The source for almost all
July/August threatening tropical cyclones is the subtropical North Atlantic.
Most threat storms from July through September recurve over water, passing
Boston to the southeast.
XV-12
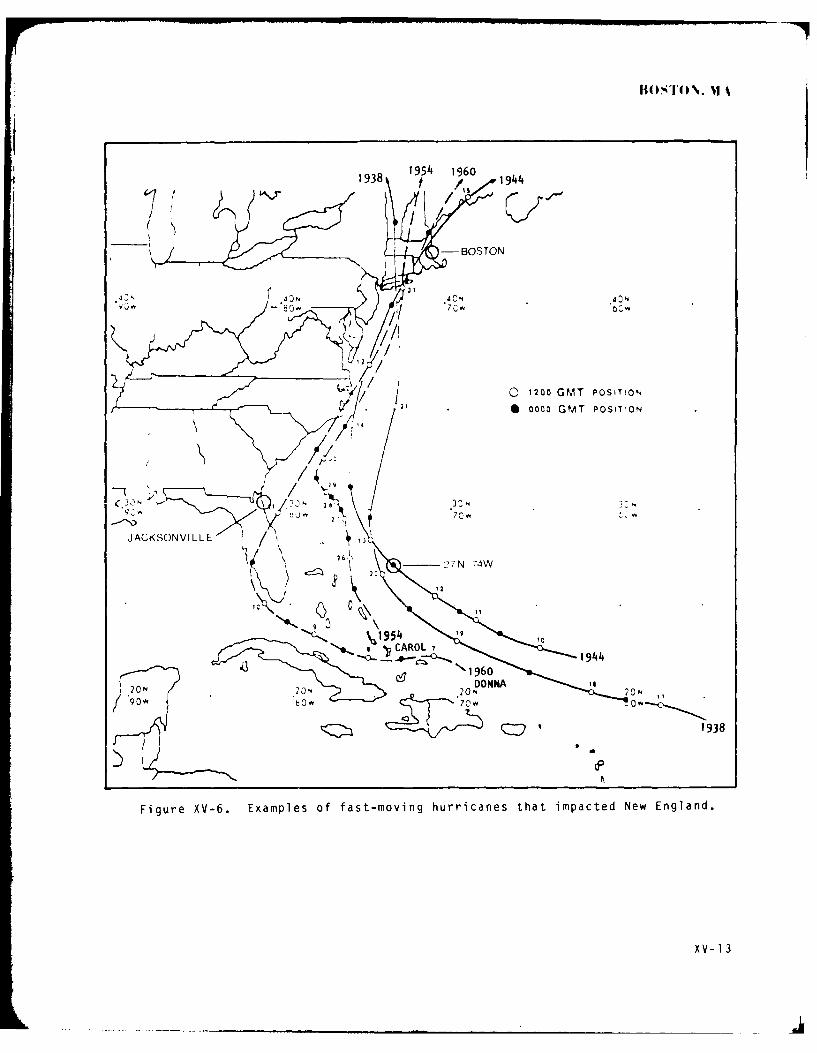
-BOSTON
ACN .
O1200 GMT POSITION
0 0000 GMT POSITION
-~1 29
JACKSONVI LLE /k \\27N_7_ W
1--.1X60 134
It 0 T0 N. .11A
PERCENTAGE OF ALL TROPICAL ANNUALCYCLONES IN OUTLINED AREATHAT PASSED 6ITHIN 180 N MICIRCLE CENTERED ON BOSTON
APPR]XIMATE TIME REQUIREDFOR TROPICAL CYCLONE TOREACt1 bOSTCN (BASED ON Z: :,KYTHLY CL IMATOLOG ICAL o01S-OEEDS OF '.0OVEMENT) 6
" 401
Figure XV-7. Annual probability and CPA curves for alltropical cyclones passing within 180 n mi of Boston,based on data from 1871-1979.
The threat axis of probability shifts to just offshore by September
(Figure XV-10) with the source region continuing to be the subtropical North
Atlantic.
The times to CPA presented in Figures XV-7 through XV-10 SnOulo be used
with caution, because it is the exceptionally fast moving storm that poses the
greatest danger to Boston, not the "average" storm. For example, Figure XV-IJ
indicates that a September storm located near 27°N/74°W should reach Boston in
about 3 or 4 days, based on climatology. However, the 21 September 1936
hurricane is believed to have traveled this distance in about 30 hours (refer to
Figure XV-6). The tendency for acceleration of tropical cyclone movement after
moving north of 30-350 N is evident in all the charts showing times to CPA.
Comparing the distance from Boston to the 1 1/2-2 day contour to the distance
between the longer time periods indicates significantly faster movement during
the latter 1 1/2-2 days.
Typical speeds of movement for hurricanes within 180 n mi at CPA varies
from 25-30 kt for those crossing near the New England coast to 20-25 kt for
those passing offshore to the southeast.
The months of late August, September and early October historically are the
greatest threat months for a direct overwater approach to Boston. This period
would coincide with the optimum time for the simultaneous occurrence of the
following factors:
XV-14

wE
z
C C
04
C14~
<o <v 7L-0
<- no~o
-~ :.
c:)~
-U -j
LnLc.) co c)1 0 C$
>- av co1

.0
v) C
00 0 0c 0 -
C 0
u0
0 E44-
+j5-c
3.0
z~ _j
o cl) o0 uouj o-- L
o~ E!' U,
u - cL 0 c. ( 0 )
Ld o _jo M 7: a)
L~0U :34-Z
XV-16

CL CCL
-,0.
00
CVC
0 -0V
zU it
0 QJ r
0- 0 -
0.
4-, - -
CP 4.0 a~
CC
cL~~~ < D )
0 w) 'Z C D oL <r cL s. W 0a: o - E 0 1jwI
-7V-2!

B0ST'I')N. M A
1) Greatest tropical cyclone activity.
(2) Strong North Atlantic subtropical high pressure system.
(3) Deep atmospheric upper level trough lying over the Last Loast.
(4) The primary tropical cyclone generation area is the subtropical North
Atlantic.
Factors 1, 2 and 3, combine to modify the normal recurvature of a to i ,aI
cyclone and instead accelerate and steer it rapidly north from Cape Hatteras
into southern New England. Factor 4 causes the tropical cyclone to be ptoper y
positioned for an overwater approach.
Unfortunately for New England, such storms lose little energy as they
rapidly traverse the colder water between the north wall of the Gulf Stream an,!
Long Island, as would be expected of tropical cyclones. This may be explained
their adoption of extratropical characteristics at higher latitudes or by their
reduced interaction with the surface at such high speeds of ddvan(e. L tn -,,
way, the circuistances described above combine to present a serious threat _)
destruction to New England.
4.2 LOCAL WEATHER CONDITIONS DURING HURRICANE PASSAGL
The primary sources of the weather data examined in this discussion were
the hourly observations from the Weather Bureau Station. H'storical dato far
the period 1885-1958 were obtained for Blue HIll Observatory site. uppl ementa(
data in various summary and observational form, for several sites ir and around
Boston, were also reviewed. Records from all sites were reviewed for those
periods when a tropical cyclone was within 360 n mi of Boston. The sites 3fld
periods of records for hourly observations were as follows:
Boston WBAS 1936-19/9
Boston WBO 1893-1934
Boston L/S 1958-1973
Squantuln 1943-1953
Salem Coast Guard 1949-19b6
Race Point L/S 1958-1979
Eastern Point 1964-1979
Hanscom 1943-1973
Blue Hill Observatory 1885-1958
During the 44-year period 1936-1979, 13 hurricane-force tropical cyclones
passed within 180 n mi of Boston. Table XV-1 lists various aspects of these 13
storms (plus tropical storm Diane of August 1955, which caused record rainfall
in the New England region).
XV-18
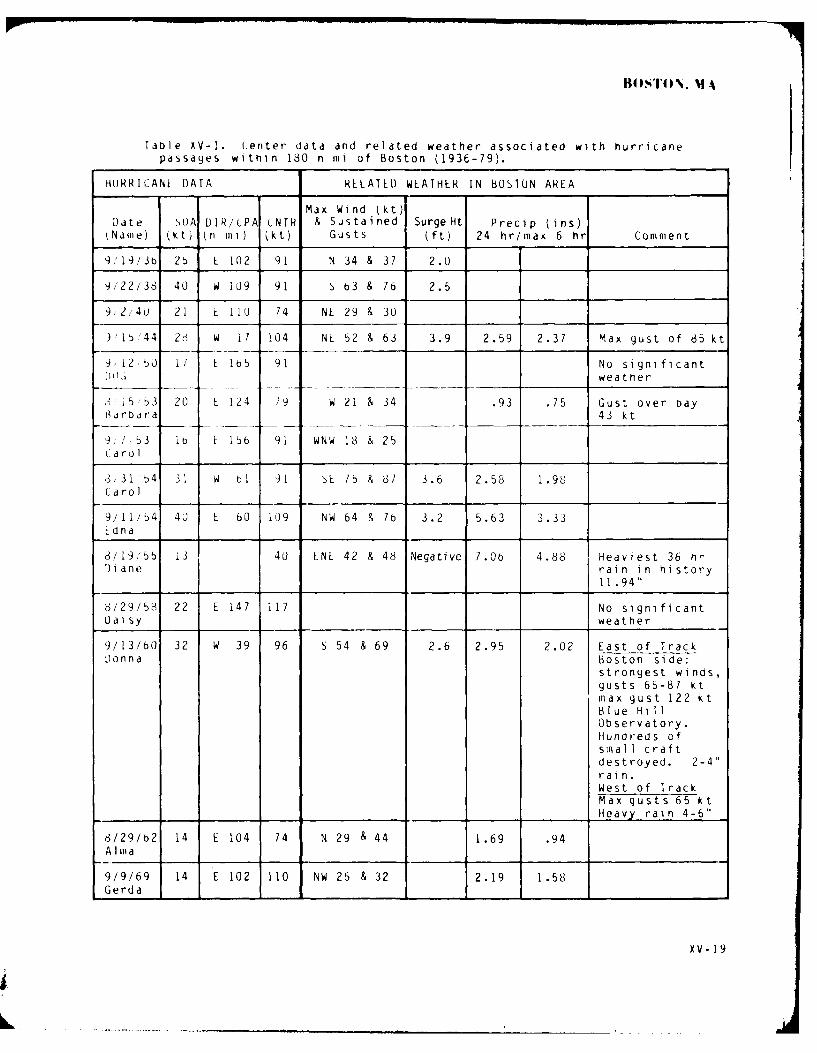
Bt r0T0N. MAX
Table XV-I. Center data and related weather associated with hurricane
passages within 180 n mi of Boston (1936-79).
HURRICANE DATA RELATED WEATHER IN BOSTON AREA
Max Wind (kt)D ate 5OA DIR/CPA CNTR & Sustained SurgeHt Precip (ins)lName) kt n ui ) (kt) Gusts (ft) 24 hr/max 6 hr Comment
9; 19/36 25 L 102 91 N 34 & 37 2.u
9/22138 40 W 109 91 S 63 & 76 2.5
9,12 40 21 E 110 74 NE 29 & 30
) It'44 28 W 17 104 NL 52 & 63 3.9 2.59 2.37 Max gust of 85 kt
9 1250 11 E 1b5 91 No significantD , weather
, i 5 t3 20 E 124 9 W 21 & 34 .93 .75 Gust over bayB 1 rbar a 43 kt
9,753 lb E 156 91 WNW 18 & 25Carol
3,31 54 31 W bI 91 1E 7b & 87 3.6 2.58 1.98Carol I
9/11/54 40 E 60 109 NW 64 & 76 3.2 5.63 3.33Edna
8/1955 13 40 ENE 42 & 48 Negative I.06 4.88 Heaviest 36 hrDiane rain in history
11.94"
8 /29/58' 22 E 147 117 No significantOaisy weather
9/13/60 32 W 39 96 S 54 & 69 2.6 2.95 2.02 East of TrackDonna Boston side:
strongest winds,gusts 65-87 ktmax gust 122 ktBlue HillObservatory.
Hundreds ofsmal 1 craft
destroyed. 2-4"rai n.
West of IrackMax gusts 65 ktHeavy_ rain 4-6"
6/29/62 14 E 104 74 N 29 & 44 1.69 .94Alma
9/9/69 14 E 102 110 NW 25 & 32 2.19 1.58Gerda ___19
XV- 19

The 1954 storms, Carol and Edna, offer an intereSting lCopdrI SUN 't t r )rmS
passing to the east or west of Boston. Carol in late August had d closest pi in'
of approach (cPA) of 61 n il1 to the west with a speed of advnL _ U f 3 Kt
and center winds of 91 kt. Less than two weeks later, Edna passed 0 n ii to
the east with a SOA of 40 kt and 109 kt center winds. Min i u m ta- v v e
pressures were 976 mb for Carol and 9/3 mD for Edna. Whi 1e E na n ad str ,rdst
center winds, was moving faster', and produced a sligntly lower pressure r eJ I,,
and whi 1 e the CPA' s were near y equal , Carol produced ilaXi Inurn one 1i nute
averaged winds and peak gust readings of 74 and 67 kt froi' the sjutneast dr,.]
Edna only b4 and 76 kt from the northwest (WBAS East Boston).
These differences can be related to the additive factor of the i .f tn,
right semicircle winds relative to the direction of movement. On the other
hand, the rainfall for Edna (the storm passing to the east) was iiure thdn ,; LD,
that during Carol (passing to the west). The records indicate that heavy
rainfal l and flooding occur to the west of the storm track and maximui wlnoS and
damage to the east of the storm track. Tidal surge heights appear independent
of direction of passage arid more a function of storm strength and proximity.
Mariners should be aware that all wind records used in this study are fro:;,
land stations and that a ratio of 1.6:1 has been found to be a representative
ratio for estimating maximum winds over open water areas from adjacent land
reports lHsu, 1961). Thus wind speeds of 100 kt were likely over the outer
harbor area during several of the hurricane passages.
Figure XV-11 shows the approximate tracks of the six most damaging
hurricanes that passed within 18a n mi of Boston during the period 1936-1979.
All of these storms produced widespread damage in the Boston area. Improved
warning systems helped alleviate property damage and loss of life in the storms
of 1954, '55 and '60. In storms of this type it is likely that any pleasure
craft or small boats that are not removed from the water or moved to known
havens will be heavily damaged or destroyed. The threat comprises the three
elements of high wind, heavy rainfall, and rising sea level. All must be given
consideration in preparing for a hurricane passage.
People of the Boston area are much more attuned to the winter Northeaster
type storms* than the hurricane threat. Some unique characteristics of the
hurricane that differ from those of the Northeaster must be kept in mind:
(1) the prime threat hurricane is most likely to occur during the fair weather
sailing season in September; (2) the speed of approach of these prime threat
hurricanes is quite rapid, 25-3b kt; (3) the wind direction is likely to rotate
through the entire compass with the passage of a hurriane; and (4) it IS the
nature of man not to be concerned about events that happen infrequently.
*Northeaster - An extratropi cal storm, most common between September and Aptrl Iwhich typically forms within 100 n mi of the east coast between 30-40°N anoprogresses northeastward. Maximum intensity is rea r : off New England,bringing precipitation and northeasterly gale force w inds to the coastal
r-2t) regions for a day or more.

4T
FI- gu t U -C e Aa ' T oIjf :Td o rh u jr n . ft, hat Ifft tEu
B o st on J_, t r, t pe r iod193 C- 19 7 Y
7
4.3 WAVE Ai.l ON
The i nner Boston Harbor i s somewha t pro tec ted by 'j}eer, Is arid to the northn
and east and Long Island to the southeast. Numerous o* her smnal ler i Slands '11soprov i de some shel ter f rom the open by/ocean wave ener . However, easterly
winds and seas Will cause Wave related problems. Most of the lower inner harni'is exposed to the east and vosseIs i n th s area , unIes s ethe i at w er1
protected piers, will experl~nce high wind waves. While the piers arid wqairvesof Boston have generally been constructed to h ndle the no,' mal - ft t od
range, some local flooding is experienced during extre e tdo c n,:itons. t n
the event of a storm passage at high astronoml c l tide, w ter'i -ont a,ns w a
be exposed to wave action. Water levels of 1 '12 ft over the piers ha, 'eer
recorded at the Naval Shipyard.
4.4 STORM SURGE AND TIL S
Storm surge during hurricanes ,,,ner I ly nos riut been a !ii ajor pro) em tor
the Boston Harbor area. The hi ghest surge vai e -1 re( ord is the 3.9 ft that
occurred with the September 1944 hurricane i Harrs , 1 '4t, . 1he te >54 hurriUane' ,
Carol and Edna, produced 3.6 and 3.2 ft surge heights. ith a normal tidal
range of 9 to 10 ft, surge heights of 2-4 ft will en,-aIl I y , ot he of great
concern. Of course, a 4 ft surge at extreme high t1de range of about 14 ft at
XV-21

6oston) would cause considerable flooding; when this was topped by wind wai es
from thie east, further problems would develop. A compounding adverse effect of
,'rge and eastt'rly wind waves is the restriction of the outflow froll the variouS
river that flow into and form the inner harbor. buch a restriction further
inLreaseS tne t ,uoc pr'b ie;o al ong the lower portions of the rivers, wnlIch
usuai j e perien-e increased flow during a hurricane pa&,Qaie as a result ot
lea.,, pre ipitation.
5. THE DECISION TO EVADE OR REMAIN IN PORT
Ine inner harbor port on of the Port of Boston is considered a hurricane
oa ve n; n ?ereftir'e, relwi nrin in te inne r harbor or ;isovjng to that portion uf toe
ld i t the r'j ,iiiiend , action.
n S ]t n S t r 1isoster preparedness by N dvy snips are found in
>,rr7 A "IN, T l,4 .i. JPA wiil direct action to be taken by Navy ships
:ii w WIa n r' N1 jr i~O~ h 'W e yiiou th, I s a ssigyn ed as T ic - rea
' ather oo'<i'ata* aId w1ll communicate weather warnings and Conoitions Of
kea dl S 1ns t ;P and I I) A iNA)', A U.s. N avy covlimunications Center is nr
ava ll[d1 e in H .t il, so snips remaining in excess of 72 hours should make gdatc
sh Ift arrLi :r, :,ntS w th ,Oill unlcatlons Center, COmnmander, First Co.st ,uar
'rrn of a hurricane, the decision to execute precautionary
e as ue ust be made In a timely manner. Precautionary action should be raSed
on con silerat ion ot tGur general factors: vessel characteri stics, harbor
coriItions arid avai lad le berthing, most recent hurricane warning forecast, anc
stjar; ci li : t o,) y il story.
i n i iIJal vessel factors are best determined ny those responsil1e tor
ed n vessel. Vessel cnaracteistics, in addition to seaworthiness, incluiEt suLh
ft o', as anchorage or moored location ano tug an,.] or pi I)t needs.
I. P R.L AUT iNARY ACION RATIONALL
hi ps berthed in trie upper portions of Sioston harbor should reaill n ini
port. fii the lower inner harbor, ships berthed in exposed positions or
str ctural l y weak berths, shouI'I be reL)b ertned or s houid learu the harbor.
If operational or logistIcal cI r:J!Istanes deand sorti e aot , thle
recmill ienided proce(ure 1S to stea!i Iu eaSt t o ledr the mul water 'eds j iind
continue evasiont as dintaded by the storm. iee Section ) for evasiOn at sea
rdt tno dle., [)ue to tn 'i1rh speed of advanit e of tJI-1 icdnes tout thre ate n the
boston area, evasion to the open :tlantic I nV0 Vo S a onsider "',t n ot ( eoln,,
overtaken by the nurri, ,e.
XV-2?
LAi IIIIIIII III <
5 .2 THREAT A E MENI
T 1nnH R i t ny pr e dcautionary iiie ds t s w alwa s e y ', _ I. "
as t northward moving hurrIcanes that kunstitute the p- Tie rn r e d !I e
ston ar e a to o f r Oili ead J n e s s c o n k. ui n i 1 o 1n i n
few hours. Note that Figures XV-/ thro u h XV'- S ow trW tre C Tm d j
position for thne average storm 4c hour's ou; .Ustun Is fra tne iad I t ',I
southern outh Carolina, while tne ;2-nour positio " t u near entr, , Ca.
However, 1IHure XV-o - - .Ld -, a i p 1 S .i s t S -7 ; ' I i L' '-"! I t' '. - :
s1gnificant damage in the New Lnjland re41on -- -no ne L' g Wpo1 . :a a
tiies to c oSeSt point of approa n kit "O t n t '.: tne , I:: st.,aa . 'Carolina:
C a r oeptenr .3.i n aar
e i5 tepteMDer 94 - 4' ho0 '-
3 arol i 9 - ) J,,4 J ria n 6j -. h'.
5.3 THqIILA, 0..URaL§
Tne s o rce of trop i al y .lo aS dy.. Iti ' .p i , 'I- e 'J. ' , j"
aro v r1ed. he folIowirig five subparraaphls '. s ie ta! 1. , e
StrI'I SouroeS ad appr),ohes.
R.oai Rationale for the Fr1sary hiireat
'*oro; s approadn1n, Cioston froi'i bet,fen tq tic as" s S t
m',eridian constitute the pr imary threat. 'he at , ug s" th,-,*o -te'r"
period !s the time this type kt sto ih: is iioSt i kt'ly
iS for the storm to accelerate on a northerly track, nern doe 1C'sI t "
rel ative to precautLonary measures shoj e y H Yen. mShipS at ~p§e 0, Se,
constructed berths should be rebertneo.
. .2 Rationale for Storms Appruach i_ fruom (Over Land
Storms approaching from over land ',landfall soutn Ct t oni 1 sand a( e ci
limited threat due to their reduced intensity. These s o-i s girU. nt , 1 K
jenerate wind or surge problems at Boston, but storms Of this type whL h 'k. ve
ind pass south of Boston can cause heavy rainfal i lania n u n L
<V-il) and related flooding problems lIable XV-).
D.3.3 Tropical North Atlantic Hurricane Near the Bahamas
Tropical cyclones approaching from this sector in close proxiIt;; ty to the
east coast are Boston' s greatest threat for the dangerous com p Iete I y- erva t e
approach. They are also the most likely candidates for rapid acceleration
northward. If the storm becomes one of the unusual , northward- acc el era ing
hurricanes that are particularly dangerous to Boston, minimal time is available
for precautionary action silnce the ti me schedule will be compressed. Hurrianes
XV-23

'IIfr ', near the f arj IIIas wtn1.n actual Y striKe tr i ;tld rt I dsti i rI e of t n e
sou ne, ,n un ted utates wu)I1d not general ly be considered a threat, since
nis tOrl 1 i y t 2nLy nave weak ened iOnS.i rdJ . ,-Dn eAeptior wo ul D e tnos
ner''ndrte "nat S pass viver a s a I red of arid, partIculdrly ape riatt -S, S jr
S Sr ' alie tionna in 9u.
C.*. aical No ,th __tlantic Hurricanes Fartner o ortneast of Lana as
BaSed O recfr Js of tnis century, tropical cyclones north of
approx i 1atey 2 ati ude and east, of about ./I on i t ugtude nave d i w
probability of Deing a destructi e tnreat to Boston. However, for a ' j,
nLr !lcane i ri tni s area o'L2i iteu to threaten Boston, precautloniry aiti n jIrcs arc
dovi Saul-
3..].O j'1f Ot Y I i,! A 'est LaritDbl t n Hurricanes
T , i a yt loach ng fro this area are nobt co,-SI ' "
to sn pp'i* n th n I e tn pasage of 3 cn sto' : I' s
of Boston u,- ,jrs f ifa ,1 f er, tnir long track, o'e, lano gveatj de.: n arY
wind tnrea ny Lsn u mI res tne 1 Lnange to an eAtra ro ' aJc tyt,. .rc,
'a' ca se loca fli'j eo n avy preci pitatron.
trie fairo ,," ceep-draft incno-age areas are nortn of Presi !Pnt S
'iantasket Roads, between Georges island and Long :sland, an north ,f tn.
channel erit'ance to tne inner haror ,see cnart I3 ,o .;re on-n ,'a u o, -re
west side of Georges sland is sheltered from easteriy wi ncs rut nas 4uestron-
able no lirg. Tni s ared is used ny vessels during perlods of st ng custer I
winds. The anchorage north ot Prsident Roa.s has a blue :Iu utjt . an falr Y
good holding but is space-restricted and has numerous sur-'ouncing snel Ives anC,
shoals. The anchorage north of the inner harbor entrance chinnel has a Sc it 71,J
bottom and poor holding qualities and is not an appropriate anehorage durrg
strong wind conditions. The best hurricane anchorage see Parad -.4 is
40 n iii southeast of Boston Harbor in Cape Code Bay, within the iook of ape
Cod.
5.5 RETURNING TO HARBOR
After the pa s sage of a hurr 1 carie, entering the na ,bo r I: a present
hazards. There may be wrecks in the channels, large floating debris, and .amage
to the piers. Alongside services may weil be disrupted by the flooding
associated with storm surge. There is a very high probability that channel
markers and other navigation aids will have shifted position or become otherwise
unrel i abl e.
XV-24
- .. . .= , , , I I I I I I II

.'JNNC ' '4u i O R Ki HL LLILN
Ini ps at sea that are seeking shelter should consider several factors
relative to Boston. Boston Harbor is considered to be a refuge from hurricane
weather. ultdble berthiny is dvailable. mhe dnchorages in the harbor area are
not consIdered suitable during hurricane conditions because of their limited
si ze, surroundIn snuals, ledges and rocKs, and varying holding characteristics.
Harbor foci l1ities ,tugs and piers) are generally available and harbor traffic is
not Conest ed ine numerous shoals and rocks in the outer harbor region make
na igat on durilng heavy weather particularly dangerous, thereby necessi tdti ng
arriai prior to onset of storm conditions.
.DVICL FiR TM LL CRAFT
i;i a I 1 craft snoula be either reiiioved from the water to positions above
projetted flood IPvels or bottom moored in protected areas. There are no
'eLo;IIIenCed s1al I craft nurricane mooring facilities in the main harbor. During
nrricarne Donna in 1960, hundreds of small boats and pleasure craft were ripped
f-oin tneir iaiori ngs and smashed against rocks or seawalls. Similar damage was
inflicted by earlier severe storms in the areas. Small craft berthed along the
westurn Dank of the inner narbor below tne confluence of the Mystic and Che)sea
-lvers appear particularly vulnerable to damage by hurricane passage.
6. RATIONALE FOR EVASION AT SEA
:t sortie ano evasion at sea is necessary, then reachin-g the deep watr'
)eyond the continentjl shelf is advisable. Large areas of shoals exist within
.assadnsctts iay ,)tlilwagen Bank) and over the Continental shelf area of the
open o)ean ,eorges Hiank;. These areas produce the dual hazards of limited
d 'ft ano nOi lw water wave action in a totally exposed open ocean area and
sno jl A therefore )e avoided during evasive action.
m nen tn red tened by weaker tropical systems, such as a tropical storm, or
if rdpid (evelopiiient or speed of approach -akes sortie hazardous, then some
local berthing o, anchorages are preferred IPara. 3.4). When evasion at sea is
contemplated, the Importance of an early decision to sortie cannot be over-
emphasized. Each threat must be judged on its own merits. The most likely
threat scenarios and recommended actions are described in the following three
subparagraphs.
6.1 IROPICAL NORTH ATLANTIC HURRICANE NEAR THE BAHAMAS
Tropical cycones approaching from this sector in close proximity to the
edst coast are Boston's greatest threat for the dangerous completely-overwater
approach. They are also th" most likely candidates for rapid acceleration
XV-25

northward. Ihe on y sort 1 e options f rum a th red ten i ny hurricane located near
the Bahamas is either to evade within the confines of Massachusetts Bay or head
southeast with intent to clear to tne east side. This action requires crossinj
p the track crossing the T) and requires extra caution. Heading directly east
;nay not give enough clearance if the storm moves rap idly northeast. Since the
majority of such storms do accelerate along a track in a northeasterly direction
well soutn of cape Cod, any sortie must oe initiated early, otherwise the vessel
can easily be over-run before it IS clear.
For a fast-moving l30+ kt) storm, the seas and most wino wi i I not
project any appreciable distance ahead of the storm, whereas in the case of the
s Iower-;;iov ig stotr'i , swel I and wind extend for considerab1e di stances ,hundreds
of mi les) from the storm's center. If the sturm becomiies one of the unusual,
nortnhward-accelerating hurricdnes that are particuldrly dangerous to Boston,
less time is available to sortie since the schedule will be compressed; however,
it will be easier to clear to the east of the storm.
ir any event, if a vessel intends to sortie to the open ocean, an edarly
decis ion must be made, preferably witn the storm no closer Clim1atologi'a ly tdn
48 hours. Hurricanes from near" the Bahamas which actual ly strike the Atlantic
coastline of the southern United States would not general ly require a sorti e
since historically they have weakened considerably. An exception would be those
hurricanes which pass over a small area of land, particularly Lape Hatteras,
such as Hurricane Donna in 1960.
o.2 TROPICAL NORTl AILANTIC HURRICANL FART HLR R ,JrIHL AT i) C AHAM,\>'
Based on records of this century, tropical cyclones north of approi-
mately 27°N latitude and east of about 70'W longi tude have a low probabllt i Of
being a destructive threat to Boston. These storms do not general ly warrant a
sortie. However, for a major hurt.cane irn this area prelicted to threaten
Boston, evasion may be advisable. In this case the most probable diretlon tr
the storm to travel , if the warning is riot correct, is north-northeast.
Therefore the best evasion route would be to the southwest along the V.5. east
coast. This would place the vessel in the safe semici rcIe If the forecast route
is correct, and allow the vessel to evade the storm that recurves to the
nort e ast.
6.3 GULF OF MLXICO AND WEST cARI IiLAN HURRICANLs
Iropical cyclones approaching from this area are not considered a th,*eat
to shipping in the Boston area and would not warrant evasion. While the passage
of such storms within 180 n lii of Boston occur-s fairly often, their long trak
over land greatly reduces the wind threat and nearly assures their change t, " ,'
extratropical system. They may cause local floodin q due to heavy precIpitat d o .
XV-2b

RLIF EENCES
Q S '1vians . 11 Q'w
S - n .'A~h e'9> m r r .L.- t0
>12 ittsn~ So na ra. unisn re2 c~. ut. :~ 7
U' -~r4LsLSQQIIgy, 2,, pp. 31:-;5.
* Ln * ;%d t a n a 1vat: a tefnt er, Ashevli '7' A j 1ai !V MW ne , o0r& aK es L
Am2 Po)ston "ar: a!
r- i,: j q ilUhtdQ±CIUll e(7y51
Ljr j AI m n 1c eseu'-LB Pad ity a ,-nni -a! Paper a %0 lb
I t in,,et '1 ov4 t 1e rives -%a o, Tne PQr Qf A'a>os:',
ei' pa ent t 'a ner id S t P&ia' ', tdanti a5 I >'s
55ki s

R9
Iq'
ca

XVI: CONTENTS
1. Geographic Location and Topography . o XVI-2
2. The Harbor Area and its Facilities . o XVI-2
3. Heavy Weather Considerations . . . . XVI-1O
4. Tropical Cyclones Affecting New York Harbor XVI-ll
5. The Decision to Evade or Remain in Port XVI-22
References XVI-32

XVI. NEW' YORK. NEW' YORK
SUMMARY
New York Harbor is recommended as a hurricane haven onthe basis of the considerations discussed below.
Tropical cyclones which have caused sustained winds ofhurricane force (>64 kt) in the New York Harbor area arerare events. Normal hurricane recurvature at this latitudeand the geographic features of the New York Harbor areacombine to provide protection from the more dangeroustropical cyclones.
New York is a large, natural harbor with many excellentberthing facilities and good deep-water anchorages. Nlaturaltopoyraphic features and numerous man-made structures offergood wind protection. The bathymetry and orientation of theharbor relative to the normial path of hurricane passage tendto iitigate wind/wave and ocean swell danger. Storm surge,however, is d significant threat to the harbor.
Three additional factors also apply here:
(1) The probability is low that a tropical cyclone ofhurricane strength will strike New York Harbor.
(2) The decision to leave New York Harbor to evade atsea must be made very early to allow safe clearance, becauseof the normal increased speed of advance and likely recurvd-ture of the storm.
(3) Excellent berthing is available.
Normal hurricane berthing is recommended unless theharbor winds are forecast to be near or above hurricanestrength. Reberthing in the most protected berth availableand extraordinary preparation is then recommended, withparticular attention to possible storm surge threat.
This hurricane haven evaluation was prepared
by A. J. Compton and J.D. Jarrell of ScienceApplications, Inc. (SAI), Monterey, CA 93940
Change I XVI-1

I. GEOGRAPHIC LOCATION AND TOPOGRAPHY
New York Harbor, which is located along the western shore of Lung :slan;, *
extends from the confluence of the Hudson and Last Rivers in the north to Lower
New York Bay in the south, as shown in Figure XVI-I. It includes Jamaica bay Lu
the east and Sandy Hook Bay to the south. New Jersey ports of Perth Amboy, Port
Elizabeth, Port Newark, Bayonne and others are accessible through tributaries
which empty into New York Harbor.
The harbor complex is located between the New England lowlands and tie
Atlantic coastal plain. Elevations range from sea level to a high of over
400 ft in the Richmond area on Staten Isi) nd. Lower New Ycrk Bay 1s open t ) tne
Atlantic Ocean in the quadrant from the east around to the south, while Long
Island Sound opens to the northeast. The Upper Bay opens to the south via tie
Narrows to the Lower Bay.
The western end of Long Island Sound is subject to channel irg ot wiinD eri d
water from the east as i s New York Harbor from the southeast. )hort- pero,
wind-wdve setup, as well as storm sur ge, i s po s s i b I e i n t h e e v en t of ot yhurricane landfall (e.g., Donna in 1960). The physical geogrdphy of Tew YorK
Harbor and Long Island Sound allows sufficient fetc i for, wind-wave oie;:aqt to
occur, and both are susceptible to the buildup of water in semi-closed UayS
causing abnormally high levels.
Deep ocean swell is effectively blockeo from entrance into Lcnri :sinrio
Sound by Block Island and associated shallows, as well as by the rest,'iLtive
angle at the eastern end of Long Island. ocean swell is shoaled I on u sal iows
at the entrance to Lower New York Harbor, giviny se'*e protection to the harbor
proper. Figure XVI-2 depicts the physical geography )f tne aea.
2. THE HARBOR AREA AND ITS FACILITIES (Figure XVI-I)
The New York/New Jersey Port area is one of the largest OliliLt''ldl 1a 1 a intle
complexes in the world. New York Harbor is a la rge, proten ted, natural ha rbor
I ocated only nine mi les from the Atlantic Ucean. W I thIn the, n hor o pI e
there are over 1100 facilities including over 120 piers, wharves and do ks iiany
inactive), good deep-water anchorages and an extensive channel ne twork. Ihe
following discussion of facilities is limited to the major militdry and commer-
cial piers and those piers which are occasional ly used hy the Navy. iEtrance to
the harbor is via a narrow man-made channel which is difficult to ndvigate
during heavy weather. The port facilities are discussed under three second-
level subparagraphs as follows:
The western reaches of Long Island Sound, though not a part of the New YorkHarbor complex, will also be considered in this study.
XV I-2

F A ItK.N i
BERTHING AREAS
1. Leonardo Piers2. Floyd Bennett Field
3. Military Ocean Terminal4. U'.S. Coast Guard Piers 4
5.Passenger Ship Terminal
6. Brooklyn - Port Authority Q:.
Marine Terminal 8~7. Columbia Street Marine Terminal Q
8. Elizabeth - Port AuthorityMarine Terminal
9. Port Newark BR0NX i in10. H-owland Hook Container lerminal ~11. Former New York Naval Shipyard
12. South Street Seaport Museum b13. Fort SchtivlerF
95
N. Pet Wo AnA No. 44
~C.SadyHooUbyENchSo.4SAD4,.By ig nh N.2 ,,
BAY ~ ~~ 0CE Stp0 o Knh No 23 N,2
k A .HdonNDr nh N.1
LOWE BAYNERYOKERE
FiuexV-,Ne ok abrwt lct~n fmanbrtigancohc~~

NEW YORK BAY
Figure XVI-2, Topography of New York Harbor area (elevations in feet).
X VI -4

\IEA 101Ml. N)
Para. 2.1 Lower New York Bay
Para. 2.2 Upper New York bay, Newark Bay and Lower Hudson River
Para. 2.3 East River and Western Long Island Sound
2.1 LOWER NEW YORK BAY
2.1.1 Leonard) Piers, Naval Weapons Station ,NWS), Earle/ ew Jersey
The Leonardo Piers, NWS at Earle, New Jersey are located on the southern
shore of Sandy Hook Bay about 6 1/2 mi les frow the entrance of Sandy Hook
C han n e I .
2.1.2 Floyd Bennett Field
Floyd Bennett Field Wharf, located in Jamaica Bay, is operated by the
National Ocean Survey, NOAA.
2.2 !1PPLR NEW YORK BAY, NEWARK BAY Al4D LOWER HUDSON RIVER
2.2.1 Military Ocean Term inal Bayonne Annex
;ne MiIitary Ocean Terminal, Bayonne, New Jersey, Fiyure XVI-3) is located
on the western side of the Upper Bay about 15 miles from the entrance to Amorose
Jnanne I I h ere are ten no rt side (N I through N 10), seven southside S I through
b7' and two east side JEI, E2) berths located around the terminal peninsula.
t6 R14 4*L.4 N3 2
j~r 1 44'" ,,
- - - ~loll fjj NEW YORK
IF
lia r I .l -
LVPL N T _,LI~r4,0
7-7
t,/ ....
41.4 ST An
\ 4
Figure XV-3, Military Ocean Terminal, Bayonne Annex XV5-
NorthIns i de ber, ns it'e U '- o 33 f t I ori a nd 2 9- 39 ft deep Del Ow ii~dfl OW Water
(ML W). L I and L2 are 400 arid 653J ft Ilon y, respectively, and 46 ft i n depth
belIow NIL W. NOt C: dCcces s to t he term-ini na dI Is r-e striIc t ed t o 3 d f tc tdeptO riLelo0w
M L W. Ihe south side berths are 23- 37 ft deep below MLW and 600-8 00 ft long;
decK he ights are 13 f t abDuv e M L W. I he siru tIn er n andu eadst e rn b er t ns a re s ottie w at
exposed to incomi ng seas tnrouyh the Narrows.
2.2.2 U. . Coast Guard Pi1er-sGouvernors sland
ThIne Coast Guard Piers are located on the east side of Governors I slad IIit
Buttermuil1k Channel.
2 .2 .3 Passenger Shi p lermi naLi ~Cty of New YorK
The Pa ssenger Sh i p Term inalI is Ilocated on the ea st s ide of the Hud son R i ver
f rom 47th to 54th S)treets. There are four- large pi ers Pi er Nos. , 9u , 1)2 da
94) which are used primarily for mooring cruise vessels. There are a total of
eigyht berths i7 1-1U0 f t long constructed wi th timiber pilIes and concrete Jeks.
Deck hei ght i s 10 ft above MLW wi th deptn al ongsi de 28-32 ft bel ow ML W. Pieors
are wellI protected f rom strong L- W winrds.
2.2.4 Brooklyn - Port -Authority Marine Terminal (Figure XVI-4a)
\Owned by Port Authority New York/New jersey)
Piers I and 12 of this marine terminal , which a re Ilo a tetc( o n thIne e a s'st S1e
of oiuttermi 1 k Channel (Pi er 12) arid the east si de of tne Laist L'i v er en t il t
(Piet- 1) , are general cargo and contai necr termi nal s and a'e ot cias, mta 11 spc oy
Navy ships. There are six bertns 300-1091 ft long, at1 wit1-h 3 2 Ift :- t' 1, r;'
M L W. Pier, 1 i s timber pilIe, concrete deck with deck height 12 ft ~iove '(
Pier 12 is asphal t-surfaced solid fill with timb~er pile amai cOnLrete d'
extensions - also 12 ft above MLW.
2.2.!) Columbia Street Marine Terminal (Figure XVI-40i(Port Authority New York/New Jersey)
C oI urIIIb ia ')tr e et P ie r i s d s emIi - p r ot e ct ed, d e ep - dradft 1n 3f) t ~w Mt e. ir
located in Gowanus Bay (east side tipper New York Bay;. 1ot1al isl " h! 1k )e r t I1ng_
space i s 12ad, ft an the west side at tnoe pier and 120tm ft orn !nt cdst s e
Thi s Is a lIarge, asphalIt -Surfaced , timber-pilIe pi er.
2 .2 .6 LI z abet n - Por't A\uthori ty Mari1n e I e ri rd 1(Port Authority New York,'New Jersey)
Port't ElmIZdh( znt h I SdII a ' maor c o mi er ci alI t e rmIIi nal fo 0 ot tnt nt Ld -d generaclY I
cargo located on Newark Bay with access from Upper New York tbay vi1 K i IIV a it
Vu;i I . Ihne pievr , wIchI i s o p eradt ed by s ev eralI pr iv a te com prnrie s , i s const ru(teo
of concrete retai ninrg wi I I andi so! id fill1 wi th asphalt 1 surt ace on coticrtet
reli ev1 ig pl at form. t he re i s e xte( n si1ve )te rt hi ngq (ra a v Ia tal w it h 2r beh ,rt',hs
Seven n umbered 50) th rough 'I-;) armd ne, I , I (ti f t ()t usolle I , ert hi ri n, paute. tit,
deck height is 12 ft above MIW mid depth alongside at 35-12 ft belIow M~t W .

ss
TERMINAL
r -'
p>
,i i I I I . . . . . . .
Figure XVI-4a Brooklyn Port Authority Marine Terr"inal piers.
- C
II I I In --
-- - -- --7
F icjure , VI- 4 Co Iumi Li Street Mirine7 tn; na 1
NI \\~ i4lIx. N
2.2.1 Port Newark Lowned by fky of Newark)
This terminal is Similar to Port Lizabeth in construution and function dnd
IS located adjacent to Li zdbeth in Newark Bay. A major marine termiinal, Port
Newark has a total of 37 berths with nearly 23,QUU ft of berthing space. Deck
neignt is 11 tt above '-LW and depth alongside is 35 ft below MLW. Access to
Ports Llizabeth and Newark via Kill Van Ku]I requi res passage under bayonne
br Io e with a m ilimuii I Il leardrce of IbI ft.
2.2.c lowland Hook uontainer Terminal I City of !iew YorKi
m wl and Hook is lo ated on tne northwest side of tat en sI dnod at tnle
southern end of Newark Bay on the northern terminus of Arthur Kill.
2.3 EtT R :VLR AND WETLRN L0N G !SLAND SoUND
2.3.1 Former New York Naval hipyard Brookiyn
The former New York Naval Shi pyard is located I.7 !i les northeast of te
Battery on the Brooklyn side of the Last River in Wallabout Basin. There are
tiree pi e rs 6, J, and K. These piers are owned by the Iity of 'New York ano
operated by Seatrain Shipbuildi~g and Coastal Drydock and Repair ,Corporatlon as
ioor ng piers for outfitting and repair. Ther e ar a total of 13 bertns oo -
sg9J ft long, with 10 ft deck height and 25-40 ft depth alongside at MLw. ne
channe is dredgeo to 40 ft up to the shipyard, but the current in the East
River is strong and congestion is heavy; caution snould be exercised in
naiigating this river. ,ccess to the pier's IUquires passage unoer tne Yann,:!ar
Bridge (suspension open with a clearance of 134 ft' and tht CrooKlyn ,
,suspension span with a ,Jearance of 12/ ft).
2.3.2 South Street Seaport Museum Owned by City of Niew York
Tme Seaport MuseumT is located on the west side of tne Last ql ,r a)oolt onett
mile northeast of the Battery.
2. ,.3 Fort chuyjIer ,U.S. Uovernlient owned)
Fort Schuyler is located on the outer end of Throgs Neck Peninsula at the
extreme western end of Long island Sound. There are two wh ,',ves here.
2.4 NLW YURK HARBOR Ml SCLLLANLOUS AND SMALL CRAF T FALIIES
W ithln J 2') lt le, rddiUS of the Statue of Liberty thiere a o t, t ihan
m iles of waterfr nt in1luding nu oerous Days and nter:onne tin1.I wi rways.
Jalj Ii d Bay ,v a ockoway Inlet) Is a large bay , x 3. -, ''I e (? , sd ,, m' ,
by pledS re .. raft. 'nee psnhd Bay, norn of Ro.kawa1 n~ t, wel pnt,
a 11 d t , y n ilt-rou p i i re S n lc I )n nl a t .f t. 1 1 : - , , I
bight on the -,uuth Side )f SttI en islanI , i in on.. I .. an. h -,i t '
(r. a ft.
XV I -8

L a st n e St er b ay 1n w e st e r- L on .)lri y Ijn f)un'l I s u2 Sy n1'ei S
craft, Dut CjutiOr :iust be used ds tnie shores are fri ,je w: i rO lerS r:
the re are i;::iny snalI S. r lanhasset -y westrri Lono t sI Jr,J f'i, ,tr,
excel lent shelter for vessels wltn 2 ft or less draft. Jystcr ay on t,_ i ,
snore of Long :sIanu provldes LO i un.nordge f ur s';ld Cdtt.
There are numerous other smal n3ys and in Iets whlh -n o a I offer pr .
anchorages for sa] 1l crdft, sjin tnl, enclosed ays vh in ff r prutitl
both wind and sea as well as good n)li n for anchors Shdi n be Inr.srsh db
a fter check i n g w n K n Jw i ed J b 1 o 1 'rd a lil e .
2 .5 CHANNEL
Tne prinaipal nrt al e n ) w K.rk arbor is via 1 iDnros 'ri nre
Lower Ba y and t ri tnroun rn iur e Jhannel an extension f :Sro ts-
jpper ay. !o a, , i - ' r" ,n jrine. ,n'inLes northward fr ni ,tter ,
five i les t ,,- " , ee*. '. a lltanJ. ProJect aent' fo th e e cra, e
45 ft.
The Lower Lay :i ay 1 so ne rter,.: tnrho gn c andy -ro-ci Jhanne ,-4 ,, n i- .
to berths in ne western an d So, nt n port ins 1if tne Lower 5 ay. lancy oi>
nannel nas a project oeptn of K ft. r-'a I hannel , ,vtn pruleit ieLt,
35 ft, leads from Dandy riOl. K ', S tu , TinA dJ irS jhapel -)-1 nah,'p
I eacs from an y o.> lerai.s oa; ts ;,v',-se ,ff une, n tr a p,, 3 -
deptn of 3dJ ft.
Lay Riidye, ed hook an, f tt r :i h ran e s in :ne ' per oa, s, ," -
western shores of Long Islan r ri B ay Ridge t. -ast Li v r ad , t l , -
of 32 to 4J ft. te,- York and iew Jersey &hainnels i . , Ia '.r
Newark Bay, thence via d r thur Kill dround 'tten san projot Ie-t
35 ft.
Long is] and Sound pproachi to hrogs 'ecK, tner ast --.i ;er - It' I
nas a minimIum depth of 35 ft.
2. r L L, 'LL, f, I OHA
Tme to] lowing pub i'at1ons and harts provide detai i infor.t , -nr
York Harboa r dnd its faci11ties:
DMA Hydrogrdph', Topographic nter, 19 9: Lub] iCat i In I,Fleet Guide New York.
tape Co-! to -,,id/ loiu
Jn te(I tate , .i) erniit nt [) ri rt in,; - ti, t. , a n in, o 'ps ifn Or t'Of ,
TO , Port ,er (, s o' t. T n Lr t c if ('w '(Im l_ . 1 C 3J.
1.0. Departin"nt ')f hlm rce, -na t , ', ,I,, *. : Iir Ir , .'. 'Harbor - pper 1, ay and arrow , ow 2 a ,ul on 1,1,1 P I rv ,,-.,-,Last Oiv'-r - a( 1 :1 it harn: im''n'- -ni ,:, 1 . 'c - , 'e. f l 0Sound Western P i it, ?3,1 ,Hu s f)in P , -L , .' - ,, rr,; A,: .'
r1 d y P 2 351) in ,.j it ,i a y and o( k wa y n IeV " -
3. HEAVY WLAIHIR C(NSIDLRAI IONS
.. .. i..!, .,S f.' _if... ,fi: TC ,
SI t , s j
-j, t as. ' tps -. t r n j c-v, t K
a s 'd f~'
': ' A "" ," ~ :L j ': d' ' s -
f o • -L ri p. t n e a n n t2 "rCy. y '- '
j, d ,V .. J t d P f e e
- K"''.. -- ,,,',_" i, '.< cscs d'd p'-itectei r7 Es n uadr67 CeC o~c
-.•6. i - 1tdtti trw: tr e satet of s~r 5
.~~~~- s .1 ' ,h d- r, e. e y~ oe f;',. stv -o'. s] "b r q ra]ats- ,*
.: .- : ; , ;.,. L,';, ic nv'.,v es su.cn variables as a~.esSioil , y
,,. , ' , Kr, s ' an a i o , S1 e s s t h as wen !s C o s en C Cr
n , .- ,. rl n u i.iu rersd vs nar 'w2s 3nc (1oc s n tne
,*', ' .,Lw ,.' <,- i* , o' c,;i w_,v~luatio-n o2f Suitable Derths nas retcessa,-1 iy
. ia I a nt', I t dwe' , r tc s i~t-'cu< Ki'S, a Y
.in r' ( L aS1Crdl n d y se db the a v y. a e t a I ed e vadI dt I -n
, a ; [1 n rl I' I S is Jv eJn in Oard. .3, "Pei ainin y in o r
I , , Val ha 6 I'hl diCt-IphId, Is t n t, - t-red COJrdirlator ti' 0IS St'
n . i rlri(j nio o ptr 7 o ns. I ,VS , tY Instruction 3142.1 is th e
n d n " 1 n w r I 1 ) f e ute ( y %a v d t a t 1 o r i e w Y o rk , i n
..... , , t t r-, st or" e i sting heavy weather in 14ew York Ha bo . N 45V % ,1"
', , .,.: . AP;. ,AUV,1, sets torth tee rules and regulations for visitiI,,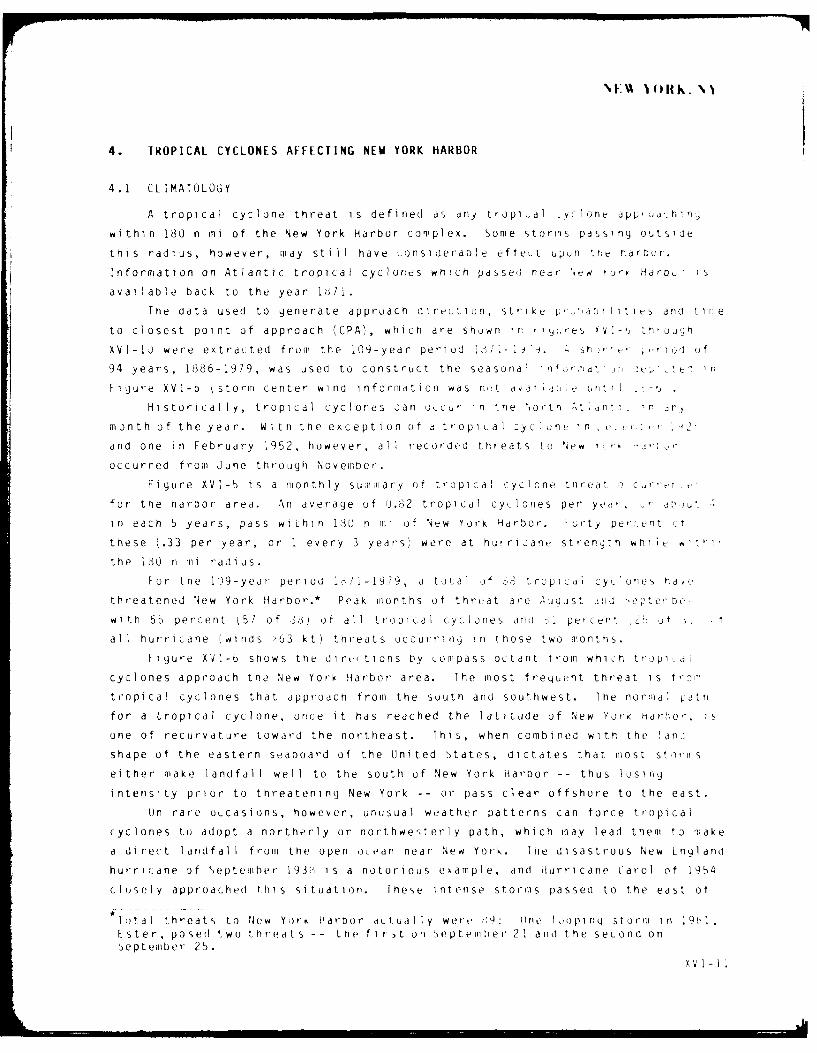
4. TROPICAL CYCLONES AFFECTING NEW YORK HARBOR
4.1 CLIMATOLOGY
A tropical cyclone threat is defined as any tropi dl _yclone app ' Anin,,
within 180 n mi of the New York Harbor complex. Some storms passing outside
this radius, however, may still have consideraole tfte, t upun "ie narbor.
Information on Atlantic tropical cyclones which passet near ',ew )rp Haro is
available back to the year 1671.
The data used to generate approach direction, strik t! p Y ac: i ei and ti1 e
to closest point of approach (CPA), which are shown ir: (,.3 e oj - t oujh
XVI-I were extracted from the 109-year period ud. 0 s ,t , ,'&o Of
94 years, 1886-1979, was used to construct the seasonal in ur;:.d , a -< Uc e' n
Figure XVI- b storm center wino informdtion was n,1t a('a i-c out, .
Historically, tropical cyclones can occur in the North nt r - -f 2
month of the year. With the exception of a tropiLal zyc cne .n e. ' 2,
and one in February 1952, however, all recorded threats to 'iew : an .
occurred from June through Novemoer.
Fi gure XV 1-5 i s a nonth ly summary of tropi ca c yc I one *treat o_c r .-
for the harbor area. An average of 0.82 tropi cal cyclones per yea,, ,
in each 5 years, pass wi Lh in 180 n m i of New york Harbor. orty pe- un t ut
these (.33 per year, or I every 3 years; were at hurricane stren th whi h 1
the i60 n :il radius.
For the 179-year period i.7l-1979 , a total of c trpalp cy lones ha,,
threatened New York Harbor.* Peak months of threat are August ;!id ,eptti' be,
witn 65 percent i5i of .33) of all tropical cyclones and -" percent , if t
all hurricane (winds >U3 kt) threats occurring rn those two months.
Figure XV -6 shows the dirtr(tions by compass octant trom whinh tropi~ i
cyclones approach the New York Harbor area. The most frequent tnreat I s t or
tropical cyclones that approach from the suutn and southwest. Ihe nor:al atn
for a tropical cyclone, once it has reached the latitude of New YorK harbor, is
one of recurvature toward the northeast. This, when combined witn the !an.:
shape of the eastern seaboard of the United States, dictates that most storms
either make landfall well to the south of New York Harbor -- thus liosilg
intensity prior to threatening New York -- or pass clear offshore to the east.
(in rare occasions, however, unusual weather patterns can force tropical
cyclones to adopt a northerly or northwe,;terly path, which may lead them to) make
a direut landfall from the open ocean near New York. lhe disastrous New Lngland
hurricane of Septeiiiber 193i-; is a notorious example, and Hurricane Carol of 1954
closely approached this situation. These intense storms passed to the east ot
lotal threats to New York Harbor actually were , dne l)opingy storm in 1 9 01
Fster, posed two threats -- the first on September 21 and the second onSeptember 25.
XV I - I i
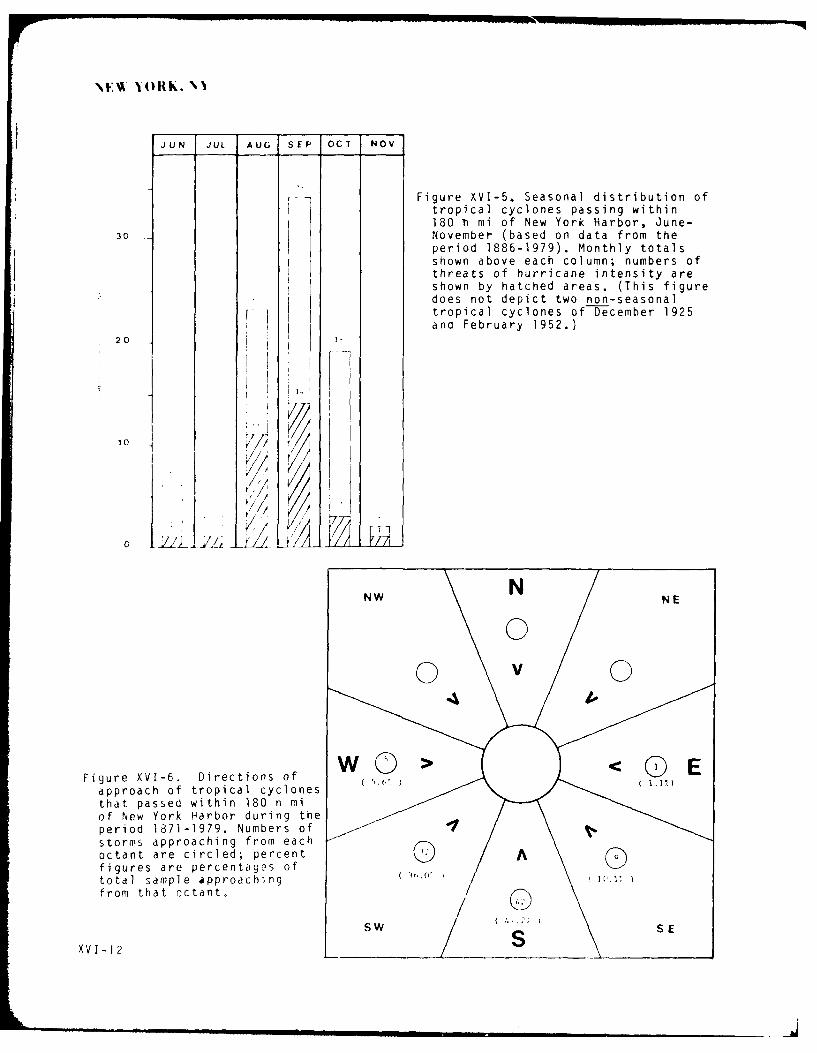
JUN JUL AUG SEP OCT NOV
Figure XVI-5. Seasonal distribution oftropical cyclones passing within180 1i mi of New York Harbor, June-
30 November (based on data from theperiod 1886-1979). Monthly totalsshown above each column; numbers ofthreats of hurricane intensity areshown by hatched areas. (This figuredoes not depict two non-seasonaltropical cyclones of December 1925and February 1952.)
20 I
IIIV,
'10
NW N NE
00 v0
Figure XVI-6. Directions of
approach of tropical cyclonesthat passed within 180 n miof New York Harbor during theperiod 1871-1979. Numbers ofstorms approaching from eachoctant are circled; percent 0figures are percentages oftotal sample approachingfrom that octant.
XVI-12 SW S E

New York Harbor, however, and thus the harbor was on the safe semicircIe (less
dangerous side) of the storm.
Perhaps the most destructive hurricane on record to affect New York Harbor
was the September 1621 storm. Reliable meteorological records are not avail-
able, but it is thought that it made its first landfall well to the South of New
York. Eyewitness e:counts and press reports indicate the storm renter passed
across extreme western Long Island with landfall near Jamaica Bay.
The September 1938 hurricane was most destructive to the south shore of
Long Island. Winds to 54 kt with gust to 70 kt were recorded at Central Park.
Storm surge raised water levels 3.4 ft above predicted tides at the Battery and
7.3 ft above predicted tides at Will ets Point.
Figures XVI-7 through XVI-10 are statistical summaries of threat probabili-
ties based on tropical cyclone tracks for the years 1371-1979.* The shapes of
the threat probability envelopes in the annual summary of 1- ore XVI-7 point out
the path of those storms that most frequently threaten tne New York Harbor area.
This path extends from the generating area in the main basin of the tropical
Atlantic north of the Greater Antilles, along the East Coast through the Cape
Hatteras area, and then parallel to the upper New England coast between Cape
Hatteras and Cape Cod. Within the 180 n mi radius of New York Harbor, the
majority of storms remain at sea and pass south-southeast of the harbor.
R ,, , ,ALL " .,4 I' A.A n acyFgre NI-; I T p iaL!t cAt alAREA THA 11 A I L 1 i T; '!N A
NEW Y('RK
A praC s I wtTh TI80 nFi (sd I PEoN rFr r bE ToCn ataA f LY19ONE
i . .. . : 0%
Trckinoaton bdionedat from National9
3V -1
*TracHainortidon datane from 1871ional
-~~~~~~~~ VII II -I13 I I l I II

Figures XVI-8 through XVI-10 indicate some seasonal variations in principal
threat directions. (Light lines show percent threat to the area encompassed by
the 180 n mi circle centered at New York Harbor. Heavy lines show approximate
:1 time to CPA.)
Speed of movement can vary widely from storm to storm. For example, the
September 1938 hurricane cut the "average" predicted climatological time in half
as it moved from a position due east of southern F lorida to the New York area inless than 30 hours. Rapid movement such as occurred with this storm not onlydecreases warning and preparation time, but increases the chances of the storm's
being more intense upon arrival as the forward movement adds to the speed of the
winds in the dangerous right semicircle of the storm.
The months of July and August are the start of the major hurricane season.
T wen ty- six of the 88 storms (about on e-thi rd) occurred during these two mnont hs.
The primary threat path is that described by Figure XVI-7, but a secondary
threat exi sts from the Guilf of Mexico area with approach from the southwestoverland through South Carolina and Virginia (Figure XVI-8). The source regionfor most of these secondary threat storms is the western Caribbean.
September has been known historically as the month of hurricanes (FigureXV 1-9). Close to 40% (34 out of 88) of the tropical stormis to affect the harbor
occurred in this month. Tropical cyclone paths to New York during Septembercontrast with July and August paths, in that they more closely follow the Gulf
Stream and fewer make landfall along the East Coast. The great majority of the
September storms (29 out of 34) remained at sea well to the southeast of NewYork. Four of these, however, crossed over the eastern portion of Long Island
and one, the 1821 storm, passed just east of the harbor. They' were some of the
most destructive storms on record at New York Harbor.
The period October through June (Figure XVI-IU) covers nine months and only
about one-third of the tropical cyclones that affected New York Harbor. The
majority of the paths have been from the Gulf of Mexico through the panhandle of
Florida, then overland paralleling the Eastern Seaboard. For the period 188b-
1979, only four off-season tropical cyclones reached New York while still
maintaining hurricane intensity at CPA during these months (3 in October, I in
November).
For all months of the 94-year period, 1886-1979, 31 tropical cyclones were
at hurricane strength (>64 kt) whil e within the 180 n mi radius of New YorkHarbor. Of these 31 hurricanes, 25 passed to the east, 3 went to the west, and
3 passed basically to the south of the harbor. Speeds of approach for typical
tropical cyclones vary from 10-15 kt while in the tropics, but up to 25-JO ktnear the New England Coast.
X VI - 14
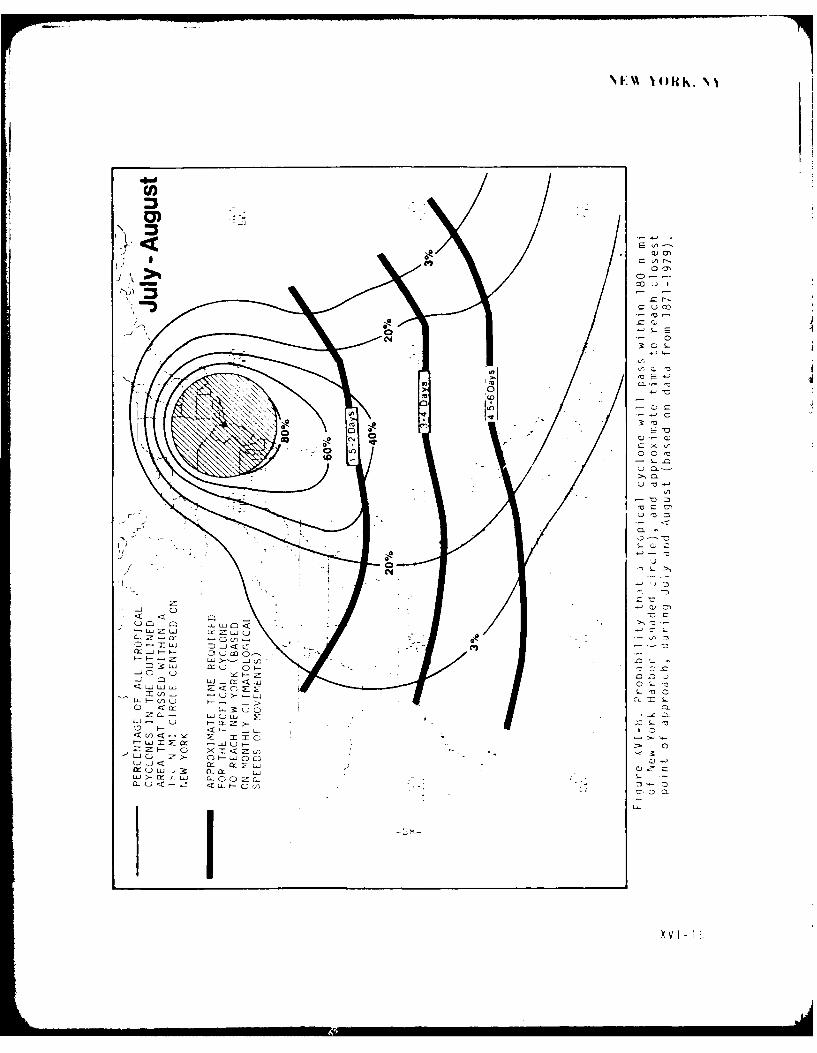
AlA
0--30
1
c3-1
71L
z~
-~j 0-
'p, - >
C'~~ -o
<0- v) < 0_
o~ w ooj c- -0
0~-<J (0
:3 -~ -
CC~~ Ii '

NEW )OIRK. NI
CCQ.
0-Z~ 01
.0 0 c
S- 0-
0 a)
-0
a-~0 Z 0
.-j -)1.
LF4-) 0)
F-~~~. F- - --T J
-1~ 0 -z-i LU-im LL,.0 (1
o~~ ~~~ < r CL: uC
W-~XL. W 0O0& 0w F- Q IXVI -16 - j

00
0 c
>, CL -
U C.)
C ~0
'o u.- -0
<~ C,
U~~j ci 7
u~ .0L'i -i a 0 . u
< -L -
0U <
L'ic 0 -
L, U
-~ C
NONE-

4.2 WINDS AND tOPOGRAPHICAL EFFLCTS
Wind records for the New York Harbor area date back to 1369 when wind and
temperature recordings were made in Central Park; accurate hurricane wind data
from this site first became available from 1693. Wind records for this study
were collected from five sites including Central Park. The sites were selected
to provide both exposed and relatively sheltered locations and to ensure a
continuous record of data over the years of interest. Some sites had broken
periods of recorded data. Locations (Figure XVI-lla) and years of coverage
were:
(1) Central Park, NY 1893-1979
(2) Sandy Hook, NJ 1914-1945, 1966-1979
(3) Floyd Bennett Field, NY 1941-1970
(4) La Guardia Field, NY 1939-1979
(5) Newark, NJ 1931-1979
Examination of the records from these sites revealed that only one storm
produced sustained hurricane force winds (>64 kt) in the New York Harbor area
from 1893 to 1979. The 14 September 1944 hurricane produced sustained winds
that were recorded at 64 kt in Central Park and 70 kt at La Guardia Field. 'he
more exposed site at Sandy Hook, NJ, recorded near hurricane velocity at 63 kt.
Other hurricanes that caused considerable damage in the harbor area were
the storms of 3 September 1821, 21 September 1938, 30 August 19b4 (Carol) and 12
September 1960 (Donna). Figure XVI-lIa illustrates the paths of these storms
through the New York Harbor area and shows the locations of the recording sites.
Table XVI-1 is a comparison of the recorded wind strengths at these sites for
the four major storms of the period 1893-1979.
Table XVI-1. Recorded wind strengths at New York for the four mostdestructive hurricanes on record (1893-1979).
Winds (Sustained/Gusts, in kt)
Storm Max FloydCPA* Wind at Central Sandy Bennett La Guardia Newark
Storm (n mi) CPA (kt) Park Hook Field Field N.J.
21 Sep 1938 110 85 54/bI 43/49 - - 42/-14 Sep 1944 60 75 64/70 63/78 50/- 70,'93 46/1430 Aug 1954 60 85 40/42 - 35/45 4b/60 3-,4,12 Sep 1960 60 90 49/53 - 34/55 55/84 33/58
CPA - Closest Point of Approach of storm center to 40.7N latitude,74.0W longitude.
Figure XVI-llb depicts the track segments of tropical cyclones that
occurred during the period 1945-79 and resulted in strong winds ()22 kt) at La
Guardia Field, NY. The dotted segments of the trdcks depict center
XVI-18

z
0 0
000
Co 0
: 0 (
L 4-
z~ >-J
0 QJ 41 )
C)) <
CY CO)
00
LOE
Q.-4-
>--
m >< 0
XVI -19

NEA YO RK. NY
LEGEND
(v 22 kt
...... gale orcng w indw
S(_v :31 kt
Figure XVI-llb. Positions of tropical cyclone centers when strong windsand gale force winds (see figure legend) occurred at La Guardia Field, NY,
(1945-79).
positions where the storm caused gale force winds at La Guardia Field. The
majority of these tropical cyclones were moving on a track from SSW to NNE
through the area. Gale force winds occurred mainly while the tropical cyclones
were southeast or southwest of the harbor. Gale force winds occurred with
centers as far as 240 n mi away.
Topographical features will dictate to a great extent the amount of wind
protection at any one particular site in the New York Harbor area. Wind
protection is also offered by the massive buildings that surround much of the
New York Harbor area. The combined effect significantly reduces the forces of
strong winds at piers or anchorages in close proximity to these features.
The Lower Bay is generally not protected from strong winds due to
surrounding flat terrain to the west and south and open water to the east.
Staten Island and western Long Island offer some protection to the north. Sandy
Hook Bay is exposed from all quadra,,ts. Rdritan Bay, in the extreme western
reaches near Perth Amboy, is somewhat protected from north-south winds but
exposed to east-west winds.
Upper Bay, though somewhat protected, has enough fetch for considerable
damage from w.ave action in strong winds, especially from a wind set from a
northwest direction that sweeps across the flat areas of Newark Airport and
Bayonne Peninsula. This was demonstrated by the 21 September 1938 storm, where
XV I-20

FIT
strong winds from the northwest battered piers, bulkheads and berthed craft
(primarily barges) along the eastern side of the harbor at the Brooklyn Bay
Ridge section.
Some caution should be used when assessing the value of particular berths
or anchorages during a hurricane threat. Some may offer good protection from
strong wind/wave action from a particular direction. However, the tight,
cyclonic circulation and storm novement typical of tropical cyclones can cause a
sharp change in wind direction and can change a protected position into an
exposed position. The predominant direction of the strongest winds assoclated
with past major storms moving through the harbor area has been from the west
through north quadrant.
The lower Hudson River is well protected by the higher terrain and
structures to the east, and the New Jersey Palisades to the west. There is a
narrow window of exposure to north-south winds. The western reaches of Long
Island Sound are generally not well protected from high winds except in some
areas of semi-enclosed bays such as Manhasset and Oyster Bays.
4.3 WAVE ACTION
Lower Bay is subject to wave action due to an open quadrant, east througrh
south, to the Atlantic. The size and depth of the bay also provide sufficient
fetch for a strong wind to generate destructive waves. Deep ocean swell
approaching from the open quadrant would be reduced by shoals at the entrance to
Lower Bay between Sandy Hook and Rockaway Point.
Upper Bay, Newark Bay, lower Hudson River and East River are subject to
limited wave action due to the small generating area affordec to the wind.
Howeier, strong winds have generated enough combined wind/wave action to cause
considerable damage in the Upper Bay (Para. 4.2).
Long Island Sound is a deep water sound with generous fetch in an east-west
direction (>100 n mi). North/south fetch is limite to about 20 n mi at the
widest point. Either is sufficient to permit substantial damage from waves in
strong winds.
4.4 STORM SURGE AND TIDES
Storm surge and astronomical tidal conditions can combine to greatly
increase the danger and damage associated with a major storm. Storm surge (an
abnormal rise ef water generated by a hurricane), when combined with a normal
local high tide, can inundate coastal areas. This combination also provides a
high water level upon which wind waves may ride to cause severe destruction to
those areas not normally subjected to wave action. Combined storm surge and
tide have produced high water levels of over 10 ft above MLW in the New York
XV I-21

toi qlk. Ni
Harbor area during major hurricanes and levels greater than 15 ft anove in
western Long Island Sound. Figure XVI-12 shows recorded huricane-1nou t!
high water marks at several sites in the New York Harbor area and western Lor-j
Island Sound for two major hurricanes that made landfal 1 in the area at or nea,
astronomical high tide.
Those recorded hurricanes that caused major damage in the New York narjo,
area passed east of the harbor (refer to Figure XVI-lia) and generated
substantial storm surge. The most significant differences among the inundations
associated with these storms were the timing of their arrivals in relation to
the local astronomical tides. The storms of 1821 and 1944 arrived at or near
low tide, and the storms of 1938, 1954 and 1960 arrived at or near high tide.
5. THE DECISION TO EVADE OR REMAIN IN PORT
Instructions to Navy ships for dealing with destructive weatner in tht ',2q
York Harbor area are found in the SOPA Manual \NAVSTA NY:ST 545W. , t -', ",
York. This document describes hurricane readiness conditions and the
appropriate actions to be taken. The Department of the Navy consi L ,rs ',t v ,
a protected harbor except in the most severe weather. 5hip safety is cc ns,:e e,:
to be imore assured at suitably protected New York Harbor Derths tan at s' .
at Long Island Sound anchorages.
It is further recommended that ships moored at their normal berths a~tr,
Hurricane Condition Two (hurricane force winds within 24 hours) has een set
should consider making thorough preparations for securing at these birtns .atn r
than ri sk being caught in strong winds during close-quarters maneuvering for
alternative berths.
The decision to evade at sea or remain in port must be baser on several
factors:
(1) Lxpected Weather Conditions
- Forecast track of the hurricane relative to the port
- Size and strength of the storm
- Speed of approach
- Forecast storm surge, tides and sea states
(2) Harbor Characteristics
- Topography of the surrounding terrain as to providing
wind/wave shelter
- Quality and locations of moorings and piers
- Anchorage holding qualities
- Currents and maneuvering room
XV[-22 - Harbor congestion
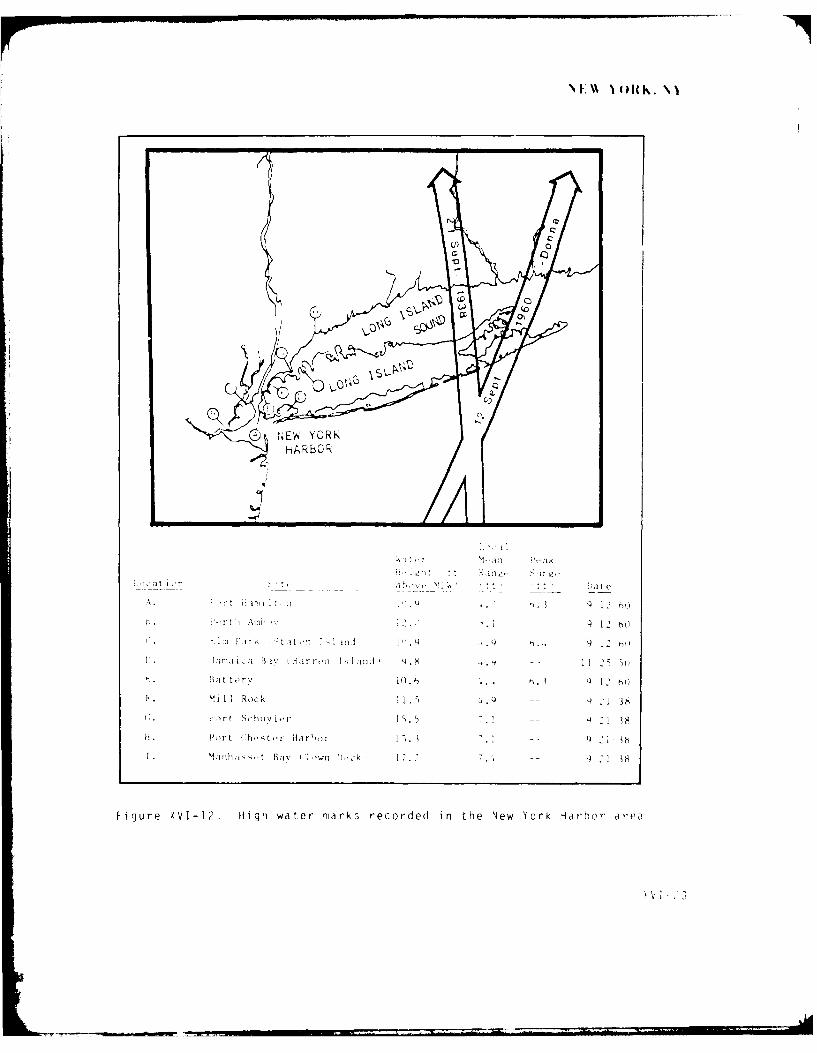
ad'C~
;, ' tIo I t e r
am2 I a 1 3a -1 11 1 I 'Ind -9* 9 1
"it t r v 10~ F, Q 2 ho)
kii I I ROCk QI.5. - 2 1 38
)~rt hliiv[il 11!- 2 1 8
I. '.rt i st - Har'),or IL1 3 1 q
I. ~ iihiii Y (u ilown :),,k 1.- -921 38
Figure XVI-12. High water marks recorded in the New York Harbor ar-ea.

ri ' s (Iharacteri stics
- pced, seaworthiness and ability to maneuver in heavy seas
-,h'p's relati e ability to withstand adverse weather ata, orh moored or docked alongside
,erd) condition of ship and crew
e i t sea in the event of a threatened hurricane strike
"j e of tne considerations discussed in this subsection.
,>, , however, that (1) New York Harbor provides a semi-
, ., ' , , with excellent berthing facilities, and ,2) that al'
: , n p safety is more assured in protected berthing within the
S pts' ' st make a decision to evade at sea or remain in New York
, n t e * 6-4 8 hours prior to destructive force winds, when
ty that the hurricane will actually strike the harbor.
)r storms approaching the New York area at Hurricane
'% niu, forecast) is greater than 3UJ n i aS shown in Figure
- . .. .- a section of this Handbook). It should also be noted
" , " , experiences one of the lowest frequencies of hurricane
, f y c rea along toe Gulf and Atlantic coasts. Further, the
-.r_ ssfui evasion at sea is decreased by the high speed of
i !a jj' storm and the uncertainty of its patn at recurvature
:e . - of tnese meteorological factors support a decision to remain in
i tne )her hand , there is no record that the New York Harbor area ever
nus facei the "worst case" in which a major hurricane makes direct lanofall just
*) the west cif tne port. Second, there are few berths with all-round protection
frjT wind and wave action. Third, New York Harbor is large and congested, and
the danyge of damage from ships or barges adrift or major debris afloat must be
considered. These three considerations warrant further discussion.
[he hurricanes that severely damaged the harbor area were discussed in
Section 4.2. Two facts are noteworthy: (I) All oF these storms passed to the
east of the harbor, placing the harbor area on the less destructive side of the
storm; and (2) Maximum sustained winds in the harbor area were at hurricane
strength for only one of the storms on record.
A storm with a speed of advance of 30 kt, which is not unusual for this
latitude, can easily have winds 50-60 kt higher in the right semi circle. Ihoul d
a hurricane with characteristics similar to those depicted in ligure XVI-ll,
take a path slightly more northwesterly -- which wou d place the New York Harbor
area in its stronq semicircle -- a disaster of major proportions would he quite
possi o Ie.
XVI-24

he surrounding topography and massIve bui Idings do offer protec ion In
Id ny J reIa S. Hecause of a hurricane's physical makeup and unpredictability.
however, iajor- shifts in wind direction can occur during ostorm passago e. :n
cder to assure good protection, a barrier would have to provide a ful
.;egrees of coverage. Any topographic feature can serve as a barrier to
Sind avoy , at a given ti m e, but it could also funnel energy if the wind sni fts
Ja d fl eW ard nt. i s could be di sastrous to a ship at incrhur, fspe li ,, te
one with Inargi nal holding or swing roo;.
"ew )r k H arbor is a mixture of older berthing areas mnany of tnc:i u nusc-
ani odern new container, petroleum, steaiiship and general ter;'na s. r; ;e
providing excellent berthing in many areas, 'New York Harbor acl w.ulo roduce
inajor deDri s duri ng a severe storm that broke up older i,-Eas it nt . e e
waterfront. The size and complexity of the harbor area alsc in ease c ts,
potential for ships or barges to break their moorings and e t
dangers to other vessels.
5.2 EVA)ION CONS[1DERATIONS
If it is decided to evade at sea, consider the fol n : Iiess y
safe transit time to open ocean, i2) )resent posi ti on )f stor , 3 tu i r s eec
of approach, and k4 ) rost likely storm path.
Given the evasion decision, it is very important to ,:os css the I th at
correctly and take quick action. Figures XV -7 through X -: :J snow ave,-dge
travel time for storms to reach the New York Harbor area. The 2 1 eptemoer De 3
storm, however, moved from a position east of Florida ,2; , 7 to the ha r or
area in 30 hours versus the 3-4 days average travel time.
Each threat must be judged on its individual merits, but historically the, e
are two threat locations for storms that ultimately pass within >30 n mi of ',ew
York. During the 3-4 days prior to passage, the threat storms ace ty pi alIIy
located (1) east of Florida and north of th - , or (2) in the G-ulf
Mexico.
(1) East of Florida/North of Bahamas
The hurricanes that approach from this area and fol low the general
contour of the East Coast pose the greatest threat to the New York Harbor area.
A storm east of 75 0 W at 30'N will pose less threat probabi ii ty than one to the
west of 75'W, because normal recurvature .,ill further reduce its chances of
hitting the New York Harbor area as it rives north.
There are meteorological indicators that forewarn of a bad storm in the New
York/New England area: a strong recurving hurricane near the East Coast; a high
pressure area or ridge in the western North Atlantic blockinq recurvature; and
an advancing trough of low pressure irl the eastern L . . Ihese special synoptic
XVI-25

fte tures promote rapid acceleration into the New England area with little
weaken 1 rig of the storm.
Sorties should be to Long Island Sound or on a southeast heading to clear
t) the southedst side of the projected track of the hurricane. The sortie also
ITI US ' e Irl ti uteu early, because the majority of the storms off the New England
o ast accei rit dlong a track in a northeasterly direction well south of (ape
SL)d.
,2) Gult of Mexico
Hurricanes that approach to within 130 n mi of the New York Harbor
area from this region generally weaken during their overland passage and are not
considered a major threat to the harbor.
5.3 EMA I IN I l1 PORT
I I ships are adIvi sedI to re'main in New York Ha,-bor in the event of a
forecast hurricane irike, assuming that adequately protected berthing is
ava lab e. f the pred i cted tnrteat is an average hurricane of moderate
strength, then "he ric.immendation is to utilize normal berths with normal
hurri aI e pre ' i s as outlined in NAVSTANY Destructive Weather Plan NAVSTANY
t e ,tt h:e is forecast as dangerous, with center winds well above
hur r _1wamme *tr-enyth -- or if the previously mentioned "meteorological indicators
tnc t f, ,ewa -r of a bad storm ... " exist as synoptic features -- then the reco i-
i:i nId tin is t.) eberth if necessary at the most protected berth available and
ro take cxtru "dirnary precautions in securing. Pier height will be a p-imnary
consideration due to loss of protection at lower piers (i.e., <10 ft above MLW'
with ,.he r m e or water, caused by possible accompanying storm surge. Evaluation
of berthing areas should also consider wind/wave protection, area congestion,
and oer strength.
5 .j.L ueneral Assessment of Berthing Facilities
(1) Lower New York Bay tincluding Sandy Hook and Raritan Bay), in general,
does not afford adequate protection for berthing during a hurri cane. With
more than I0 miles of open water in a N-S fetch and 12 miles E-W, piers and
berthed craft open to the bay could sustain substantial wind,'wave damage in a
major storm. Floyd Bennett Field Wharf, even though in an enclosed !aoy, is
exposed to high winds from all quadrants due to surrounding low terrain.
(2) tJpper New York Bay, Newark Bay ani the lower Hudson River provide
dreas which, depending upon location, ofter parI ly protected anchorages and
berthing. Due to the small number of ij.S). Navy ships that are in the New York
Harbor area at any onre ,.ri e and the !,atrjo, number of berths available, adequate
berthrng avalI ah ni I t s not n l, , .0 . ,'. .
XVI -26

The Military Ocean Terminal's (Bayonne, NJ) northside berths are
considered adequate except for the most severe storms. The south and east side
berths are more exposed. The Coast Guard piers on the east side of Governors
Island are protected except for southwest wind/wave fetch. The Passenger Ship
Terminal berths on the east side of the Hudson River are well protected except
for direct north-south winds. Piers I through 12 of the Brooklyn-Port Authority
Marine Terminal are all considered adequate except for the most severe
conditions.
Columbia Street Marine Terminal affords good protection in Gowanus Bay.
Elizabeth and Port Newark are good storm berthing areas, but are somewhat
exposed to strong east/west winds with Newark Airport to the west and the Newark
Bay to the east. Howland Hook is protected by Staten Island to the east and
Elizabeth to the west. (Access to these last three berths in Newark Bay is more
difficult.)
(3) The East River and western Long Island Sound offer fewer adequate
berths. The former New York Naval Shipyard offers excellent protection in
Wallabout Basin on the East River. South Side Seaport Museum piers are somewhat
protected, but are not recommended due to the presence of permanently moored
vessels. Fort Schuyler, located on Throgs Neck, is not recommended during
severe storms because of possible high surge (5.5 ft over current dock heights
during the September 21, 1938 hurricane) and lack of protection from high winds.
Specific berths are evaluated in the following subparagraphs 5.3.2-14:
5.3.2 Leonardo Piers, Naval Weapons Station, Earle, New Jerse1
The Leonardo Piers are not recommended due to their exposed position.
5.3.3 Floyd Bennett Field Wharf
Floyd Bennett Field Wharf is not recommended due to the exposed positlon of
the pier and the difficulty of access. Coast Pilot 2 lists four sunken wrecks
near Rockaway Inlet entrance or in the inlet itself. The inlet is also
obstructed by a shifting sandbar.
5.3.4 Military Ocean Terminal, Bayonne Annex
Military Ocean Terminal, located on the western side of Upper iiay, is welI
protected from ocean swell and wind waves, but is somewhat exposed to winds frum
all except the southern quadrant. The low, flat nature of the Bayonne Penins a
and Newark Airport to the west offer I ittL;e wind protection from tne west.
Staten Island to the south offers protection from that southerly direction. The
piers are two feet above the highest recorded surge in the area (I1 ft above MW
at Caven Point, 12 September 1960).
V -21
5.3.5 U.S. Coast Guard Piers, Governors Island
The Coast Guard Piers are fairly well protected from both wind and seas
except from a northeast or southwest direction. These piers are subject to
being awash in extremely high surge because of their low deck heights. Currents
in Buttermilk Channel and the probability of debris in the channel during heavy
weather must considered. These piers are not recommended for visiting Navy
ships during storms due to the nature and requirements of the Coast Guard's
mission.
5.3.6 Passenger Ship Terminal
The Passenger Ship Terminal berths are highly recommended as storm berths.
They are well protected from strong east-west winds, although somewhat exposed
to direct north-south winds. The N-S winds may be intensified by channeling
along the Hudson River. There is good depth alongside, but deck heights could
be awash in severe storms due to storm surge. These berths are normally used
for mooring cruise vessels during the season, and availability would be
controlled by the City of New York.
5.3.7 Brooklyn - Port Authority Marine Terminal, Piers 1-12
Piers I through 12 are marginally recommended for storm mooring. Wind and
wave protection are fair to good. The inside pier berth (i.e., in Atlantic
Basin, at Pier 12 is the most protected berth. Outside berths facing Buttermilk
Channel and the East River are subject to damage from floating debris. The
Brooklyn side at the East River entrance, despite its appearance as being fairly
well protected by lower Manhattan, was subject to heavy wind/wave battering by
NW winds in the Septemuer 21, 1938 hurricane. These piers are controlled by the
Port Authority.
5.3.8 Columbia Street Marine Terminal
The Cojmb ia Street pier appears to be an excellent storm berth. Located
on the ejst side of the Upper Bay in Gowanus Bay, the berths are easily
accessiole and hae good protection from wave action. Wind protection is
provmdt',I by surrounding structures and terrain. The piers are large and deep
berthed, but at 10 ft dbove MLW, could be awash in severe storm surge. They are
controlled by the Port Authority of New York/New Jersey.
.J.9 Pert Llzabeth andPort Newark
Ports L i izabetri tnd Newark are col ocated in Newark Bay and are sl ;I I ar in
size and function. Pth it e large, modern term'nals handI ing pi marl 1y general
and container Iar..o. Ihe terminals are sont'whdt exposed to hjh winds due to
the generally su? roun 1,4I flat t,-ri n : ,wwa k Arpurt to the west and Newark
Bay to the .ast htinv,, Lr, Lti1lon ,t, tih, wharves offfers smIne N--' wi nd
XV 1 -281
protection. Fetch across Newark Bay is limited, so wind/waves buildup is
restricted. Although the berths should provide good storm berths, they are nut
recommended as primary choices due to heavy commercial traffic and the difficult
access route to reach them. Port Elizabeth is controlled by the Port Authority
of New York/New Jersey and Port Newark is controlled by the City of Newark.
5.3.10 Howland Hook Container Terminal
Howland Hook on the northwest side of Staten Island at the northern
terminus of Arthur Kill is a modern wharf. It is somewhat well protected except
from a north to northwest wind. With only 7 ft of deck height above MLW, the
wharf is subject to severe inundation during major storm surge; Hurricane Donna
caused 11 ft surge in the area. The terminal handles heavy commercial traffic,
has difficult access, and is not recommended for storm berthing.
5.3.11 Former New York Naval Shipyard
Located 1.7 miles up the East River from Upper Bay in Wallabout Basin,
these three piers are well protected from both wind and wave action. However,
access to the piers may be a problem due to harbor congestion an(I the tricky
currents in the East River (see Coast Pilot 2). Late arrival after winds and
seas have picked up will increase navigation problems. These piers provide good
storm berthing with possible inundation during heavy storm surge. The City of
New York and the U.S. Navy own these piers.
5.3.12 South Street Seaport Museum
The South Street Seaport Museum is not recommended for storm berthing.
Pier 16 normally has three pe.rmanently moored vessels on exhibition and Pier 15
berths two barges. Strong East River currents, heavy local traffic congestion
and the possibility of one of the permanently moored vessels or barges breaking
moorings during heavy weather make this a questionable berth during a storm.
5.3.13 Fort Schuyler
Fort Schuyler, at the extreme western end of Long Island Sound, is located
on a slender, low, flat peninsula beneath the Throgs Neck Bridge. Although the
pier deck height is 10 ft above MLW, heavy storm surge such as was recorded with
the 21 September 1938 hurricane would place the piers approximately 5 ft
underwater. This, plus exposure to winds from all quadrants, make the piers
poor hurricane berths. They are not recommended.
5.3.14 Use of Anchorages
Lower Bay is a large, exposed expanse of water. It is not recommended as
an anchorage for any wind conditions above gale force. Gravesend bay (Anchorage
No. 25) with a sand bottom is considered a good anchorage with sufficient
holding for most classes of naval ships up to gale force winds. Anchorage 44,
XV I-29

off Perth Amboy at the western extremity of Raritan Bay and witn 31 ft depth,could handle two ships of destroyer size, but is exposed to east winds. Thenorthern part of anchor-age 49F bet ween the northern ti p of Sandy Hook and the
Earle piers provides good holding, but is reserved for ships with explosives.There are several other anchorages in Sandy Hook and Raritan Bay, but due to theexposed conditions and questionable holding they are not recommended.
Upper Bay contains deep-water anchorages off Bay Ridge (Anchorage No.
21A, B and C) and Stapleton (Anchorages No. 23A, B and 24). Bay Ridge
Anchorages 21B and 21C are not good holding anchorages in strong west to
northwest winds. 21A is a shal low-water anchorage used primari ly for barges.Stapleton Anchorages are good, natural, deep-water anchorages with good wind
protection provided by Staten Island to the west and good holding.
Anchorage No. 19 on the east side of the Hudson River between 80tn and
137th Streets in Manhattan is well protected from east-west winds. Due to
limited holding capability of the bottom, however, ships displacing more than
34,000 tons should not use this anchorage.
There are no general anchorage areas at the western end of Long I sl andSound. General anchorage i s afforded in the sound westward of Norwal k Islandstoward the north shore with good holding in northern winds. There is anchorage
for large vessel s in the bight outside Bridgeport Harbor Light with someprotection from northerly .winds, but neither i s recommended as hurricaneanchorages.
5.4 RETURNING TO HARBOR
Returning to the harbor after successful evasion at sea can present many
hazards if the storm struck the harbor area with any intensity. There is the
possibility of wrecks in the navigation channels, large floating debri s, damageto piers and general after-storm harbor congestion. Pier damage and/or storm
surge may have disrupted alongside services. There is also the possibility that
channel markers and other navigation aids may have shifted position or otherwisebecome unreliable.
X V I1-3 0

NEW I'A)RK, NY
5.5 ADVICE FOR SMALL CRAFT
Small craft should be removed from the water and tightly secured well above
possi bl e storm surge levels. Best protection is inside some type of storage
building to prevent possible damage by flying objects or to prevent the
possibility of broken tie-downs in high winds. Local knowledge is the best
guide to weathering a storm in local harbors; the New York Harbor complex has
many small harbors, coves, inlets, etc., which might provide protection in heavyweather. Look for good wind protection, and be aware of the local storm surgewater heights in allowing enough mooring-l ine slack. Exceptional anchor weight
should be used to prevent dragging in high winds; small craft that have broken
their lines or are dragging anchor can pose a danger to other moored craft.
XV i-3

REFERENCES
Department of the Navy, Naval Station New York, Senior Officer Present Afloat(SOPA) Manual, NAVSTA NYINST 5450.1C.
Defense Mapping Agency Hydrographic/Topographic Center; Fleet Guide New York,Pub. 940, Chap. 3, Eighth Ed., 1979.
Harris, D. L., 1963: Characteristics of the Hurricane Storm Surge; U.S. Dept.of Commerce, Technical Paper No. 48, Washington, DC.
Ludlum, D. M., 1963: Early American Hurricanes 1492-1870; Lancaster Press,Inc., 1963.
Neumann, C. J., G. Cry, E. Caso and B. Jarvinan, 1978: Tropical Cyclones of theNorth Atlantic Ocean, 1871-1977; National Climatic Center, Asheville, NC,in cooperation with the National Hurricane Center, Coral Gables, FL.
Simpson, R. H. and M. B. Lawrence, 1971: Atlantic hurricane frequencies, Tech.Memo NWS-SR-58, Dept. of Commerce (NOSS) 1971.
U.S. Army Corps of Engineers, 1978: The Port of New York, NY and NJ, (PortSeries No. 5); Revised 1978; U.S. Government Printing Office, Wash., DC.
XVI-32

r
cc
-c=1~
Cm-u=
-c

XVII: CONTENTS
1. Geographic Location and Topography XVII-I
2. Harbor Facilities XVII-5
3. Heavy Weather Plans . XVII-8
4. Tropical Cyclones Affecting Philadelphia . XVII-1O
5. The Decision to Evade or Remain in Port . XVII-19
References . XVII-21
i'
..- ,..-" ,2 r ,

XVii. PHILA)ELPIIIA. PENNYLVANI
SUMMARY
This study concludes that the Philadelphia harbor isa haven from hurricanes. Philadelpnia's distance from theopen ocean via both the most direct overland route and alongthe Delaware Bay/River estuary provides protection or theharbor from both wind and storm surge extremes. Localflooding can occur, however, as a result of the combinedeffects of heavy precipitation and runoff, tidal action, andthe piling up of water in the Delaware Bay/River understrong southerly winds.
It is reccmmended that U.S. Navy vessels, with theexceptiun of those at the Navy Yard finger piers, remain attheir regular bertns and take prescribed measures to ensureprotectio of life and property. Ships at tie finger piersthat can be moved should be reberthed in the Reserve Bas q.
There are no hurricane anchorages in the DelawareRiver, whose bottom is soft mud. However, anchorages in thelower Delaware Bay have been used by as many as 20-30 shipsduring a period of hurricane force winds.
1. GEOGRAPHIC LOCATION AND TOPOGRAPHY
The port of Philadelphia is located on the Delaware Rlvr apprivt lt
45 n mi above the Delaware Bay and 87 n ni frri the Atla 'tic rein. D i stincSare measured along the 40 ft deep federal project channel, which extenes frorthe ocean along the main channel in Delaware Bay and River to the Philalelphia
Naval Shipyard at mile 81. The channel continues upriver to the Trenton Mar in
Terminal (mile 115), with a minimum depth of 25 ft.
The Delaware River flows into Delaware Bay at a point arbitrarily Jefined
by the legislatures of Delaware and New Jersey as a line between Liston Point,
Delaware, and Hope Creek, New Jersey (see Figure XVII-1). From the mouth of
the river, Delaware Bay extends southeastward approximately 42 n mi to the
Delaware Capes and the Atlantic Ocean. The Naval Base ind the Philadelphia Naval
Shipyard are at the junction of the Delaware and Schuylkill Rivers approximately
6 n mi southwest of the center point of the port of Philadelphia and SI n mi
(along the main channel) from the Atlantic Ocean. Figure XVII-? shows the areaof Philadelphia, the Delaware and Schuylkill r'ivers and the Naval activities.
This hurricane havern evaluation was prepared byR. E. Enqlebretson and J. D. Jarrell of ScienceApplications, Inc. (SAI), Monterey, CA 93940.
Change I XVIl I

PENNS'. LVANIA
Trenton
Cn , m oQ
Fort Miltlin 4Gloucester City
Na.ei ShipyardCommiodore MI 1,John Bary
Bridge in, 71'
WilmingtonDeiaware Mernorial NEW JERSEYBridge .M,60)
DELAWARE
Atlantic Ocean5 0 5 1l1 15 20 25
Nau~icaI Miles
5'30' 15' 7430' 74
Figure XVII-l. Locations of Philadelphia, the Delaware River, and Delaware Bay.
XVI 1-2

I'IIIIA I II' 1A. I .A
Philadelphia
us~
Figure XVIL-2. The UoS. Naval Base/Naval Shipyard, Phtiadelphia, at
the confluence of the Schuylkill ind Delaware Rivers
~I j
ME

1I If I LA 1) IE 1,i I'lII I A. I':
The entrance to Delaware Bay from the Atlantic Ocean is from the southwest.
The entrance is about 10 n mi wide; Cape May, an extensive peninsula, is Cr the
northeast side and Cape Ken1open is on the southwest side. Extensive shoals
exist in the Bay entrance, particularly in the northern and central port-ons.
The entrance channel for deep draft vessels is near Jdpe Henlopen. nle .p
graphy of the surrounding land area is very flat with few points a ove 0.'; tt.
The iiajori ty of New Jersey east of the Delawdre ;ay and ki ver i s tss than 4 ft
above MSL.
The Delaware River extends nurthward fr:i tre Deao e :ay anc trer north-
eastward to the Phiiladelphia area. .n tne ,<11ate vicinity of the
Ph iadelpnia oIaval base, the rI er charn el Is or en ', east- est.
The extensive shoal iny of Delaware Day greatly Ca 'e s any wIves , stcr-
surge generated Dy the open ocean. The di starce i ' an t i , .e , ' 1
tne naturi barrier provided by the co,itl 1 nentd c dSt lflh , ot ' n '. i it 00
all coiiblne to Ii it the tnret of h , re fr,> e ' ,- r', -c
a rea .
SI L o I nq s tie i:i Or 0j o p r e) D i e I at ed t r p
Pr ladel phia area. The f]at topography of the regio r s,
river bed, whICn ; 'oces d tioal raIge of nearly D ft i UI t I,
harror. Tidal act io , storm surge and run-off dun rn, s t r
p , Le threateni ng i I 1 eve s.
,hi open ocean opproocnes to Delaware Cay nave few o, ,s,, .
12214 ape May to FenwIck Isla nd * The 2i fathoiai curve s ' k s
otfsnore. Leptns 'ns I o e the 21) fatnoil curve are I " Ie L, IaC , " , n 7 0 e t, -
draft vessels should e sure of their position betore a)pp ',- , T o r tr an
deptns of 12 fatious.
Delaware :Sdy has many snoals as shallow as 6 ft Cha rt I - e 1 wa,c, " aY
and there are extensive shoal areas close to the wai n cnannel. The Day hs
natural depths -f 50 ft or more for about u n mi above the entrance, and t en a
federal project channel depth of 40 ft to beyond the naval faci t ies at
Philadelphia. The naval facilities are located at the j ncti o of the
Jchuy ki I and Delaware Rivers (Chart 12313 Delaware River, Phi ade phia and
Camden . There are naval anchorages in Delaware Bay and the e I are vn as
well as at the Philadelphia naval facilities. 1)etails are gi en on thtn
fol lowing charts:
(L) hart 12313 Delaware River, Philadelphia and Jamoen
(2) (hart 12312 Delaware River, Wilmington to Philadelnhia
3) ihart 12311 Del aware River, Siiyrna River to Wi m1 n otor
4) Chart 12304 Ielaware Ray
(b) (chart 12214 Cape May to Fenwick Island
(.oast Pilot 3.
LI

2. HARBOR FACILITIES
P h lac phia i s a iajur . . a rt comprising the navigable waters of the
vyeaware and )chuykil 1 i vers. on the Del aware Ri ver the muni ci pal 1 i w ts
e tt!nd fru i ort Miff Ii n on the soutn to Poquessing Creek on the north, a
isltrce of about 20 n mi. The port hand les large quantities of general cargo
if Dutn t irceign and domestic trade.
A *eoeral project channel 40 ft deep is the Tiamn channel from the sea
through Delaware Bay and River to the Philadelphia Naval Shipyard at Mile 81.
The channel continues, with a minimum depth of 37 ft, op the Delaware Ri ver to
the lj. . Steel nasin opposite Newbold Island at Mile 10. Dredging depths to
2c ft continue ipriver to the Trenton Marine Terminal at Milt 115.
There are two fi xed bridges over the Delaware River below the Na a1
Shipyard. The 1)elaware Memorial Bridge at Mile 60 has twin suspension spans
over the main channel with a clearance of 188 ft for the middle 800 ft. The
m ii modore John Barry Bridge at Mile 71 has a clearance of 161 ft for a 1600 ft
width over the main channel.
Phi ladelphia has more than 45 deep-water piers and wharves along its
Delaware ano 3chuylkIll River waterfronts. Most of the Schuylkill River facili-
ties a-e used to handle bulk petroleum pr-oducts. The general cargo piers and
wharves are mostly 3-8 n mi beyond the Naval chipyard on tne Delaware River.
The ,as GD ard Captain of the Port Station is located at Gloucester, New
Jersey; the M rine Inspection Office, Coast 6 rd, is in the Custom House,
Pni ladelphia.
2.1 NAVAL FACILITIES
The major Naval activities in the Philadelphia area are Naval Base,
Philadelphia, and the Philadelphia Naval Shipyard. The Commander, Naval Base
Philadelphia (COMNAVBASEPHILA), has been designated SOPA (ADMIN), Philadelphia.
The Port Services Officer under the Comiiander, Philadelphia Naval Shipyard
(COMPHILANAVSHIPYD), is responsible for ensuring that all appropriate port
services are rendered to-ships under naval control in the Philadelphia area;
this includes assignment of berths and anchorages, and use of piers. Assignment
of shipyard berthing is made by the Naval Shipyard Berthing Officer.
2.2 NAVAL BERTHS AND ANCHORAGES
Figure XVI1-3 shows the piers and wharves of the Philadelphia Naval
Shipyard. Table XVIL-1 provides lengths and least depth alongside information.
XVI 1 -5

PHILADELPWA
NN %~ ,- hr
W af
,Figure XVII-3. NavalS piers and wharves
at the Naval Sh ip -7' yard, Philadelphia,.
S Naval SvPryar*
S00 C 500 1000 1500/
Ple FFeteFtaetW
1~ ~ 39 E1 18.
Table~ie (Feet). P(er aocte atM39W2.
within~ th8eev ai. Se 690 E . 30 .0above~~~~~ fgr fo loain.___W. 30 .0
1, 4A A,0 B, C 0, ,N. 25.0
2ab, 5£,-1 6;4'Piers 2Wte 4, 4W.A Co 3ase0 25.0
et o f atadamag ie o cen er. B Colase E. 21.0Pier A hrogh Fare loctedW. 21.0
Crde Collapse arC0-irs6 2. 21.0
_____W __ _ _ _ _. 21 .0
0 Collapsed E. 21.0
XVII -6 L 720 L. 19.0
F600 25 .0

I'll I LA I)F:IIII I % . I'.%
Tidal conditions require that ships entering the Naval Shipyard for
berthing arrive at assigned times. Destroyers or smaller ships are not
restricted by tidal conditions in berthing at the shipyard. Berthing of naval
auxiliaries and large-type ships is restricted to the following:
(1) Piers 2E, 4E, 5E, and 6E: 1/2 hour after flood tide begins,
(2) Piers 2W, 4W, and 5W: 1/2 hour after ebb tide begins, and
k3) Pier 6W: berth only on slack or ebb tide.
Visiting Navy ships normally use Penn's Terminal which is about 6 miles
above the Shipyard on the left bank. Those ships that cannot pass under the
Walt Whitman Bridge (150 ft vertical clearance) use the Parker Avenue Terminal
about 3 miles above the Shipyard. (Terminals are not shown in Figure XV I-3.)
2.3 TUG AVAILABILITY AND PILOTAGE
Tugs are available for all Navy ships of destroyer-escort size and larger,
berthing at the Naval Base. Ships smaller than destroyer-escorts may request
tug services at their option.
A large fleet of commerrial tugs up to 20.) hp is available at
Phi lade 1 phi a. In general, however, most vessels rake the run from the sea to
Philadelphia under their own power.
Pilots are not compulsory for U.S. Navy ships, but are reconiiwended. except
in cases where the commanding officer i s fami I liar with the river, current
hazards, and instructions. Docking and Naval Shipyard pilots are available and
shojld be used for all ship movements at the shipyard.
Pi lotage on Delaware Bay and Del aware River is compul sory for all foreign
vessel s and U.S. vessels under register in the foreign trade. Pi I otage i s
optional for U.S. vessels in the c'oastwise trade that have on board a pilot
licensed by the Federal Government for their waters. Pilot services are
available 24 nours i day. Pilots board incoming vessels from the pilot boat in
the pilot cruising area off Cape Henlopen.
2.4 NORMAL TIDE AND WEATHER CONDITIONS
A factor of 4 hours 45 minutes standard time, or 5 hours, 45 minutes day-
light saving time, applied to the slack water time at the entrance to Delaware
Bay, 'ives the local time of the momentary slack water in the channel off theshipyard. Maximum current velocities averaging 2.2 kt can be experienced off
the shipyard. The mean range of tide is 5.9 ft at Philadelphia.
the proximity of Delaware Bay moderates the Philadelphia area winter
temperaLures. Long periods of cold weather are rare, with below zero
(Fdhrenhei t) readings occurring only every few years. Due to the maritime air,
humility is high ;n the summer and fog can he expected in fal I and winter.
XVII -7

1~ -1
I Dl II, 1 IFI,'I I .A PA.
Prevailing wind directions are from the southwest in summer and from the
northwest in winter. Destructive force winds are quite rare. The strongest
summer winds occur mostly as gusts during thunderstorms. In winter the highest
winds occur following the passage of cold fronts and/or low-pressure systems.
Rarely have hurricanes caused widespread damage, then primarily through
flooding. Flood stages in the Delaware River are caused by abnormally high
tides due to the water "backing up" under the influence of strong south or
southeast winds.
3. HEAVY WEATHER PLANS
Information regarding hurricanes and destructive storms is received by
COMNAVBASEPHILA and is relayed to SOPA who in turn will relay to all ships.
Ships in the area, unless otherwise directed by competent authority, will ride
out storms and disturbances at their regular berths.
Appropriate measures should be taken to protect life and property. Advance
preparations should include:
I) All ships, if possible, make preparations for getting underway.
(2) Put out additional mooring lines or wires and chains as necessary, and
even up strain on all lines.
(3) Set required material conditions and secure all loose year, canvas,
rigging, etc.
(4) In the case of a local disaster, ships present at the Naval Shipyard
will take actions in accordance with the Naval Base, Philadelphia Disaster
Control Plan 3.
The National Weather Services VHF-FM radio stations provide mariners with
continuous FM broadcasts of weather warnings, forecasts, radar reports and
selected weather observations. VHF-FM radio stations with reception ranges of
up to 40 miles that provide broadcasts for the Philadelphia-Delaware Bay
area are KIH-28 Philadelphia, PA, 162.475 MHz; and KHB-38, Atlantic City, NJ,
162.40 MHz. Additional information on Coast Guard, commercial and National
Weather Service weather broadcasts is in the Appendix of Coast Pilot 3 and in
the NOAA publication "Worldwide Marine Weather B~oadcasts."
3.1 TUG AVAILABILITY
The Phi ladelphia Naval Shipyard has two 500 hp docking tu s avai lable for
use in the shipydrd. The Navy contracts with commercial companies for all other
tug support. There are 25 to 30 tugs up to a size of 2200 hp jvailable in thu
port. While tu availability is idequate, it should he noted thdt there arc, no
dedicated coitmrci al tu s for Na vy Shin ps.
XV I 1 -8
.Ai

r
Arriving ships may confirm availability of tugs by contacting "Lowmand
Control," Philadelphia, on 2716 kHz or VHF channel 13 (156.65 MHz) or channr i 2
(]57.1b MHz) about one hour prior to arrival. Commercial tugs for towing or
docking on the Delaware River are usually engaged at Wilmington or Pni ', e p,i d.
3.2 HURRICANE BERTHING
Berths in the Reserve Basin are the most protected sites withi n tnr ',-I.'f
Shipyard and are considered suitable hurricane berths. The bhipyat, fin1 e,
piers and the dry docks along the north bank of the Delaware R i e, are, subject
to flooding, and are not considered suitable as hurricane berths. ')hip . iovem,_cnt
from these finger piers can close the river channel for one to two hours. otn
terminals normally used by visiting Navy vessels, Penn and Parker Avenue,
provide suitable berthing during high winds as long as proper procedures are
fol lowed.
In general, all substantial piers and wharves in the Philaoelphia harbor
are considered adequate for berthing during tropical cyclone passaje as lon, J
appropriate high wind/high water precautionary action is taken.
3.3 HURRICANE ANCHORAGES
There are no anchorages in the Philadelphia region of the Delaware River
that have adequate holding for use in hurricane winds. It i s not uncommon fur
merchant ships to drag anchor and run aground on the mud shoals during 5 k
winds in winter. The lower Delaware Bay however, offers anchorage areas njit-
able for use during high winds. Experienced pilots indicate they nave on
occasion observed 20 to 30 ships at anchor in the lower Bay during occurrene f
hurricane force winds. (See chart 12304 for anchorage details.)
3.4 HURRICANE PLANS AND PREPARATION
The Commanding Officer of the Coast Guard Station, as 2 aptain of the Port,
is responsible for the safety of all vessels and waterfront fac li t cs e, ept
Navy vessels and facilities. The NAVBASEPHILA Heavy Weather I rstructon ai4
PHILANAVSHIPYD Destructive Weather Plan provide direction avd gu arine fo- Navy
units in the Port of Philadelphia during tropical cyclone evfnnts.
The Delaware River Ports' Council for Liergency Operations, turfited in 1i ,
is d somewhat unique organization. It p )vides a structure unoer which the
resources of state and local governments and the milItdry coifmaidFS of the area
can be directed as a coordinated response to eTiit'rgen.y situij . in,. Lont1nuing
liaison among the various civilian and military antivities is mainta ined. The
Council's area of responsibility extends along the Delaware River froit Trent)r1,
NJ, to the Atlantic Ocean (apes if Delaware lay. 'his )rganiz vtion will
coordinate with Coast Guard and Navy responses during emergency sltuations.
KV I I -9
4. TROPICAL CYCLONES AFFECTING PHILADELPHIA.
4.1 INTRODUCTION
Philadelphia, being north of the climatological zone of tropical cyclone
activity and located more than 50 n mi from the open ocean, rarely experiences
the full threat of hurrlcane damaqe. Geographically the station is just upriver
from the inland end of a converging estuary (Delaware Bay). Flooding is the
major concern due to the combined effects of run-off in the river and storm
surge from the Delaware Bay.
The shape of the Eastern Seaboard provides to some degree a natu, al barrier
for areas north of Hatteras against northeastward-moving, recurving tropical
cyclones. Under certain synoptic patterns, however, tropical cyclones do not
complete their recurvature and instead move rapidly northward. When such storms
pass over lard close to the west of Phladelphia, the port experiences the
greatest threat f flooding.
4.2 CLIMATOLOGY
For the purposes of this study, any tropical cyclone approaching witi n
180 n mi of Philadelphia is considered a threat. A tropical cyclone is
classif ied as a nurricane. if it was of hurricane intensity (winds--64 kt) at any
time durinq its passage within 180 n mi of the port of study. It is recognized
that a few tropical cyclones that did not approach within 180 n mi may have
affected Philadelphia in some way, so to some extent this criterion is
arb i trary.
The tropical ryclone season for the U.S. East Coast extends from May to
November. Thogh tropical cyclones have occurred in the North Atlantic during
all months of the year, all but two tropical cyclones that threatened
Philadelphia occurred from June through November. One tropical cyclone occurred
in each of the months of February and December. Figure XVII-4 is a monthly
simmary of tropical cyclone occurrences for the Philadelphia area. Of the 76
tropical cyclone threats that occurred in the 94-year period of record 1886-
1979, 63 (83%) occurred in the months of August through October with the peak
threat in August and September. Tropical cycl..nes tha' were of hurricane
intensity at any time during passage with in 1 0 n mi of Phi ladolphia ilso ,how a
marked peak occurrence duriig August and September with ?6 out of 36 (i/%)
occLrrring dur irg thos': months.
F igure XVII-5 c"'play/s the tropicil clone, as a funci,.mr of the co ipa ,
octant from which thy ipproached Phi adelphi i; '. i, ,vident that the major
threat is from Lh, Su!th and sOtnwt-,st.. An avt.i aqr t ! 0., tropicatl cyclones pet
year (or 4 in 5 y ir piss within 10 n ii uf Philadelphia, whil, an averaqt of
0.38 per year o' .t~t I evit y tnir A y-ir, it- it tirr-i ane irti s itv yat ,omeP
point during tho.ir passaqf.
XVl I-10

I'll IA IJ LI I It . I'i
35 Feb Mar Apr May Jun Jul Aug Sep Oct Nov
30 , Figure XVII-4. Seasonal distribiti r,27 of tropical cyclones passing witnif
180 n mi of Philadelphia, Fehruary-November (based on data from the
25 -. +- . -- ,-- period 1886-1979). Monthly totaol23 shown above tdcn column; numbe!,
of threats of hurricane intentitvare shown by hatched areas.
2 0 . . . . . .. ,
' I
15 4- - --
13 13 13
10 . .. . -
7 6
5
0
N W NNE
W EFigure XVII-5, Directions of
approach of tropical cyclones
that passed within 180 n 111iof Philadelphia durinfg theperiod 1871-1979. Numbers ofstorms approaching from each 3octant are ,i ri led; u rcentfigures are percentdjes oftotal sample pproiIh 1lFfro v, that octatn'
SW SE
SXVI I-l1
E*1 1 IlF~.lIlll I . Ilk\
Philadelphia (near 40'N) is located north of the typledl reCurvature loti-
tudes i25-.50 N) of most Atlantic tropical cyclones. The Last Oast provides
naturdl protection ; fnatdr as nearly all recurviny storms apprudching from tile
Atlantic either make landfall south of Hatteras of else pass the Pniladdelphia
area oft shore to the soutneast.
bol'w storms occasiunal ly do not complete tne recrWd turt dId are d C I-
rdted northward, a o)vement that typically occurs when an upper level trough iS
located o ver tue eastern bnited States. CliIatol gIcaly, tn I cILr uldtlon
pattern is iore likely to develop during the fall season; therefore, the fast-
northwar -uov nri, storm I s most likely in the latter part of the hujrricane
sedSOn1. ;rptember offers the greatest potential for s,,c' a ,tor" tc r) -dten
,ta d AC , , t tree factors:
i ri'opilal - clcne activity is greatest.
2) , t i u L idn1,lc subtropical high pressure systems are strong.
, An o,:, u a deep iiid-Iatitude trough is located over t d T
Lu r1r 3 t is fll -1rid S t I!I, per rod.
luese t l ) - ,in - ;i o i u to modify the normal -'curvature of d tropIcal
.yc oni o wl str -, I'. ,apIoly northward into the Philadelphia area. 'Cucn fast-
1 r lr, .t ,ii, 'I: o Is e s s of the 1 r energy as they pass rapi oly over the
I ,I, W j CIt !1 fiji -rrth wal I Iof the ul f St rearm , and the coastal dreJs.
he r',, I ii t t i l-latitude trough provides tht, at iuospheric con o I It -
1) 1'1 i t.. iri'l rl 1 the tropicul c ycIone to an/ extratropicaI storI.
]i1<] '," t ri 1 ) ut I . i V . rl it eense, fdst-molov I n , -lli-it1tud e St, o i t, eueiit Y
' v -- i , ;) ',
e r4 itI, 0 r.50' 'ii e prj, s over or lust to the west .f Phi la(deI ph 1 , the st,rl ,4
1'). qlr-,, ; ) ow )t, Dne d (elawarea Bay can creat a d storil surge. ItorIIS ,lSn nis t yp t y pu u - piU (111C he vy rai nfa l I , which f rther itedsos the wa
Ievel A tI hri ;)f o, r,,ies such as Ielaware lBay. he ouuination of sto,'
Sur,je nni ,'a irf I run-. f creates extreme high water conlidLIonS for Iocdt i'(mn
I ie Phil adel ph A.
i . I i -0 !,'r )Li j XVi 1-9 are statistical su ires I )f threat )u )j-
Dl I t I e II , s d )n tropII.al cyclone trac ks for the i Tl -ytar peio l l- 7l-l .
he datd i r t hown -,e aso nal ly: the light LI in s reprusL2 ntio pe rcent threat for
tu e I -,I} rI i i c i 1 ,, r ouridirg Philadel ph i a , a n d t h- h i av y I1 n rep Is ti t
app ru x i ;I io (Ip 'e i h I f i e I c h i I (l I p h a. ri iI q i r r XV - for" , I:;; , pl., I
t'opi(cl :y'. onr liot.llel no de L ' , ,'c ir, epteri;blir I, a, acilt , d p( 1€'> ent
. 0 P) ) , I c h t (i Y 1) i I t I ) o ,- , I.
(I nri1 ti rt
w1) r, , f p ! f b , ,} - ,:l i ]'- r t t t { E, il %I n I If I I n q I I .'. n. , f h r I I (' p I r I f t r1 '
I)o t hl n ii i ti c) I: i aI no) Yi II i IT w I ro i , h h i r e'a i n i ", u t 3 t o d I Y
x VI 11

Annual -::
60'.
F igure AV1.-6 nnuaI probaoiI ity jrid CP t- °
tropical cyclones passirg within i 0 n i ( ded rle of Philadelphia, based o n data fr -t,,71-1979.
Sumiarlzed dn nud lly 'Iijure XVI - ), the p Iidiary th r at axNNs t J-
Prni ladeIphia is along the Last (oast thCout!h jatter'; a r jff the ,'ast
FIorida, then curving southeastward over the 2 ,hiaiias. Most theat st , .
to the east of Philadelphia over the open ocean.
rr I late and early season S ,' :til .ct J h' tnh jul . ie Io r I '
major threat a1is is fro:ii the (,u of o M texico then o,erianI pjaal
Atlantic codst line. The source regi n for i most ,)f t her t ,'l s '
western Jaribbean and the 6ulf of Mexico. Si nce 1:1 , ti're h ,', , :
November-June storms approaching wlit in I,,0 n iii f hl i1(1t, h .1 whi i '
maintaining hurricane force (>64 kt) winds.
During July and August ( Iigurte XVI - ->, the 1ear to at es ;' r ,
from the southwest. The primary threat Ioh extens f o , x it (2 n, I
secondary threat lobe extends from the kulf of Mxi.. ' . , ) : 'I ' ,
water, passing Philadelphia to the southeast. !ly ' -':15,, '.h i r i ! I
probability has shifted completely offshore II igkur, XV I -',.
The times to CPA shown in tigures XVI 1-0 thronu h Y V , -) sh o lH tIJ 5 us (I wIt 0
caution: it is not the average stori, 5ut rdther the 2e pt onal iy Y ist-iL)vin q
storm, that poses the greatest danger to Philadelphia. Idure ' VI /', fo
example, indicates that an (Octob.r storm ]o(at 'd near 2. 1 N ;4 S 1uW r,. h
Philadelphia in about 4 diV . town v r, furric,, aznl 2 1 -1 I oI n ( o f ,I
traveled th is d i , ft anr iri a ut 1 I1/ d/ I y axV 3
-4v,
CID z
-- 0
j u
Z2 m10
X- V 14
'~< 7
Zz - -
c I L)w L-L
Q- -~ :c
75j
x v I I-
at a
:177
7a
x vI I -16

JS
3 i j zti j ' S > 1 S1 t J ! ) I" f r
11I 11 1 \11 1 I 11 \.I:
n-. a .. t.. sn.
w ." S Au - , ~ ' ,- >, 15' ,2 .' , - . .22 _9 _ "
wt'FC-'-9 (A ."t' '' ,*:' G . : , " • r, ' 21, 4., ! ':'* -
[ - , r'tA at tnt " a:'' ' *I ' : ' -ri ' " - "
W 1i. t. . , T
W r
fl t'' a '~I z JI s
i 1n th sout in cent wdt j nC s 1 r (jr e-J2 nt
j -' a r ), e , b1^ u ... . .. " * , ?_ , i l: ,, " " -. , -. I . . . I ,
altIe s '- t. Ien i" a tI, ir ww a ves t t* h et i ll I I iJ! e -•L 1 S
the D el aware bay.
laDle XV -2 s 1 '' s' 1 2.
anoa ous water eve] on 1 1 Dt;,
Sc c ir r d tu r i hurl ijlr 1t
nortnerly ccu se, wi t u 42 kt speed if di, 1r " *, "
Y!'est of 'hila delpnia. Ihe s I'jr, i fia e f --. (I 2 t -
west of Phi1adelphia cleirly is supported v t .: t
west have an average renter" win Spee t i. ta, t -- " 1 p o
average more than ;i kt. However, tnt' 'sur c, iSSA'-....,."...•.;. ..
the west i s s ' j n if i cant 1 y h i r er
These f nodind js are as . r , . , t '' , , . , " .
land and in general nave oen an e! 'Ian-: )fldt'' a n, I q C
[he loss o f their low-irvel cn',;y s, 4 ., tr,. j,; ,
surface weaken their ciri. 'l ti on. ' n , th ',. , (
steii i r-C I e of the stor i . at i n W1 1 w c' ii .I i j ' o * '
passages to the west.

AD-A130 264 HURRICANE HAVENS HANDBOOK FOR THE NORTH ATLANTIC OCEAN 34SCHANGE 1(U) NAVAL ENVIRONMENTAL PREDICTION RESEARCH
FACILITY MONTEREY CA R J TURPIN ET AL. JUN 83
UNCLASSIFIED NEPRF-TR-82-03-CHG- F/G 4/2 NL
EIIIEIJ

..... 132
..... _ L2
11111,L2 1.4
MICROCOPY RESOLUlION TEST CHART

Il IL !,.D)EI'l [AI .. PA.
Tropical Passage MaximumCyclone Date Gust (kt)1. Agnes 6/22/72 322. Doris 8/28/71 363. Donna 9/12/60 404. Flossy 9/26/56 Not Recorded5. Connie 8/12/55 40 A W 40M
6. Hazel 10/15/54 82 8 70w
7. Edna 9/11/54 418. Able 9/01/52 449. No Name 9/19/45 Not Recorded
10. No Name 10/21/44 4311. No Name 9/14/44 52
12. No Name 10/01/43 Not Recorded 9
C 30N .30 N 30N• 9OW "80w 70w
H azelOctober 1954
Figure XVII-l0. Track segments of the 12 tropical cyclones that producedsustained winds greater than 22 kt at Philadelphia International Airport,1943-79. Also shown is the track of Hurricane Hazel, October 1954, theonly tropical cyclone on record to have produced hurricane force winds(gusts to 82 kt) at the Airport. The dashed portion of Hazel's trackindicates occurrence in this area of sustained winds of greater than 33 kt.
XVII-18

PIIIILADELPl1IA. PA
Table XVII-2. Data on storms of tropical origin that caused anomalous waterlevel conditions at Philadelphia during the period of 1928 to 1960. CPA isClosest Point of Approach and SOA is the tropical cyclone Speed of Advanceat CPA. (After D. Lee Harris, 1963.)
Surge Center Center PassedDate/Name CPA SOA Height Wind East/West
20 Sep 1928 129 n mi 17 kt 3.0 ft 40 kt West
2 Oct 1929 45 19 4.5 35 West
23 Aug 1933 92 19 6.7 45 West
15-17 Sep 1933 141 8 2.3 70 East
18-19 Sep 1936 95 16 2.0 85 East
21-22 Sep 1938 115 38 2.9 85 East
14-15 Sep 1944 92 30 2.1 75 East
CAROL
31 Aug 1954 107 31 2.6 85 East
EDNA
11-12 Sep 1954 153 23 -1.5 90 East
HAZEL
15-16 Oct 1954 120 42 9.4 70 West
CONNIE
12-14 Aug 1955 69 14 5.0 45 West
DONNA
12 SEP 1960 96 30 3.2 90 East
The exceptional storm tide effects at Philadelphia, however, are primarily
due to local surge development in Del .ware Bay and the retarding effect on river
outflow by the strong southerly winds. The impact of these effects is further
exaggerated by heavy rainfall runoff. The passage of a storm to the west of
Philadelphia provides the southerly wind field over Delaware Bay that is
necessary to create exceptionally high water at the port.
5. THE DECISION TO EVADE OR REMAIN IN PORT
5.1 REMAINING IN PORT PREFERRED
The port of Philadelphia is considered to be a hurricane haven, so
remaining in port is the recommended action. The Penn and Parker terminals and
the Reserve Basin provide suitable berthing during hurricane winds, provided
prescribed measures to ensure protection of life and property are taken. Ships
berthed at the Navy Yard finger piers that can be moved should be reberthed in
the Reserve Basin.
XVII-
.........................

PIIIIADITIHIA. PA
The designation of Philadelphia as a hurricane haven is based on the
following factors:
(1) Hurricane force winds associated with tropical cyclones are extremely
rare in the Philadelphia area. The only occurrence during the 37-year period
1943-1979 was during Hurricane Hazel in 1954 when maximum peak gusts to 82 kt
were recorded at the International Airport.
(2) The distance inland by direct route or along the Delaware Bay/River
estuary greatly reduces the energy of the wind and hence its capacity to create
water waves, as compared to the energy level in tropical cyclones when they
first make landfall.
(3) Evading to the open ocean is a high risk action because:
(a) Under normal conditions it is a 5 to 5 1/2 hour passage from
Philadelphia to the open Atlantic.
(b The orientation of the'coastline in the vicinity of the mouth of
Delaware Bay allows only two alternatives once the open ocean is reached: head
east and cross the likely track of the storm, or head northeast and try to
outrun the storm. Neither is a preferred option.
(~c) The 24- and 48-hour mean forecast tropical cyclone position
errors are large, approximately 120 and 360 n mi (see General Guidance, Figures
1-3 and 1-4). Thus deci sion making becomes even more difficult once the open
ocean is reached.
5.2 RUNNING FOR SHELTER
Ships at sea should give due consideration to their distance from the open
ocean and the space restrictions of Philadelphia's river-type port beforeconsidering running to the Port of Phil adel phi a for shel ter. However, the lower
Delaware Bay provides more direct access from the open ocean and some shelter
from high winds and seas. The Lower Bay historically has been used as ananchorage area during occurrences of hurricane force winds.
5.3 ADVICE FOR SMALL CRAFT
The universal advice for preparing small craft for hurricane force winds isto remove them from the water or bottom moor them. The next best action is tomnove them into the smallest bays or tributaries possible and allow for extreme
tidal and flooding conditions. During the passage of Hurricane Connie in August
1955, the high water level exceeded the normal high tide level by about 4 ft.Table XVII-2 shows that a storm surge of 5 ft occurred with the passage of
Connie; this storm surge apparently occurred near the time of high tide,resulting in the high water level. There are no recommended small craft mooring
facilities in the main harbor of Philadelphia (Delaware River channel).
XVII1-20
IbII IA )EIIII I A. I' A
REFERENCES
Cry, G. W., 1965: Tropical cyclones of the North Atlantic Ocean, 1871-1963;Technical Paper No. 55, Weather Bureau, U.S. Department of Commerce.
Defense Mapping Agency, 1979: Fleet Guide Philadelphia.
Harris, D. L., 1963: Characteri stics of the hurri cane storm surge, U.S. Dept.of Commerce, Technical Paper No. 48, Washington, DC.
U.S. Army Corps of Engineers, 1978: Port Series No. 8, The Ports ofPhiladelphia, PA, Camden, NJ, Wilmington, DE, and Ports on Delaware River.
U.S. Department of Commerce, 1979: U.S. Coast Pilot 3, Atlantic Coast: DelawareBay-
XVII1-21

ATE
LMED