unclassified ver 10.0 september 29, 2005 dod counterintelligence strategy mapping william l. mccoy...
TRANSCRIPT

UNCLASSIFIED
UNCLASSIFIEDVer 10.0 September 29, 2005
DoD Counterintelligence
STRATEGY MAPPING
William L. McCoySenior Program Manager
Lockheed Martin Integrated Technology

2 UNCLASSIFIED
To develop a methodology that defensibly and quantitatively maps the DoD CI Strategy (and eventually DoD CI resources to achieve it) to DNI Strategic Objectives, NCIX Pillars, Defense Intelligence Goals, and other guidance documents.
STRATEGY MAPPING OBJECTIVE

3 UNCLASSIFIED
BRIEFING OVERVIEWBRIEFING OVERVIEW
Purpose: Recommend survey universe, sample size (if required)
and analysis methodology for strategic mapping project that maps DoD CI General Goals to:
National Counterintelligence Pillars Director of National Intelligence Strategic Objectives USD(I) Defense Intelligence Goals
Discussion: DT Survey Results Part 1 – Universe and Sample Size Methodology
Recommendation and Decision Part 2 – Data Reduction and Analysis
Recommendation and Decision
Next Steps

4 UNCLASSIFIED
DT SURVEY RESULTS
DNI - EXPECTED COMPARED TO SAMPLE
EXPECTED SAMPLE
NCI - EXPECTED COMPARED TO SAMPLE
EXPECTED SAMPLE
NCI 1 NCI 2 NCI 3 NCI 4 NCI 5 NCI 6DoD 1 68.3% 70.0% 70.0% 65.0% 39.2% 70.0%DoD 2 76.7% 73.3% 66.7% 56.7% 46.7% 81.7%DoD 3 69.3% 75.3% 66.0% 66.7% 38.7% 64.7%DoD 4 71.7% 78.3% 60.0% 70.0% 40.0% 63.3%DoD 5 55.0% 58.3% 55.0% 53.3% 40.0% 58.3%DoD 6 67.8% 74.4% 68.9% 67.8% 43.3% 66.7%
DNI 1 DNI 2 DNI 3 DNI 4 DNI 5 DNI 6 DNI 7DoD 1 71.4% 75.7% 81.4% 64.3% 60.0% 57.1% 48.6%DoD 2 75.7% 81.4% 77.1% 75.7% 67.1% 58.6% 55.7%DoD 3 66.9% 68.3% 64.6% 62.3% 73.1% 59.4% 56.0%DoD 4 58.6% 58.6% 65.7% 60.0% 75.7% 65.7% 80.0%DoD 5 54.3% 55.7% 52.9% 54.3% 74.3% 54.3% 67.1%DoD 6 61.0% 66.7% 73.3% 69.5% 71.4% 82.9% 69.5%

5 UNCLASSIFIED
UNIVERSE AND SAMPLE SIZE METHODOLOGY
PART 1

6 UNCLASSIFIED
• Survey types:
Sample – more involved as we must make corrections for the error introduced by not surveying the universe. Sampling is required if the universe is too large. Population – more straight forward as no errors are introduced by sampling but requires manageable universe.
• Sampling introduces an additional step of determining and correcting for the variance – hence the arcane statistics.
SURVEYING
The analysis commences after the numbers are crunched.The results can be accepted at face value or adjusted/revisedbased on subject knowledge.
7 UNCLASSIFIED
OPTION DISCRIMINATORS
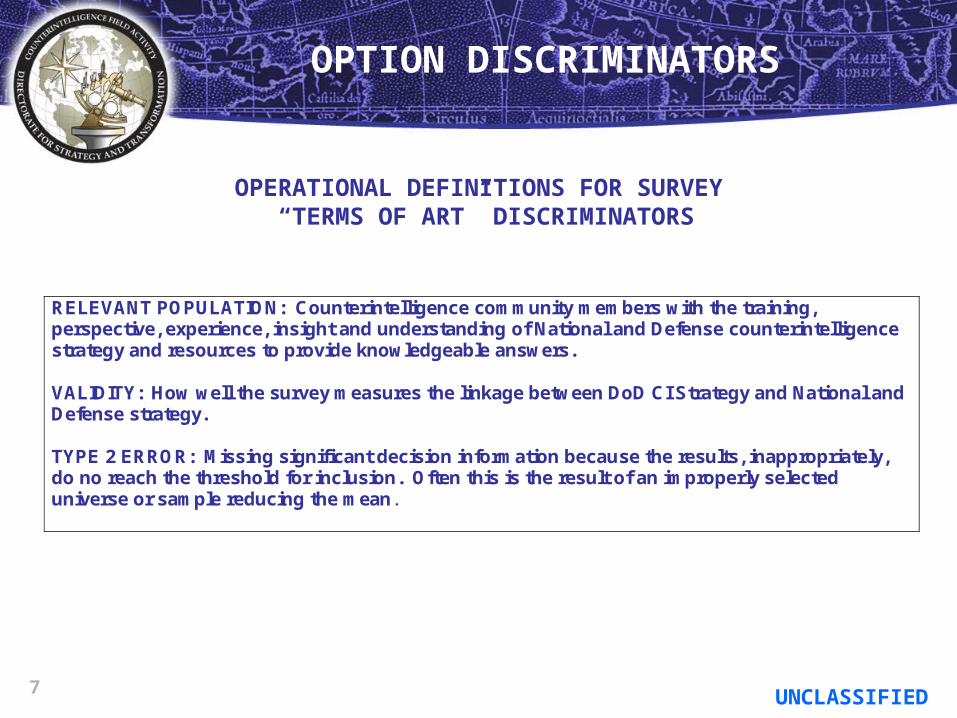
OPERATIONAL DEFINITIONS FOR SURVEY “TERMS OF ART” DISCRIMINATORS
RELEVANT POPULATION: Counterintelligence community members with the training, perspective, experience, insight and understanding of National and Defense counterintelligence strategy and resources to provide knowledgeable answers. VALIDITY: How well the survey measures the linkage between DoD CI Strategy and National and Defense strategy. TYPE 2 ERROR: Missing significant decision information because the results, inappropriately, do no reach the threshold for inclusion. Often this is the result of an improperly selected universe or sample reducing the mean.

8 UNCLASSIFIED
UNIVERSE ASSUMPTIONS
OPTION 1estimates
• AF OSI 450• Navy NCIS 700• USMC 200 • Army 350• Agencies 300 Total 2,000
OPTION 2estimates
• AF OSI 65• Navy NCIS 75• USMC 25 • Army 55• Agencies 80 Total 300
OPTION 3estimate
• CIRROC Member Organizations 80 Total 80
OPTION 1: The survey is administered to randomly selected DoD CI leadership and planners down to unit officers and senior NCOs and includes civilians.
OPTION 2: Uses OPTION 1 assumption but restricts survey participation to DoD CI leadership, planners, and resource managers down to major unit level.OPTION 3: Limits the survey to National level DoD CI leaders, strategic planners, and resource managers.
ASSUMPTIONS
SAMPLE SIZE Target population of 2,000 Confidence interval +/- 5% Confidence level of .95
Then sample size = 92
SAMPLE SIZE Target population of 300
Confidence interval +/- 5% Confidence level of .95
Then sample size = 73
SAMPLE SIZETarget population of 80100% survey possible
Then target universe = 100%
9 UNCLASSIFIED
OPTION 1 DETAIL
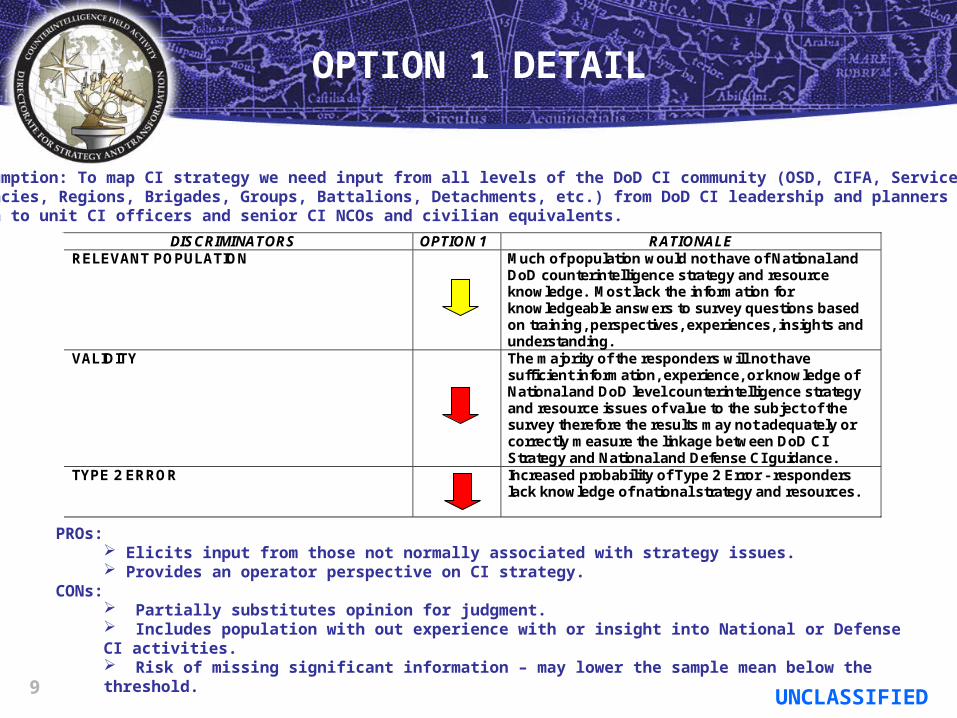
DISCRIMINATORS OPTION 1 RATIONALE RELEVANT POPULATION
Much of population would not have of National and DoD counterintelligence strategy and resource knowledge. Most lack the information for knowledgeable answers to survey questions based on training, perspectives, experiences, insights and understanding.
VALIDITY
The majority of the responders will not have sufficient information, experience, or knowledge of National and DoD level counterintelligence strategy and resource issues of value to the subject of the survey therefore the results may not adequately or correctly measure the linkage between DoD CI Strategy and National and Defense CI guidance.
TYPE 2 ERROR
Increased probability of Type 2 Error - responders lack knowledge of national strategy and resources.
Assumption: To map CI strategy we need input from all levels of the DoD CI community (OSD, CIFA, Services, Agencies, Regions, Brigades, Groups, Battalions, Detachments, etc.) from DoD CI leadership and planners down to unit CI officers and senior CI NCOs and civilian equivalents.
PROs: Elicits input from those not normally associated with strategy issues. Provides an operator perspective on CI strategy.
CONs: Partially substitutes opinion for judgment. Includes population with out experience with or insight into National or Defense CI activities. Risk of missing significant information – may lower the sample mean below the threshold.

10 UNCLASSIFIED
OPTION 2 DETAIL
DISCRIMINATORS OPTION 2 RATIONALE RELEVANT POPULATION
This population includes a mix of those with knowledge of national and DoD level counter-intelligence strategy and resource issues and those with regional or unit level knowledge. Many lack the training, perspective, experience, and insight to provide knowledgeable responses.
VALIDITY
Many responders will not have sufficient specific information or experience of value to the subject of the survey. The results would not be expected to adequately or correctly measure the linkage between DoD CI Strategy and National and Defense CI guidance.
TYPE 2 ERROR
Surveying this population will somewhat increase the probability of Type 2 Error. Some responders will have sufficient knowledge of national strategy and resources but others will lack this knowledge and will skew the results, again producing a lower mean.
Assumption: To map the strategy we need to know the view of all headquarters elements (less support) in the DoD CI community from DoD CI leadership, and planners, CI officers and senior CI NCOs and civilian equivalents at OSD, CIFA, Services, and Agencies down to Regions and Brigades.
PROs: Provides perspectives from those dealing with both CI planning and execution issues. Develops a broadly based input on strategy by including more operational and very strategic CI leaders and planners.
CONs: Population may not be conversant or experienced in National or Defense strategy issues. Includes population with out experience with or insight into National or Defense CI activities. Risk of missing significant information – may lower the sample mean below the threshold.

11 UNCLASSIFIED
OPTION 3 DETAIL
DISCRIMINATORS OPTION 3 RATIONALE RELEVANT POPULATION
Potential responders have the information to provide knowledgeable answers to survey questions drawn from their training, perspective, experience, insight and understanding.
VALIDITY
Responders have information that is of value to the subject of the survey, i.e., the universe of interest and the specific data items to be gathered. Survey results from this population would be expected to measure the linkage between DoD CI Strategy and National and Defense guidance as they have the training, perspective, experience, and insight to provide knowledgeable responses.
TYPE 2 ERROR
The risk of Type 2 error eliminated as this is not a sample survey.
Assumption: To map the strategy we need to know the perspective of DoD level leaders, strategy planners, and resource managers within the DoD CI community (OSD, CIFA, Services, Agencies).
PROs: Generates responses from a population with ongoing knowledge of and experience with National and Departmental strategy, budget, and resource issues. Develops a broadly based view of strategy from DoD CI organizations.
CONs: Survey population includes only headquarters leadership – misses CI field operator challenges.

12 UNCLASSIFIED
RECOMMENDATION:OPTION 3
• Responders would have the background and current knowledge relevant to measuring strategy linkage.• Less risk of missing significant results as there is no sample, thus no risk of Type 2 error.
• The most relevant population – current knowledge of and engaged in National and Departmental CI goals, strategies, resources, and budgets.
DISCRIMINATORS OPTION 1 OPTION 2 OPTION 3 RELEVANT POPULATION
VALIDITY
TYPE 2 ERROR

13 UNCLASSIFIED
DATA REDUCTION AND ANALYSIS
PART 2
14 UNCLASSIFIED
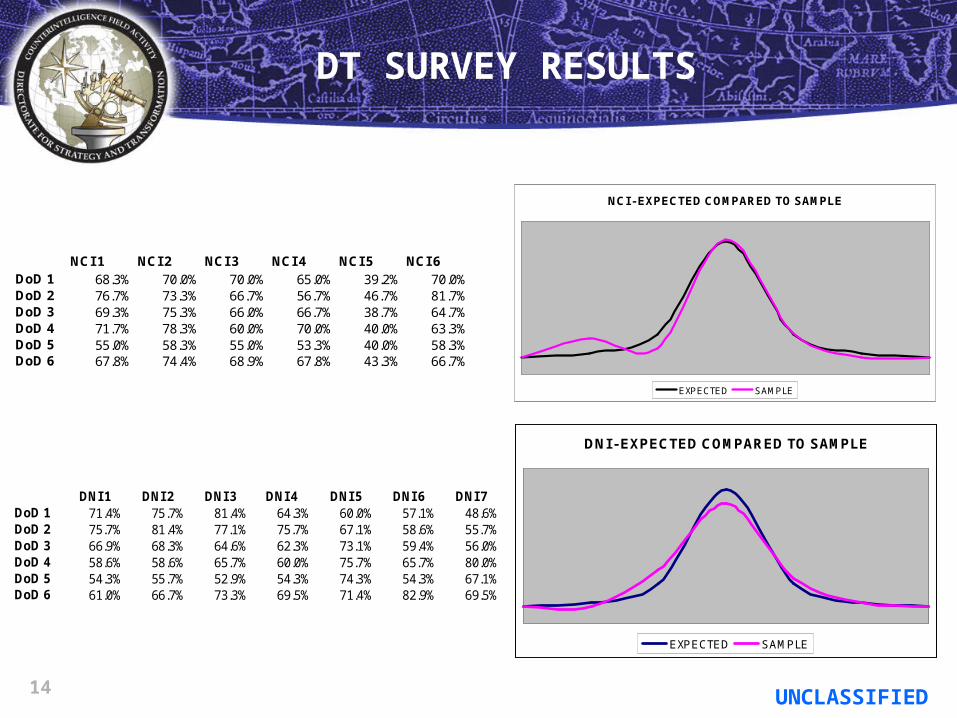
DT SURVEY RESULTS
DNI - EXPECTED COMPARED TO SAMPLE
EXPECTED SAMPLE
NCI - EXPECTED COMPARED TO SAMPLE
EXPECTED SAMPLE
NCI 1 NCI 2 NCI 3 NCI 4 NCI 5 NCI 6DoD 1 68.3% 70.0% 70.0% 65.0% 39.2% 70.0%DoD 2 76.7% 73.3% 66.7% 56.7% 46.7% 81.7%DoD 3 69.3% 75.3% 66.0% 66.7% 38.7% 64.7%DoD 4 71.7% 78.3% 60.0% 70.0% 40.0% 63.3%DoD 5 55.0% 58.3% 55.0% 53.3% 40.0% 58.3%DoD 6 67.8% 74.4% 68.9% 67.8% 43.3% 66.7%
DNI 1 DNI 2 DNI 3 DNI 4 DNI 5 DNI 6 DNI 7DoD 1 71.4% 75.7% 81.4% 64.3% 60.0% 57.1% 48.6%DoD 2 75.7% 81.4% 77.1% 75.7% 67.1% 58.6% 55.7%DoD 3 66.9% 68.3% 64.6% 62.3% 73.1% 59.4% 56.0%DoD 4 58.6% 58.6% 65.7% 60.0% 75.7% 65.7% 80.0%DoD 5 54.3% 55.7% 52.9% 54.3% 74.3% 54.3% 67.1%DoD 6 61.0% 66.7% 73.3% 69.5% 71.4% 82.9% 69.5%

15 UNCLASSIFIED
TAKING THE TOP SCORE
SELECTING LINKAGE DETERMINED BY: THE TOP ONE OR TWO RESULTS IN A CATEGORY
PRO: Easy to understand.
CON: Does not explain why the top one or two cut-off; why not the top three or four. More robust approaches possible.
OPTION 1
Results from initial DT survey.
DoD CI Allocations to NCI Pillars - Top Score Selected:
NCI 1 NCI 2 NCI 3 NCI 4 NCI 5 NCI 6DoD 1 68.3% 70.0% 70.0% 65.0% 39.2% 70.0%DoD 2 76.7% 73.3% 66.7% 56.7% 46.7% 81.7%DoD 3 69.3% 75.3% 66.0% 66.7% 38.7% 64.7%DoD 4 71.7% 78.3% 60.0% 70.0% 40.0% 63.3%DoD 5 55.0% 58.3% 55.0% 53.3% 40.0% 58.3%DoD 6 67.8% 74.4% 68.9% 67.8% 43.3% 66.7%

16 UNCLASSIFIED
ADJUSTING THE CUTOFF BY THESTANDARD DEVIATION
SELECTING LINKAGE DETERMINED BY: USING THE MEAN PLUS ONE STANDARD DEVIATION
PRO: Still easy concept to understand and answers the “why” for the cut-off.
CON: 1 sigma is too high for including alternates and splitting a sigma, while doable, is questionable.
OPTION 2
Results from initial DT survey.
DoD CI Allocations to NCI Pillars - Using Mean Plus 1 Standard Deviation:
NCI 1 NCI 2 NCI 3 NCI 4 NCI 5 NCI 6DoD 1 68.3% 70.0% 70.0% 65.0% 39.2% 70.0%DoD 2 76.7% 73.3% 66.7% 56.7% 46.7% 81.7%DoD 3 69.3% 75.3% 66.0% 66.7% 38.7% 64.7%DoD 4 71.7% 78.3% 60.0% 70.0% 40.0% 63.3%DoD 5 55.0% 58.3% 55.0% 53.3% 40.0% 58.3%DoD 6 67.8% 74.4% 68.9% 67.8% 43.3% 66.7%
MEAN 68.1% 71.6% 64.4% 63.3% 41.3% 67.5%SIGMA 6.58% 6.44% 5.28% 6.10% 2.82% 7.29%=>1 SIGMA 74.7% 78.0% 69.7% 69.3% 44.1% 74.7%
17 UNCLASSIFIED
CUTOFF USING THE 85TH PERCENTILE
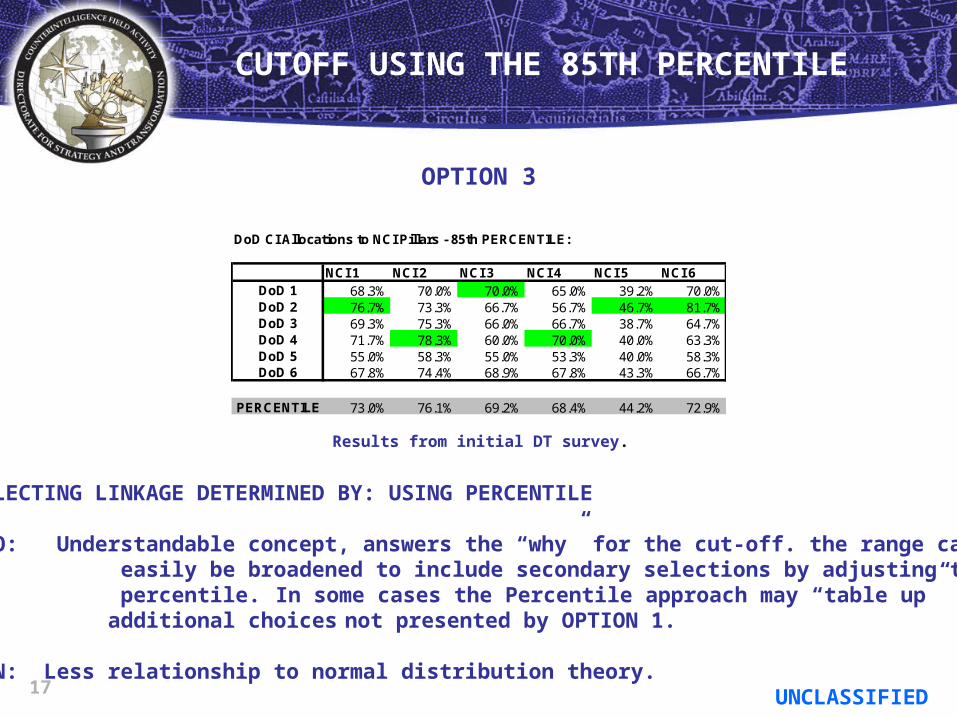
SELECTING LINKAGE DETERMINED BY: USING PERCENTILE
PRO: Understandable concept, answers the “why” for the cut-off. the range can easily be broadened to include secondary selections by adjusting the percentile. In some cases the Percentile approach may “table up” additional choices not presented by OPTION 1.
CON: Less relationship to normal distribution theory.
OPTION 3
Results from initial DT survey.
DoD CI Allocations to NCI Pillars - 85th PERCENTILE:
NCI 1 NCI 2 NCI 3 NCI 4 NCI 5 NCI 6DoD 1 68.3% 70.0% 70.0% 65.0% 39.2% 70.0%DoD 2 76.7% 73.3% 66.7% 56.7% 46.7% 81.7%DoD 3 69.3% 75.3% 66.0% 66.7% 38.7% 64.7%DoD 4 71.7% 78.3% 60.0% 70.0% 40.0% 63.3%DoD 5 55.0% 58.3% 55.0% 53.3% 40.0% 58.3%DoD 6 67.8% 74.4% 68.9% 67.8% 43.3% 66.7%
PERCENTILE 73.0% 76.1% 69.2% 68.4% 44.2% 72.9%
18 UNCLASSIFIED
RECOMMENDATION
OPTION 3 is recommended – it provides a defensible solution with reasonable rigor using commonly understood data analysis techniques.

19 UNCLASSIFIED
NEXT STEPSNEXT STEPS
Develop survey instructions and invitations according to the approved universe – <1 week Administer the survey – 1 week Complete data steps:
Input – 3 days Reduction – 1 day Analysis – 1 day
Publish, disseminate, and apply results
20 UNCLASSIFIED
QUESTIONS
21 UNCLASSIFIED
BACKUP
22 UNCLASSIFIED
EXCURSION – TWO BASIC TYPES OF SURVEYS
Surveys are divided into two categories:
1. A survey of the universe – also called a “census” or a “poll”
2. A sample survey that is representative of the universe:
The only time we don’t survey the universe is when time, cost, or accessibility of respondents create the need for a sample – in other words, when we have no other choice.
The goal of a sample is to produce the same results that would have been obtained had every single member of a universe been
interviewed.
• The key to reaching this goal is a fundamental principle called equal probability of selection.• Cluster, stratified, and other forms of surveys are based on the foregoing.

23 UNCLASSIFIED
TO DETERMINE THE UNIVERSE,“WHO CAN TELL US WHAT WE NEED TO KNOW?”
• The survey's universe must fit the facts of the case. • The target population must correspond to the topic studied. • A universe which is relevant to the problem being studied and includes respondent qualification requirements is a vital requirement of high quality research. • When selecting the universe every member of that universe must have an equal probability of sample selection.
Those in DoD who are engaged and familiar with the National and Departmental CI goals, strategies, resources, and budgets.
UNIVERSE SELECTION PRINCIPLES:
INDICATE THE UNIVERSE SHOULD BE POPULATED WITH:

24 UNCLASSIFIED
HYPOTHESIS TESTING:STEP 2 EXPLANATION
Setting the Level of Significance
• The significance level is used for accepting or rejecting the null hypothesis.• The difference between the results of the experiment and the null hypothesis is determined. • Assuming the null hypothesis is true, the probability of a difference that large or larger is computed . • This probability is compared to the significance level. • If the probability is less than or equal to the significance level, then the null hypothesis is rejected and the outcome is said to be statistically significant. • The lower the significance level, the more the data must diverge from the null hypothesis to be significant.
25 UNCLASSIFIED
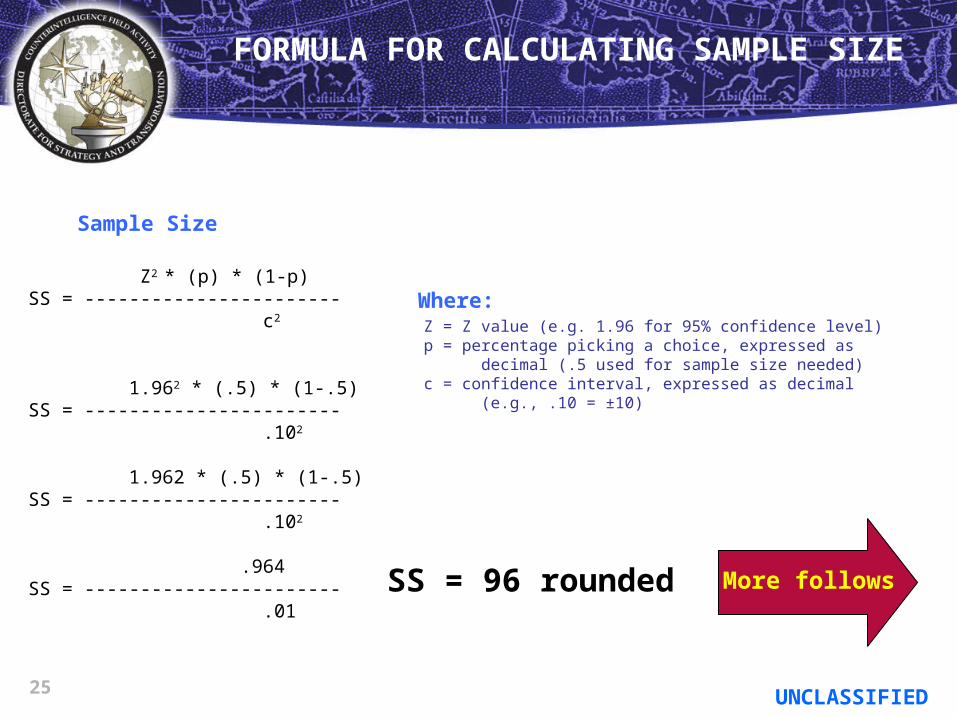
Sample Size
Where:
Z = Z value (e.g. 1.96 for 95% confidence level) p = percentage picking a choice, expressed as decimal (.5 used for sample size needed)c = confidence interval, expressed as decimal (e.g., .10 = ±10)
FORMULA FOR CALCULATING SAMPLE SIZE
SS = 96 rounded More follows
Z2 * (p) * (1-p)SS = ----------------------- c2
1.962 * (.5) * (1-.5)SS = ----------------------- .102
1.962 * (.5) * (1-.5)SS = ----------------------- .102
.964SS = ----------------------- .01

26 UNCLASSIFIED
where: pop = population
. . . AND CORRECTING FOR A FINITE UNIVERSE
SSCorrected SS = ----------------------- SS-1 1+ ------ pop
96.04Corrected SS = ----------------------- 96.04-1 1+ ---------- 2,000
96.04Corrected SS = ----------------------- 95.04 1+ ---------- 2,000
96.04Corrected SS = ----------------------- 1.04752
Corrected SS = 92 rounded

27 UNCLASSIFIED
Determine Sample Size
Confidence Level: 95% 99%
Confidence Interval: 10
Population: 2000
Sample size needed: 92
Given a universe of 2000 and a confidenceinterval of 10 (+\- 5), you are 95% certainthat a sample size of 92 will provide resultsconsistent with a total survey of the universe.
WHICH SAYS:
. . . OR YOU CAN USE THE FREEWARESAMPLE SIZE CALULATOR
28 UNCLASSIFIED
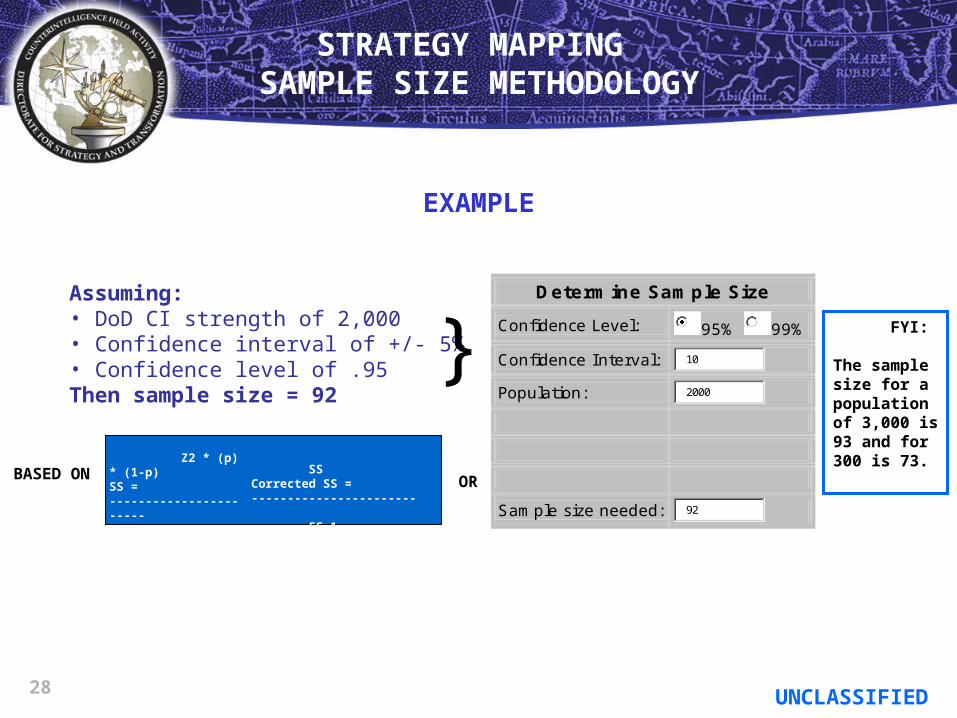
Assuming: • DoD CI strength of 2,000• Confidence interval of +/- 5%• Confidence level of .95Then sample size = 92
}Determine Sample Size
Confidence Level: 95% 99%
Confidence Interval: 10
Population: 2000
Sample size needed: 92
BASED ON OR
SSCorrected SS = ----------------------- SS-1 1+ ------ pop
Z2 * (p) * (1-p)SS = ----------------------- c2
FYI:
The samplesize for a populationof 3,000 is93 and for300 is 73.
STRATEGY MAPPING SAMPLE SIZE METHODOLOGY
EXAMPLE

29 UNCLASSIFIED
TYPE 1 AND 2 ERRORS
30 UNCLASSIFIED
The most difficult task in developing a research project is to narrow down the field of study and the research problem. A distinction needs to be made between a problem and a research problem.
• A problem is an observed discrepancy or gap between what is known and not known. • The identification of the problem is an interpretation of the gap based on a set of observations.
A research problem is a judgment drawn from the interpretation of the gap.
RESEARCH PROBLEM

31 UNCLASSIFIED
RELIABILITY AND VALIDITY
VALIDITY: Information is presented or used in the way for which it was intended.
RELIABILITY: We can expect to obtain the same information time after time.
32 UNCLASSIFIED
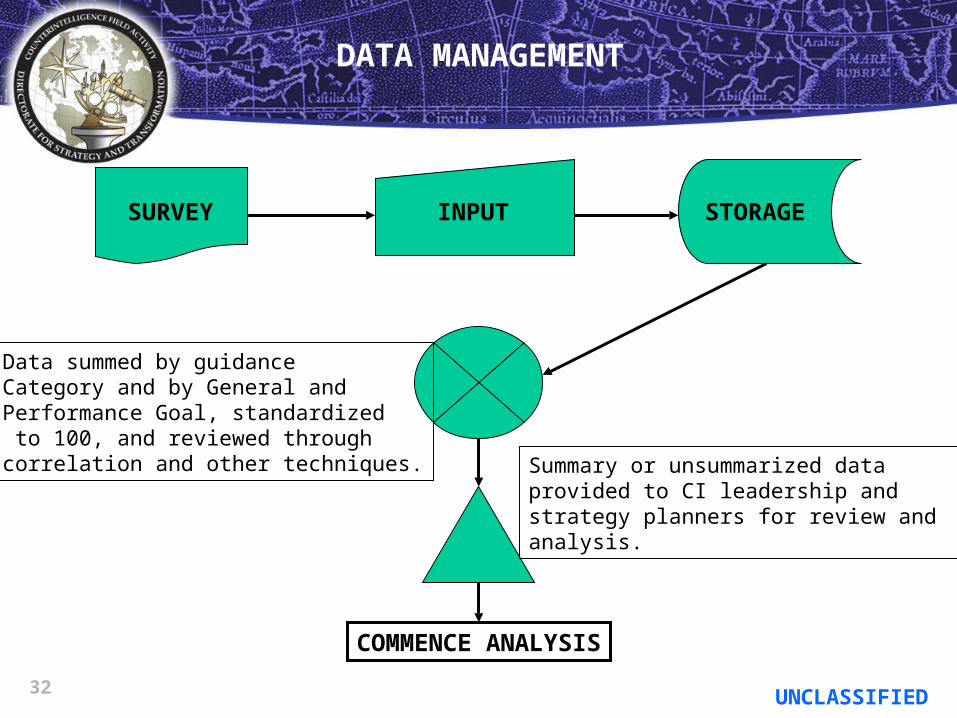
DATA MANAGEMENT
SURVEY INPUT STORAGE
COMMENCE ANALYSIS
Data summed by guidanceCategory and by General and Performance Goal, standardized to 100, and reviewed through correlation and other techniques. Summary or unsummarized data
provided to CI leadership and strategy planners for review and analysis.
33 UNCLASSIFIED
The standard error of a sample of sample size is the sample's
standard deviation divided by the square root of n. It therefore
estimates the standard deviation of the sample mean based on
the population mean. Note that while this definition
makes no reference to a normal distribution, many uses of this
quantity implicitly assume such a distribution.
The standard error of an estimate may also be defined as the
square root of the estimated error variance of the quantity,

34 UNCLASSIFIED
How does DoD counterintelligence strategy map into national and DoD intelligence and counterintelligence guidance?
RESEARCH QUESTION

35 UNCLASSIFIED
H0 – NULL HYPOTHESIS: There is no relationship between DoD Counterintelligence Strategy and National Counterintelligence Pillars.
H0: µ - M < 0
H1 – ALTERNATIVE HYPOTHESIS: There is a relationship betweenDoD Counterintelligence Strategy and National CounterintelligencePillars.
H1: µ - M => 0
HYPOTHESIS TESTING:
The Null and Alternative Hypotheses

36 UNCLASSIFIED
HYPOTHESIS TESTING:
Next steps:
• Set the Level of Significance at .95; alpha = .05• Identify the Test Statistic and calculate the critical value (or probability)• Formulate the decision rule - in this case if the Test Statistic is => 0 reject the Null Hypothesis

37 UNCLASSIFIED
NCI PILLARS -- DoD COUNTERINTELLIGENCE STRATEGY ALLOCATION SURVEY
IF WE… THEN HOW LIKELY ARE WE TO . . .?
(WE = DoD CI) (WE = National/US CI)
(-20%) (0%) (20%) (40%) (60%) (80%) (100%)SAMPLE: "IF WE" place a premium on information sharing . . .
1.a. Place a premium on information sharing.
N-1.0 Extend safeguards of strategic counterintelligence to the Global War on Terrorism
EXPLANATION:
N-2.0 Shift US counterintelligence to a proactive strategy of seizing advantage
N-3.0 Help protect the sensitive technologies that are the backbone of our security
N-4.0 Safeguard the integrity of intelligence operations and analysis, and defeat foreign intelligence operations
N-5.0 Seek to ensure a level economic playing field so that US business and industry are not disadvantaged by foreign intelligence operations
N-6.0 Ensure that the intelligence community will have counterintelligence analytic products available to the President and his national security team to inform decisions
USUALLY/ GENERALLY
TO A MODERATE
EXTENT
CERTAINLY/ COMPLETELY
NOT AT ALL & COUNTER-
PRODUCTIVENOT AT ALL
TO A SMALL EXTENT
SOME WHAT
DoD CI leadership must emphasize, encourage, and reward information sharing, Our community can no longer afford the limitations imposed by vertical layering. Improving DoD CI's ability to proactively neutralize threats to DoD operations, personnel, and facilities means we cannot act alone -- not as an individual CI Service or Agency nor as the DoD CI community. Information must flow among law enforcement and security Agencies, across cultural "INT" barriers and acquisition communities. The private sector must be the recipient and provider of critical CI information to ensure the success of DoD.
MY ESTIMATE IS:
SAMPLE: ..."THEN HOW LIKELY ARE WE TO" extend safeguards of strategic counterintelligence to the Global War on Terrorism?
CIRCLE YOUR BEST ESTIMATE. CHOOSE ONE.
DoD 1 DoD 2 DoD 3 DoD 4 DoD 5 DoD 6NCI 1 3.0% 3.4% 3.1% 3.2% 2.4% 3.0%NCI 2 3.1% 3.2% 3.3% 3.5% 2.6% 3.3%NCI 3 3.1% 3.0% 2.9% 2.7% 2.4% 3.1%NCI 4 2.9% 2.5% 3.0% 3.1% 2.4% 3.0%NCI 5 1.7% 2.1% 1.7% 1.8% 1.8% 1.9%NCI 6 3.1% 3.6% 2.9% 2.8% 2.6% 3.0%
16.9% 17.8% 16.9% 17.1% 14.2% 17.3%
DoD 1
DoD 3
DoD 5
NCI1
NCI2
NCI3
NCI4
NCI5
NCI6
0.0%
5.0%
10.0%
15.0%
20.0%
25.0%
DoD 1 DoD 2 DoD 3 DoD 4 DoD 5 DoD 6NCI 1 17.8% 19.1% 18.3% 18.7% 16.9% 17.3%NCI 2 18.3% 18.0% 19.5% 20.5% 18.3% 19.1%NCI 3 18.3% 16.9% 17.2% 15.8% 16.9% 17.9%NCI 4 17.2% 14.0% 17.8% 18.1% 16.9% 17.3%NCI 5 10.1% 11.8% 10.1% 10.5% 12.7% 11.0%NCI 6 18.3% 20.2% 17.2% 16.4% 18.3% 17.3%
100.0% 100.0% 100.0% 100.0% 100.0% 100.0%
MEAN 16.7% 16.7% 16.7% 16.7% 16.7% 16.7%SIGMA 3.27% 3.19% 3.36% 3.44% 2.07% 2.87%+1 SIGMA 19.9% 19.9% 20.0% 20.1% 18.7% 19.5%CONF LVL=95% 2.03% 1.98% 2.08% 2.14% 1.28% 1.78%Results > 17.9% 17.9% 17.9% 18.0% 17.5% 17.8%
NCI 1 NCI 2 NCI 3 NCI 4 NCI 5 NCI 6
NCI 1 1NCI 2 0.835482 1NCI 3 0.658522 0.555066 1NCI 4 0.401979 0.806921 0.433454 1NCI 5 0.420289 0.071959 0.178256 -0.46900 1NCI 6 0.748950 0.305367 0.687682 -0.180567 0.702069 1
DATA REDUCTION AND ANALYSIS
DoD 2
DoD 4
DoD 6

38 UNCLASSIFIED
HYPOTHESIS TESTING
EXPECTED COMPARED TO SAMPLE
SAMPLE EXPECTED
Initial DT NCI Survey Results

39 UNCLASSIFIED
HYPOTHESIS TESTING
Problem with Sampling
EXPECTED COMPARED TO SAMPLE
EXPECTED SAMPLE
Fairly robust statistics required to understand the survey result. It could havebeen poor universe selection or an improperly designed survey instrument.

40 UNCLASSIFIED
HYPOTHESIS TESTING
EXPECTED COMPARED TO SAMPLE
SAMPLE EXPECTED
Initial DT NCI Survey Results

41 UNCLASSIFIED
HYPOTHESIS TESTING
Problem with Sampling
EXPECTED COMPARED TO SAMPLE
EXPECTED SAMPLE
Fairly robust statistics required to understand the survey result. It could havebeen poor universe selection or an improperly designed survey instrument.

42 UNCLASSIFIED
SELECTION WITHOUT REPLACEMENT
GOAL: Provide an NCI Pillar for each DoD CI Strategy General Goal
NCI 1 NCI 2 NCI 3 NCI 4 NCI 5 NCI 6DoD 1 68.3% 70.0% 70.0% 65.0% 39.2% 70.0%DoD 2 76.7% 73.3% 66.7% 56.7% 46.7% 81.7%DoD 3 69.3% 75.3% 66.0% 66.7% 38.7% 64.7%DoD 4 71.7% 78.3% 60.0% 70.0% 40.0% 63.3%DoD 5 55.0% 58.3% 55.0% 53.3% 40.0% 58.3%DoD 6 67.8% 74.4% 68.9% 67.8% 43.3% 66.7%
• Assign the DoD CI GG having the highest score
• If the DoD CI GG will be repeated, select the second highest DoD CI GG score
• Continue until all DoD CI GGs are exhausted

43 UNCLASSIFIED
OPINION VICE JUDGMENT
opinion u'pinyun
A personal belief or judgment that is not founded on proof or certainty A belief or sentiment shared by most people; the voice of the people A message expressing a belief about something; the expression of a belief that is held with confidence but not substantiated by positive knowledge or proof The legal document stating the reasons for a judicial decision The reason for a court's judgment (as opposed to the decision itself) A vague idea in which some confidence is placed