uncovering arabidopsis membrane protein interactome...
TRANSCRIPT
ORIGINAL RESEARCH ARTICLEpublished: 21 June 2012
doi: 10.3389/fpls.2012.00124
Uncovering Arabidopsis membrane protein interactomeenriched in transporters using mating-based split ubiquitinassays and classification modelsJin Chen1,2*, Sylvie Lalonde1, Petr Obrdlik 3, Azam Noorani Vatani 1, Saman A. Parsa1, Cristina Vilarino4,
Jose Luis Revuelta4,Wolf B. Frommer 1 and SeungY. Rhee1*
1 Department of Plant Biology, Carnegie Institution for Science, Stanford, CA, USA2 MSU-DOE Plant Research Laboratory, Computer Science and Engineering Department, Michigan State University, East Lansing, MI, USA3 IonGate Biosciences GmbH, Frankfurt, Germany4 Departamento de Microbiología y Genética, Instituto de Biología Funcional y Genomica, Universidad de Salamanca-Consejo Superior de Investigaciones
Científicas, Salamanca, Spain
Edited by:
Burkhard Schulz, Purdue University,USA
Reviewed by:
Alexander Duenkler, University Ulm,GermanyDierk Wanke, Tuebingen University,Germany
*Correspondence:
Jin Chen, MSU-DOE Plant ResearchLaboratory, Computer Science andEngineering Department, MichiganState University, 612 Wilson Road,East Lansing, MI 40024, USA.e-mail: [email protected];
Seung Y. Rhee, Department of PlantBiology, Carnegie Institution forScience, 260 Panama Street,Stanford, CA 94305, USA.e-mail: [email protected]
High-throughput data are a double-edged sword; for the benefit of large amount of data,there is an associated cost of noise.To increase reliability and scalability of high-throughputprotein interaction data generation, we tested the efficacy of classification to enrich poten-tial protein–protein interactions. We applied this method to identify interactions amongArabidopsis membrane proteins enriched in transporters. We validated our method withmultiple retests. Classification improved the quality of the ensuing interaction network andwas effective in reducing the search space and increasing true positive rate. The final net-work of 541 interactions among 239 proteins (of which 179 are transporters) is the firstprotein interaction network enriched in membrane transporters reported for any organ-ism. This network has similar topological attributes to other published protein interactionnetworks. It also extends and fills gaps in currently available biological networks in plantsand allows building a number of hypotheses about processes and mechanisms involvingsignal-transduction and transport systems.
Keywords: Arabidopsis, protein–protein interaction, membrane, transporter, split ubiquitin system, classification
INTRODUCTIONMembrane proteins play an essential role in fundamental biolog-ical processes including signaling, homeostasis, nutrient acquisi-tion, and metabolism. Despite their importance, we know littleabout the functions of most membrane proteins. For example,transporters constitute a large functional class in any organism,making up ∼4% of eukaryotic and ∼9% of prokaryotic genomeson average (Ren and Paulsen, 2005). Furthermore, genes knownto cause disease in human are enriched in transporters. Over 9%of characterized disease genes are transporters (Jimenez-Sanchezet al., 2001) whereas only 3% of the human genome are annotatedas transporters (Ren et al., 2007; p-value <0.0001, Chi-squaretest with Yates correction). However, we know the functions of
Abbreviations: CNGC, cyclic nucleotide-gated ion channel; Cub, C-terminal ofubiquitin; Cub-PLV, Cub-protA-LexA-VP16 peptide; CV, coefficient of variation;FDR, false discovery rate; GO, gene ontology; mbSUS, mating-based split ubiqui-tin system; MLO, mildew resistance locus O; Nub, N-terminal of ubiquitin; ORF,open reading frame; PO,plant ontology; pPPI,potential protein–protein interaction;RLK, receptor-like kinase; SC, synthetic complete medium; SD, synthetic dextroseminimal medium; SMO, sequential minimal optimization; SVM, support vectormachine; TF, transcription factor; VAMP, vesicle-associated membrane protein;Y2H, yeast two hybrid; YPD, yeast extract peptone dextrose complete medium.
only a small portion of predicted transporters. For example, inArabidopsis, over 1200 proteins have been classified as transporters(Ren et al., 2007), but only 267 transporters have been character-ized experimentally (Lamesch et al., 2012). It has been difficult tosystematically elucidate the function of transport systems usingtraditional genetic and biochemical approaches (Barbier-Brygooet al., 2001). Identifying physical partners of transporters couldprovide a framework from which to generate strategies and testhypotheses relating to the function, mechanism, and regulation oftransport systems.
Yeast two hybrid (Y2H) systems have been used successfullyto identify interactions between soluble proteins in plants (Ara-bidopsis Interactome Mapping Consortium, 2011; Mukhtar et al.,2011). To systematically elucidate a map of membrane proteininteractions, mating-based split ubiquitin system (mbSUS) wasdeveloped (Obrdlik et al., 2004; Miller et al., 2005). The split ubiq-uitin system is similar to the classical Y2H as it uses yeast as aheterologous system and has a similar read-out, but it specificallyallows the detection of interactions of full-length membrane pro-teins. The concept of mbSUS relies on the release of a transcriptionfactor (TF) from a membrane protein if it interacts with anothermembrane (or soluble) protein. Similar to other detection systems
www.frontiersin.org June 2012 | Volume 3 | Article 124 | 1
Chen et al. Uncovering Arabidopsis membrane protein interactome
based on the reconstitution of two halves of a protein, mbSUSuses a ubiquitin split into two halves: The N-terminal domainof ubiquitin (Nub) can reconstitute a functional ubiquitin whenco-expressed with its other, C-terminal half (Cub; Johnsson andVarshavsky, 1994). Nub mutants such as NubG with a reducedaffinity to Cub reconstitute the full-length ubiquitin only whenbrought into vicinity via interaction between two fusion partners.The use of a mutated Nub and Cub to test for physical interactionbetween two fused proteins is the basis of mbSUS.
The mbSUS has been used successfully to analyze interactionsamong 705 integral membrane proteins in yeast in 2005 (Milleret al., 2005). Plant mbSUS was developed and used to test inter-actions of translocon complex at the outer chloroplast membrane(Rahim et al., 2009). Recently, mbSUS was successfully used toscreen for potential interactions among 490 Arabidopsis mem-brane and signaling proteins (Lalonde et al., 2010). However, thecurrently available membrane interaction networks for Arabidopsiscovers only a small portion of the genome.
The sheer number of interactions to test and a high level of noisehamper the generation of genome-wide physical interaction net-works. For Arabidopsis, given its full set of 8000 membrane proteins(Lalonde et al., 2010), we have to test about 32 million pairs to iden-tify the genome-wide membrane interaction network. In addition,previous studies indicate that physical interaction networks acrossall genomes are sparse (August and Papachristodoulou, 2009) andthat the number of interactions grows linearly as the number ofproteins grows in a network (Streinu and Theran, 2009). Thesefacts suggest that if interactions among all possible pairs are tested,most of the tests should result in negative interactions.
Similar to the interaction networks reconstructed with otherhigh-throughput techniques, mbSUS-based interaction networksalso have high levels of background noise (Fields, 2005; Vlas-blom and Wodak, 2009). To improve the quality of the net-work, several strategies have been used to eliminate false posi-tives. First, expression of the Cub-PLV (protA-LexA-VP16 pep-tide) fusion can be fine-tuned by using a methionine-repressiblepromoter and titrated using different methionine concentra-tions in the medium. Second, 3-aminotriazole or Nub affin-ity mutants (Raquet et al., 2001) can be used to optimize theselection conditions for eliminating auto-activators and clonesshowing high expression. Third, the information content ofmbSUS screens could be improved by determining growthcurves quantitatively by measuring optical density of the cul-tures. While the output may not necessarily reflect the kinet-ics of the underlying interaction, the quantitative data mayhelp reduce artifacts and improve standardization over multipleassays performed over the data collection period (Lalonde et al.,2008).
The large number of assays that need to be performed to deter-mine the whole complement of potential protein interactionsconstrains the scalability of mbSUS. In this paper, we present asystem that combines computational and empirical approachesto efficiently detect high quality Arabidopsis membrane interac-tions by minimizing the overall search space initially, followed bymaximizing the number of interaction assays.
To minimize the search space, we used classification mod-els to remove those interactions that are likely to be false
positive. Classification models, such as Bayesian networks, havebeen applied successfully to predict genome-wide protein–proteininteractions (Jansen et al., 2003). In a classification model, func-tional features are weighted and combined. At given levels ofsensitivity, classification predictions could be even more accu-rate than the existing high-throughput experimental data sets(Jansen et al., 2003). However, classification models often sufferfrom noisy training data (Bi and Zhang, 2004). Therefore, we usedan ensemble of four types of classification models (decision tree,logistic regression, Bayesian network, and support vector machine,SVM) to identify false positives and leave all the potentially truepositive interactions to a more rigorous interaction testing. Forthe decision tree model, we used AD-tree (Freund and Mason,1999), which combines decision trees with boosting that gener-ates classification rules that are usually smaller in size and thuseasier to interpret. These classification rules yield a natural mea-sure of classification confidence, which can be used to improvethe accuracy. Logistic regression (le Cessie and van Houwelin-gen, 1992) is a statistical model for predicting the probabilityof occurrence of an event by fitting data to a logistic curve. Itis a generalized linear model used for binomial regression andis used extensively in the biological sciences. Bayesian networklearning has various search algorithms and quality measures. Weused K2 (Cooper and Dietterich, 1992), which uses a Bayesianscore to rank different structures and a greedy search algorithm tomaximize the score. Finally, SVM (Cortes and Vapnik, 1995) is aset of supervised learning methods that recognize patterns fromdata, and is used for classification and regression analysis. Intu-itively, an SVM model is a representation of the training data aspoints in space, mapped in a way that the training data belong-ing to different categories are divided by a gap that is as wideas possible. Testing data are then mapped onto that same spaceand predicted to belong to a category based on which side ofthe gap they fall on. We used sequential minimal optimization(SMO), an algorithm for training an SVM classifier (Keerthi et al.,2001).
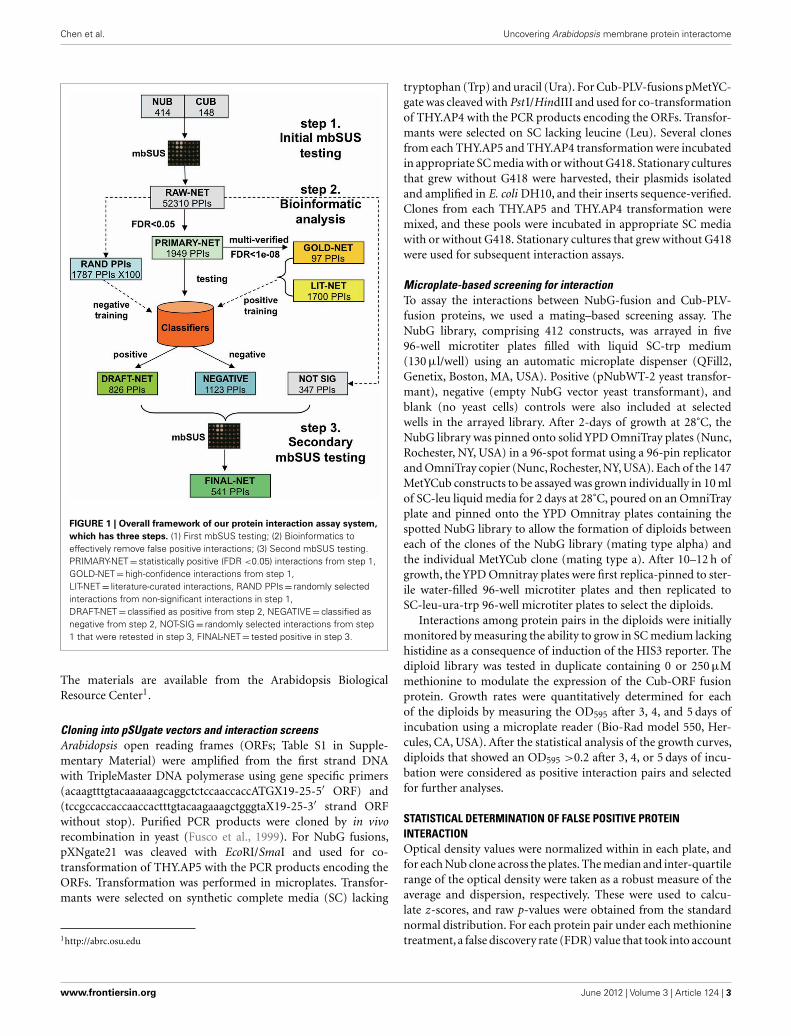
Our system has three steps (Figure 1). First, mbSUS is appliedto all protein pairs using two replicates (PRIMARY-NET). In thisstep, most of the false positive and true negative interactions are fil-tered out using a statistical analysis. Second, classification methodsare applied to detect and filter false positives from PRIMARY-NET, resulting in DRAFT-NET. Third, several assays of mbSUS areapplied with multiple replicates under different conditions (in ourstudy, 48 tests for each protein pair). This approach resulted in ahigh quality interaction network called FINAL-NET with 541 (532unique) interactions between 239 proteins. Topological and func-tional network characteristics show that our method is promisingin terms of scalability and accuracy.
MATERIALS AND METHODSFIRST mbSUS INTERACTION ASSAYSStrains and vectorsWe used the following yeast strains and pSUgate vectors, whichhave been described previously (Obrdlik et al., 2004): THY.AP4(MATa ura3 leu2 lexA::lacZ::trp1 lexA::HIS3 lexA::ADE2) andTHY.AP5 (MATα URA3 leu2 trp1 his3 loxP::ade2), and the pSUg-ate vectors pMetYCgate, pXNgate21, pNXgate32, and pNubWT-2.
Frontiers in Plant Science | Plant Physiology June 2012 | Volume 3 | Article 124 | 2
Chen et al. Uncovering Arabidopsis membrane protein interactome
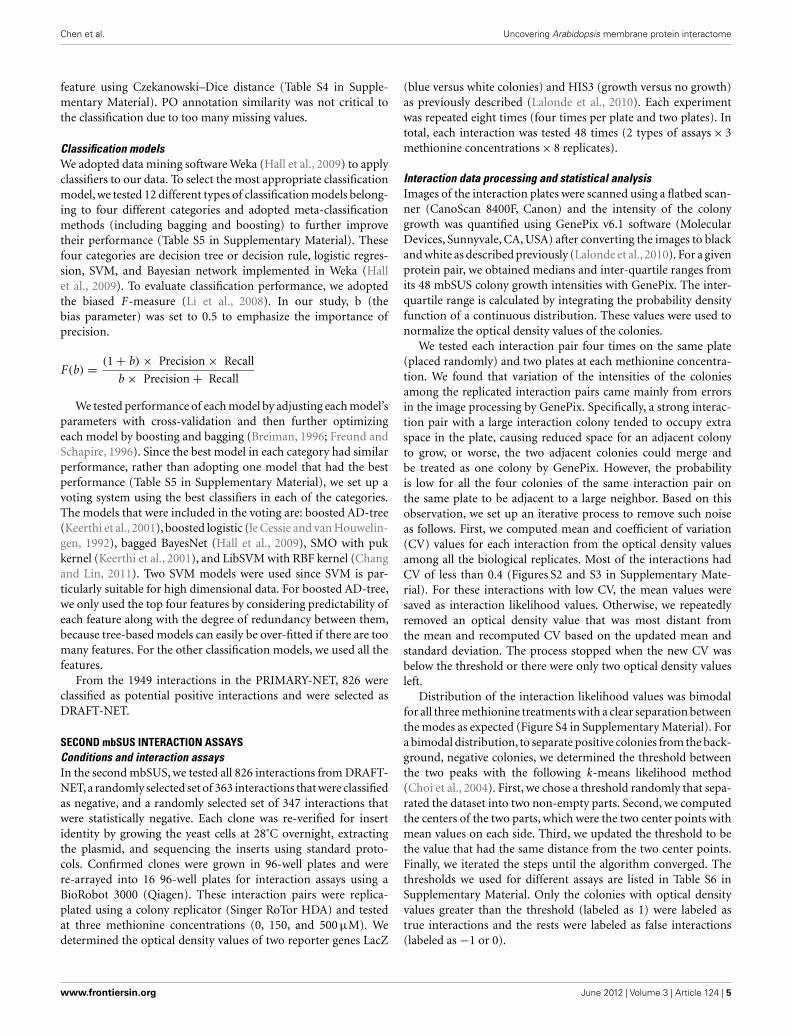
FIGURE 1 | Overall framework of our protein interaction assay system,
which has three steps. (1) First mbSUS testing; (2) Bioinformatics toeffectively remove false positive interactions; (3) Second mbSUS testing.PRIMARY-NET = statistically positive (FDR <0.05) interactions from step 1,GOLD-NET = high-confidence interactions from step 1,LIT-NET = literature-curated interactions, RAND PPIs = randomly selectedinteractions from non-significant interactions in step 1,DRAFT-NET = classified as positive from step 2, NEGATIVE = classified asnegative from step 2, NOT-SIG = randomly selected interactions from step1 that were retested in step 3, FINAL-NET = tested positive in step 3.
The materials are available from the Arabidopsis BiologicalResource Center1.
Cloning into pSUgate vectors and interaction screensArabidopsis open reading frames (ORFs; Table S1 in Supple-mentary Material) were amplified from the first strand DNAwith TripleMaster DNA polymerase using gene specific primers(acaagtttgtacaaaaaagcaggctctccaaccaccATGX19-25-5′ ORF) and(tccgccaccaccaaccactttgtacaagaaagctgggtaX19-25-3′ strand ORFwithout stop). Purified PCR products were cloned by in vivorecombination in yeast (Fusco et al., 1999). For NubG fusions,pXNgate21 was cleaved with EcoRI/SmaI and used for co-transformation of THY.AP5 with the PCR products encoding theORFs. Transformation was performed in microplates. Transfor-mants were selected on synthetic complete media (SC) lacking
1http://abrc.osu.edu
tryptophan (Trp) and uracil (Ura). For Cub-PLV-fusions pMetYC-gate was cleaved with Pst I/HindIII and used for co-transformationof THY.AP4 with the PCR products encoding the ORFs. Transfor-mants were selected on SC lacking leucine (Leu). Several clonesfrom each THY.AP5 and THY.AP4 transformation were incubatedin appropriate SC media with or without G418. Stationary culturesthat grew without G418 were harvested, their plasmids isolatedand amplified in E. coli DH10, and their inserts sequence-verified.Clones from each THY.AP5 and THY.AP4 transformation weremixed, and these pools were incubated in appropriate SC mediawith or without G418. Stationary cultures that grew without G418were used for subsequent interaction assays.
Microplate-based screening for interactionTo assay the interactions between NubG-fusion and Cub-PLV-fusion proteins, we used a mating–based screening assay. TheNubG library, comprising 412 constructs, was arrayed in five96-well microtiter plates filled with liquid SC-trp medium(130 μl/well) using an automatic microplate dispenser (QFill2,Genetix, Boston, MA, USA). Positive (pNubWT-2 yeast transfor-mant), negative (empty NubG vector yeast transformant), andblank (no yeast cells) controls were also included at selectedwells in the arrayed library. After 2-days of growth at 28˚C, theNubG library was pinned onto solid YPD OmniTray plates (Nunc,Rochester, NY, USA) in a 96-spot format using a 96-pin replicatorand OmniTray copier (Nunc, Rochester, NY, USA). Each of the 147MetYCub constructs to be assayed was grown individually in 10 mlof SC-leu liquid media for 2 days at 28˚C, poured on an OmniTrayplate and pinned onto the YPD Omnitray plates containing thespotted NubG library to allow the formation of diploids betweeneach of the clones of the NubG library (mating type alpha) andthe individual MetYCub clone (mating type a). After 10–12 h ofgrowth, the YPD Omnitray plates were first replica-pinned to ster-ile water-filled 96-well microtiter plates and then replicated toSC-leu-ura-trp 96-well microtiter plates to select the diploids.
Interactions among protein pairs in the diploids were initiallymonitored by measuring the ability to grow in SC medium lackinghistidine as a consequence of induction of the HIS3 reporter. Thediploid library was tested in duplicate containing 0 or 250 μMmethionine to modulate the expression of the Cub-ORF fusionprotein. Growth rates were quantitatively determined for eachof the diploids by measuring the OD595 after 3, 4, and 5 days ofincubation using a microplate reader (Bio-Rad model 550, Her-cules, CA, USA). After the statistical analysis of the growth curves,diploids that showed an OD595 >0.2 after 3, 4, or 5 days of incu-bation were considered as positive interaction pairs and selectedfor further analyses.
STATISTICAL DETERMINATION OF FALSE POSITIVE PROTEININTERACTIONOptical density values were normalized within in each plate, andfor each Nub clone across the plates. The median and inter-quartilerange of the optical density were taken as a robust measure of theaverage and dispersion, respectively. These were used to calcu-late z-scores, and raw p-values were obtained from the standardnormal distribution. For each protein pair under each methioninetreatment, a false discovery rate (FDR) value that took into account
www.frontiersin.org June 2012 | Volume 3 | Article 124 | 3
Chen et al. Uncovering Arabidopsis membrane protein interactome
all of the 52310 concurrent hypotheses was then calculated usingthe Bonferroni correction (Strassburger and Bretz, 2008). Interac-tion pairs with FDR values of less than 0.05 were selected for thePRIMARY-NET.
Typically an FDR threshold of 0.05 is used to identify positiveinteractions in high-throughput interaction studies (Verhoevenet al., 2005; Hesselberth et al., 2009). However, with this classicalyet arbitrary threshold, PRIMARY-NET might still have significantnumbers of false positives (∼100). The edge-node ratio (5.13) issignificantly higher than any known interaction networks, e.g.,Saccharomyces cerevisiae (3.26), Drosophila melanogaster (3.08),and Caenorhabditis elegans (1.54; data obtained from BIND; Baderet al., 2003), suggesting that the false positives in the data mightaffect the topology of the network. Therefore, we reasoned that amore stringent FDR threshold should be applied to filter out morefalse positive interactions.
To determine the FDR threshold that maximally separates trueand false positive interactions, we defined a reference networkcalled REF-NET that is more reliable than PRIMARY-NET as fol-lows. First, we reasoned that REF-NET should be much smallerthan PRIMARY-NET. We defined an interaction with FDR valuessmaller than 0.05 under both high and low methionine condi-tions to belong to REF-NET. After determining the REF-NET, wegradually reduced the FDR thresholds from 0.05 to 0 for bothREF-NET and PRIMARY-NET until their rates of reduction inthe number of interactions became indistinguishable. We rea-soned that with the decreasing FDR threshold, if the two networkshad similar false positive rates, their rates of reduction in thetotal number of interactions should also be similar. The largestFDR value at which the rates first became indistinguishable waschosen as the FDR threshold. Figure S1 in Supplementary Mate-rial shows that from FDR value 10−4 the network sizes startedto change similarly. Therefore, by setting the FDR threshold at10−4, we split PRIMARY-NET to SIG-NET (significant network)and NSE-NET (non-significant network). We then applied differ-ent strategies on SIG-NET and NSE-NET to further detect falsepositive interactions using classification models.
CLASSIFICATION MODELSGeneration of training setsTo train a classification model, we used a set of training data thatincluded known interactions (positive training data) and a setof protein pairs that are not likely to physically interact (neg-ative training data). To compose the positive training data, wefirst included 1831 interactions between 1048 Arabidopsis pro-teins curated from the literature, BIND (Bader et al., 2003), andIntAct (Kerrien et al., 2007) databases (Table S2 in Supplemen-tary Material). Since most of the curated interactions were foundto occur between soluble proteins, we also added 97 interactionsdetected in the first mbSUS with FDR values smaller than 10−8
and were positive in both methionine concentrations (all 4 tests) tothe positive training set (GOLD-NET, Table S3 in SupplementaryMaterial). We randomly sampled 10 interactions for individualtests and treated the rest 87 interactions as part of positive train-ing data. In summary, we composed the positive training set with1831 interactions from the literature and 97 interactions from thefirst mbSUS. We cross-validated the models using 10 randomly
sampled interactions from GOLD-NET. The negative training setwas composed of randomly selected pairs between the 412 Nubsand 147 Cubs that were tested, and whose FDR values were greaterthan or equal to 0.05. A total of 100 independent negative trainingsets were generated, in which each set had the same number ofinteractions as the positive training set.
Feature collection and selectionBased on the guilt-by-association rule, an interaction is likely ifboth of the proteins are involved in the same biological process,and an interaction is unlikely if the proteins are involved in differ-ent processes. Hence we collected biological characteristics of theproteins to compose the feature space of the classification models.First, topology analysis of protein interaction networks shows thattrue interactions fit the pattern of a small-world network whilefalse interactions are distributed randomly in the network (Borket al., 2004). Therefore, we reasoned that the local cohesiveness foreach interaction could be used to distinguish true and false positiveinteractions. We used topological measures that determine overlapbetween two sets of data in our classification model. Given a pro-tein interaction interaction (a, b) with proteins a and b, let A be theset of neighbors of protein a and B be the set of neighbors of pro-tein b. We then calculated the overlap between A and B using theabove topological measures. Interaction (a, b) was deemed morelikely if A and B had a higher overlap. We used several overlapmeasures in this study: Jaccard index, meet/min, geometric, hyper-geometric, and Czekanowski–Dice distance (Brun et al., 2003; Tanet al., 2005). The first four measures determine the extent of over-lap between two data sets whereas Czekanowski–Dice distancetests the dissimilarity between two sets.
Second, various kinds of biological features of protein interac-tions were collected, including domain–domain interaction fromDIMA (Pagel et al., 2006), similarity scores based on Gene Ontol-ogy (GO; Ashburner et al., 2000) function annotation, GO processannotation and Plant Ontology (PO) annotation (Avraham et al.,2008),gene expression correlation in 36 separate experiments fromTAIR (Lamesch et al., 2012)2, and overall gene expression correla-tion from ATTED II database (Obayashi et al., 2009). We used theoverall mutual rank (MR) and Pearson’s correlation scores fromATTED II as two of the 48 features. These scores were computed byATTED II based on 1388 microarray data collected from severalrepositories, including ArrayExpress, Gene Expression Omnibus(GEO) and the Center for Information Biology Gene ExpressionDatabase (CIBEX; Obayashi and Kinoshita, 2010). Details aboutnormalization and correlation performed at ATTED II can befound on their website3. Since many gene pairs with low corre-lation scores are functionally relevant (Obayashi et al., 2009), weused all of the correlation values for the training and testing of theclassification models without setting a specific threshold.
In total, 48 features were collected. We evaluated each fea-ture by considering its predictive ability, along with the degree ofredundancy between them. Domain–domain interaction was themost important feature, followed by the similarity scores basedon GO function and process annotations, and the topological
2ftp://ftp.arabidopsis.org/home/tair/Microarrays/analyzed_data/3http://atted.jp/help/coex_cal.shtml
Frontiers in Plant Science | Plant Physiology June 2012 | Volume 3 | Article 124 | 4
Chen et al. Uncovering Arabidopsis membrane protein interactome
feature using Czekanowski–Dice distance (Table S4 in Supple-mentary Material). PO annotation similarity was not critical tothe classification due to too many missing values.
Classification modelsWe adopted data mining software Weka (Hall et al., 2009) to applyclassifiers to our data. To select the most appropriate classificationmodel, we tested 12 different types of classification models belong-ing to four different categories and adopted meta-classificationmethods (including bagging and boosting) to further improvetheir performance (Table S5 in Supplementary Material). Thesefour categories are decision tree or decision rule, logistic regres-sion, SVM, and Bayesian network implemented in Weka (Hallet al., 2009). To evaluate classification performance, we adoptedthe biased F-measure (Li et al., 2008). In our study, b (thebias parameter) was set to 0.5 to emphasize the importance ofprecision.
F(b) = (1 + b) × Precision × Recall
b × Precision + Recall
We tested performance of each model by adjusting each model’sparameters with cross-validation and then further optimizingeach model by boosting and bagging (Breiman, 1996; Freund andSchapire, 1996). Since the best model in each category had similarperformance, rather than adopting one model that had the bestperformance (Table S5 in Supplementary Material), we set up avoting system using the best classifiers in each of the categories.The models that were included in the voting are: boosted AD-tree(Keerthi et al., 2001), boosted logistic (le Cessie and van Houwelin-gen, 1992), bagged BayesNet (Hall et al., 2009), SMO with pukkernel (Keerthi et al., 2001), and LibSVM with RBF kernel (Changand Lin, 2011). Two SVM models were used since SVM is par-ticularly suitable for high dimensional data. For boosted AD-tree,we only used the top four features by considering predictability ofeach feature along with the degree of redundancy between them,because tree-based models can easily be over-fitted if there are toomany features. For the other classification models, we used all thefeatures.
From the 1949 interactions in the PRIMARY-NET, 826 wereclassified as potential positive interactions and were selected asDRAFT-NET.
SECOND mbSUS INTERACTION ASSAYSConditions and interaction assaysIn the second mbSUS, we tested all 826 interactions from DRAFT-NET,a randomly selected set of 363 interactions that were classifiedas negative, and a randomly selected set of 347 interactions thatwere statistically negative. Each clone was re-verified for insertidentity by growing the yeast cells at 28˚C overnight, extractingthe plasmid, and sequencing the inserts using standard proto-cols. Confirmed clones were grown in 96-well plates and werere-arrayed into 16 96-well plates for interaction assays using aBioRobot 3000 (Qiagen). These interaction pairs were replica-plated using a colony replicator (Singer RoTor HDA) and testedat three methionine concentrations (0, 150, and 500 μM). Wedetermined the optical density values of two reporter genes LacZ
(blue versus white colonies) and HIS3 (growth versus no growth)as previously described (Lalonde et al., 2010). Each experimentwas repeated eight times (four times per plate and two plates). Intotal, each interaction was tested 48 times (2 types of assays × 3methionine concentrations × 8 replicates).
Interaction data processing and statistical analysisImages of the interaction plates were scanned using a flatbed scan-ner (CanoScan 8400F, Canon) and the intensity of the colonygrowth was quantified using GenePix v6.1 software (MolecularDevices, Sunnyvale, CA, USA) after converting the images to blackand white as described previously (Lalonde et al., 2010). For a givenprotein pair, we obtained medians and inter-quartile ranges fromits 48 mbSUS colony growth intensities with GenePix. The inter-quartile range is calculated by integrating the probability densityfunction of a continuous distribution. These values were used tonormalize the optical density values of the colonies.
We tested each interaction pair four times on the same plate(placed randomly) and two plates at each methionine concentra-tion. We found that variation of the intensities of the coloniesamong the replicated interaction pairs came mainly from errorsin the image processing by GenePix. Specifically, a strong interac-tion pair with a large interaction colony tended to occupy extraspace in the plate, causing reduced space for an adjacent colonyto grow, or worse, the two adjacent colonies could merge andbe treated as one colony by GenePix. However, the probabilityis low for all the four colonies of the same interaction pair onthe same plate to be adjacent to a large neighbor. Based on thisobservation, we set up an iterative process to remove such noiseas follows. First, we computed mean and coefficient of variation(CV) values for each interaction from the optical density valuesamong all the biological replicates. Most of the interactions hadCV of less than 0.4 (Figures S2 and S3 in Supplementary Mate-rial). For these interactions with low CV, the mean values weresaved as interaction likelihood values. Otherwise, we repeatedlyremoved an optical density value that was most distant fromthe mean and recomputed CV based on the updated mean andstandard deviation. The process stopped when the new CV wasbelow the threshold or there were only two optical density valuesleft.
Distribution of the interaction likelihood values was bimodalfor all three methionine treatments with a clear separation betweenthe modes as expected (Figure S4 in Supplementary Material). Fora bimodal distribution, to separate positive colonies from the back-ground, negative colonies, we determined the threshold betweenthe two peaks with the following k-means likelihood method(Choi et al., 2004). First, we chose a threshold randomly that sepa-rated the dataset into two non-empty parts. Second, we computedthe centers of the two parts, which were the two center points withmean values on each side. Third, we updated the threshold to bethe value that had the same distance from the two center points.Finally, we iterated the steps until the algorithm converged. Thethresholds we used for different assays are listed in Table S6 inSupplementary Material. Only the colonies with optical densityvalues greater than the threshold (labeled as 1) were labeled astrue interactions and the rests were labeled as false interactions(labeled as −1 or 0).
www.frontiersin.org June 2012 | Volume 3 | Article 124 | 5
Chen et al. Uncovering Arabidopsis membrane protein interactome
Finally, we employed a voting system to integrate the likeli-hood values of each interaction under all conditions to constructthe final interaction network. We considered an interaction to bestrong if the tests for interaction in both 500 μM and at leastone 150 μM methionine concentrations were positive. We con-sidered an interaction to be weak if the tests in only the 0 μMmethionine were positive. Finally we considered an interaction tobe likely if at least one test was positive and the other tests werenot negative. Most of the interactions were identified as strong(214) or weak (252); only 75 interactions were called as likely.In total, 541 interactions were labeled as positive (in which 532interactions are unique), 887 interactions were labeled as negative,and 108 interactions were labeled as unknown by a vote of all theexperiments.
TOPOLOGICAL AND FUNCTIONAL CHARACTERIZATION OF THENETWORKAll topological analyses including the distributions of degree,clustering coefficient, shortest path length,and neighborhood con-nectivity were conducted using Cytoscape (2.8.2; Smoot et al.,2011) and its NetworkAnalyzer plug-in (Smoot et al., 2011). GeneOntology (GO) enrichment analysis was performed using agriGO(Du et al., 2010). GO enrichment visualization was performedusing REVIGO (Supek et al., 2011). To determine whether thepairs in the final network were more functionally similar than bychance, GO annotation and co-expression data were downloadedfrom TAIR (Lamesch et al., 2012) and ATTED II (Obayashi et al.,2009). To compare the similarities to random networks, we ran-domized the nodes 100 times. To find enriched network motifs ina network that combines physical interactions and co-function, wecombined AraNet (Lee et al., 2010) and PAIR (Lin et al., 2011) withour network. We used FANMOD (Wernicke and Rasche, 2006) todetect enriched motifs and MAVisto (Schreiber and Schwobber-meyer, 2005) to visualize the genes with the motifs. Transporterfamily analysis was carried out using family annotations fromTransportDB (Ren et al., 2007).
RESULTSWe developed a system to effectively identify a high quality mem-brane interaction network among 414 Arabidopsis membraneand signaling proteins. Our procedure has three steps: (i) test-ing mbSUS on all possible protein pairs with a few replicates; (ii)applying statistical and data mining models to remove interactionsthat are likely to be false positive; and (iii) retesting mbSUS on thecandidate interactions with multiple replicates and assays for falsepositive detection.
FIRST mbSUS-BASED PROTEIN INTERACTION ASSAYIn the first run of mbSUS, we tested 412 Nub fusion proteinsagainst 147 Cub fusion proteins for interaction in duplicate at 0or 250 μM methionine, resulting in 52310 putative interactions(Table S7 in Supplementary Material). Of these, 145 proteins weretested both as Nub and Cub clones, 267 as Nub clones only, and 2protein as Cub clone only. There were fewer Cub than Nub clonesbecause fusion of the TF to the Cub domain for marker detec-tion precludes soluble proteins to be fused with the Cub domain.In addition, Cub fusion proteins were removed from being tested
for interaction if they gave reporter activation in the absence of aninteraction partner. The 414 proteins we tested for interaction wereenriched in transport and signaling proteins; 340 are membraneproteins and 315 are involved in transport. These proteins areinvolved in diverse processes including metabolism (27%), proteinmodification (9%), response to abiotic or biotic stimulus (26%),signal-transduction (14%), and development (12%; Table S8 inSupplementary Material).
To identify both strong and weak interactions, two methionineconcentrations were applied to control the expression level of thefusion proteins. One of the two constructs, the Cub fusions, uses amethionine-repressible MET25 promoter. At high (e.g., 250 μM)methionine concentrations, the expression of the genes is reduced,favoring the detection of stronger interactions. Decreasing theamount of methionine in the media increases the expression leveland decreases the stringency; allowing weaker interactions to bedetected.
We took the normalized optical density values for each inter-action as a measure of the significance of interaction. We calcu-lated an FDR for each protein pair tested under each methionineconcentration using the Bonferroni correction (Strassburger andBretz, 2008; Table S7 in Supplementary Material). We removedthe interactions whose FDR values ≥0.05 under both high andlow methionine treatments. In addition, we removed 21 stickyproteins that interacted with most proteins (Table S9 in Sup-plementary Material). In total, 50361 (96.3%) interactions wereremoved. We also removed 13 proteins that did not interact withany protein (Table S9 in Supplementary Material). The remain-ing 1949 interactions were between 380 proteins. We called thisnetwork PRIMARY-NET (Figure 1; Table S10 in SupplementaryMaterial).
COMPUTATIONAL PREDICTION OF FALSE POSITIVE PROTEININTERACTIONWe employed a voting system from the best performing classifica-tion models to further remove false positive interactions in bothnetworks. The PRIMARY-NET interactions were divided into twodatasets based on the FDR values: SIG-NET (FDR <10−4) andNSE-NET (0.05 > FDR > 10−4). SIG-NET had 931 interactionsand NSE-NET 1018 interactions (Tables S11 and S12 in Sup-plementary Material). Because SIG-NET was more reliable thanNSE-NET based on the statistical analysis, we employed a morestringent rule for detecting false positives in SIG-NET where aninteraction was classified to be false positive if all the classifierspredicted it to be false positive. Otherwise, the interaction wassubjected to the second run of mbSUS. In NSE-NET, since it wasconsidered less reliable than SIG-NET, we marked an interactionas false positive if four out of five classifiers predicted it to be falsepositive.
We obtained 826 interactions (524 and 302 interactions fromSIG-NET and NSE-NET) that were classified as positive (DRAFT-NET) and 1123 interactions that were classified as negative (NEG-ATIVE; Figure 1). We tested the classification model by randomlyhiding 10 interactions from the GOLD-NET and predicting theirlabels with our model. Eight out of 10 were predicted to be trueby at least four classifiers, the other two were predicted to be trueby 2–3 classifiers.
Frontiers in Plant Science | Plant Physiology June 2012 | Volume 3 | Article 124 | 6
Chen et al. Uncovering Arabidopsis membrane protein interactome
SECOND mbSUS PROTEIN INTERACTION ASSAYIn order to test the performance of the statistical and classificationmethods and to derive a more accurate protein interaction map,we tested three types of interaction data from the previous run inthe second mbSUS assay: (i) 826 interactions that were tested pos-itive from both the statistical and classification tests (DRAFT-NETin Figure 1); (ii) 363 interactions that were statistically significantbut were classified to be false positive by our classification mod-els (a random subset of NEGATIVE in Figure 1); and (iii) 347interactions from RAW-NET that were not statistically significant(FDR values were greater than but close to 0.05). In total, we tested1536 interactions in the second run of mbSUS. Since the numberof interactions is much smaller than the first run (52310), it waspossible to apply multiple biological replicates and test them underseveral methionine concentrations.
We obtained the FINAL-NET with 541 (532 unique) interac-tions between 239 proteins (Table S13 in Supplementary Material).This network contained 214 strong interactions (positive in both500 μM methionine and at least one 150 μM methionine condi-tions), 252 weak interactions (positive only in both 0 μM methio-nine condition) and 75 additional interactions that were positivein at least one condition and were classified as neither positive nornegative in the other conditions. The FINAL-NET is composedmainly of interactions that were statistically significant and classi-fied as positive (402). In addition, the FINAL-NET contained 42interactions that were statistically significant but classified as nega-tive and 97 interactions that were statistically not significant (FDRnear 0.05; Figure 2). There are 11 proteins shared by the interactionnetwork described by Lalonde et al. (2010) and the FINAL-NET,but none of these 11 proteins interact with each other in either ofthe networks.
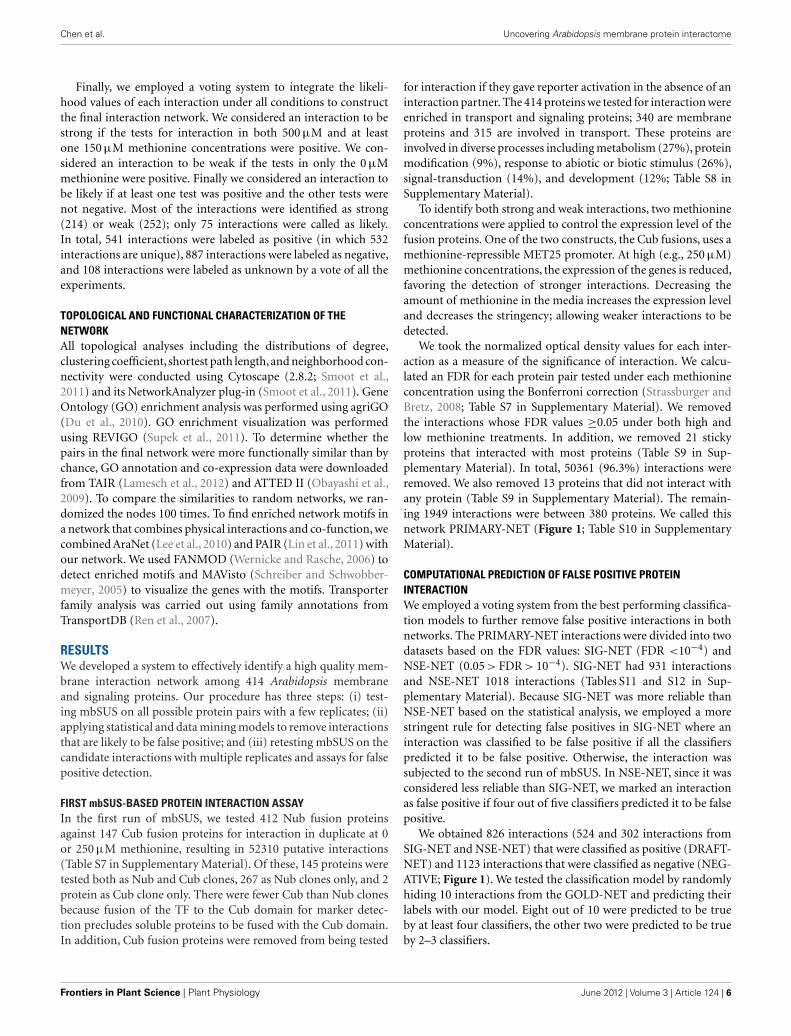
PERFORMANCE OF CLASSIFICATIONWe tested the performance of our system by analyzing the datafrom the second mbSUS assays (Figure 2). We found that theinteractions that were positive from both the statistical and classi-fication tests were enriched in positives and depleted in negativesin the second run compared to those that were tested positive ineither models or neither of the models. Logistic regression of truepositive rate on FDR values from the statistical test also showedthat the statistical test alone was not sufficient to predict pos-itives (p-value = 0.0527, Figure S5 in Supplementary Material).Incorporating classification increased precision significantly (p-value <0.0001, Fisher’s exact test). In summary, classification, inaddition to statistical test, increased the probability of detecting apositive interaction in the second mbSUS.
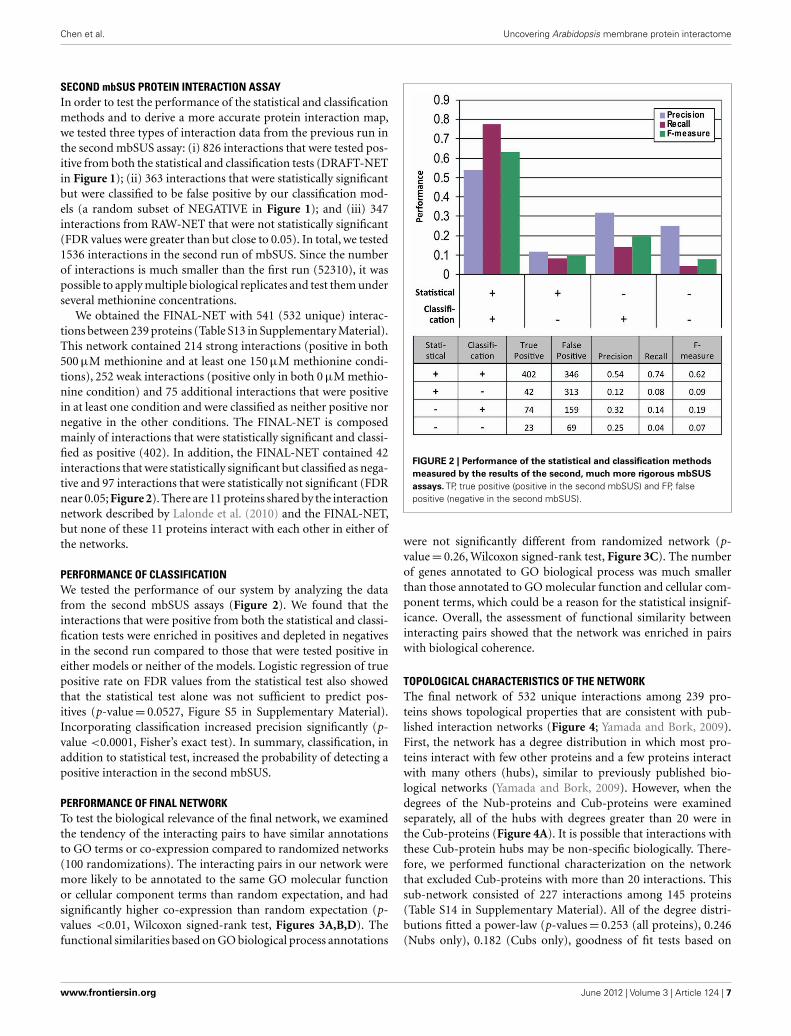
PERFORMANCE OF FINAL NETWORKTo test the biological relevance of the final network, we examinedthe tendency of the interacting pairs to have similar annotationsto GO terms or co-expression compared to randomized networks(100 randomizations). The interacting pairs in our network weremore likely to be annotated to the same GO molecular functionor cellular component terms than random expectation, and hadsignificantly higher co-expression than random expectation (p-values <0.01, Wilcoxon signed-rank test, Figures 3A,B,D). Thefunctional similarities based on GO biological process annotations
FIGURE 2 | Performance of the statistical and classification methods
measured by the results of the second, much more rigorous mbSUS
assays. TP, true positive (positive in the second mbSUS) and FP, falsepositive (negative in the second mbSUS).
were not significantly different from randomized network (p-value = 0.26, Wilcoxon signed-rank test, Figure 3C). The numberof genes annotated to GO biological process was much smallerthan those annotated to GO molecular function and cellular com-ponent terms, which could be a reason for the statistical insignif-icance. Overall, the assessment of functional similarity betweeninteracting pairs showed that the network was enriched in pairswith biological coherence.
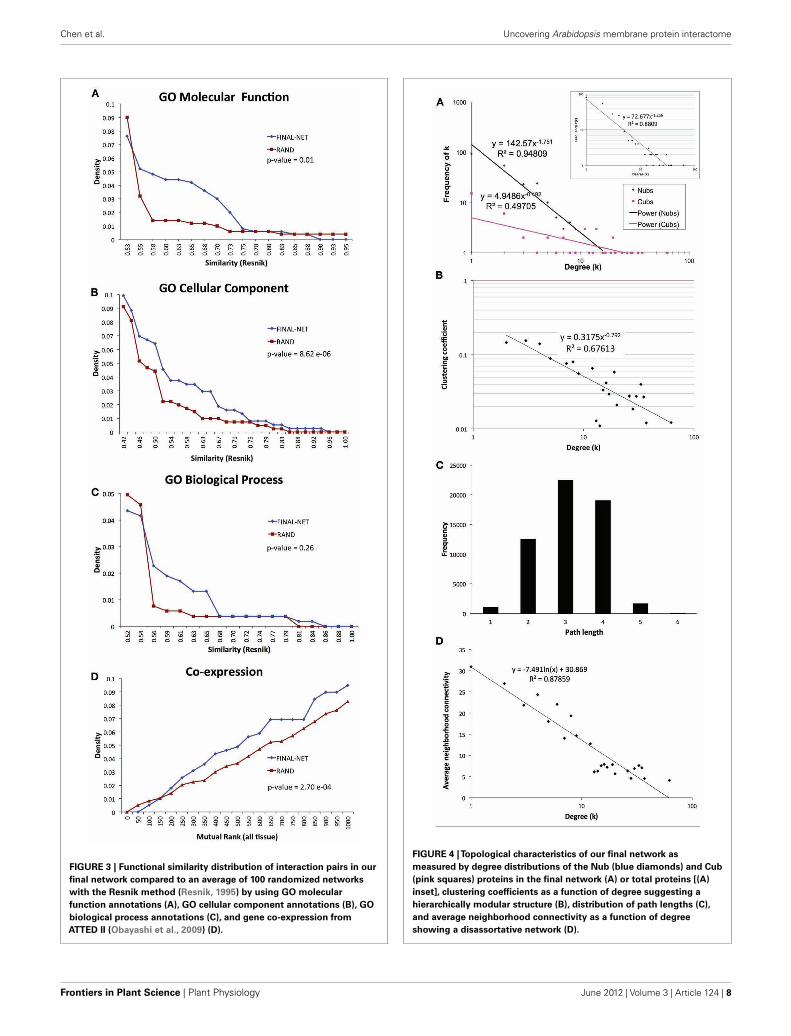
TOPOLOGICAL CHARACTERISTICS OF THE NETWORKThe final network of 532 unique interactions among 239 pro-teins shows topological properties that are consistent with pub-lished interaction networks (Figure 4; Yamada and Bork, 2009).First, the network has a degree distribution in which most pro-teins interact with few other proteins and a few proteins interactwith many others (hubs), similar to previously published bio-logical networks (Yamada and Bork, 2009). However, when thedegrees of the Nub-proteins and Cub-proteins were examinedseparately, all of the hubs with degrees greater than 20 were inthe Cub-proteins (Figure 4A). It is possible that interactions withthese Cub-protein hubs may be non-specific biologically. There-fore, we performed functional characterization on the networkthat excluded Cub-proteins with more than 20 interactions. Thissub-network consisted of 227 interactions among 145 proteins(Table S14 in Supplementary Material). All of the degree distri-butions fitted a power-law (p-values = 0.253 (all proteins), 0.246(Nubs only), 0.182 (Cubs only), goodness of fit tests based on
www.frontiersin.org June 2012 | Volume 3 | Article 124 | 7
Chen et al. Uncovering Arabidopsis membrane protein interactome
FIGURE 3 | Functional similarity distribution of interaction pairs in our
final network compared to an average of 100 randomized networks
with the Resnik method (Resnik, 1995) by using GO molecular
function annotations (A), GO cellular component annotations (B), GO
biological process annotations (C), and gene co-expression from
ATTED II (Obayashi et al., 2009) (D).
FIGURE 4 |Topological characteristics of our final network as
measured by degree distributions of the Nub (blue diamonds) and Cub
(pink squares) proteins in the final network (A) or total proteins [(A)
inset], clustering coefficients as a function of degree suggesting a
hierarchically modular structure (B), distribution of path lengths (C),
and average neighborhood connectivity as a function of degree
showing a disassortative network (D).
Frontiers in Plant Science | Plant Physiology June 2012 | Volume 3 | Article 124 | 8
Chen et al. Uncovering Arabidopsis membrane protein interactome
the Kolmogorov–Smirnov statistic, 1000 randomizations; Clausetet al., 2009).
Second, the network has a diameter (longest shortest pathbetween any two proteins) of 6 and an average path length of 3.14with an average clustering coefficient of 0.079, indicating that it isa small-world network, like most published interaction networks(Barabasi and Oltvai, 2004; Arabidopsis Interactome MappingConsortium, 2011; Figures 4B,C). Third, the average clusteringcoefficient decays logarithmically with increasing degree, suggest-ing a hierarchical organization of topological modules (Barabasiand Oltvai, 2004; Ravasz, 2009; Figure 4B). Finally, distributionof the neighborhood connectivity of a protein indicates that theneighborhood connectivities decrease as the number of neighborsincrease (Figure 4D). This “opposites attract” pattern (called dis-assortativity) is commonly found in physical interaction networks(Yamada and Bork, 2009). In summary, our membrane proteininteraction network has topological properties that are consistentwith other published interaction networks.
FUNCTIONAL CHARACTERISTICS OF THE NETWORKBecause of the possible non-biological specificity of the Cub hubs(Figure 4A), we focused functional analysis on the sub-networkthat excludes the Cubs with more than 20 interactions. This net-work of 227 interactions among 145 proteins is enriched in pro-teins involved in transport, response to environmental signals, andcellular homeostasis (Tables S14 and S15 in Supplementary Mate-rial). Of the 145 proteins, 98 (68%) are annotated as transportersand 122 (84%) are annotated to membrane (TAIR4; Lamesch et al.,2012). In addition to the transporters, the network includes pro-teins that are likely to be involved in signal-transduction suchas kinases, receptors, and G-proteins. Furthermore, the networkincludes proteins localized to other cellular components such asthe cell plate, plasmodesma, and pollen tube.
To determine the extent of overlap between our network andother functional networks, we compared our network with twoco-function networks of Arabidopsis, AraNet (Lee et al., 2010) andPAIR (Lin et al., 2011). Out of the 145 proteins in our network,116 and 54 genes were found in AraNet and PAIR, respectively.There were 277 and 58 interactions among these proteins in AraNetand PAIR. However, only two interactions in AraNet and none inPAIR were found in our protein interaction network, underscor-ing the fact that these inferred co-function networks are devoid ofmembrane protein interaction data.
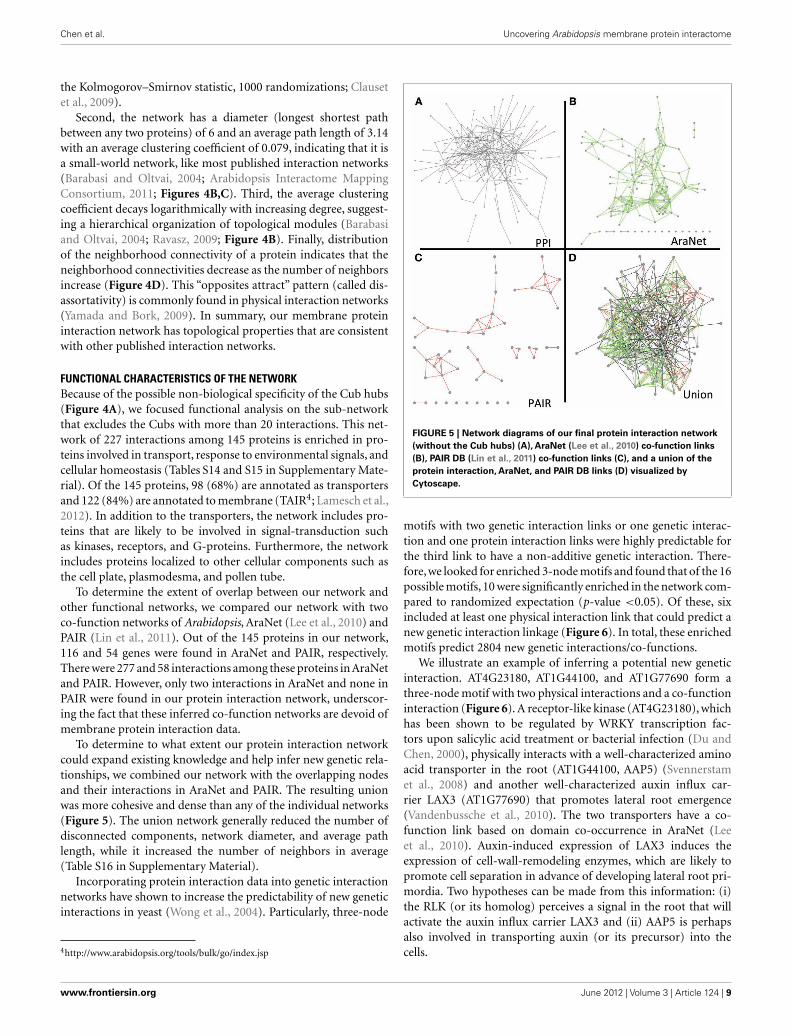
To determine to what extent our protein interaction networkcould expand existing knowledge and help infer new genetic rela-tionships, we combined our network with the overlapping nodesand their interactions in AraNet and PAIR. The resulting unionwas more cohesive and dense than any of the individual networks(Figure 5). The union network generally reduced the number ofdisconnected components, network diameter, and average pathlength, while it increased the number of neighbors in average(Table S16 in Supplementary Material).
Incorporating protein interaction data into genetic interactionnetworks have shown to increase the predictability of new geneticinteractions in yeast (Wong et al., 2004). Particularly, three-node
4http://www.arabidopsis.org/tools/bulk/go/index.jsp
FIGURE 5 | Network diagrams of our final protein interaction network
(without the Cub hubs) (A), AraNet (Lee et al., 2010) co-function links
(B), PAIR DB (Lin et al., 2011) co-function links (C), and a union of the
protein interaction, AraNet, and PAIR DB links (D) visualized by
Cytoscape.
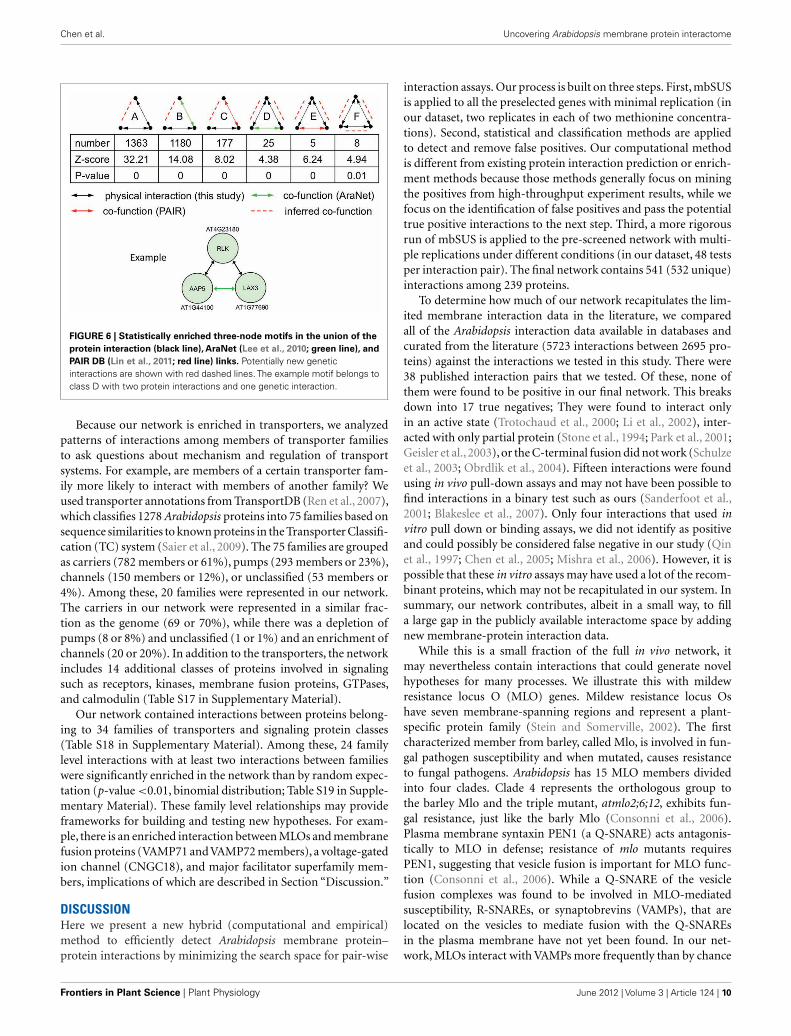
motifs with two genetic interaction links or one genetic interac-tion and one protein interaction links were highly predictable forthe third link to have a non-additive genetic interaction. There-fore, we looked for enriched 3-node motifs and found that of the 16possible motifs, 10 were significantly enriched in the network com-pared to randomized expectation (p-value <0.05). Of these, sixincluded at least one physical interaction link that could predict anew genetic interaction linkage (Figure 6). In total, these enrichedmotifs predict 2804 new genetic interactions/co-functions.
We illustrate an example of inferring a potential new geneticinteraction. AT4G23180, AT1G44100, and AT1G77690 form athree-node motif with two physical interactions and a co-functioninteraction (Figure 6). A receptor-like kinase (AT4G23180), whichhas been shown to be regulated by WRKY transcription fac-tors upon salicylic acid treatment or bacterial infection (Du andChen, 2000), physically interacts with a well-characterized aminoacid transporter in the root (AT1G44100, AAP5) (Svennerstamet al., 2008) and another well-characterized auxin influx car-rier LAX3 (AT1G77690) that promotes lateral root emergence(Vandenbussche et al., 2010). The two transporters have a co-function link based on domain co-occurrence in AraNet (Leeet al., 2010). Auxin-induced expression of LAX3 induces theexpression of cell-wall-remodeling enzymes, which are likely topromote cell separation in advance of developing lateral root pri-mordia. Two hypotheses can be made from this information: (i)the RLK (or its homolog) perceives a signal in the root that willactivate the auxin influx carrier LAX3 and (ii) AAP5 is perhapsalso involved in transporting auxin (or its precursor) into thecells.
www.frontiersin.org June 2012 | Volume 3 | Article 124 | 9
Chen et al. Uncovering Arabidopsis membrane protein interactome
FIGURE 6 | Statistically enriched three-node motifs in the union of the
protein interaction (black line), AraNet (Lee et al., 2010; green line), and
PAIR DB (Lin et al., 2011; red line) links. Potentially new geneticinteractions are shown with red dashed lines. The example motif belongs toclass D with two protein interactions and one genetic interaction.
Because our network is enriched in transporters, we analyzedpatterns of interactions among members of transporter familiesto ask questions about mechanism and regulation of transportsystems. For example, are members of a certain transporter fam-ily more likely to interact with members of another family? Weused transporter annotations from TransportDB (Ren et al., 2007),which classifies 1278 Arabidopsis proteins into 75 families based onsequence similarities to known proteins in the Transporter Classifi-cation (TC) system (Saier et al., 2009). The 75 families are groupedas carriers (782 members or 61%), pumps (293 members or 23%),channels (150 members or 12%), or unclassified (53 members or4%). Among these, 20 families were represented in our network.The carriers in our network were represented in a similar frac-tion as the genome (69 or 70%), while there was a depletion ofpumps (8 or 8%) and unclassified (1 or 1%) and an enrichment ofchannels (20 or 20%). In addition to the transporters, the networkincludes 14 additional classes of proteins involved in signalingsuch as receptors, kinases, membrane fusion proteins, GTPases,and calmodulin (Table S17 in Supplementary Material).
Our network contained interactions between proteins belong-ing to 34 families of transporters and signaling protein classes(Table S18 in Supplementary Material). Among these, 24 familylevel interactions with at least two interactions between familieswere significantly enriched in the network than by random expec-tation (p-value <0.01, binomial distribution; Table S19 in Supple-mentary Material). These family level relationships may provideframeworks for building and testing new hypotheses. For exam-ple, there is an enriched interaction between MLOs and membranefusion proteins (VAMP71 and VAMP72 members), a voltage-gatedion channel (CNGC18), and major facilitator superfamily mem-bers, implications of which are described in Section “Discussion.”
DISCUSSIONHere we present a new hybrid (computational and empirical)method to efficiently detect Arabidopsis membrane protein–protein interactions by minimizing the search space for pair-wise
interaction assays. Our process is built on three steps. First, mbSUSis applied to all the preselected genes with minimal replication (inour dataset, two replicates in each of two methionine concentra-tions). Second, statistical and classification methods are appliedto detect and remove false positives. Our computational methodis different from existing protein interaction prediction or enrich-ment methods because those methods generally focus on miningthe positives from high-throughput experiment results, while wefocus on the identification of false positives and pass the potentialtrue positive interactions to the next step. Third, a more rigorousrun of mbSUS is applied to the pre-screened network with multi-ple replications under different conditions (in our dataset, 48 testsper interaction pair). The final network contains 541 (532 unique)interactions among 239 proteins.
To determine how much of our network recapitulates the lim-ited membrane interaction data in the literature, we comparedall of the Arabidopsis interaction data available in databases andcurated from the literature (5723 interactions between 2695 pro-teins) against the interactions we tested in this study. There were38 published interaction pairs that we tested. Of these, none ofthem were found to be positive in our final network. This breaksdown into 17 true negatives; They were found to interact onlyin an active state (Trotochaud et al., 2000; Li et al., 2002), inter-acted with only partial protein (Stone et al., 1994; Park et al., 2001;Geisler et al., 2003), or the C-terminal fusion did not work (Schulzeet al., 2003; Obrdlik et al., 2004). Fifteen interactions were foundusing in vivo pull-down assays and may not have been possible tofind interactions in a binary test such as ours (Sanderfoot et al.,2001; Blakeslee et al., 2007). Only four interactions that used invitro pull down or binding assays, we did not identify as positiveand could possibly be considered false negative in our study (Qinet al., 1997; Chen et al., 2005; Mishra et al., 2006). However, it ispossible that these in vitro assays may have used a lot of the recom-binant proteins, which may not be recapitulated in our system. Insummary, our network contributes, albeit in a small way, to filla large gap in the publicly available interactome space by addingnew membrane-protein interaction data.
While this is a small fraction of the full in vivo network, itmay nevertheless contain interactions that could generate novelhypotheses for many processes. We illustrate this with mildewresistance locus O (MLO) genes. Mildew resistance locus Oshave seven membrane-spanning regions and represent a plant-specific protein family (Stein and Somerville, 2002). The firstcharacterized member from barley, called Mlo, is involved in fun-gal pathogen susceptibility and when mutated, causes resistanceto fungal pathogens. Arabidopsis has 15 MLO members dividedinto four clades. Clade 4 represents the orthologous group tothe barley Mlo and the triple mutant, atmlo2;6;12, exhibits fun-gal resistance, just like the barly Mlo (Consonni et al., 2006).Plasma membrane syntaxin PEN1 (a Q-SNARE) acts antagonis-tically to MLO in defense; resistance of mlo mutants requiresPEN1, suggesting that vesicle fusion is important for MLO func-tion (Consonni et al., 2006). While a Q-SNARE of the vesiclefusion complexes was found to be involved in MLO-mediatedsusceptibility, R-SNAREs, or synaptobrevins (VAMPs), that arelocated on the vesicles to mediate fusion with the Q-SNAREsin the plasma membrane have not yet been found. In our net-work, MLOs interact with VAMPs more frequently than by chance
Frontiers in Plant Science | Plant Physiology June 2012 | Volume 3 | Article 124 | 10
Chen et al. Uncovering Arabidopsis membrane protein interactome
(Table S19 in Supplementary Material). Specifically, we foundMLO4 to interact with two VAMPs, AT1G04760 and AT4G32150.AT1G04760 is a member of the VAMP72-clade involved in secre-tion and AT4G32150 is a member of the VAMP71-clade involvedin late endosomal and vacuolar vesicles (Bassham et al., 2008).Recently MLO4 and MLO11, two members of clade 1, werefound to be required for thigmomorphogenesis in Arabidopsisroot (Chen et al., 2009). MLO4 is localized to plasma mem-brane and endomembranes, suggesting that it may be involvedin endocytotic cycling (Chen et al., 2009). Therefore, our networksuggests that VAMPs may also be involved in root thigmomorpho-genesis by facilitating the endocytotic cycling of MLO4, and thatVAMPs may also interact with MLOs involved in fungal pathogensusceptibility.
Similarly, our network shows that MLOs also interact withvoltage-gated channel (VLC) family more frequently thanexpected (p-value = 1.7622E−05, binomial distribution, Table S19in Supplementary Material). The member of VLC that interactswith MLOs is a cyclic nucleotide-gated channel, CNGC18, whichis required for polarized tip growth of pollen tube (Frietsch et al.,2007). This is intriguing because MLO7, a member of clade 2 sub-mily, is required for pollen tube reception by the synergid cellsin the female gametophyte (Kessler et al., 2010). Its localizationis polarized upon pollen tube entry and this polar localizationrequires the activity of a receptor-like kinase FER. Mutants carry-ing a loss of function allele, fer/fer, are resistant to powdery mildewinfection, indicating conservation of mechanism between pollentube reception and fungal hyphae invasion (Kessler et al., 2010).Our network suggests that CNGCs may interact with MLOs gen-erally and might be involved not only in pollen tube reception butalso in other MLO-mediated processes such as fungal susceptibilityand thigmomorphogenesis.
In summary, our network contains interactions between mem-brane and signaling proteins that may suggest possible mecha-nisms in various biological processes. We highlighted this usingthe MLO family’s interactions, which suggest that there may bea common molecular mechanism involving vesicle fusion andcalcium signaling involved in the perception of a tip growingcell, whether the cell be of a different genotype (pollen tube), adifferent organism (fungal hypha), or a different cell type (rootthigmomorphogenesis).
Caution should be applied that even if these interactions occurin yeast, they might not be relevant in planta because of differ-ential expression, localization, amount, or functional states of theproteins in planta. The interactions in this system only indicatepossible interaction and co-function in planta and the actual inter-actions could take place with a different homolog that is expressedand localized in the right place. The potential interactions in ournetwork represent only a starting point in further investigating theroles and mechanisms of these proteins. Further studies in veri-fying their interactions in planta will be needed to elucidate theirroles in plants.
ACKNOWLEDGMENTSWe are grateful to Sylvain Brohee, Jacques van Helden, and NoahWhitman for their contributions toward initial statistical analysisof the first mbSUS assays. We also thank Brandon Zoeckler for
participating in the curation of protein interactions from the lit-erature. This work was supported in part by grants from Juntade Castilla y León (GR147) and Ministerio de Ciencia y Inno-vación (BIO2008-00194) to Jose Luis Revuelta and grants fromthe National Science Foundation (Arabidopsis2010-0618402 andMCB-1052348) to Seung Y. Rhee and Wolf B. Frommer.
SUPPLEMENTARY MATERIALThe Supplementary Material for this article can be found online at:http://www.frontiersin.org/Plant_Physiology/10.3389/fpls.2012.00124/abstract
Table S1 | A list of 414 proteins that were tested in the first mbSUS assays.
Table S2 | A curated list of 1831 protein interactions from the literature compiledfrom TAIR (Lamesch et al., 2012), IntAct (Kerrien et al., 2007), and BIND (Baderet al., 2003) databases.
Table S3 | High-confidence interactions from the first mbSUS assays, with FDRvalues less than 10−8 and tested positive in both 0 and 250 μM methionine(GOLD-NET).
Table S4 | Feature selection. We evaluated the merit of a subset of features byconsidering the predictive ability of each feature, along with the degree ofredundancy between them.
Table S5 | Classification performance. This table lists all the classificationmodels tested in our study. Five classifiers (boosted AD-tree, boosted logistic,bagged BayesNet, SMO with puk kernel, and LibSVM with RBF kernel) showedthe best performance in each category (highlighted in red).
Table S6 | Thresholds for different mbSUS assays. For a bimodal distribution, toseparate potential positive interactions from noise, we determined thethreshold between the two peaks with a k -means likelihood method.
Table S7 | A list of interaction pairs from the first mbSUS assay, whose FDRvalues are equal to or less than 1 (RAW-NET).
Table S8 | GO annotations of the 414 genes tested in this study.
Table S9 | A list of 21 sticky proteins that interacted with most proteins and 13proteins that did not interact with any protein.
Table S10 | A list of 1949 interactions between 380 proteins from the firstmbSUS assay whose FDR values were less than 0.05 (PRIMARY-NET).
Table S11 | A list of 931 interactions from the first mbSUS assay whose FDRvalues are less than 10−4 (SIG-NET).
Table S12 | A list of 1018 interactions from the first mbSUS assay whose FDRvalues are between 0.05 and 10−4 (NSE-NET).
Table S13 | A list of 541 (532 unique) interactions between 239 proteins thatwere tested positive in the second mbSUS assay (FINAL-NET).
Table S14 | A list of 227 interactions among 145 proteins from FINAL-NET,excluding the interactions with CUB-proteins with greater than 20 interactions.
Table S15 | GO annotations for the 145 proteins in the sub-network that wasanalyzed functionally.
Table S16 | Topological characteristics of overlapping nodes in AraNet, PAIR, andour network.
www.frontiersin.org June 2012 | Volume 3 | Article 124 | 11
Chen et al. Uncovering Arabidopsis membrane protein interactome
Table S17 | Family classification of the 145 proteins in the sub-network that wasanalyzed functionally.
Table S18 | Family classification for each of the 227 interaction pairs.
Table S19 | A list of significantly enriched family level interactions.
Figure S1 | Comparison of number of potential positive interactions in REF-NET(blue) and PRIMARY-NET (red) at different FDR thresholds.
Figure S2 | Distribution of coefficient of variation of the replicates for thesecond mbSUS assays using cell growth in the absence of histidine in differentconcentrations of methionine (MET0 = 0 μM, MET150 = 150 μM,MET500 = 500 μM).
Figure S3 | Distribution of coefficient of variation of the replicatesfor the second mbSUS assays using LacZ reporter gene in differentconcentrations of methionine (MET0 = 0 μM, MET150 = 150 μM,MET500 = 500 μM).
Figure S4 | Distribution of optical density of the interaction pairs in the secondmbSUS assays based on the growth and LacZ reporter assays in differentconcentrations of methionine (MET0 = 0 μM, MET150 = 150 μM,MET500 = 500 μM).
Figure S5 | Logistic regression of the probability of a true positive interaction onthe statistical analysis of the first mbSUS runs. Histograms of the positive andnegative data from the second mbSUS assay are shown on top and bottom,respectively.
REFERENCESArabidopsis Interactome Mapping
Consortium. (2011). Evidence fornetwork evolution in an Arabidopsisinteractome map. Science 333,601–607.
Ashburner, M., Ball, C. A., Blake, J. A.,Botstein, D., Butler, H., Cherry, J. M.,Davis, A. P., Dolinski, K., Dwight, S.S., Eppig, J. T., Harris, M. A., Hill,D. P., Issel-Tarver, L., Kasarskis, A.,Lewis, S., Matese, J. C., Richardson,J. E., Ringwald, M., Rubin, G. M., andSherlock, G. (2000). Gene Ontology:tool for the unification of biology.The Gene Ontology Consortium.Nat. Genet. 25, 25–29.
August, E., and Papachristodoulou,A. (2009). Efficient, sparsebiological network determi-nation. BMC Syst. Biol. 3, 25.doi:10.1186/1752-0509-3-25
Avraham, S., Tung, C. W., Ilic, K.,Jaiswal, P., Kellogg, E. A., Mccouch,S., Pujar, A., Reiser, L., Rhee, S. Y.,Sachs, M. M., Schaeffer, M., Stein,L., Stevens, P., Vincent, L., Zap-ata, F., and Ware, D. (2008). ThePlant Ontology Database: a com-munity resource for plant structureand developmental stages controlledvocabulary and annotations. NucleicAcids Res. 36, D449–D454.
Bader, G. D., Betel, D., and Hogue, C.W. (2003). BIND: the Biomolecu-lar Interaction Network Database.Nucleic Acids Res. 31, 248–250.
Barabasi, A. L., and Oltvai, Z. N. (2004).Network biology: understanding thecell’s functional organization. Nat.Rev. Genet. 5, 101–113.
Barbier-Brygoo, H., Gaymard, F., Rol-land, N., and Joyard, J. (2001).Strategies to identify transport sys-tems in plants. Trends Plant Sci. 6,577–585.
Bassham, D. C., Brandizzi, F., Otegui,M. S., and Sanderfoot, A. A. (2008).“The secretory system of Arabidop-sis,” in The Arabidopsis Book, edsR. Last, C. Chang, D. Kliebenstein,R. McClung, H. Millar, K. Torii,
and D. Wagner (Rockville: AmericanSociety of Plant Biologists), e0116.
Bi, J., and Zhang, T. (2004). Supportvector classification with input datauncertainty. Adv. Neural Inf. ProcessSyst. 17, 161–168.
Blakeslee, J. J., Bandyopadhyay, A., Lee,O. R., Mravec, J., Titapiwatanakun,B., Sauer, M., Makam, S. N., Cheng,Y., Bouchard, R., Adamec, J., Geisler,M., Nagashima, A., Sakai, T., Mar-tinoia, E., Friml, J., Peer, W. A.,and Murphy, A. S. (2007). Interac-tions among PIN-FORMED and P-glycoprotein auxin transporters inArabidopsis. Plant Cell 19, 131–147.
Bork, P., Jensen, L. J., Von Mering, C.,Ramani, A. K., Lee, I., and Mar-cotte, E. M. (2004). Protein interac-tion networks from yeast to human.Curr. Opin. Struct. Biol. 14, 292–299.
Breiman, L. (1996). Bagging predictors.Mach. Learn. 24, 123–140.
Brun, C., Chevenet, F., Martin, D., Woj-cik, J., Guenoche, A., and Jacq, B.(2003). Functional classification ofproteins for the prediction of cellu-lar function from a protein-proteininteraction network. Genome Biol.5, R6.
Chang, C.-C., and Lin, C.-J. (2011). LIB-SVM: a library for support vectormachines. ACM Trans. Intell. Syst.Technol. 2, 1–27.
Chen, Y., Shin, Y. K., and Bassham, D. C.(2005). YKT6 is a core constituentof membrane fusion machineries atthe Arabidopsis trans-Golgi network.J. Mol. Biol. 350, 92–101.
Chen, Z., Noir, S., Kwaaitaal, M., Hart-mann, H. A., Wu, M. J., Mudgil, Y.,Sukumar, P., Muday, G., Panstruga,R., and Jones, A. M. (2009).Two seven-transmembrane domainmildew resistance locus O proteinscofunction in Arabidopsis root thig-momorphogenesis. Plant Cell 21,1972–1991.
Choi, H., Castleman, K. R., and Bovik,A. C. (2004). “Joint segmentationand classification of M-FISH chro-mosome images,” in Proceedings of
the 26th Annual International Con-ference of the IEEE EMBS, SanFrancisco.
Clauset, A., Shalizi, C. R., and Newman,M. E. J. (2009). Power-law distrib-utions in empirical data. SIAM Rev.51, 661–703.
Consonni, C., Humphry, M. E., Hart-mann, H. A., Livaja, M., Durner,J., Westphal, L., Vogel, J., Lipka, V.,Kemmerling, B., Schulze-Lefert, P.,Somerville, S. C., and Panstruga, R.(2006). Conserved requirement fora plant host cell protein in powderymildew pathogenesis. Nat. Genet. 38,716–720.
Cooper, G. F., and Dietterich, T. (1992).A Bayesian method for the inductionof probabilistic networks from data.Mach. Learn. 9, 309–347.
Cortes, C., and Vapnik, V. (1995).Support-vector networks. Mach.Learn. 20, 273–297.
Du, L., and Chen, Z. (2000). Identifi-cation of genes encoding receptor-like protein kinases as possible tar-gets of pathogen- and salicylic acid-induced WRKY DNA-binding pro-teins in Arabidopsis. Plant J. 24, 837–847.
Du, Z., Zhou, X., Ling, Y., Zhang, Z.,and Su, Z. (2010). agriGO: a GOanalysis toolkit for the agriculturalcommunity. Nucleic Acids Res. 38,W64–W70.
Fields, S. (2005). High-throughput two-hybrid analysis. The promise and theperil. FEBS J. 272, 5391–5399.
Freund, Y., and Mason, L. (1999).“The alternating decision tree learn-ing algorithm,” in Proceeding ofthe Sixteenth International Confer-ence on Machine Learning, Bled,124–133.
Freund, Y., and Schapire, R. E. (1996).“Experiments with a new boostingalgorithm,” in Thirteenth Interna-tional Conference on Machine Learn-ing. San Francisco.
Frietsch, S., Wang, Y. F., Sladek, C.,Poulsen, L. R., Romanowsky, S. M.,Schroeder, J. I., and Harper, J. F.
(2007). A cyclic nucleotide-gatedchannel is essential for polarized tipgrowth of pollen. Proc. Natl. Acad.Sci. U.S.A. 104, 14531–14536.
Fusco, C., Guidotti, E., and Zervos,A. S. (1999). In vivo constructionof cDNA libraries for use in theyeast two-hybrid system. Yeast 15,715–720.
Geisler, M., Kolukisaoglu, H. U.,Bouchard, R., Billion, K., Berger,J., Saal, B., Frangne, N., Koncz-Kalman, Z., Koncz, C., Dudler,R., Blakeslee, J. J., Murphy, A.S., Martinoia, E., and Schulz, B.(2003). TWISTED DWARF1, aunique plasma membrane-anchoredimmunophilin-like protein, inter-acts with Arabidopsis multidrugresistance-like transporters AtPGP1and AtPGP19. Mol. Biol. Cell 14,4238–4249.
Hall, M., Frank, E., Holmes, G.,Pfahringer, B., Reutemann, P., andWitten, I. H. (2009). The WEKAdata mining software: an update.SIGKDD Explor. 11, 10–18.
Hesselberth, J. R., Chen, X., Zhang, Z.,Sabo, P. J., Sandstrom, R., Reynolds,A. P., Thurman, R. E., Neph, S.,Kuehn, M. S., Noble, W. S., Fields,S., and Stamatoyannopoulos, J. A.(2009). Global mapping of protein-DNA interactions in vivo by digitalgenomic footprinting. Nat. Methods6, 283–289.
Jansen, R., Yu, H., Greenbaum, D.,Kluger, Y., Krogan, N. J., Chung,S., Emili, A., Snyder, M., Green-blatt, J. F., and Gerstein, M. (2003).A Bayesian networks approach forpredicting protein-protein interac-tions from genomic data. Science302, 449–453.
Jimenez-Sanchez, G., Childs, B., andValle, D. (2001). Human diseasegenes. Nature 409, 853–855.
Johnsson, N., and Varshavsky, A. (1994).Split ubiquitin as a sensor ofprotein interactions in vivo. Proc.Natl. Acad. Sci. U.S.A. 91, 10340–10344.
Frontiers in Plant Science | Plant Physiology June 2012 | Volume 3 | Article 124 | 12
Chen et al. Uncovering Arabidopsis membrane protein interactome
Keerthi, S. S., Shevade, S. K., Bhat-tacharyya, C., and Murphy, K. R.K. (2001). Improvements to Platt’sSMO algorithm for SVM classifierdesign. Neural Comput. 13, 637–649.
Kerrien, S., Alam-Faruque, Y., Aranda,B., Bancarz, I., Bridge, A., Derow,C., Dimmer, E., Feuermann, M.,Friedrichsen, A., Huntley, R., Kohler,C., Khadake, J., Leroy, C., Liban,A., Lieftink, C., Montecchi-Palazzi,L., Orchard, S., Risse, J., Robbe,K., Roechert, B., Thorneycroft, D.,Zhang, Y., Apweiler, R., and Her-mjakob, H. (2007). IntAct – opensource resource for molecular inter-action data. Nucleic Acids Res. 35,D561–D565.
Kessler, S. A., Shimosato-Asano, H.,Keinath, N. F., Wuest, S. E., Ingram,G., Panstruga, R., and Grossniklaus,U. (2010). Conserved molecularcomponents for pollen tube recep-tion and fungal invasion. Science330, 968–971.
Lalonde, S., Ehrhardt, D. W., Loque, D.,Chen, J., Rhee, S. Y., and Frommer,W. B. (2008). Molecular and cellu-lar approaches for the detection ofprotein-protein interactions: latesttechniques and current limitations.Plant J. 53, 610–635.
Lalonde, S., Sero, A., Pratelli, R., Pilot,G., Chen, J., Sardi, M., Parsa, S.,Kim, D., Acharya, B., Stein, E., Hu,H., Villiers, F., Takeda, K., Yang,Y., Han, Y., Schwacke, R., Chiang,W., Kato, N., Loqué, D., Assmann,S., Kwak, J., Schroeder, J., Rhee,S., and Frommer, W. (2010). Amembrane protein/signaling proteininteraction network for Arabidopsis.Front. Plant Physiol. 1, 1–14.
Lamesch, P., Berardini, T. Z., Li, D.,Swarbreck, D., Wilks, C., Sasidharan,R., Muller, R., Dreher, K., Alexan-der, D. L., Garcia-Hernandez, M.,Karthikeyan, A. S., Lee, C. H., Nel-son, W. D., Ploetz, L., Singh, S.,Wensel,A., and Huala, E. (2012). TheArabidopsis information resource(TAIR): improved gene annotationand new tools. Nucleic Acids Res. 40,D1202–D1210.
le Cessie, S., and van Houwelingen, J. C.(1992). Ridge estimators in logisticregression. Appl. Stat. 41, 191–201.
Lee, I., Ambaru, B., Thakkar, P., Mar-cotte, E. M., and Rhee, S. Y. (2010).Rational association of genes withtraits using a genome-scale gene net-work for Arabidopsis thaliana. Nat.Biotechnol. 28, 149–156.
Li, X. Y., Wang, Y.-Y., and Acero, A.(2008). “Learning query intent fromregularized click graphs,” in Proceed-ings of the 31st SIGIR Conference,Singapore.
Li, J., Wen, J., Lease, K. A., Doke, J. T.,Tax, F. E., and Walker, J. C. (2002).BAK1, an Arabidopsis LRR receptor-like protein kinase, interacts withBRI1 and modulates brassinosteroidsignaling. Cell 110, 213–222.
Lin, M., Shen, X., and Chen, X. (2011).PAIR: the predicted Arabidopsisinteractome resource. Nucleic AcidsRes. 39, D1134–D1140.
Miller, J. P., Lo, R. S., Ben-Hur, A.,Desmarais, C., Stagljar, I., Noble,W. S., and Fields, S. (2005). Large-scale identification of yeast inte-gral membrane protein interactions.Proc. Natl. Acad. Sci. U.S.A. 102,12123–12128.
Mishra, G., Zhang, W., Deng, F., Zhao, J.,and Wang, X. (2006). A bifurcatingpathway directs abscisic acid effectson stomatal closure and opening inArabidopsis. Science 312, 264–266.
Mukhtar, M. S., Carvunis, A. R., Dreze,M., Epple, P., Steinbrenner, J., Moore,J., Tasan, M., Galli, M., Hao, T.,Nishimura, M. T., Pevzner, S. J.,Donovan, S. E., Ghamsari, L., San-thanam, B., Romero, V., Poulin, M.M., Gebreab, F., Gutierrez, B. J., Tam,S., Monachello, D., Boxem, M., Har-bort, C. J., Mcdonald, N., Gai, L.,Chen, H., He, Y., Vandenhaute, J.,Roth, F. P., Hill, D. E., Ecker, J. R.,Vidal, M., Beynon, J., Braun, P., andDangl, J. L. (2011). Independentlyevolved virulence effectors convergeonto hubs in a plant immune systemnetwork. Science 333, 596–601.
Obayashi, T., Hayashi, S., Saeki, M.,Ohta, H., and Kinoshita, K. (2009).ATTED-II provides coexpressedgene networks for Arabidopsis.Nucleic Acids Res. 37, D987–D991.
Obayashi, T., and Kinoshita, K. (2010).Coexpression landscape in ATTED-II: usage of gene list and gene net-work for various types of pathways.J. Plant Res. 123, 311–319.
Obrdlik, P., El-Bakkoury, M., Hamacher,T., Cappellaro, C., Vilarino, C., Fleis-cher, C., Ellerbrok, H., Kamuzinzi,R., Ledent, V., Blaudez, D., Sanders,D., Revuelta, J. L., Boles, E., Andre,B., and Frommer, W. B. (2004). K+channel interactions detected by agenetic system optimized for system-atic studies of membrane proteininteractions. Proc. Natl. Acad. Sci.U.S.A. 101, 12242–12247.
Pagel, P., Oesterheld, M., Stumpflen, V.,and Frishman, D. (2006). The DIMAweb resource – exploring the proteindomain network. Bioinformatics 22,997–998.
Park, A. R., Cho, S. K., Yun, U. J., Jin, M.Y., Lee, S. H., Sachetto-Martins, G.,and Park, O. K. (2001). Interactionof the Arabidopsis receptor protein
kinase Wak1 with a glycine-rich pro-tein, AtGRP-3. J. Biol. Chem. 276,26688–26693.
Qin, W., Pappan, K., and Wang, X.(1997). Molecular heterogeneity ofphospholipase D (PLD). Cloning ofPLDgamma and regulation of plantPLDgamma, -beta, and -alpha bypolyphosphoinositides and calcium.J. Biol. Chem. 272, 28267–28273.
Rahim, G., Bischof, S., Kessler, F., andAgne, B. (2009). In vivo interactionbetween atToc33 and atToc159 GTP-binding domains demonstrated in aplant split-ubiquitin system. J. Exp.Bot. 60, 257–267.
Raquet, X., Eckert, J. H., Muller, S.,and Johnsson, N. (2001). Detec-tion of altered protein conforma-tions in living cells. J. Mol. Biol. 305,927–938.
Ravasz, E. (2009). Detecting hierarchi-cal modularity in biological net-works. Methods Mol. Biol. 541,145–160.
Ren, Q., Chen, K., and Paulsen, I.T. (2007). TransportDB: a compre-hensive database resource for cyto-plasmic membrane transport sys-tems and outer membrane channels.Nucleic Acids Res. 35, D274–D279.
Ren, Q., and Paulsen, I. T. (2005).Comparative analyses of funda-mental differences in membranetransport capabilities in prokary-otes and eukaryotes. PLoS Com-put. Biol. 1, e27. doi:10.1371/jour-nal.pcbi.0010027
Resnik, P. (1995). “Using informationcontent to evaluate semantic simi-larity in a taxonomy,” in Proceedingsof the 14th International Joint Confer-ence on Artificial Intelligence (IJCAI).Montreal.
Saier, M. H. Jr., Yen, M. R., Noto, K.,Tamang, D. G., and Elkan, C. (2009).The transporter classification data-base: recent advances. Nucleic AcidsRes. 37, D274–D278.
Sanderfoot, A. A., Kovaleva, V.,Bassham, D. C., and Raikhel, N.V. (2001). Interactions betweensyntaxins identify at least fiveSNARE complexes within theGolgi/prevacuolar system of theArabidopsis cell. Mol. Biol. Cell 12,3733–3743.
Schreiber, F., and Schwobber-meyer, H. (2005). MAVisto: atool for the exploration of net-work motifs. Bioinformatics 21,3572–3574.
Schulze, W. X., Reinders, A., Ward,J., Lalonde, S., and Frommer, W.B. (2003). Interactions between co-expressed Arabidopsis sucrose trans-porters in the split-ubiquitin system.BMC Biochem. 4, 3.
Smoot, M. E., Ono, K., Ruscheinski, J.,Wang, P. L., and Ideker, T. (2011).Cytoscape 2.8: new features for dataintegration and network visualiza-tion. Bioinformatics 27, 431–432.
Stein, M., and Somerville, S. C. (2002).MLO, a novel modulator of plantdefenses and cell death, bindscalmodulin. Trends Plant Sci. 7,379–380.
Stone, J. M., Collinge, M. A., Smith,R. D., Horn, M. A., and Walker,J. C. (1994). Interaction of a pro-tein phosphatase with an Arabidop-sis serine-threonine receptor kinase.Science 266, 793–795.
Strassburger, K., and Bretz, F. (2008).Compatible simultaneous lowerconfidence bounds for the Holmprocedure and other Bonferroni-based closed tests. Stat. Med. 27,4914–4927.
Streinu, I., and Theran, L. (2009). Sparsehypergraphs and pebble game algo-rithms. Eur. J. Combinator. 30,1944–1964.
Supek, F., Bosnjak, M., Skunca, N.,and Smuc, T. (2011). REVIGOsummarizes and visualizes longlists of gene ontology terms. PLoSONE 6, e21800. doi:10.1371/jour-nal.pone.0021800
Svennerstam, H., Ganeteg, U., andNasholm, T. (2008). Root uptake ofcationic amino acids by Arabidopsisdepends on functional expression ofamino acid permease 5. New Phytol.180, 620–630.
Tan, P.-N., Steinbach, M., and Kumar, V.(2005). Introduction to Data Mining.Boston: Addison-Wesley Press.
Trotochaud, A. E., Jeong, S., and Clark,S. E. (2000). CLAVATA3, a mul-timeric ligand for the CLAVATA1receptor-kinase. Science 289, 613–617.
Vandenbussche, F., Petrasek, J., Zad-nikova, P., Hoyerova, K., Pesek,B., Raz, V., Swarup, R., Bennett,M., Zazimalova, E., Benkova, E.,and van der Straeten, D. (2010).The auxin influx carriers AUX1and LAX3 are involved in auxin-ethylene interactions during api-cal hook development in Arabidop-sis thaliana seedlings. Development137, 597–606.
Verhoeven, K., Simonsen, K., andMcintyre, L. (2005). Implement-ing false discovery rate control:increasing your power. Oikos 108,643–647.
Vlasblom, J., and Wodak, S. J. (2009).Markov clustering versus affinitypropagation for the partitioningof protein interaction graphs.BMC Bioinformatics 10, 99.doi:10.1186/1471-2105-10-99
www.frontiersin.org June 2012 | Volume 3 | Article 124 | 13
Chen et al. Uncovering Arabidopsis membrane protein interactome
Wernicke, S., and Rasche, F. (2006).FANMOD: a tool for fast networkmotif detection. Bioinformatics 22,1152–1153.
Wong, S. L., Zhang, L. V., Tong,A. H., Li, Z., Goldberg, D. S.,King, O. D., Lesage, G., Vidal, M.,Andrews, B., Bussey, H., Boone,C., and Roth, F. P. (2004). Com-bining biological networks to pre-dict genetic interactions. Proc. Natl.Acad. Sci. U.S.A. 101, 15682–15687.
Yamada, T., and Bork, P. (2009). Evo-lution of biomolecular networks:lessons from metabolic and proteininteractions. Nat. Rev. Mol. Cell Biol.10, 791–803.
Conflict of Interest Statement: Theauthors declare that the research wasconducted in the absence of any com-mercial or financial relationships thatcould be construed as a potential con-flict of interest.
Received: 22 February 2012; paper pend-ing published: 29 March 2012; accepted:24 May 2012; published online: 21 June2012.Citation: Chen J, Lalonde S, Obrd-lik P, Noorani Vatani A, Parsa SA,Vilarino C, Revuelta JL, Frommer WBand Rhee SY (2012) Uncovering Ara-bidopsis membrane protein interactomeenriched in transporters using mating-based split ubiquitin assays and classifica-tion models. Front. Plant Sci. 3:124. doi:10.3389/fpls.2012.00124
This article was submitted to Frontiers inPlant Physiology, a specialty of Frontiersin Plant Science.Copyright © 2012 Chen, Lalonde, Obrd-lik, Noorani Vatani, Parsa, Vilarino,Revuelta, Frommer and Rhee. This is anopen-access article distributed under theterms of the Creative Commons Attribu-tion Non Commercial License, which per-mits non-commercial use, distribution,and reproduction in other forums, pro-vided the original authors and source arecredited.
Frontiers in Plant Science | Plant Physiology June 2012 | Volume 3 | Article 124 | 14