uncovering the futrex-6100xl ... -...
TRANSCRIPT
Journal of Medical Engineering & Technology, 2012; Early Online: 1–7© 2012 Informa UK, Ltd.ISSN 0309-1902 print/ISSN 1464-522X onlineDOI: 10.3109/03091902.2012.708382
Based on the near infra-red (NIR) interactance method, the FUTREX company has developed a series of instruments, for the estimation of the body fat percentage (%BF). %BF is estimated through prediction equations incorporated in the instruments, which for the newest models (FUTREX-6100XL and FUTREX-6100A/ZL) are proprietary and they are not published anywhere. This missing knowledge may lead to several misunderstandings and confusion and degrades those instruments to ‘black boxes’. The present work uncovers and presents the prediction equation of FUTREX-6100/XL and discusses the contribution of each term of that equation to the %BF. Furthermore, this study presents the method used, which can be used to uncover equations incorporated in other instruments. This method is based on the idea of firstly uncovering the dependence of the equation on each parameter separately and then combining those dependencies to uncover the unknown equation.
Keywords: Body composition, FUTREX, Near infra-red interactance, Prediction equation, Body fat
Introduction
Two decades ago, the known field methods for estimating the body fat percentage (%BF) were the skin-fold (SKF) [1] method and the bioelectric impedance analysis (BIA) [2]. Over the last two decades a new field method has been pro-posed for estimating the %BF, which is the so-called near infra-red (NIR) interactance method [3].
NIR interactance method is based on the absorption of the NIR light from the BF and the body water. Conway et al. [4] reported that two different absorption peaks appear for water and fat, at 970 nm and 930 nm, respectively, and that the shape of the absorption profile at those wavelengths is
related to the amount of fat and water of the human tissue being measured. Based on this, FUTREX company devel-oped an instrument–device which measures the optical density (i.e. the absorbance) at selective NIR wavelengths, as light travels from the skin through the biceps to the bone and back.
The NIR interactance method is more convenient com-pared to the BIA and SKF methods. For example, according to the protocol of the BIA method, the patient must not have eaten any food for the last 12 h and must not have drunk any alcohol for the last 24 h before the measurement [3]. According to the protocols of the SKF method, skin-folds have to be measured at several places of the body, for some of which the patient has to be undressed. Since those mea-surements have low reproducibility, many measurements must be taken in order to achieve an acceptable estima-tion, which makes the method time-consuming. In addi-tion, SKF measurements must be taken by someone who has the skills. Otherwise there is a high possibility that the measurements will be wrong. On the other hand, the NIR interactance method is easy, fast, without special restric-tions for the patient, its estimations are reproducible and measurements can easily be taken, even by inexperienced personnel. Consequently, the NIR method is very useful for day-by-day clinical work. Furthermore, its high reproduc-ibility [3] makes it a very useful method for recording cred-ible changes in %BF.
In order to estimate the %BF values, the optical densities (ODs) at specific NIR wavelengths are recorded, while other parameters such as Height, Weight, Age and Sex are also taken into account.
The first FUTREX model, FUTREX-5000, measured the optical densities (ODs) at two wavelengths (940 nm and 950 nm) and used an equation of the form
RESEARCH ARTICLE
Uncovering the FUTREX-6100XL prediction equation for the percentage body fat
Zacharias G. Fthenakis1,2, Dimitra Balaska1, and Vassilis Zafiropulos1
1Laboratory of Applied Physics and Measurement of Human Body Composition, Department of Nutrition and Dietetics, Technological Educational Institute of Crete, Tripitos, Sitia, Crete, GR72300, Greece and 2Physics and Astronomy Department, Michigan State University, East Lansing, Michigan, USA
Correspondence: Zacharias G. Fthenakis, Laboratory of Applied Physics and Measurement of Human Body Composition, Department of Human Nutrition and Dietetics, Technological Educational Institute of Crete, Tripitos, Sitia, Crete, GR72300, Greece. E-mail: [email protected]
Journal of Medical Engineering & Technology
2012
00
00
1
7
© 2012 Informa UK, Ltd.
10.3109/03091902.2012.708382
0309-1902
1464-522X
The FUTREX-6100XL prediction equation
Z. G. Fthenakis et al.
21June2012
J M
ed E
ng T
echn
ol D
ownl
oade
d fr
om in
form
ahea
lthca
re.c
om b
y M
ichi
gan
Stat
e U
nive
rsity
on
09/0
7/12
For
pers
onal
use
onl
y.
2 Z. G. Fthenakis et al.
Journal of Medical Engineering & Technology
% . . ( ) . ( ). ( ) .
BF OD OD OD OD
Weight
s s= − − − −+ −58 0 26 3 4 70 104 5 31
2 2 1 1∆ ∆(( ) . ( )
. ( )Height S x
Exercise Level
−−
2 4781 366
e
(1)
where OD1 and OD2are the optical densities at 940 and
950 nm, respectively, ∆ODs1
and ∆ODs2 are the differences
of the optical densities of a standard optical material between the manufacturer’s calibration and the calibration performed by the operator before the measurement, Sex takes the val-ues 1 for males and −1 for females, the Weight and Height are measured in kg and m, respectively, and the Exercise Level takes one of the values 0, 2, 5 or 8 depending on the exercise level [5]. FUTREX-5000 has been widely used in the last two decades by many research groups [3,5–11]. However, it was reported that its results were not accurate enough [9–11].
To improve the accuracy of the BF estimations, Futrex company introduced a new series of models (FUTREX-6100XL and FUTREX-6100A/ZL). The difference between these two models is that FUTREX-6100XL can be used only for adults, while FUTREX-6100A/ZL can also be used for adolescents and children. The new models measure the opti-cal density (OD) at the wavelengths 810, 932, 944 and 976 nm (instead of 940 and 950 nm on the 5000-series). Those wavelengths were probably found to be more appropriate for the %BF estimations by the manufacturers. In addition, FUTREX-6100XL and FUTREX-6100A/ZL use different prediction equations for the estimations of %BF for adults, adolescents and children and they have the ability to measure the ODs at 910 and 1023 nm, although these wavelengths are not used in the prediction equations. The wavelengths for which the ODs are used in each one of those equations are [12]: 810 and 944 nm for adults (used by FUTREX-6100XL and FUTREX-6100A/ZL), 944 and 976 nm for adolescents (used only by FUTREX-6100A/ZL) and 932 and 944 nm for children (also used only by FUTREX-6100A/ZL). However, the prediction equations incorporated in these new models are proprietary by the FUTREX company and have not been published anywhere [12].
In addition, very few papers (see for example the works of Fthenakis et al. [13] and Zafiropulos et al. [14]) have reported the use of those new models in relevant research, although the manufacturers claimed that their new models have been improved compared to their previous ones. In some cases this is due to the absence of any knowledge on the prediction equations incorporated in those models, which makes them not very attractive for research purposes, except if someone is satisfied using those devices as ‘black boxes’, which can give estimations of the %BF, no mater how those estimations were produced. On the other hand, if someone wants (a) to test the estimations of the FUTREX-6100 series models, (b) to understand how these instruments estimate the %BF, (c) to use them for further research purposes beyond the estima-tions of the %BF under the conditions of their certain proto-col and/or (d) to improve the quality of the predictions, then he/she would be interested to know the form of the predic-tion equations used by the manufacturers. Additionally, the
knowledge of the %BF prediction equation would be helpful for the production of an accurate prediction equation for %BF changes and assessing dietary interventions, since measure-ments with FUTREX-6100XL on the same person show high reproducibility and consequently small differences of the %BF are expected to be accurately estimated.
Furthermore, the absence of papers on (or with the use of) FUTREX-6100 model series and the missing knowledge on their prediction equations leads to confusion and misun-derstandings. Many people believe that FUTREX-6100 series models use the optical densities of six wavelengths instead of two [15] and they might also think that this is the reason why FUTREX-6100 series models are more accurate than the FUTREX-5000. Others think that the prediction equations of the FUTREX-6100 series have more or less the same form with the one used by the FUTREX-5000 series. For example, in their paper, Kalantar-Zadeh et al. [16] thought that the form of the %BF prediction equation, which is used by the FUTREX-6100XL instrument, has the form
% ( ) ( )( ) ( )( )
BF K K OD K OD K
Height K Weight K
Age
= + × + × +× + × +× +
0 1 1 2 2 3
4 5
KK Sex6 × ( ),
(2)
where K0, K1, …, K6 are constants and OD1 and OD2 are the optical densities of the two specific wavelengths. However, this is not the correct form of the prediction equation used by the manufacturers, as will be shown in the present paper.
To avoid all this confusion, to give answers to practitioners who are interested in the form of the FUTREX-6100XL pre-diction equation for the %BF, to improve this equation and for all other purposes presented above, the prediction equation of the FUTREX-6100XL model is uncovered and presented in this paper.
The method
For convenience let us call OD1, OD2, OD3 and OD4 the opti-cal densities at the wavelengths 810, 932, 944 and 976 nm, respectively, which are measured and used by the FUTREX-6100XL instrument. We tried to uncover the form of that equation by keeping the parameters that affect the measure-ment (i.e. OD1, OD3, Height, Weight, Age, Sex) constant, except for one at a time, and see how the estimations of %BF change with the varied parameter. This is the usual way to find the dependence of the prediction equation on the parameter that varies. The form of the equation can be depicted by applying the least squares fitting method on the data. Then the proce-dure is repeated for the rest of the parameters, one parameter at a time.
However, following the previous mentioned methodology, a minor difficulty appears, owing to the fact that it was not possible to keep constant the values of the OD1, OD2, OD3 and OD4 parameters separately. To overcome this problem, mea-surements were taken on the same person. Thus, the four OD values were almost constant, with small insignificant changes from one measurement to another owing to random errors.
J M
ed E
ng T
echn
ol D
ownl
oade
d fr
om in
form
ahea
lthca
re.c
om b
y M
ichi
gan
Stat
e U
nive
rsity
on
09/0
7/12
For
pers
onal
use
onl
y.

The FUTREX-6100XL prediction equation 3
© 2012 Informa UK, Ltd.
Results and discussion
Uncovering the %BF prediction equationFor the moment let us assume that the form of the %BF equa-tion is
% ( , ) ( , , , )BF f OD OD g Height Weight Age Sex= +1 3 (3)
where f is a function of only the optical densities OD1 and OD3 and g is a function of all the other parameters. As it will be shown at the end, this assumption is correct.
Taking measurements with the FUTREX-6100XL on the same person, the function f(OD1,OD3) of the above equation can be treated as an unknown constant and not as a compli-cated function, as explained previously. However, if we speak with exactitude, we should say that, under the conditions of repeated measurements on the same subject, the values of the f function insignificantly vary owing to random errors, which can be treated with the least square fitting method. In this case, using the f function as a constant we can write
% ( , , , ) .BF g Height Weight Age Sex= +constant (4)
Based on equation (4) and by varying one of its parameters at a time (i.e. Height, Weight, Age and Sex), the form of the %BF prediction equation of the FUTREX-6100XL was uncovered.
%BF vs AgeFirst we found how the values of %BF vary as a function of Age. The other parameters except Age were given the values: Weight = 65 kg, Height = 1.70 m and Sex = Female. We gradu-ally changed the values of Age from 18 years to 100. According to the manual accompanying FUTREX-6100XL, the mini-mum entry value of the parameter Age that is accepted by the particular model is eighteen. The values of the %BF calculated by FUTREX-6100XL vs age are depicted in Figure 1. As one can see, the prediction equation of the FUTREX-6100XL shows a linear dependence of %BF on Age. The equation derived via the linear least square fitting procedure is
% . ( ) .BF Age= × +0 146 20 884 (5)
with a value of r2 = 0.9895. A quadratic or a higher power least square fitting does not give any significant changes which would make these forms preferable. For example, the qua-dratic form obtained from the least square fitting method is%BF = –5 × 10⁻⁵ (Age)2 + 0.1523 × (Age) – 20.732, with r2 = 0.9986.
%BF vs WeightNext, the values of Age, Height and Sex were fixed at 18 years, 1.70 m and female, respectively, and the parameter of the Weight was gradually changed from 30–225 kg. The %BF values obtained with the FUTREX-6100XL are shown in Figure 2. As one can see, the %BF is also linear with the Weight, in the region 30–120 kg, but it is constant for Weight > 120 kg.
For the interval of 30–120 kg a least square fitting proce-dure predicts a dependence of the form
% . ( ) . ,BF Weight= × −0 3824 1 3939 (6)
with a value of r2 = 0.9978. As in the previous case, a qua-dratic or a higher power fitting does not give any significant differences, which would make these forms preferable. The corresponding quadratic form is %BF = 2 × 10⁻⁴ × (Weight)2
+ 0.3494 × (Weight) – 0.3467, with r2 = 0.9980.For Weight > 120 kg the least square fitting method gives
a linear dependence of the form %BF = 0.0023 × (Weight) + 45.114 with r2 = 0.1037. This indicates that, in this case, there is not any strong correlation between the %BF values and the values of the Weight and, therefore, %BF is independent of the Weight for Weight > 120 kg. As we will show later, FUTREX-6100XL can not estimate the %BF values if they exceed the value of ~ 45. In these cases it returns a value of ~ 45 and this is what we observed in our measurements for Weight > 120 kg, trying to find the %BF dependence on Weight.
%BF vs HeightTrying to find the dependence of the %BF on the Height, the parameters of Weight, Age and Sex were fixed to the values 70 kg, 18 years and Female, respectively. The values of the Height were gradually changed from 1.25–2.25 m. Figure 3 shows the dependence of the %BF on Height. What one can see is that the trend of those points does not correspond
Figure 1. %BF vs Age. Figure 2. %BF vs Weight.
J M
ed E
ng T
echn
ol D
ownl
oade
d fr
om in
form
ahea
lthca
re.c
om b
y M
ichi
gan
Stat
e U
nive
rsity
on
09/0
7/12
For
pers
onal
use
onl
y.

4 Z. G. Fthenakis et al.
Journal of Medical Engineering & Technology
to a straight line. However, if we plot the %BF against 1/(Height)2, the figure of a straight line appears (see the inset of Figure 3). The equation derived via the linear least square fit-ting procedure is
% .( )
. ,BFHeight
= × −75 091
0 78732
(7)with a value of r2 = 0.9971. This lead us to conclude that a 1/(Height)2 is a possible form of the dependence of %BF on the Height and made us suspect a BMI (= Weight/(Height)2) dependence of the %BF, rather than a 1/(Height)2 and a linear dependence on Weight separately in two solely additive terms. This suspicion became stronger when we realized that, if we divide the slope of the straight line of the inset of Figure 3 with the constant value of the Weight, we found: 75.09/70 = 1.072. Also, if we multiply the slope of the straight line of Figure 2 with the square of the constant value of the Height we found: 0.3824 × (1.702) = 1.105. Those two values (1.072 and 1.105) are very close to each other, and they would represent the slope of a straight line of %BF vs BMI.
Finally, what we observed in Figure 3 was that for small values of Height, (Height < 1.30 m), for which equation (7) predicts %BF values larger than ~45, the %BF values obtained by the instrument do not follow the predictions of equation (7), but they rather remain almost constant, in accordance with what we noticed before, that FUTREX-6100XL can not estimate the %BF values if they exceed the value of ~45.
%BF vs BMITo ensure that we have to do with the BMI and not with the Height and the Weight separately, we used the results already obtained from the previous measurements and also another set of measurements of the %BF for another person for which the values of Age and Sex were 18 years and Male, respectively, and we plotted the graph of the %BF against BMI. What we find is depicted in Figure 4.
As one can see in this Figure, the values of the %BF rise linearly with the BMI until the %BF reaches the value of ~
45.4. For larger values of BMI, the predicted values of %BF remain almost constant, ranging between 45.0–45.9.
In addition, taking measurements on different people, for which the OD values were different between each other, we found that, if the values of the %BF obtained by the instru-ment reach the value of ~45.4, then the %BF values seems to be independent not only of the BMI, but also of the OD values and they seem to be randomly distributed in the range 45.0–45.9. This indicates that FUTREX-6100XL can not esti-mate the %BF values if they exceed the value of ~45, as we have already mentioned. On the other hand, the distribution of those %BF values in the range of 45.0–45.9 was something unexpected and difficult to rationalize.
%BF vs SexAs one can see from Figure 4, the difference between %BF measurements for males and %BF measurements for females is a constant value. This means that the %BF dependence on Sex is just an additive term, which can be determined accord-ing to the values we assign to the parameter Sex. For instance, if Sex = 1 for males and 0 for females, the term C Sex× ( ), with C ≈ −10 4. , has to be inserted in the prediction equation. The same conclusion would arise, using the method used above to find the dependence of %BF on Age, Weight and Height.
The %BF dependence on ODs and the %BF prediction equationWhat we have found so far, is that if %BF f g= + (see equa-tion 3), then
%
( ) ,. . , ,
BFifif
=+
±
+ <+ >
f ODs g f gf g45 4 0 5
4545
(8)
with g having the general form
g A BMI B Age C Sex= × + × + ×( ) ( ) ( ). (9)
In this equation A ≈ 1 1. , B ≈ 0 146. , C ≈ −10 4. , Sex = 1 for males and 0 for females, BMI is in kg m−2 and Age in years.
As mentioned above, technically it is not easy to get %BF measurements, keeping all the parameters constant except
Figure 3. %BF vus Height. Figure 4. %BF vs BMI obtained from two different persons.
J M
ed E
ng T
echn
ol D
ownl
oade
d fr
om in
form
ahea
lthca
re.c
om b
y M
ichi
gan
Stat
e U
nive
rsity
on
09/0
7/12
For
pers
onal
use
onl
y.
The FUTREX-6100XL prediction equation 5
© 2012 Informa UK, Ltd.
one of the ODs. Therefore, we can not find the dependence of the %BF on each OD separately, as we did with the parameters Age, Sex and BMI. Thus, what we will try to do is to find the %BF dependence on all the ODs, simultaneously. In the next few paragraphs we explain how we will do this.
If our assumption that %BF f g= + is correct, then what remains to be done is to find the general form of f and deter-mine its coefficients. Let us assume that we know the general form of f, but we don’t know its coefficients. If the number of those coefficients is n, then getting measurements of %BF with the FUTREX-6100XL for n independent sets of values of the equation parameters, we can determine the unknown coefficients by solving the n × n system of equations which will arise. If our assumption for the form of the prediction equation is correct, then the %BF measurements for any set of parameter values will be exactly the same with the cor-responding %BF values obtained by the proposed equation and the proposed equation is the prediction equation of the instrument.
On the other hand, the determination of the coefficients and the validation of the form of the equation can be done simultaneously, using the least squares fitting method. What we have to do is to get %BF measurements using FUTREX-6100XL for a very large sample of parameter values, no mat-ter if those measurements are true measurements of the %BF of individuals. Using the least squares fitting method to fit those %BF values to the proposed general form of equation, we will obtain the values of its coefficients. This equation will be the prediction equation of the instrument, if all the %BF measurements are equal to the corresponding %BF values obtained by the equation, despite some negligible differ-ences of minor interest, which might appear due to trunca-tion errors.
Following this methodology, we assume a linear depen-dence of the %BF on OD1 and OD3, which, according to the manufacturers, are the two OD parameters used by the FUTREX-6100XL. Thus, the prediction equation is assumed to have the general form
%( ) ( ) ( ).
BF a a OD a OD
A BMI B Age C Sex
= + × + ×+ × + × + ×0 1 1 3 3
(10)Using the least squares fitting method, as implemented by
the Origin suite [17], we determined the coefficients a0, a1, a3, A, B and C. Nine hundred and seventy-eight %BF mea-surements obtained by the FUTREX-6100XL instrument for their corresponding 978 sets of parameter values were used for the fitting. Those sets of parameter values were selected so that they cover all the space of their possible values. The values of the coefficients found are: a0 8 640 0 012= − ±. . , a1 1 142 0 062= − ±. . , a3 20 77 0 07= − ±. . , A = ±1 093 0. , B = ±0 145 0. and C = − ±10 426 0 005. . . Zero error of the above values means that the error is less significant than the most significant figure of the corresponding value. What remains to be done is to verify that the values obtained by the above equation are the same as those measured by the instru-ment, and this is what we will show next.
Once more, we notice that this equation is valid only for adults (i.e. for ages > 18 years) and that the prediction equa-tions for adolescents and children are different.
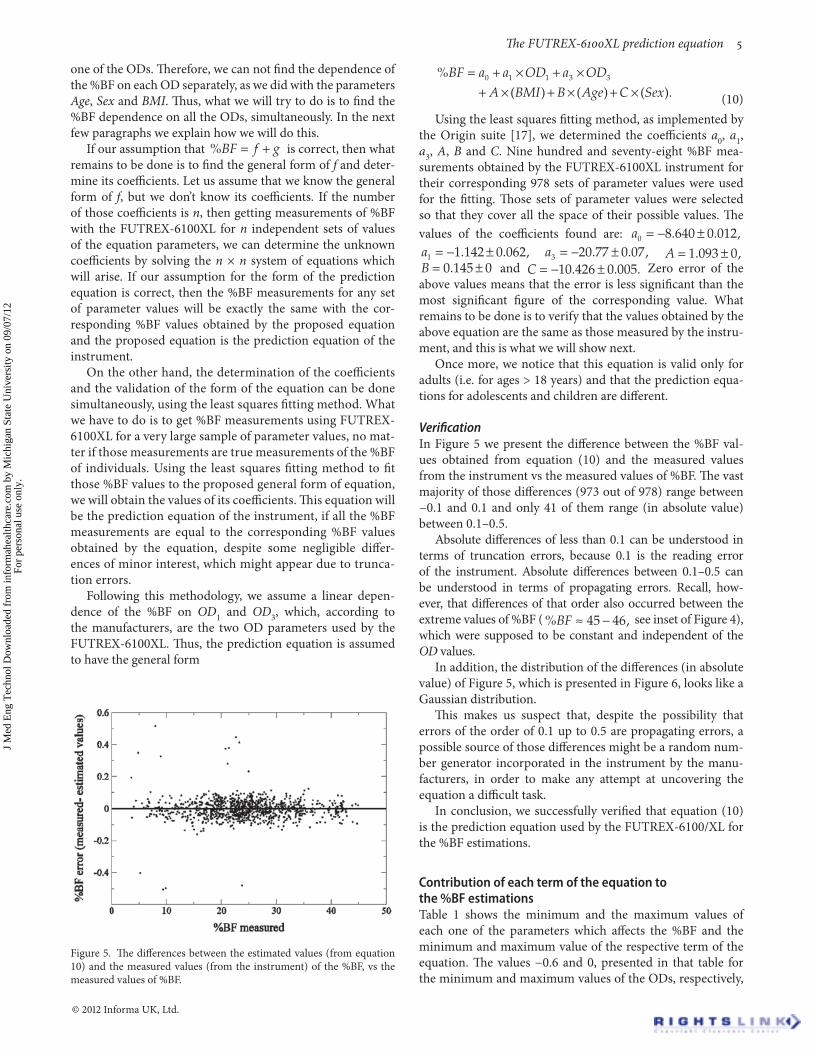
VerificationIn Figure 5 we present the difference between the %BF val-ues obtained from equation (10) and the measured values from the instrument vs the measured values of %BF. The vast majority of those differences (973 out of 978) range between −0.1 and 0.1 and only 41 of them range (in absolute value) between 0.1–0.5.
Absolute differences of less than 0.1 can be understood in terms of truncation errors, because 0.1 is the reading error of the instrument. Absolute differences between 0.1–0.5 can be understood in terms of propagating errors. Recall, how-ever, that differences of that order also occurred between the extreme values of %BF (% ,BF ≈ −45 46 see inset of Figure 4), which were supposed to be constant and independent of the OD values.
In addition, the distribution of the differences (in absolute value) of Figure 5, which is presented in Figure 6, looks like a Gaussian distribution.
This makes us suspect that, despite the possibility that errors of the order of 0.1 up to 0.5 are propagating errors, a possible source of those differences might be a random num-ber generator incorporated in the instrument by the manu-facturers, in order to make any attempt at uncovering the equation a difficult task.
In conclusion, we successfully verified that equation (10) is the prediction equation used by the FUTREX-6100/XL for the %BF estimations.
Contribution of each term of the equation to the %BF estimationsTable 1 shows the minimum and the maximum values of each one of the parameters which affects the %BF and the minimum and maximum value of the respective term of the equation. The values −0.6 and 0, presented in that table for the minimum and maximum values of the ODs, respectively,
Figure 5. The differences between the estimated values (from equation 10) and the measured values (from the instrument) of the %BF, vs the measured values of %BF.
J M
ed E
ng T
echn
ol D
ownl
oade
d fr
om in
form
ahea
lthca
re.c
om b
y M
ichi
gan
Stat
e U
nive
rsity
on
09/0
7/12
For
pers
onal
use
onl
y.

6 Z. G. Fthenakis et al.
Journal of Medical Engineering & Technology
are the minimum and maximum values we found after taking hundreds of measurements with FUTREX-6100/XL on indi-viduals. The last column of Table 1 shows the average value of each one of those terms. For those average values, the %BF takes the value of ~20 for males and 30 for females.
As one can see from this table, the contribution of the OD1 is minor. The prediction equation for the %BF seems to be very sensitive on BMI and OD3 (i.e. small changes in these two parameters leads to large changes in %BF), while the predic-tion equation is not so sensitive in OD1 and Age. For instance, if the error on Age is 1 year (maximum possible error), the error on %BF will be less than 0.15. The error from the OD1 (no mater what its value is) can not exceed the value of 0.4. The term C Sex× ( ) is an additive term without any error.
According to the uncovered equation, between two indi-viduals with the same Sex, Age and BMI, the value of OD3 will be smaller for the one with the higher %BF. This means that OD3 estimates the absorbance of water and not the absorbance of the fat. It is worth noting that the wavelength correspond-ing to OD3 is λ = 944 nm, which is almost in the middle of the wavelengths λ = 930 nm and λ = 970 nm, corresponding to the absorption peaks of fat and water, respectively.
Bearing in mind that the values of the parameters Sex and Age are the same for all individuals of the same age and sex, the FUTREX-6100XL %BF measurements depend mainly on BMI and OD3. This conclusion, somehow, falls short of our
expectations. We wouldn’t expect an instrument like FUTREX, which incorporates the NIR technology and is based on the very reasonable considerations of the NIR interactance method, to estimate %BF using quantities like BMI, which can only roughly estimate the BF situation. Of course, BMI itself is not a very bad predictor of %BF. However, it is not evident why BMI should be incorporated in a NIR interactance prediction equation for the %BF. In addition, the prediction equation is linear on the ODs, which of course is the simplest form of an equation; however, considering the laws of light absorption, it is not easy to rationalize why this equation has to be linear. In other words, one would rather expect a more sophisticated pre-diction equation, which would not include any anthropometric measurements and will be based only (or mainly) on some rea-sonable considerations of the NIR interactance method.
Conclusion
Using the method described above, which is a general method to uncover unknown prediction equations, the FUTREX-6100XL prediction equation for the %BF (equation 10) has been uncovered. Despite some small differences owed to trun-cation errors, it has been found that the %BF values obtained by the uncovered prediction equation are the same with those measured by the instrument. This is evidence that equation (10) is the equation used by the FUTREX-6100XL.
For large values of %BF (%BF > 45), the FUTREX-6100XL %BF estimations lay between the values 45–46, no matter what the OD values or the values of the other variables are. Therefore, for such large values of %BF, the FUTREX-6100XL instrument is not proper for estimations of the %BF. The prediction equa-tion of FUTREX-6100XL for the %BF is based mainly on BMI and the OD at the wavelength λ = 944 nm. This OD acts as an estimator of the absorbance of NIR from the water of the tissues.
Acknowledgments
The authors would like to thank Professor A. Pietrobelli for valuable comments on the manuscript.
Declaration of Interest: The authors report no conflicts of interest. The authors alone are responsible for the content and writing of the paper.
References [1] Jackson, A.S., and Pollock, M.L., 1978, Generalized equations for pre-
dicting body density of men. British Journal of Nutrition, 40, 487–504. [2] Kyle, U.G., Bosaeus, I., De Lorenzo, A.D., Deurenberg, P., Elia, M.,
Gómez, J.M., Heitmann, B.L., Kent-Smith, L., Melchior, J.C., Pirlich, M., Scharfetter, H., Schols, A.M.W.J., and Pichard, C., 2004, Bioelectrical impedance analysis – part I: Review of principles and methods. Clinical Nutrition, 23, 1226–1243.
[3] Heyward, V.H., and Wagner, D.R., 2004, Applied body composition assessment. 2nd edn. Chapter 7: Near-infrared interactance method. (Human Kinetics).
[4] Conway, J.M., Norris, K.H., and Bodwell, C.E., 1984, A new approach for the estimation of body composition: Infrared interactance. American Journal of Clinical Nutrition, 40, 1123–1130.
[5] Thomas, D.W., Ryde, S.J.S., Ali, P.A., Birks, L., Evans, C.J., Saunders, N.H., Al-Zeibak, S., Dutton, J., and Hancock, D.A., 1997, The performance
Table 1. (a) The minimum and the maximum value of the parameters of the prediction equation for the %BF, (b) the minimum, the maxi-mum and the average value of the terms of the prediction equation.
VariableMin value
Max value Term
Min value
Max value
Average value
OD1 −0.6 0 a1 × (OD1) 0.0 0.7 0.4OD3 −0.6 0 a3 × (OD3) 0.0 12.5 7BMI 6 50 A × BMI 6.6 54.0 24Age 20 100 B × Age 2.9 14.5 8.7Sex C × Sex −10.4 or 0Constant a0 −8.6
%BF ≈ 20 or 30
Figure 6. The distribution of cases vs the error of %BF (i.e. %BF esti-mated (by the equation) − %BF measured (by the instrument)).
J M
ed E
ng T
echn
ol D
ownl
oade
d fr
om in
form
ahea
lthca
re.c
om b
y M
ichi
gan
Stat
e U
nive
rsity
on
09/0
7/12
For
pers
onal
use
onl
y.

The FUTREX-6100XL prediction equation 7
© 2012 Informa UK, Ltd.
of an infra-red interactance instrument for assessing total body fat. Physiological Measurement, 18, 305–315.
[6] Fornetti, W.C., Pivarnik, J.M., Foley, J.M., and Fiechtner, J.J., 1999, Reliability and validity of body composition measures in female athletes. Journal of Applied Physiology, 87, 1114–1122.
[7] Oppliger, R.A., Clark, R.R., and Nielsen, D.H., 2000, New equations improve NIR prediction of body fat among high school wrestlers. Journal of Orthopaedic Sports Physical Therapy, 30, 536–543.
[8] Diboll, D.C., and Moffit, J.K., 2003, A comparison of bioelectrical imped-ance and near-infrared interactance to skinfold measures in determin-ing minimum wrestling weight in collegiate wrestlers. Journal of Exercise Physiology, 6, 26–36.
[9] Swisher, A.K., Yeater, R., Moffett, K., Baer, L., and Stanton, B., 2003, A comparison of methods to determine body fat in individuals with cystic fibrosis: A pilot study. Journal of Exercise Physiology, 6, 105–113.
[10] Hortobágyi, T., Israel, R.G., Houmard, J.A., McCammon, M.R., and O’Brien, K.F., 1992, Comparison of body composition assessment by hydrodensitometry, skinfolds, and multiple site near-infrared spectro-photometry. European Journal of Clinical Nutrition, 46, 205–211.
[11] McLean, K.P., and Skinner, J.S., 1992, Validity of Futrex-5000 for body com-position determination. Medicine and Science in Sports Exercise, 24, 253–258.
[12] Private communication with the FUTREX company. [13] Fthenakis, Z.G., Markaki, A., and Zafiropulos, V., 2009, A new predic-
tion equation for the percent body fat for adolescents using the near infra-red interactance method. Obesity Facts - The European Journal of Obesity, 2 (Suppl.), 96.
[14] Zafiropulos, V., Balaska, D., Fthenakis, Z.G., Markaki, A., Dimitropoulakis, P., Fragkiadakis, G.A., and Giakoumaki, I., 2009, Percent body fat in adolescents: Use of four field methods in a nutri-tional intervention. Obesity Facts - The European Journal of Obesity, 2 (Suppl.), 82.
[15] Moon, J.R., Tobkin, S.E., Smith, A.E., Roberts, M.D., Ryan, E.D., Dalbo, V.J., Lockwood, C.M., Walter, A.A., Cramer, J.T., Beck, T.W., and Stout, J.R., 2008, Percent body fat estimations in college men using field and laboratory methods: A three-compartment model approach. Dynamic Medicine, 7, 7.
[16] Kalentar-Zadeh, K., Kuwae, N., Wu, D.Y., Shantouf, R.S., Fouque, D., Anker, S.D., Block, G., and Kopple, J.D., 2006, Associations of body fat and its changes over time with quality of life and prospective mortal-ity in hemodialysis patients. American Journal of Clinical Nutrition, 83, 202–210.
[17] Originpro v.8, the originlab corporation (http://www.originlab.com)
J M
ed E
ng T
echn
ol D
ownl
oade
d fr
om in
form
ahea
lthca
re.c
om b
y M
ichi
gan
Stat
e U
nive
rsity
on
09/0
7/12
For
pers
onal
use
onl
y.