uncovering the genetic history of the present-day ... the genetic history of the present-day...
TRANSCRIPT
Please cite this article in press as: Moltke et al., Uncovering the Genetic History of the Present-Day Greenlandic Population, The AmericanJournal of Human Genetics (2015), http://dx.doi.org/10.1016/j.ajhg.2014.11.012
ARTICLE
Uncovering the Genetic History of the Present-DayGreenlandic Population
Ida Moltke,1,2 Matteo Fumagalli,3,4 Thorfinn S. Korneliussen,5 Jacob E. Crawford,3 Peter Bjerregaard,6
Marit E. Jørgensen,6,7 Niels Grarup,8 Hans Christian Gulløv,9 Allan Linneberg,10,11,12 Oluf Pedersen,8
Torben Hansen,8,13 Rasmus Nielsen,3,14,* and Anders Albrechtsen1,*
Because of past limitations in samples and genotyping technologies, important questions about the history of the present-day Green-
landic population remain unanswered. In an effort to answer these questions and in general investigate the genetic history of the Green-
landic population, we analyzed ~200,000 SNPs from more than 10% of the adult Greenlandic population (n ¼ 4,674). We found that
recent gene flow from Europe has had a substantial impact on the population: more than 80% of the Greenlanders have some European
ancestry (on average ~25% of their genome). However, we also found that the amount of recent European gene flow varies across
Greenland and is far smaller in the more historically isolated areas in the north and east and in the small villages in the south. Further-
more, we found that there is substantial population structure in the Inuit genetic component of the Greenlanders and that individuals
from the east, west, and north can be distinguished from each other. Moreover, the genetic differences in the Inuit ancestry are consis-
tent with a single colonizationwave of the island fromnorth to west to south to east. Although it has been speculated that there has been
historical admixture between the Norse Vikings who lived in Greenland for a limited period ~600–1,000 years ago and the Inuit, we
found no evidence supporting this hypothesis. Similarly, we found no evidence supporting a previously hypothesized admixture event
between the Inuit in East Greenland and the Dorset people, who lived in Greenland before the Inuit.
Introduction
With its more than 2,150,000 km2, Greenland is the largest
island in the world. However, because of its cold climate
and remote location, it has historically been only sparsely
populated, and the size of its present-day population is
only about 57,000 individuals.
Archeological evidence indicates that Greenland was
colonized several times when people from northeastern
Canada entered into the northwestern part of the is-
land.1 The Paleo-Eskimos of the Independence I culture
and of the Saqqaq culture were the first to populate the is-
land ca. 2500 BC. The former group settled in North and
Northeast Greenland, and the latter settled in West and
Southeast Greenland. Around 800 BC, a new group of
Paleo-Eskimos representing the Dorset culture arrived. In
North and Northeast Greenland, this culture is labeled
Independence II. From approximately 1 AD to the 8th cen-
tury AD, no human activity was documented anywhere on
the island. Then Paleo-Eskimos of the Late Dorset culture
settled in the Thule district in North Greenland, where
they lived until ca. 1300 AD. The Neo-Eskimos, i.e., Inuit
of the Thule culture, arrived in the same area from Alaska
1The Bioinformatics Centre, Department of Biology, University of Copenhagen
of Chicago, Chicago, IL 60637, USA; 3Department of Integrative Biology, Univ
tute, Department of Genetics, Evolution, and Environment, University College
Museum of Denmark, University of Copenhagen, 1350 Copenhagen, Denma
1353 Copenhagen, Denmark; 7Steno Diabetes Center, 2820 Gentofte, Denm
Section of Metabolic Genetics, Faculty of Health and Medical Sciences, Univ
Ethnographic Collections, National Museum of Denmark, 1220 Copenhagen, D
Hospital, 2600 Glostrup, Denmark; 11Department of Clinical Experimental R
ment of Clinical Medicine, Faculty of Health and Medical Sciences, University
University of Southern Denmark, 5000 Odense, Denmark; 14Department of S
*Correspondence: [email protected] (R.N.), [email protected] (A
http://dx.doi.org/10.1016/j.ajhg.2014.11.012. �2015 The Authors
This is an open access article under the CC BY license (http://creativecommon
The
through Canada in the 12th century, and archaeology has
provided evidence of the coexistence of the two groups
in this area.2,3 In 985, the Norse Vikings settled in the
southern part of West Greenland, where they remained
until about 1450 AD. Archaeology has provided substantial
evidence of contact between Norse, Late Dorset, and Inuit
pioneers.2,3 These interactions did not necessarily take
place close to the Norse settlements but could have taken
place anywhere inWest Greenland.2 From the 14th century
onward, the Inuit settled in West and Southeast
Greenland. They also traveled north around the country
and settled in Northeast Greenland for four centuries,
and several archeological studies have suggested that a
gradual migration south into Southeast Greenland origi-
nated there.4,5 In the 17th century, the Inughuit Polar Eski-
mos (new Inuit people from the central Canadian Arctic)
settled in the Thule district. By this time, the last group
of the Inuit pioneers had left Thule and settled in Uperna-
vik, the northernmost part of West Greenland.3 In 1721,
the Norwegian priest Hans Egede initiated a period during
which Greenland was a Danish colony, which lasted until
1953 and ended formally in 1979, when Denmark granted
home rule to Greenland.
, 2200 Copenhagen, Denmark; 2Department of Human Genetics, University
ersity of California, Berkeley, Berkeley, CA 94720, USA; 4UCL Genetics Insti-
London, LondonWC1E 6BT, UK; 5Centre for GeoGenetics, Natural History
rk; 6National Institute of Public Health, University of Southern Denmark,
ark; 8The Novo Nordisk Foundation Center for Basic Metabolic Research,
ersity of Copenhagen, 2100 Copenhagen, Denmark; 9Arctic Centre at the
enmark; 10Research Centre for Prevention and Health, Glostrup University
esearch, Glostrup University Hospital, 2600 Glostrup, Denmark; 12Depart-
of Copenhagen, 2200 Copenhagen, Denmark; 13Faculty of Health Sciences,
tatistics, University of California, Berkeley, Berkeley, CA 94720, USA
.A.)
s.org/licenses/by/4.0/).
American Journal of Human Genetics 96, 1–16, January 8, 2015 1
Please cite this article in press as: Moltke et al., Uncovering the Genetic History of the Present-Day Greenlandic Population, The AmericanJournal of Human Genetics (2015), http://dx.doi.org/10.1016/j.ajhg.2014.11.012
Genetic studies have shown that many modern Green-
landers have a substantial amount of European ancestry6–9
inherited mainly from male Europeans.6 Furthermore, a
large genetic study based on DNA from historic samples
from different arctic cultures including Saqqaq, Dorset,
and Thule, as well as two whole genomes from present-
dayGreenlanders, was recently published.10 This study pro-
vided genetic evidence showing that modern-day Inuit in
Greenland are direct descendants of the first Inuit pioneers
of the Thule culture. However, despite these advances,
several central questions regarding the history of theGreen-
landic population remain unanswered, mainly because of a
lack of genome-wide data from a large sample of Greenlan-
dic individuals. For example, it is still unknown whether
the Norse Vikings are among the ancestors of the Green-
landers. No physical or dental anthropological evidence
has been found in support of admixture between the Inuit
and theNorse,11 but the twopopulationswere inGreenland
at the same time, and sagas, Papal briefs,12 andarcheological
findings suggest that contact took place.2 A few attempts
were made to answer this question with genetics, but all
were unsuccessful; part of the reason is that the Norse Vi-
kings came from the same or similar geographical regions
as the later European colonizers, making it difficult to
answer this question by inferring the source country of the
Europeanancestorsof theGreenlanders.6Moreover, anypo-
tential genetic contribution from the Norse Vikings is most
likely small and would have left a very limited genetic foot-
print, making the amount of genetic data used in previous
studies insufficient.
Another unanswered question is which migration route
or routes the first Inuit pioneers used when settling
Greenland. About 80% of the island is covered by an ice
sheet, making it impossible to settle and access noncoastal
areas. As a consequence, present-day Greenlanders live in
villages along the coast; the north and northeast coasts
remain unoccupied, and the east coast has only a few
remote villages that are difficult to reach. Several migration
routes have been hypothesized. The possibility of a single
wave ofmigration starting inNorthGreenland andmoving
south down the west coast and from there reaching East
Greenland is mentioned by Helgason et al.13 In contrast,
on the basis of archaeological and linguistic evidence, Gul-
løv14 argues that there were two major migration routes,
both starting in Northwest Greenland. One wave of migra-
tion expanded down the west coast, entered Southwest
Greenland after the depopulation of the Norse settlements,
and ended on the east coast of Greenland. The othermigra-
tion wave expanded along the northern coast to ultimately
reach the east coast, where it encountered the descendants
of the western expansion wave in the 16th century. Helga-
son et al.13 also argue in favor of this latter scenario and
further hypothesize, on the basis of mtDNA analyses, that
Thule Inuit encountered and interbredwith existingDorset
culture individuals both in Canada and on the east coast of
Greenland. They argue that Inuit in East Greenland and
North Greenland share mtDNA haplotypes and are differ-
2 The American Journal of Human Genetics 96, 1–16, January 8, 2015
entiated from South and West Greenlanders; this would
not be expected had only the first of the two migration
waves takenplace andhad therenot beenany interbreeding
with the Dorset on the east coast. Some linguistic evidence
also supports a connection between East and North Green-
landers with similar dialects in Upernavik in Northwest
Greenland and East Greenland.5,15
In line with Helgason et al.’s hypothesis of admixture
between the Inuit and the Dorset, the Inuit crossed a re-
gion occupied by the Dorset people when they spread east-
ward from Alaska around 1200 AD, and the Dorset are
mentioned in the legends of the Inuit as a distinct people
called Tunit.16 Hence, the Inuit and the Dorset most likely
encountered each other at some point and might have
interbred. Furthermore, the previously mentioned study
based on ancient DNA showed that it is possible that
some admixture took place long before the Inuit arrived
in Greenland.10 With regard to admixture in Greenland,
some anthropologists have suggested that there might
have been pockets of surviving Dorset people in Greenland
when the Inuit arrived, althoughMcGhee17 argues that the
available archeological evidence does not support this hy-
pothesis. Therefore, the validity of Helgason’s hypothesis
regarding interbreeding of Inuit and Dorset people in
East Greenland remains an open question.
Finally, the genetic structure within the present-day
Greenlandic population remains poorly described. In
particular, the amount of European admixture has yet to
be thoroughly quantified, both at a population level and
at a regional level. Thus, it is not knownwhether European
ancestry is equally distributed across Greenland or largely
restricted to easily accessible towns on the west coast of
Greenland, as might be expected given that European im-
migrants have concentrated in these localities historically.
To answer the above questions and thereby reconstruct
important parts of the history of the present-day Green-
landic population, we analyzed almost 200,000 genetic
markers from a large population sample consisting of
more than 10% of the adult Greenlandic population.
Material and Methods
SNP Chip Data SetsThe analyses in this study were based on genetic data from 4,674
Greenlandic participants from three different cohorts. Of these in-
dividuals, 4,127 were participants of the Inuit Health in Transition
(IHIT) cohort18 and/or the general population health survey
(B99)19 from locations all over Greenland (Figure 1). The remain-
ing 547 were from a cohort19 consisting of individuals who have
Greenlandic ancestry and live in Denmark. In addition to data
from the Greenlandic individuals, genetic data from 50 Danish in-
dividuals from the Inter99 cohort20 were included to represent
Europeans. All but the 547 individuals from the cohort of Green-
landers living in Denmark were genotyped as a part of a recent
disease study8 with the Illumina CardioMetaboChip21 (Metabo-
Chip), which consists of 196,224 SNPs. About half of these SNPs
are rare. We used the same chip to genotype the participants
from the cohort of Greenlanders living in Denmark for this study.
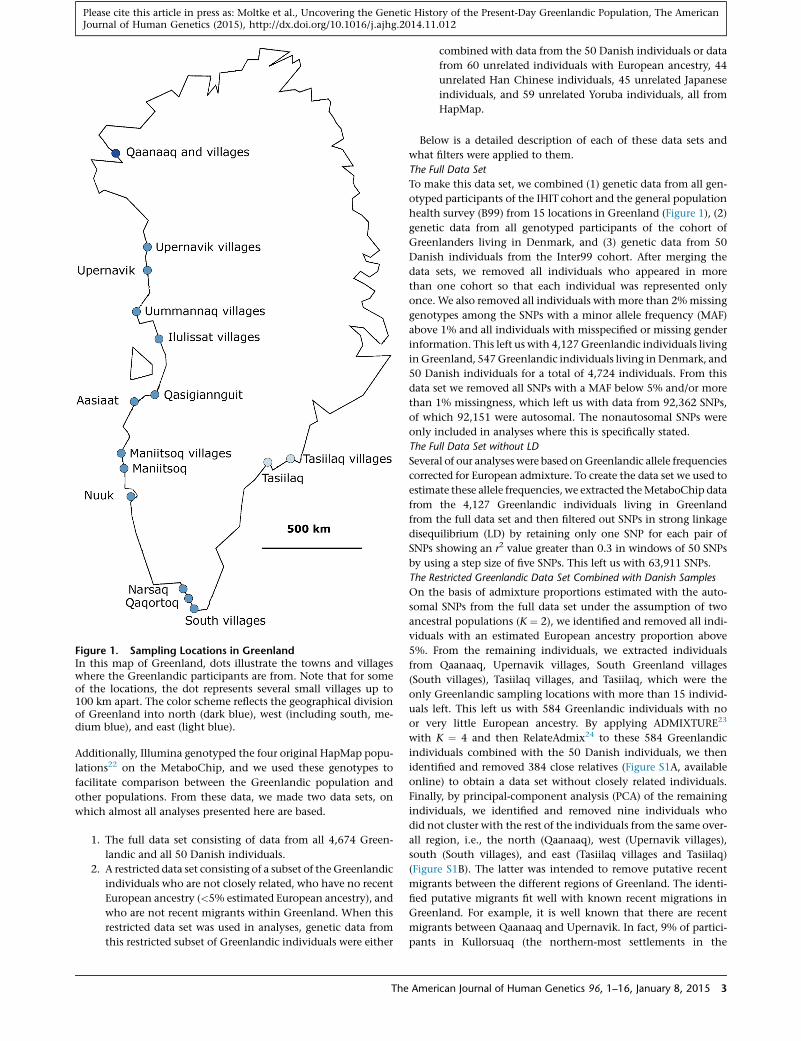
Figure 1. Sampling Locations in GreenlandIn this map of Greenland, dots illustrate the towns and villageswhere the Greenlandic participants are from. Note that for someof the locations, the dot represents several small villages up to100 km apart. The color scheme reflects the geographical divisionof Greenland into north (dark blue), west (including south, me-dium blue), and east (light blue).
Please cite this article in press as: Moltke et al., Uncovering the Genetic History of the Present-Day Greenlandic Population, The AmericanJournal of Human Genetics (2015), http://dx.doi.org/10.1016/j.ajhg.2014.11.012
Additionally, Illumina genotyped the four original HapMap popu-
lations22 on the MetaboChip, and we used these genotypes to
facilitate comparison between the Greenlandic population and
other populations. From these data, we made two data sets, on
which almost all analyses presented here are based.
1. The full data set consisting of data from all 4,674 Green-
landic and all 50 Danish individuals.
2. A restricted data set consisting of a subset of the Greenlandic
individuals who are not closely related, who have no recent
European ancestry (<5% estimated European ancestry), and
who are not recent migrants within Greenland. When this
restricted data set was used in analyses, genetic data from
this restricted subset of Greenlandic individuals were either
The
combined with data from the 50 Danish individuals or data
from 60 unrelated individuals with European ancestry, 44
unrelated Han Chinese individuals, 45 unrelated Japanese
individuals, and 59 unrelated Yoruba individuals, all from
HapMap.
Below is a detailed description of each of these data sets and
what filters were applied to them.
The Full Data Set
To make this data set, we combined (1) genetic data from all gen-
otyped participants of the IHIT cohort and the general population
health survey (B99) from 15 locations in Greenland (Figure 1), (2)
genetic data from all genotyped participants of the cohort of
Greenlanders living in Denmark, and (3) genetic data from 50
Danish individuals from the Inter99 cohort. After merging the
data sets, we removed all individuals who appeared in more
than one cohort so that each individual was represented only
once. We also removed all individuals with more than 2%missing
genotypes among the SNPs with a minor allele frequency (MAF)
above 1% and all individuals with misspecified or missing gender
information. This left us with 4,127 Greenlandic individuals living
inGreenland, 547Greenlandic individuals living inDenmark, and
50 Danish individuals for a total of 4,724 individuals. From this
data set we removed all SNPs with a MAF below 5% and/or more
than 1% missingness, which left us with data from 92,362 SNPs,
of which 92,151 were autosomal. The nonautosomal SNPs were
only included in analyses where this is specifically stated.
The Full Data Set without LD
Several of our analyses were based onGreenlandic allele frequencies
corrected for European admixture. To create the data set we used to
estimate these allele frequencies, we extracted theMetaboChip data
from the 4,127 Greenlandic individuals living in Greenland
from the full data set and then filtered out SNPs in strong linkage
disequilibrium (LD) by retaining only one SNP for each pair of
SNPs showing an r2 value greater than 0.3 in windows of 50 SNPs
by using a step size of five SNPs. This left us with 63,911 SNPs.
The Restricted Greenlandic Data Set Combined with Danish Samples
On the basis of admixture proportions estimated with the auto-
somal SNPs from the full data set under the assumption of two
ancestral populations (K ¼ 2), we identified and removed all indi-
viduals with an estimated European ancestry proportion above
5%. From the remaining individuals, we extracted individuals
from Qaanaaq, Upernavik villages, South Greenland villages
(South villages), Tasiilaq villages, and Tasiilaq, which were the
only Greenlandic sampling locations with more than 15 individ-
uals left. This left us with 584 Greenlandic individuals with no
or very little European ancestry. By applying ADMIXTURE23
with K ¼ 4 and then RelateAdmix24 to these 584 Greenlandic
individuals combined with the 50 Danish individuals, we then
identified and removed 384 close relatives (Figure S1A, available
online) to obtain a data set without closely related individuals.
Finally, by principal-component analysis (PCA) of the remaining
individuals, we identified and removed nine individuals who
did not cluster with the rest of the individuals from the same over-
all region, i.e., the north (Qaanaaq), west (Upernavik villages),
south (South villages), and east (Tasiilaq villages and Tasiilaq)
(Figure S1B). The latter was intended to remove putative recent
migrants between the different regions of Greenland. The identi-
fied putative migrants fit well with known recent migrations in
Greenland. For example, it is well known that there are recent
migrants between Qaanaaq and Upernavik. In fact, 9% of partici-
pants in Kullorsuaq (the northern-most settlements in the
American Journal of Human Genetics 96, 1–16, January 8, 2015 3
Please cite this article in press as: Moltke et al., Uncovering the Genetic History of the Present-Day Greenlandic Population, The AmericanJournal of Human Genetics (2015), http://dx.doi.org/10.1016/j.ajhg.2014.11.012
Upernavik district) stated that they were born in Avanersuaq (the
NorthGreenlandic countywhereQaanaaq is themain settlement),
and 2% of participants in Avanersuaq were born in the Upernavik
district. All in all, this left us with 191 individuals from five loca-
tions in Greenland. To form the restricted Greenlandic data set
combinedwithDanish samples, we extracted data for these 191 in-
dividuals and for the 50 Danish individuals from the full data set.
Subsequently, using a step size of ten SNPs, we removed strong
LD from the data set by removing SNPs such that no pair of SNPs
had r2 greater than 0.5 in windows of 100 SNPs. This filtering pro-
cess resulted in a data set with 31,992 SNP sites.
The Restricted Greenlandic Data Set Combined with HapMap Samples
Genotypes from the Greenlandic individuals included in the
restricted Greenlandic data set combined with Danish individuals
were merged with MetaboChip genotypes of the four original
HapMap populations: CEU (Utah residents with ancestry from
northern and western Europe from the CEPH collection), JPT (Jap-
anese in Tokyo, Japan), CHB (Han Chinese in Beijing, China) and
YRI (Yoruba in Ibadan, Nigeria). We removed the offspring of the
HapMap trios such that all individuals in the data set were unre-
lated. Subsequently, all SNPs with a MAF below 5% and missing-
ness above 1% were removed, leaving data for 102,559 SNP sites.
No LD pruning was performed for this data set. We note that the
D statistics estimated from this data set are consistent with the
claim that the Greenlanders in this restricted data set have no
European admixture (Figure S2).
Sequencing DataFor estimation of site-frequency spectra (SFSs) and sequence-data-
based FST, we used the exome sequencing data generated by Moltke
et al.8 from the 18 parents of nine trios of Greenlanders with no
Danish ancestry from Qaanaaq (three trios), Tasiilaq villages (five
trios), and Upernavik villages (one trio). Additionally, we down-
loaded 18 unrelated HapMap samples from four different popula-
tions (CEU, JPT,CHB, andYRI) from1000Genomes.25For theexome
data, the extended target region for Agilent SureSelect spanned
75 Mb. These regions were used for both the whole-genome se-
quencing data from1000Genomes and the exome sequencingdata.
Admixture and PCAAdmixture proportions were estimated with the ADMIXTURE soft-
ware23 with a range of K values (the assumed number of ancestral
populations). For each K value, we ran ADMIXTURE 100 times
with different seeds in order to evaluate convergence. For all values
of K, ADMIXTURE converged to the same (largest) likelihood in
more than 50% of these 100 runs. The estimated ancestry propor-
tions for different K values were plotted together and colored in a
manner that minimized the mean root-squared error between
the different plots. PCAs were performed on the basis of the model
presented in Patterson et al.,26 and the results were colored on the
basis of location.
Estimation of Admixture-Corrected Allele FrequenciesSeveral of our analyses were based on Greenlandic allele fre-
quencies corrected for European admixture. To estimate admix-
ture-corrected allele frequencies, we first extracted the European
ancestry proportions estimated by ADMIXTURE23 under the
assumption of two ancestral populations (K¼ 2). Tomodel the un-
certainty associated with sampling individuals from a population,
we parameterized the discrete distribution of admixture propor-
tions, for each Greenlandic population, by using a mixture of a
4 The American Journal of Human Genetics 96, 1–16, January 8, 2015
point mass at 0, a beta distribution, and a point mass at 1. We
therefore had four parameters to estimate: the fraction of individ-
uals with a European ancestry proportion of 0, the fraction of in-
dividuals with a European ancestry proportion of 1, and the two
parameters of the beta distribution. We computed maximum-like-
lihood estimates of these parameters. Figure S3 shows the com-
parison between the average of the observed values and the
expectation from the modeled distribution of admixture propor-
tions. Finally, we used the discrete estimated distribution of
admixture proportions for each population to compute the Green-
landic allele frequencies without the contribution of genetic
admixture with Europeans. For each site, we computed the admix-
ture-corrected Greenlandic allele frequencies f 0G as
f 0G ¼XBb¼1
fG � abfD1� ab
PrðabÞ
where fG is the admixed Greenlandic allele frequency, fD is the
Danish allele frequency, and ab is the European ancestry propor-
tion at the bth bin of the discrete distribution estimated as
described above. An arbitrary number of bins (ten) was chosen
for ease of calculation.
SFS EstimationWe estimated the SFS from sequencing data from five populations
(Greenlanders, CEU, CHB, JPT, and YRI) by using the full
maximum-likelihood method from Nielsen et al.27 as imple-
mented in ANGSD (Analysis of Next Generation Sequencing
Data).28 Because we only had exome data from the Greenlanders,
we only included data from the extended Agilent SureSelect
exome target region for all five populations. Before estimating
the SFSs, we discarded reads with a mapping quality below 30
and bases with a quality score below 20, which correspond to an
error rate of 0.1% and 1%, respectively.
We also estimated the 2D SFS of the Greenlandic population and
CHB and of the Greenlandic population and CEU. For these
spectra, we only used sites from the extended target region where
we had coverage for both populations.
When estimating the SFSs with ANGSD, we chose to use the
SAMtools genotype likelihood model.
LD Estimation for Ancestral PopulationsLD is affected by admixture. Therefore, we developed a model that
can accommodate admixture by first estimating the haplotype fre-
quencies in each ancestral population from the observed geno-
types and then calculating LD between pairs of SNPs from these
haplotype frequencies.
We estimated the haplotype frequencies by using a maximum-
likelihood approach: let G ¼ ðG1;G2; :::;GnÞ be the genotypes of
n individuals and Gi ¼ ðG1i ;G
2i Þ be the genotypes of individual i
at the pair of SNP sites of interest. Further, assume that all n indi-
viduals have ancestry from one or more of K ancestral populations
and that we know the admixture proportions ai ¼ ða1i ;a
2i ;.;aK
i Þfor each individual i, and let a denote the vector ða1;a2;.;anÞ(see previous section for a description of how we inferred the
admixture proportions). Finally, let the frequency of haplotype j
for the kth population be denoted as pkj , and let h ¼ (h1, h2) be
the unobserved pair of haplotypes for an individual, where the
two haplotypes originate from the unobserved ancestral popula-
tions k1 and k2. Then, the likelihood of the ancestry-specific haplo-
type frequencies p ¼ ðpkj Þ given the observed genotypes and
ancestry proportions can be written as
Please cite this article in press as: Moltke et al., Uncovering the Genetic History of the Present-Day Greenlandic Population, The AmericanJournal of Human Genetics (2015), http://dx.doi.org/10.1016/j.ajhg.2014.11.012
LðpÞ ¼ PrðG j p;aÞ¼
Yni¼1
PrðGi j p;aiÞ
¼Yni¼1
Xh˛H
XKk1¼1
XKk2¼1
PrðGi;h1;h2; k1; k2 j p;aiÞ
¼Yni¼1
Xh˛H
XKk1¼1
XKk2¼1
PrðGi j p;ai;h1;h2ÞPrðh1;h2 j p; k1; k2ÞPrðk1; k2 jaiÞ
¼Yni¼1
Xh˛H
XKk1¼1
XKk2¼1
PrðGi jh1;h2Þpk1h1pk2h2
ak1i a
k2i
¼Yni¼1
Xh˛hðGiÞ
XKk1¼1
XKk2¼1
pk1h1
pk2h2
ak1i a
k2i
In the above, we assume that the ancestral population of a
haplotype is the same at the two SNP sites, given that these sites
are in close proximity along the genome. Furthermore, we denote
the set of all possible pairs of haplotypes by H, whereas we denote
the set of all pairs of haplotypes that are consistent with the geno-
types of individual i by h(Gi). The last rewriting step follows from
the observation that Pr(Gijh1,h2) is equal to 1 if the genotypes Gi
are consistent with the haplotypes h1 and h2 (i.e., h belongs to
h(Gi)) and that Pr(Gijh1,h2) is equal to 0 otherwise.
We obtain maximum-likelihood estimates of the ancestry-spe-
cific haplotype frequencies by maximizing the above likelihood.
This is done efficiently with the following expectation-maximiza-
tion (EM) algorithm. First, random starting points are sampled
from a uniform distribution. Then, EM iterations are performed
until each new step does not change the parameters (we used a
tolerance of 10�6), and each EM iteration for each haplotype fre-
quency is given as
pkj� ¼1
2n
3Xn
i¼1
Ph˛HðGiÞ
PKk1¼1
PKk2¼1p
k1h1pk2h2a
k1i a
k2i
�Ijðh1ÞIkðk1Þ þ Ijðh2ÞIkðk2Þ
�P
h˛HðGiÞPK
k1¼1
PKk2¼1p
k1h1pk2h2a
k1i a
k2i ðIkðk1Þ þ Ikðk2ÞÞ
;
where I is the indicator function.
DðH1;H2;H3;H4Þ ¼PM
i¼1
�f H3i � f H4
i
��f H1i � f H2
i
�
PMi¼1
�f H3i þ f H4
i � 2f H3i f H4
i
��f H1i þ f H2
i � 2f H1i f H2
i
�;
Inbreeding EstimationAdmixture also affects standard estimators of inbreeding
coefficients, and we correct for this by allowing for admix-
ture. We estimate the inbreeding coefficient F for each
individual with a maximum-likelihood method that uses the
estimated admixture proportions a ¼ ða1;a2;.;aKÞ for the
given individual along with the allele frequencies for the K
source populations fs ¼ ðf 1s ; f 2s ;.; f Ks Þ for each site s as
estimated by ADMIXTURE.23 Let gs˛ð0;1;2Þ be the indi-
vidual’s genotype at site s, and let f �s ¼ PKk¼1a
kf ks be the
probability of observing the minor allele at site s. The
likelihood of F given the genotype data, D ¼ ðg1; g2;.; gSÞ, is
then given as
LðFÞ ¼ PrðD j FÞ ¼YSs¼1
Prðgs j FÞ
The
with
Prðgs j FÞ ¼8<:
�1� f �s
�2ð1� FÞ þ �1� f �s
�F; gs ¼ 0
2�1� f �s
�f �s ð1� FÞ; gs ¼ 1
f �s f�s ð1� FÞ þ f �s F; gs ¼ 2
The maximum-likelihood estimate of F is then the F value that
maximizes the above likelihood.
TreeMix AnalysesWe performed TreeMix29 analyses of allele frequencies esti-
mated from two different data sets: the full data set without
LD and the restricted Greenlandic data set combined with
HapMap samples.
For the TreeMix analysis of the allele frequencies estimated
from the full data set without LD, the allele frequencies
were corrected for European ancestry before the analysis was
performed. Then, 100 trees were generated with different
seeds. Except for a few, they all had the same (highest) likeli-
hood. In the cases where all trees did not have the same likeli-
hood, the tree with the highest likelihood was used. Because
this data set was pruned for LD, a window size of one SNP
was used.
Ten trees were generated for the TreeMix analysis of the allele
frequencies estimated from the restricted Greenlandic data set
combined with HapMap samples. All gave the same likelihood.
A window size of 100 SNPs was used for accommodating LD; how-
ever, increasing the window size to 500 or decreasing to 50 did not
change the topology.
D StatisticsWe performed D-statistic-based tests on the SNP chip data from
the restricted Greenlandic data set combined with HapMap sam-
ples. First, we estimated the allele frequency in each genotyped
site separately for the population in each location. Then, we esti-
mated the D statistics as
where H1, H2, H3, and H4 represent populations in the tree (((H1,
H2), H3), H4), where H4 is the outgroup, M is the number of sites
included, and f H1i is the allele frequency for population H1 at site
i.30 Only sites with information for all four populations were
included. Z scores were obtained from the D statistics with SEs
based on a ‘‘delete m jackknife for unequal m’’ procedure31 for 5
Mb regions weighted according to the number of SNPs in each
block.
Inference of Ancestry Tract LengthsGenotypes from the full data set were phased with shapeit232 with
the 1000 Genomes phased variant panel (Phase I v.3) as the refer-
ence panel. HapMap recombination rates (Phase II b37) were used
as a proxy for the human genome genetic map. Local ancestry was
inferred with RFMix33 for Qaanaaq and South Village individuals
with an estimated global European ancestry proportion greater
American Journal of Human Genetics 96, 1–16, January 8, 2015 5
Please cite this article in press as: Moltke et al., Uncovering the Genetic History of the Present-Day Greenlandic Population, The AmericanJournal of Human Genetics (2015), http://dx.doi.org/10.1016/j.ajhg.2014.11.012
than 0.05 according to the ADMIXTURE analysis described above.
We used two ancestral reference populations. As a proxy for the
Inuit ancestral population, we used a reference panel (n ¼ 46)
composed of Greenlandic individuals with a global European
ancestry proportion less than 0.05 (mean European ancestry ¼0.0038; maximum European ancestry ¼ 0.0436). We used the
Danish samples (n ¼ 46) as a reference panel to represent the Eu-
ropean ancestral population. Local ancestry was inferred for all ad-
mixed Qaanaaq and South village individuals jointly with the
RFMix admixture timing parameter G ¼ 20, which corresponds
to admixture occurring at least 500 years ago and a generation
time of 25 years, and a window size of 0.1 cM. We allowed phase
correction and used three iterations of the EM algorithm with
reference panels included. To control for differences in popula-
tion-level admixture proportions between Qaanaaq and South vil-
lages, we matched individuals according to ancestry proportion as
closely as possible, resulting in a matched set of 40 individuals
with a European ancestry proportion of at least 0.05 from each
population. Length distributions of European admixture tracts
were calculated for this matched set, summarized in 5 cM bins,
and compared between the two populations.
The probability of observing at least one tract of length X cM in
an individual, as a function of the time since admixture, can easily
be approximated with the Markov approximation to tract lengths
introduced by Pool and Nielsen.40 The tract lengths can be
described by a two-state Markov process with transition rates l1¼ (1 � m)r(t � 1) and l2 ¼ mr(t � 1), t > 1 from admixed to unad-
mixed DNA and from unadmixed to admixed DNA, respectively.
Here, m is the admixture proportion, r is the recombination rate
per base pair, and t is the admixture time in number of genera-
tions. The probability that site j initiates a run of at least k admixed
sites is R ¼ p2l2(1 � l1)k�1, where p2 is the stationary probability
of the unadmixed state (1 � m). If R is small and the length of the
genome, S, is large, the probability of observing no runs of length
k is then approximately e�RS ¼ exp[S(m � 1)mr(1 þ (m � 1)r(t �1))(k�1)(t � 1)]. With a genome size of S ¼ 2.7 Gb and a recombina-
tion rate of 1.3 3 10�8 per base pair, the probability of observing
no fragments larger than 39 cM is then equal to 0.9945 for an
admixture fraction of m ¼ 0.05 and an admixture time of t ¼ 25.
Equivalently, the probability of seeing at least one fragment of
length 39 cM is ~0.005 if the admixture time is 25 generations.
Ethical ConsiderationsThe Greenlandic samples used in this study were donated by
Greenlandic individuals as part of the general public health
surveys presented in Jørgensen et al.,18 Bjerregaard et al.,19 and
Bjerregaard.34 Ethics approval for genotyping the samples and us-
ing the genotype data for public health studies was received from
the Commission for Scientific Research in Greenland as a part of
the study by Moltke et al.8 The use of the genotype data for the
present study has also received ethics approval from the Commis-
sion for Scientific Research in Greenland (project 2014-08, refer-
ence 2014-098017).
Results
To investigate the genetic history of the present-day
Greenlandic population, we analyzed genetic data from
4,127 Greenlandic individuals from 15 different locations
in Greenland (Figure 1), 547 Greenlandic individuals
6 The American Journal of Human Genetics 96, 1–16, January 8, 2015
living in Denmark, 50 Danish individuals, and 208 unre-
lated individuals from the original HapMap project. All
of these individuals were genotyped for 196,224 SNPs on
the Illumina MetaboChip, and a small subset of them
were exome sequenced as well. The Danish individuals
were included to represent the European ancestors of the
Greenlanders, which are mainly from Denmark and
Norway, and the HapMap individuals were included for
comparison to other populations from the rest of the
world. Note that some of the results presented below
are based on analyses of SNP chip data from all 4,127
Greenlanders and the 50 Danes. Other results are based
on analyses of SNP chip data from a restricted subset of
the Greenlanders. This subset consists of individuals who
are not closely related, do not have any European ancestry
(<5% estimated European ancestry), and have not recently
migrated within Greenland. Because most of the 15 loca-
tions had very few such individuals, only individuals
from Qaanaaq (north), Upernavik villages (west), South
villages (south), Tasiilaq (east), and Tasiilaq villages (east)
were included in these latter analyses. In the following sec-
tions, we will refer to the two data sets on which the below
results are based as (1) the full data set and (2) the restricted
Greenlandic data set. For details about the data sets,
including how many of the 196,224 SNP sites did not
pass filtering prior to the different analysis, see theMaterial
and Methods.
Recent European Gene Flow and Population Structure
Using a subset of the genotyped Greenlandic individuals
(2,733 individuals from the IHIT cohort), we previously
showed in a study focused on disease mapping that there
has been a large amount of gene flow from Europe into
Greenland and that most Greenlanders have both Euro-
pean and Inuit ancestry.8 To further explore the genetic
structure of the Greenlandic population, we here esti-
mated admixture proportions for the full data set by using
the program ADMIXTURE23 and stratified the results
according to location. First, we assumed that the Greenlan-
dic individuals have ancestry from two ancestral popula-
tions (K ¼ 2), so all Danish individuals were assigned one
ancestral population, and the Greenlandic individuals
were assigned a mixture of both ancestral populations
(Figure 2). We interpreted the two ancestry components
of the Greenlandic individuals to be European ancestry
and Inuit ancestry. In doing so, we found that there has
been gene flow from Europeans into most locations in
Greenland and that more than 80% of Greenlanders
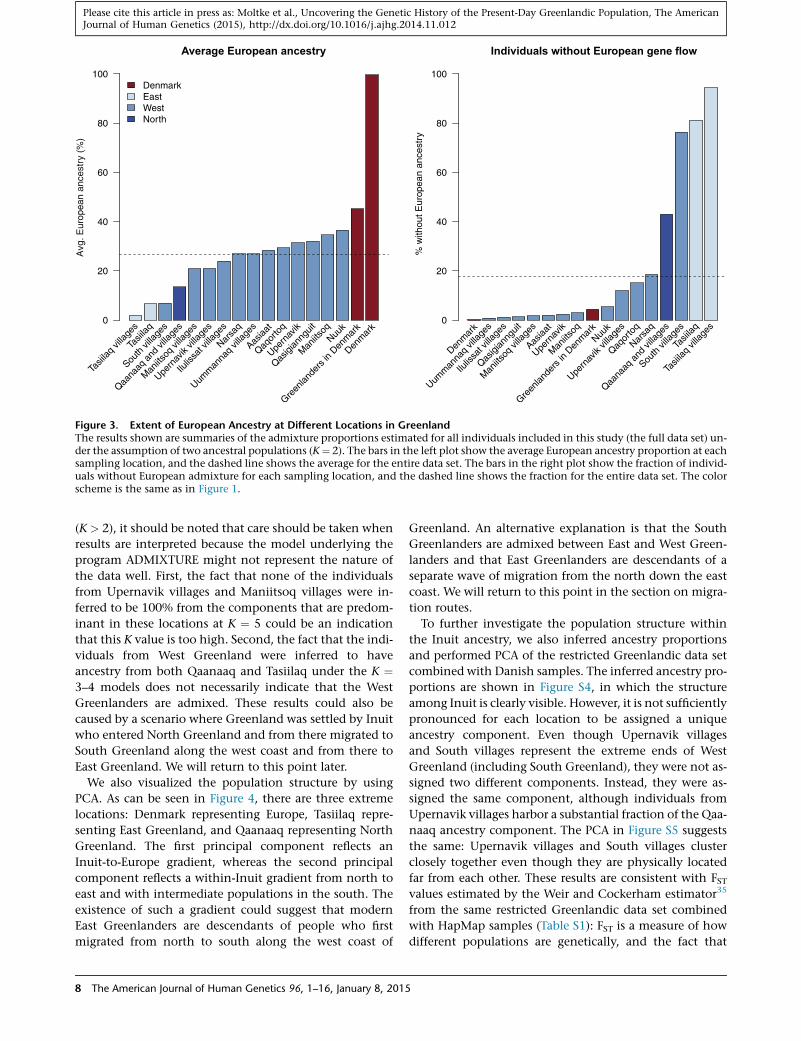
have European ancestry (Figures 2 and 3). On average,
the Greenlanders have ~25% European ancestry; however,
some locations in Greenland have a considerably smaller
amount of European ancestry. Specifically, participants
from Tasiilaq in East Greenland, the small villages in South
Greenland (South villages), and Qaanaaq in North
Greenland (Thule) have less European ancestry. In fact,
most individuals in Tasiilaq and the South villages have
only Inuit ancestry (Figure 3).
K = 2
Adm
ixtu
re p
ropo
rtio
n
0.0
0.2
0.4
0.6
0.8
1.0
K = 3
Adm
ixtu
re p
ropo
rtio
n
0.0
0.2
0.4
0.6
0.8
1.0
K = 4
Adm
ixtu
re p
ropo
rtio
n
0.0
0.2
0.4
0.6
0.8
1.0
K = 5
Adm
ixtu
re p
ropo
rtio
n
0.0
0.2
0.4
0.6
0.8
1.0
Aasiaa
t
Denm
ark
Green
lande
rs in
Den
mar
k
Ilulis
sat v
illage
s
Man
iitsoq
Man
iitsoq
villa
ges
Narsa
qNuu
k
Qaana
aq a
nd vi
llage
s
Qaqor
toq
Qasigi
anng
uit
South
villa
ges
Tasii
laq
Tasii
laq vi
llage
s
Upern
avik
Upern
avik
villag
es
Uumm
anna
q vil
lages
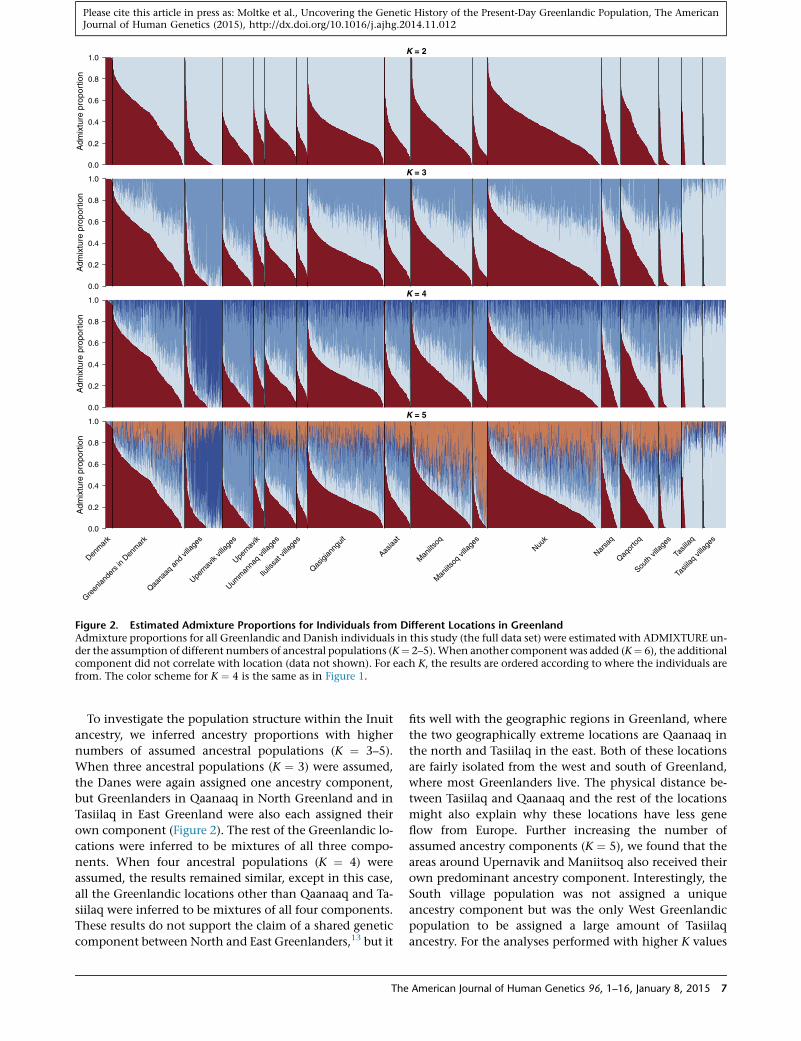
Figure 2. Estimated Admixture Proportions for Individuals from Different Locations in GreenlandAdmixture proportions for all Greenlandic and Danish individuals in this study (the full data set) were estimated with ADMIXTURE un-der the assumption of different numbers of ancestral populations (K¼ 2–5).When another component was added (K¼ 6), the additionalcomponent did not correlate with location (data not shown). For each K, the results are ordered according to where the individuals arefrom. The color scheme for K ¼ 4 is the same as in Figure 1.
Please cite this article in press as: Moltke et al., Uncovering the Genetic History of the Present-Day Greenlandic Population, The AmericanJournal of Human Genetics (2015), http://dx.doi.org/10.1016/j.ajhg.2014.11.012
To investigate the population structure within the Inuit
ancestry, we inferred ancestry proportions with higher
numbers of assumed ancestral populations (K ¼ 3–5).
When three ancestral populations (K ¼ 3) were assumed,
the Danes were again assigned one ancestry component,
but Greenlanders in Qaanaaq in North Greenland and in
Tasiilaq in East Greenland were also each assigned their
own component (Figure 2). The rest of the Greenlandic lo-
cations were inferred to be mixtures of all three compo-
nents. When four ancestral populations (K ¼ 4) were
assumed, the results remained similar, except in this case,
all the Greenlandic locations other than Qaanaaq and Ta-
siilaq were inferred to be mixtures of all four components.
These results do not support the claim of a shared genetic
component between North and East Greenlanders,13 but it
The
fits well with the geographic regions in Greenland, where
the two geographically extreme locations are Qaanaaq in
the north and Tasiilaq in the east. Both of these locations
are fairly isolated from the west and south of Greenland,
where most Greenlanders live. The physical distance be-
tween Tasiilaq and Qaanaaq and the rest of the locations
might also explain why these locations have less gene
flow from Europe. Further increasing the number of
assumed ancestry components (K ¼ 5), we found that the
areas around Upernavik and Maniitsoq also received their
own predominant ancestry component. Interestingly, the
South village population was not assigned a unique
ancestry component but was the only West Greenlandic
population to be assigned a large amount of Tasiilaq
ancestry. For the analyses performed with higher K values
American Journal of Human Genetics 96, 1–16, January 8, 2015 7
ance
stry
(%
)
% w
ithou
tFigure 3. Extent of European Ancestry at Different Locations in GreenlandThe results shown are summaries of the admixture proportions estimated for all individuals included in this study (the full data set) un-der the assumption of two ancestral populations (K¼ 2). The bars in the left plot show the average European ancestry proportion at eachsampling location, and the dashed line shows the average for the entire data set. The bars in the right plot show the fraction of individ-uals without European admixture for each sampling location, and the dashed line shows the fraction for the entire data set. The colorscheme is the same as in Figure 1.
Please cite this article in press as: Moltke et al., Uncovering the Genetic History of the Present-Day Greenlandic Population, The AmericanJournal of Human Genetics (2015), http://dx.doi.org/10.1016/j.ajhg.2014.11.012
(K > 2), it should be noted that care should be taken when
results are interpreted because the model underlying the
program ADMIXTURE might not represent the nature of
the data well. First, the fact that none of the individuals
from Upernavik villages and Maniitsoq villages were in-
ferred to be 100% from the components that are predom-
inant in these locations at K ¼ 5 could be an indication
that this K value is too high. Second, the fact that the indi-
viduals from West Greenland were inferred to have
ancestry from both Qaanaaq and Tasiilaq under the K ¼3–4 models does not necessarily indicate that the West
Greenlanders are admixed. These results could also be
caused by a scenario where Greenland was settled by Inuit
who entered North Greenland and from there migrated to
South Greenland along the west coast and from there to
East Greenland. We will return to this point later.
We also visualized the population structure by using
PCA. As can be seen in Figure 4, there are three extreme
locations: Denmark representing Europe, Tasiilaq repre-
senting East Greenland, and Qaanaaq representing North
Greenland. The first principal component reflects an
Inuit-to-Europe gradient, whereas the second principal
component reflects a within-Inuit gradient from north to
east and with intermediate populations in the south. The
existence of such a gradient could suggest that modern
East Greenlanders are descendants of people who first
migrated from north to south along the west coast of
8 The American Journal of Human Genetics 96, 1–16, January 8, 2015
Greenland. An alternative explanation is that the South
Greenlanders are admixed between East and West Green-
landers and that East Greenlanders are descendants of a
separate wave of migration from the north down the east
coast. We will return to this point in the section on migra-
tion routes.
To further investigate the population structure within
the Inuit ancestry, we also inferred ancestry proportions
and performed PCA of the restricted Greenlandic data set
combined with Danish samples. The inferred ancestry pro-
portions are shown in Figure S4, in which the structure
among Inuit is clearly visible. However, it is not sufficiently
pronounced for each location to be assigned a unique
ancestry component. Even though Upernavik villages
and South villages represent the extreme ends of West
Greenland (including South Greenland), they were not as-
signed two different components. Instead, they were as-
signed the same component, although individuals from
Upernavik villages harbor a substantial fraction of the Qaa-
naaq ancestry component. The PCA in Figure S5 suggests
the same: Upernavik villages and South villages cluster
closely together even though they are physically located
far from each other. These results are consistent with FSTvalues estimated by the Weir and Cockerham estimator35
from the same restricted Greenlandic data set combined
with HapMap samples (Table S1): FST is a measure of how
different populations are genetically, and the fact that
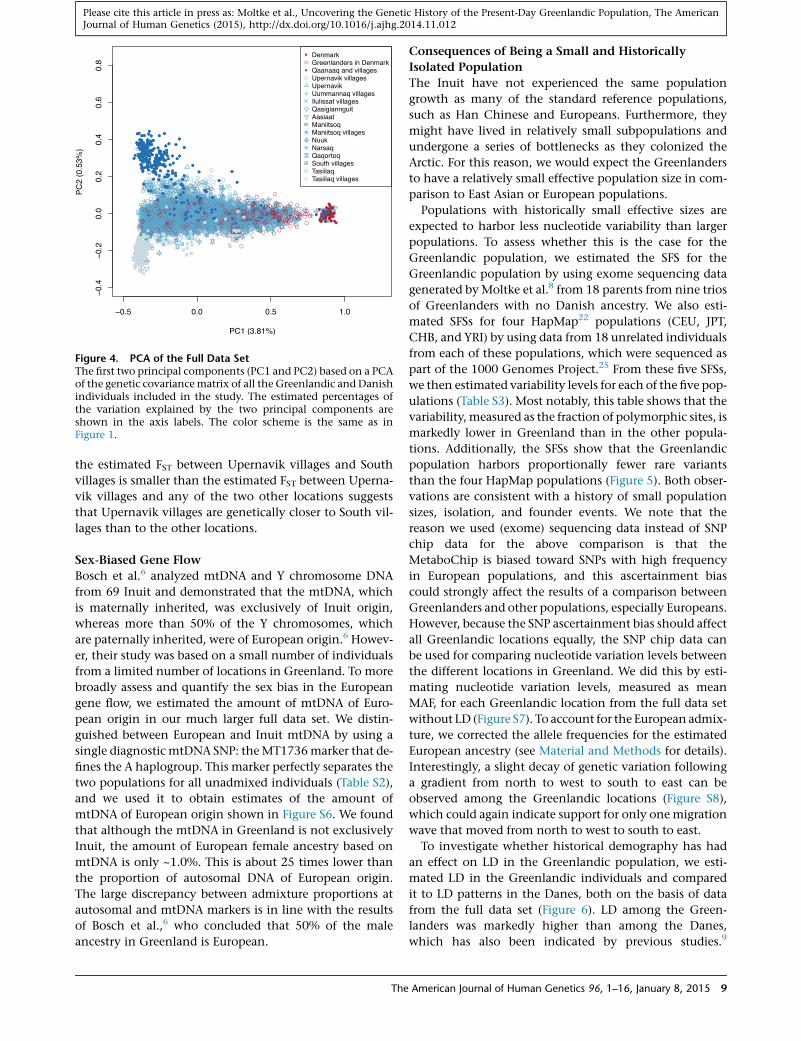
Figure 4. PCA of the Full Data SetThe first two principal components (PC1 and PC2) based on a PCAof the genetic covariancematrix of all the Greenlandic and Danishindividuals included in the study. The estimated percentages ofthe variation explained by the two principal components areshown in the axis labels. The color scheme is the same as inFigure 1.
Please cite this article in press as: Moltke et al., Uncovering the Genetic History of the Present-Day Greenlandic Population, The AmericanJournal of Human Genetics (2015), http://dx.doi.org/10.1016/j.ajhg.2014.11.012
the estimated FST between Upernavik villages and South
villages is smaller than the estimated FST between Uperna-
vik villages and any of the two other locations suggests
that Upernavik villages are genetically closer to South vil-
lages than to the other locations.
Sex-Biased Gene Flow
Bosch et al.6 analyzed mtDNA and Y chromosome DNA
from 69 Inuit and demonstrated that the mtDNA, which
is maternally inherited, was exclusively of Inuit origin,
whereas more than 50% of the Y chromosomes, which
are paternally inherited, were of European origin.6 Howev-
er, their study was based on a small number of individuals
from a limited number of locations in Greenland. To more
broadly assess and quantify the sex bias in the European
gene flow, we estimated the amount of mtDNA of Euro-
pean origin in our much larger full data set. We distin-
guished between European and Inuit mtDNA by using a
single diagnostic mtDNA SNP: theMT1736marker that de-
fines the A haplogroup. This marker perfectly separates the
two populations for all unadmixed individuals (Table S2),
and we used it to obtain estimates of the amount of
mtDNA of European origin shown in Figure S6. We found
that although the mtDNA in Greenland is not exclusively
Inuit, the amount of European female ancestry based on
mtDNA is only ~1.0%. This is about 25 times lower than
the proportion of autosomal DNA of European origin.
The large discrepancy between admixture proportions at
autosomal and mtDNA markers is in line with the results
of Bosch et al.,6 who concluded that 50% of the male
ancestry in Greenland is European.
The
Consequences of Being a Small and Historically
Isolated Population
The Inuit have not experienced the same population
growth as many of the standard reference populations,
such as Han Chinese and Europeans. Furthermore, they
might have lived in relatively small subpopulations and
undergone a series of bottlenecks as they colonized the
Arctic. For this reason, we would expect the Greenlanders
to have a relatively small effective population size in com-
parison to East Asian or European populations.
Populations with historically small effective sizes are
expected to harbor less nucleotide variability than larger
populations. To assess whether this is the case for the
Greenlandic population, we estimated the SFS for the
Greenlandic population by using exome sequencing data
generated byMoltke et al.8 from 18 parents from nine trios
of Greenlanders with no Danish ancestry. We also esti-
mated SFSs for four HapMap22 populations (CEU, JPT,
CHB, and YRI) by using data from 18 unrelated individuals
from each of these populations, which were sequenced as
part of the 1000 Genomes Project.25 From these five SFSs,
we then estimated variability levels for each of the five pop-
ulations (Table S3). Most notably, this table shows that the
variability,measured as the fraction of polymorphic sites, is
markedly lower in Greenland than in the other popula-
tions. Additionally, the SFSs show that the Greenlandic
population harbors proportionally fewer rare variants
than the four HapMap populations (Figure 5). Both obser-
vations are consistent with a history of small population
sizes, isolation, and founder events. We note that the
reason we used (exome) sequencing data instead of SNP
chip data for the above comparison is that the
MetaboChip is biased toward SNPs with high frequency
in European populations, and this ascertainment bias
could strongly affect the results of a comparison between
Greenlanders and other populations, especially Europeans.
However, because the SNP ascertainment bias should affect
all Greenlandic locations equally, the SNP chip data can
be used for comparing nucleotide variation levels between
the different locations in Greenland. We did this by esti-
mating nucleotide variation levels, measured as mean
MAF, for each Greenlandic location from the full data set
without LD (Figure S7). To account for the European admix-
ture, we corrected the allele frequencies for the estimated
European ancestry (see Material and Methods for details).
Interestingly, a slight decay of genetic variation following
a gradient from north to west to south to east can be
observed among the Greenlandic locations (Figure S8),
which could again indicate support for only one migration
wave that moved from north to west to south to east.
To investigate whether historical demography has had
an effect on LD in the Greenlandic population, we esti-
mated LD in the Greenlandic individuals and compared
it to LD patterns in the Danes, both on the basis of data
from the full data set (Figure 6). LD among the Green-
landers was markedly higher than among the Danes,
which has also been indicated by previous studies.9
American Journal of Human Genetics 96, 1–16, January 8, 2015 9
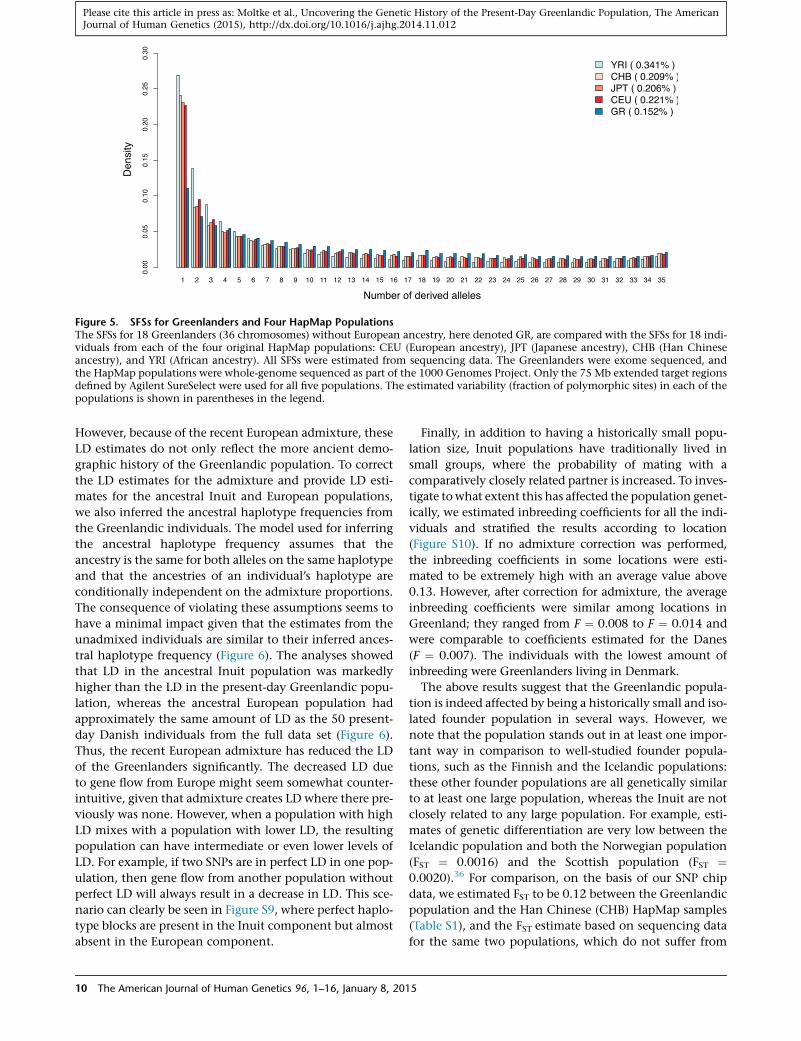
Figure 5. SFSs for Greenlanders and Four HapMap PopulationsThe SFSs for 18 Greenlanders (36 chromosomes) without European ancestry, here denoted GR, are compared with the SFSs for 18 indi-viduals from each of the four original HapMap populations: CEU (European ancestry), JPT (Japanese ancestry), CHB (Han Chineseancestry), and YRI (African ancestry). All SFSs were estimated from sequencing data. The Greenlanders were exome sequenced, andthe HapMap populations were whole-genome sequenced as part of the 1000 Genomes Project. Only the 75 Mb extended target regionsdefined by Agilent SureSelect were used for all five populations. The estimated variability (fraction of polymorphic sites) in each of thepopulations is shown in parentheses in the legend.
Please cite this article in press as: Moltke et al., Uncovering the Genetic History of the Present-Day Greenlandic Population, The AmericanJournal of Human Genetics (2015), http://dx.doi.org/10.1016/j.ajhg.2014.11.012
However, because of the recent European admixture, these
LD estimates do not only reflect the more ancient demo-
graphic history of the Greenlandic population. To correct
the LD estimates for the admixture and provide LD esti-
mates for the ancestral Inuit and European populations,
we also inferred the ancestral haplotype frequencies from
the Greenlandic individuals. The model used for inferring
the ancestral haplotype frequency assumes that the
ancestry is the same for both alleles on the same haplotype
and that the ancestries of an individual’s haplotype are
conditionally independent on the admixture proportions.
The consequence of violating these assumptions seems to
have a minimal impact given that the estimates from the
unadmixed individuals are similar to their inferred ances-
tral haplotype frequency (Figure 6). The analyses showed
that LD in the ancestral Inuit population was markedly
higher than the LD in the present-day Greenlandic popu-
lation, whereas the ancestral European population had
approximately the same amount of LD as the 50 present-
day Danish individuals from the full data set (Figure 6).
Thus, the recent European admixture has reduced the LD
of the Greenlanders significantly. The decreased LD due
to gene flow from Europe might seem somewhat counter-
intuitive, given that admixture creates LD where there pre-
viously was none. However, when a population with high
LD mixes with a population with lower LD, the resulting
population can have intermediate or even lower levels of
LD. For example, if two SNPs are in perfect LD in one pop-
ulation, then gene flow from another population without
perfect LD will always result in a decrease in LD. This sce-
nario can clearly be seen in Figure S9, where perfect haplo-
type blocks are present in the Inuit component but almost
absent in the European component.
10 The American Journal of Human Genetics 96, 1–16, January 8, 201
Finally, in addition to having a historically small popu-
lation size, Inuit populations have traditionally lived in
small groups, where the probability of mating with a
comparatively closely related partner is increased. To inves-
tigate to what extent this has affected the population genet-
ically, we estimated inbreeding coefficients for all the indi-
viduals and stratified the results according to location
(Figure S10). If no admixture correction was performed,
the inbreeding coefficients in some locations were esti-
mated to be extremely high with an average value above
0.13. However, after correction for admixture, the average
inbreeding coefficients were similar among locations in
Greenland; they ranged from F ¼ 0.008 to F ¼ 0.014 and
were comparable to coefficients estimated for the Danes
(F ¼ 0.007). The individuals with the lowest amount of
inbreeding were Greenlanders living in Denmark.
The above results suggest that the Greenlandic popula-
tion is indeed affected by being a historically small and iso-
lated founder population in several ways. However, we
note that the population stands out in at least one impor-
tant way in comparison to well-studied founder popula-
tions, such as the Finnish and the Icelandic populations:
these other founder populations are all genetically similar
to at least one large population, whereas the Inuit are not
closely related to any large population. For example, esti-
mates of genetic differentiation are very low between the
Icelandic population and both the Norwegian population
(FST ¼ 0.0016) and the Scottish population (FST ¼0.0020).36 For comparison, on the basis of our SNP chip
data, we estimated FST to be 0.12 between the Greenlandic
population and the Han Chinese (CHB) HapMap samples
(Table S1), and the FST estimate based on sequencing data
for the same two populations, which do not suffer from
5
SE = 10
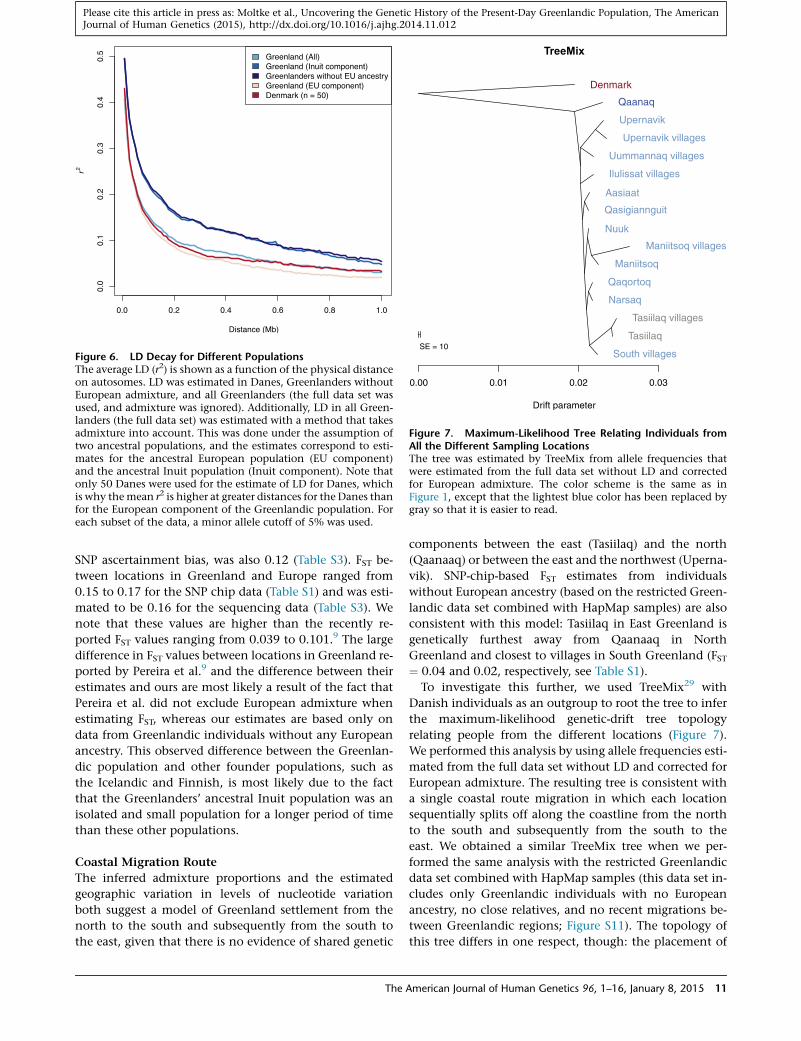
Figure 7. Maximum-Likelihood Tree Relating Individuals fromAll the Different Sampling LocationsThe tree was estimated by TreeMix from allele frequencies thatwere estimated from the full data set without LD and correctedfor European admixture. The color scheme is the same as inFigure 1, except that the lightest blue color has been replaced bygray so that it is easier to read.
Figure 6. LD Decay for Different PopulationsThe average LD (r2) is shown as a function of the physical distanceon autosomes. LD was estimated in Danes, Greenlanders withoutEuropean admixture, and all Greenlanders (the full data set wasused, and admixture was ignored). Additionally, LD in all Green-landers (the full data set) was estimated with a method that takesadmixture into account. This was done under the assumption oftwo ancestral populations, and the estimates correspond to esti-mates for the ancestral European population (EU component)and the ancestral Inuit population (Inuit component). Note thatonly 50 Danes were used for the estimate of LD for Danes, whichis why themean r2 is higher at greater distances for the Danes thanfor the European component of the Greenlandic population. Foreach subset of the data, a minor allele cutoff of 5% was used.
Please cite this article in press as: Moltke et al., Uncovering the Genetic History of the Present-Day Greenlandic Population, The AmericanJournal of Human Genetics (2015), http://dx.doi.org/10.1016/j.ajhg.2014.11.012
SNP ascertainment bias, was also 0.12 (Table S3). FST be-
tween locations in Greenland and Europe ranged from
0.15 to 0.17 for the SNP chip data (Table S1) and was esti-
mated to be 0.16 for the sequencing data (Table S3). We
note that these values are higher than the recently re-
ported FST values ranging from 0.039 to 0.101.9 The large
difference in FST values between locations in Greenland re-
ported by Pereira et al.9 and the difference between their
estimates and ours are most likely a result of the fact that
Pereira et al. did not exclude European admixture when
estimating FST, whereas our estimates are based only on
data from Greenlandic individuals without any European
ancestry. This observed difference between the Greenlan-
dic population and other founder populations, such as
the Icelandic and Finnish, is most likely due to the fact
that the Greenlanders’ ancestral Inuit population was an
isolated and small population for a longer period of time
than these other populations.
Coastal Migration Route
The inferred admixture proportions and the estimated
geographic variation in levels of nucleotide variation
both suggest a model of Greenland settlement from the
north to the south and subsequently from the south to
the east, given that there is no evidence of shared genetic
The
components between the east (Tasiilaq) and the north
(Qaanaaq) or between the east and the northwest (Uperna-
vik). SNP-chip-based FST estimates from individuals
without European ancestry (based on the restricted Green-
landic data set combined with HapMap samples) are also
consistent with this model: Tasiilaq in East Greenland is
genetically furthest away from Qaanaaq in North
Greenland and closest to villages in South Greenland (FST¼ 0.04 and 0.02, respectively, see Table S1).
To investigate this further, we used TreeMix29 with
Danish individuals as an outgroup to root the tree to infer
the maximum-likelihood genetic-drift tree topology
relating people from the different locations (Figure 7).
We performed this analysis by using allele frequencies esti-
mated from the full data set without LD and corrected for
European admixture. The resulting tree is consistent with
a single coastal route migration in which each location
sequentially splits off along the coastline from the north
to the south and subsequently from the south to the
east. We obtained a similar TreeMix tree when we per-
formed the same analysis with the restricted Greenlandic
data set combined with HapMap samples (this data set in-
cludes only Greenlandic individuals with no European
ancestry, no close relatives, and no recent migrations be-
tween Greenlandic regions; Figure S11). The topology of
this tree differs in one respect, though: the placement of
American Journal of Human Genetics 96, 1–16, January 8, 2015 11
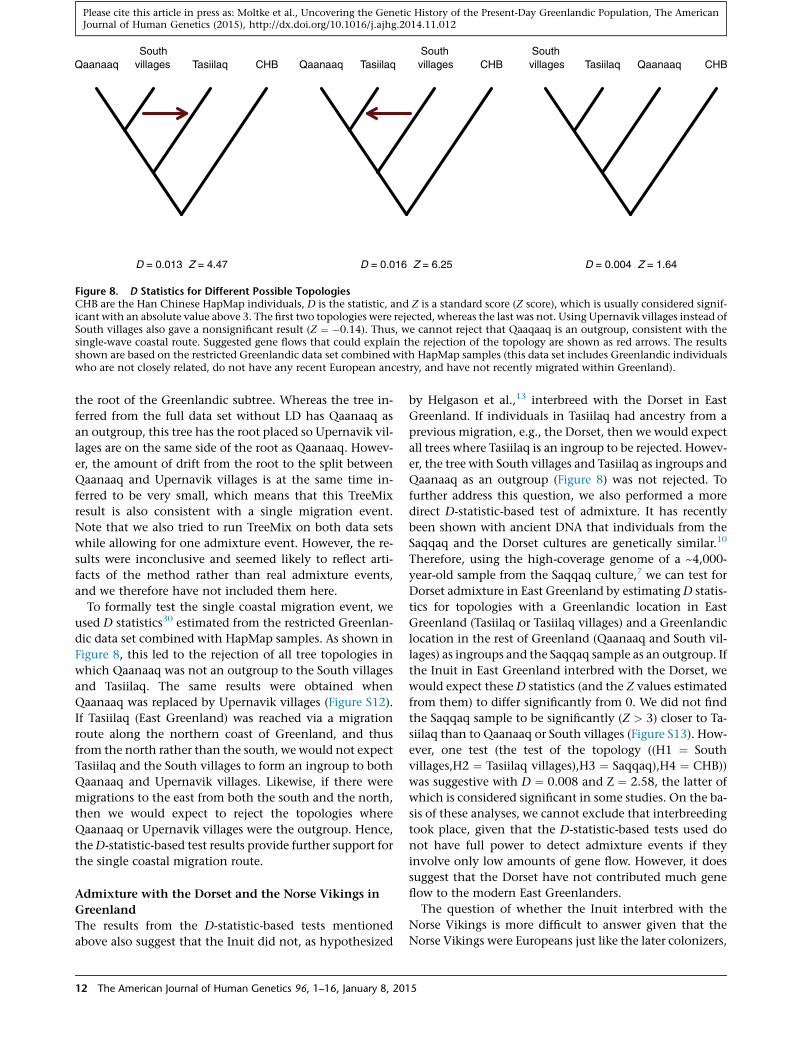
Figure 8. D Statistics for Different Possible TopologiesCHB are the Han Chinese HapMap individuals, D is the statistic, and Z is a standard score (Z score), which is usually considered signif-icant with an absolute value above 3. The first two topologies were rejected, whereas the last was not. Using Upernavik villages instead ofSouth villages also gave a nonsignificant result (Z ¼ �0.14). Thus, we cannot reject that Qaaqaaq is an outgroup, consistent with thesingle-wave coastal route. Suggested gene flows that could explain the rejection of the topology are shown as red arrows. The resultsshown are based on the restricted Greenlandic data set combined with HapMap samples (this data set includes Greenlandic individualswho are not closely related, do not have any recent European ancestry, and have not recently migrated within Greenland).
Please cite this article in press as: Moltke et al., Uncovering the Genetic History of the Present-Day Greenlandic Population, The AmericanJournal of Human Genetics (2015), http://dx.doi.org/10.1016/j.ajhg.2014.11.012
the root of the Greenlandic subtree. Whereas the tree in-
ferred from the full data set without LD has Qaanaaq as
an outgroup, this tree has the root placed so Upernavik vil-
lages are on the same side of the root as Qaanaaq. Howev-
er, the amount of drift from the root to the split between
Qaanaaq and Upernavik villages is at the same time in-
ferred to be very small, which means that this TreeMix
result is also consistent with a single migration event.
Note that we also tried to run TreeMix on both data sets
while allowing for one admixture event. However, the re-
sults were inconclusive and seemed likely to reflect arti-
facts of the method rather than real admixture events,
and we therefore have not included them here.
To formally test the single coastal migration event, we
used D statistics30 estimated from the restricted Greenlan-
dic data set combined with HapMap samples. As shown in
Figure 8, this led to the rejection of all tree topologies in
which Qaanaaq was not an outgroup to the South villages
and Tasiilaq. The same results were obtained when
Qaanaaq was replaced by Upernavik villages (Figure S12).
If Tasiilaq (East Greenland) was reached via a migration
route along the northern coast of Greenland, and thus
from the north rather than the south, we would not expect
Tasiilaq and the South villages to form an ingroup to both
Qaanaaq and Upernavik villages. Likewise, if there were
migrations to the east from both the south and the north,
then we would expect to reject the topologies where
Qaanaaq or Upernavik villages were the outgroup. Hence,
theD-statistic-based test results provide further support for
the single coastal migration route.
Admixture with the Dorset and the Norse Vikings in
Greenland
The results from the D-statistic-based tests mentioned
above also suggest that the Inuit did not, as hypothesized
12 The American Journal of Human Genetics 96, 1–16, January 8, 201
by Helgason et al.,13 interbreed with the Dorset in East
Greenland. If individuals in Tasiilaq had ancestry from a
previous migration, e.g., the Dorset, then we would expect
all trees where Tasiilaq is an ingroup to be rejected. Howev-
er, the tree with South villages and Tasiilaq as ingroups and
Qaanaaq as an outgroup (Figure 8) was not rejected. To
further address this question, we also performed a more
direct D-statistic-based test of admixture. It has recently
been shown with ancient DNA that individuals from the
Saqqaq and the Dorset cultures are genetically similar.10
Therefore, using the high-coverage genome of a ~4,000-
year-old sample from the Saqqaq culture,7 we can test for
Dorset admixture in East Greenland by estimating D statis-
tics for topologies with a Greenlandic location in East
Greenland (Tasiilaq or Tasiilaq villages) and a Greenlandic
location in the rest of Greenland (Qaanaaq and South vil-
lages) as ingroups and the Saqqaq sample as an outgroup. If
the Inuit in East Greenland interbred with the Dorset, we
would expect these D statistics (and the Z values estimated
from them) to differ significantly from 0. We did not find
the Saqqaq sample to be significantly (Z > 3) closer to Ta-
siilaq than to Qaanaaq or South villages (Figure S13). How-
ever, one test (the test of the topology ((H1 ¼ South
villages,H2 ¼ Tasiilaq villages),H3 ¼ Saqqaq),H4 ¼ CHB))
was suggestive with D ¼ 0.008 and Z ¼ 2.58, the latter of
which is considered significant in some studies. On the ba-
sis of these analyses, we cannot exclude that interbreeding
took place, given that the D-statistic-based tests used do
not have full power to detect admixture events if they
involve only low amounts of gene flow. However, it does
suggest that the Dorset have not contributed much gene
flow to the modern East Greenlanders.
The question of whether the Inuit interbred with the
Norse Vikings is more difficult to answer given that the
Norse Vikings were Europeans just like the later colonizers,
5
Please cite this article in press as: Moltke et al., Uncovering the Genetic History of the Present-Day Greenlandic Population, The AmericanJournal of Human Genetics (2015), http://dx.doi.org/10.1016/j.ajhg.2014.11.012
whomwe know interbred with the Inuit. Hence, to answer
this question, one has to separate the recent admixture
(taking place from 1721) from any potential older Euro-
pean admixture, which can be difficult.
One approach to address this question is to take advan-
tage of the fact that most individuals in the south show
no recent European gene flow. The largest Viking settlement
was located in Southwest Greenland, and the ancestors of
the individuals in the South villages passed this Viking set-
tlement before settling in the south. Thus, if the Inuit and
the Norse Vikings interbred in the west before the Inuit
settled in the south or they interbred later in South
Greenland, then we would expect individuals in the south
to have some Norse Viking ancestry. On the contrary, it is
very unlikely that the individuals in Qaanaaq would have
any such ancestry given that they descend from Inuit who
entered Greenland after the Norse Vikings left Greenland.
If the Inuit interbred with the Norse Vikings, we would
therefore expect to see signatures of ~600-year-old European
admixture in theGreenlanders in the South villages, but not
in the Greenlanders in Qaanaaq. However, individuals in
the South villages overall have less European ancestry
than most other locations, including Qaanaaq (Figure 3),
and importantly, more than half of the individuals from
the South villages are estimated to have no European
ancestry. Out of the 169 individuals from the South villages,
only 40 are estimated to have more than 5% European
ancestry. As the variance in admixture proportions among
individuals decreases fast with time since admixture,37,38
finding such a large proportion of individuals without
admixture is unlikely if the time of admixture is old.
Genomes with both Inuit and European ancestry can be
divided into alternating ‘‘ancestry tracts’’ along the length
of each chromosome, and the distribution of tract lengths
in an admixed population carries information about the
timing of admixture and the admixture proportion in a
population.39–42 More recent admixture results in longer
admixture tracts. To investigate whether European
ancestry in the individuals who are estimated to have
more than 5% European ancestry can be attributed to
Norse Viking admixture, we inferred the length of Euro-
pean ancestry tracts in admixed Greenlander genomes.
This analysis showed that admixed individuals from the
South villages all have at least one European ancestry tract
that is longer than 39 cM. The presence of such large Euro-
pean admixture tracts suggests that a substantial propor-
tion of European admixture originated from interbreeding
during the time of Danish colonization, because, as shown
in theMaterial andMethods, the chance that an individual
will harbor such a long tract if the admixture time is 25
generations is ~0.005. However, it does not exclude the
possible presence of admixture tracts originating from
interbreeding with Norse Viking populations. Because
inferring a short ancestry tract with certainty is very diffi-
cult, especially with data from the sparse MetaboChip,
we did not directly look for specific instances of short tracts
expected from more ancient admixture. Instead, we
The
compared the tract-length distributions from Qaanaaq
and the South villages. If Norse Vikings are among the an-
cestors of the Greenlanders in the South villages and not of
the Greenlanders in Qaanaaq, we would expect to see a dif-
ference in their tract-length distributions such that the
South villages have more short tracts. However, when we
matched the inferred global admixture proportions be-
tween the two locations, the two tract-length distributions
were very similar (Figure S14). Thus, the estimated admix-
ture tract distributions do not provide any evidence of
Norse Viking admixture.
Discussion
This study was based on genetic data from more than 10%
of the adult present-day Greenlandic population. The avail-
ability of this substantial data set has allowed us to provide
answers to several previously unresolved questions about
the structure and history of the Greenlandic population.
First, our analyses have allowed us to accurately quantify
the extent of European ancestry in the present-day Green-
landic population across the island. Our analyses have also
allowed us to confirm that there has been a strong male
bias among the European ancestors of the Greenlanders.
Further, our analyses revealed population structure within
the Inuit ancestry component of the population: we
roughly observed a genetic subdivision corresponding to
the geographic division of Greenland into north, west
(including south), and east. Additionally, the observed ge-
netic division also corresponds to the subdivision of the
Greenlandic Inuktitut language into three different dia-
lects. The Greenlanders in Qaanaaq predominately speak
the Inuktun language (Avanersuarmiutut), the Green-
landers in the west (including the south) speak Kalaallisut,
and the Tunumiit in the east predominantly speak Tunu-
miisut (Tunumiit oraasiat). Interestingly, Qaanaaq in the
north and Tasiilaq in the east do not appear to be closer
to each other genetically than to other locations, as re-
ported previously.13
Second, we found that the Greenlandic population in
several ways shows signatures of being a historically iso-
lated and small founder population: it has increased LD,
especially in the Inuit ancestral component of the popula-
tion, and decreased nucleotide diversity. Interestingly, we
did not find evidence that the tradition of living in small
groups has led to increased rates of inbreeding in Green-
landers relative to Europeans. Furthermore, we found
that, unlike other founder populations studied to date,
the Greenlandic population is highly genetically differen-
tiated from all large populations, such as Europeans or East
Asians, most likely because it has been isolated and
affected by bottlenecks in population size and generally
small population sizes for a long period of time. However,
it should be noted that FST would presumably be smaller if
one compared the Greenlandic population with other
Inuit populations, such as Yupik, or Native American
American Journal of Human Genetics 96, 1–16, January 8, 2015 13
Please cite this article in press as: Moltke et al., Uncovering the Genetic History of the Present-Day Greenlandic Population, The AmericanJournal of Human Genetics (2015), http://dx.doi.org/10.1016/j.ajhg.2014.11.012
and some Siberian populations, which we were not able to
do because of a lack of comparable data. These features
make the Greenlandic population potentially well suited
for genetic mapping of variants associated with disease
because increased LD means that fewer SNPs need to be
genotyped for obtaining dense genome-wide coverage.
Furthermore, the high degree of genetic differentiation,
and the strong effect of genetic drift, might suggest that
causal variants that are very rare in other populations
could segregate at a high frequency in this population.
In fact, Moltke et al.8 found a variant that is common in
Greenland but rare in the rest of the world, which explains
more than 10% of all type 2 diabetes cases in Greenland.
Thus far, only variants associated with type-2-diabetes-
related traits have been mapped in this population. Our re-
sults should encourage more association mapping studies
on other traits in the Greenlandic population or other his-
torically isolated populations.
Third, we found no support for previous hypotheses sug-
gesting multiple migration events. On the contrary, our
results provide multiple lines of evidence that support a
single migration wave moving into Northwest Greenland
and southward along the west coast and then finally reach-
ing the east coast by passing the south tip of Greenland. It
should be noted that we cannot determine from currently
available data whether there have been multiple migra-
tions into North Greenland (Qaanaaq) from Canada. The
current population in Qaanaaq originated from a migra-
tion of central Canadian Inuit in the 17th century, and in
1864 a little group of Inuit from Baffin Island arrived in
the Thule district.43 This should, however, not change
the conclusion of our analyses given that the current
population there would be similar to the previous one.
However, to be extra careful, we also performed the same
analyses by using Upernavik villages instead of Qaanaaq
and obtained similar results. What we can conclude is
that the data are not compatible with several migrations
along the coast of West Greenland or East Greenland,
because bothQaanaaq and Upernavik villages form an out-
group to East and West Greenland.
Finally, we found no evidence of interbreeding with
Dorset in East Greenland as hypothesized by Helgason
et al.13 and others. As above, this is based on the argument
that the data are compatible with Qaanaaq as a proper out-
group, which we would not expect if the East Green-
landers and the Dorset interbred. We cannot formally
exclude that any interbreeding happened, but our data
suggest that the Dorset have not contributed much ge-
netic ancestry to the modern East Greenlanders. Likewise,
we did not find evidence of interbreeding between Inuit
and Norse Vikings. Because the largest Viking settlement
was located in Southwest Greenland, we would expect
such interbreeding to have left a genetic signature in the
individuals in the South villages, and we would not expect
it to be present in Qaanaaq. However, we observed no
more European ancestry in the South villages than in
Qaanaaq. On the contrary, more than half of the individ-
14 The American Journal of Human Genetics 96, 1–16, January 8, 201
uals were inferred to have no European ancestry at this
location, unlike at most of the other locations, including
Qaanaaq. Additionally, all individuals with more than
5% European admixture harbored long (>39 cM) ancestral
European tracts, which we would expect from very recent
admixture. Thus, the most parsimonious explanation is
that the admixture in these individuals was caused by
very recent admixture and not Norse Viking gene flow.
Furthermore, after correcting for admixture proportions,
we found that the South villages had no excess of short Eu-
ropean ancestry tracts in comparison to Qaanaaq, as we
would expect if the Norse Vikings were among the ances-
tors of the Greenlanders in the South villages and not
among the ancestors of the Greenlanders in Qaanaaq.
These results do not completely rule out the possibility
that the Inuit and the Norse Vikings interbred, but they
suggest that the Norse Viking genetic contribution,
if any, to the present-day Greenlandic gene pool was
minimal.
Several of the above results contradict conclusions
drawn from previous studies, presumably because previous
studies used small sample sizes and/or a small set of genetic
markers. For instance, the hypotheses proposed by Helga-
son et al.13 were based solely on mtDNA and could be ex-
plained by incomplete lineage sorting. Other results,
such as the lack of Norse Viking admixture, are well in
line with previous studies that have found no genetic evi-
dence of such admixture10 and thus provide further sup-
port for their conclusions.
In conclusion, we have presented the largest genetic data
set to date for an Arctic population. Our findings comple-
ment the recent ancient-DNA-based study by Raghavan
et al.10 and provide knowledge about the history of the pre-
sent-day Greenlandic population.
Supplemental Data
Supplemental Data include 14 figures and three tables and can be
found with this article online at http://dx.doi.org/10.1016/j.ajhg.
2014.11.012.
Acknowledgments
We would first and foremost like to thank all the Greenlandic par-
ticipants. Furthermore, we would like to thank the funding
agencies and research centers whose funding made this study
possible: the Danish Council for Independent Research (DFF-
YDUN), the Villum Foundation, the Steno Diabetes Center, the
NIH (R01-HG003229), the Human Frontiers in Science Program
Organization (LT00320/2104), and the Novo Nordisk Foundation
Center for Basic Metabolic Research, which is an independent
research center at the University of Copenhagen and is partially
funded by an unrestricted donation from the Novo Nordisk Foun-
dation (www.metabol.ku.dk). The Inuit Health in Transition
Study, from which a subset of the data used in this study
originates, was supported by Karen Elise Jensen’s Foundation,
NunaFonden, the Danish Council for Independent Research, the
Medical Research Council of Greenland, and the Commission
for Scientific Research in Greenland.
5
Please cite this article in press as: Moltke et al., Uncovering the Genetic History of the Present-Day Greenlandic Population, The AmericanJournal of Human Genetics (2015), http://dx.doi.org/10.1016/j.ajhg.2014.11.012
Received: September 30, 2014
Accepted: November 20, 2014
Published: December 31, 2014
References
1. Gulløv, H.C. (2004). Grønlands forhistorie (Copenhagen: Gyl-
dendal).
2. Gulløv, H.C. (2008). The nature of contact between native
Greenlanders and Norse. Journal of the North Atlantic 1,
16–24.
3. Appelt, M., and Gulløv, H.C. (2009). Tunit, Norsemen, and
Inuit in Thirteenth-Century Northwest Greenland: Dorset be-
tween the Devil and the Deep Sea. In The Northern World AD
900–1400, H. Maschner, O. Mason, and R. McGhee, eds. (Salt
Lake City: University of Utah Press), pp. 300–320.
4. Sørensen, M., and Gulløv, H.C. (2012). The Prehistory of Inuit
in Northeast Greenland. Arctic Anthropol. 49, 88–104.
5. Gulløv, H.C. (2000). On depopulation: A case study from
Southeast Greenland. In Identities and Cultural Contacts in
the Arctic, M. Appelt, J. Berglund, and H.C. Gulløv, eds. (Co-
penhagen: Danish Polar Center), pp. 43–54.
6. Bosch, E., Calafell, F., Rosser, Z.H., Nørby, S., Lynnerup, N.,
Hurles, M.E., and Jobling, M.A. (2003). High level of male-
biased Scandinavian admixture in Greenlandic Inuit shown
by Y-chromosomal analysis. Hum. Genet. 112, 353–363.
7. Rasmussen, M., Li, Y., Lindgreen, S., Pedersen, J.S., Albrecht-
sen, A., Moltke, I., Metspalu, M., Metspalu, E., Kivisild, T.,
Gupta, R., et al. (2010). Ancient human genome sequence of
an extinct Palaeo-Eskimo. Nature 463, 757–762.
8. Moltke, I., Grarup, N., Jørgensen, M.E., Bjerregaard, P., Tree-
bak, J.T., Fumagalli, M., Korneliussen, T.S., Andersen, M.A.,
Nielsen, T.S., Krarup, N.T., et al. (2014). A common Greenlan-
dic TBC1D4 variant confers muscle insulin resistance and type
2 diabetes. Nature 512, 190–193.
9. Pereira, V., Tomas, C., Sanchez, J.J., Syndercombe-Court, D.,
Amorim, A., Gusmao, L., Prata, M.J., and Morling, N. (2014).
The peopling of Greenland: further insights from the analysis
of genetic diversity using autosomal and X-chromosomal
markers. Eur. J. Hum. Genet.
10. Raghavan, M., DeGiorgio, M., Albrechtsen, A., Moltke, I., Sko-
glund, P., Korneliussen, T.S., Grønnow, B., Appelt, M., Gulløv,
H.C., Friesen, T.M., et al. (2014). The genetic prehistory of the
New World Arctic. Science 345, 1255832.
11. Lynnerup, N. (1998). The Greenland Norse: a biological-
anthropological study (Greenland: Commission for Scientific
Research in Greenland).
12. Kleivan, I. (1984). History of Norse Greenland. In Handbook
of North American Indians, Vol. 5, Damas D., ed. (Washing-
ton, D.C.: Smithsonian Institution), pp. 549–555.
13. Helgason, A., Palsson, G., Pedersen, H.S., Angulalik, E., Gun-
narsdottir, E.D., Yngvadottir, B., and Stefansson, K. (2006).
mtDNA variation in Inuit populations of Greenland and Can-
ada: migration history and population structure. Am. J. Phys.
Anthropol. 130, 123–134.
14. Gulløv, H.C. (1997). From Middle Ages to Colonial Times:
archaeological and ethnohistorical studies of the Thule cul-
ture in south west Greenland 1300-1800 AD (Greenland:
Commission for Scientific Research in Greenland).
15. Petersen, R. (1984). East Greenland before 1950. In Handbook
of North American Indians, Vol. 5, Damas D., ed. (Washing-
ton, D.C.: Smithsonian Institution), pp. 622–639.
The
16. Rasmussen, K. (1924). Myter og Sagn fra Grønland, II. Vest-
grønland (Copenhagen: Gyldendal).
17. McGhee, R. (1996). Ancient People of the Arctic (Vancouver:
UBC Press).
18. Jørgensen, M.E., Borch-Johnsen, K., Stolk, R., and Bjerregaard,
P. (2013). Fat distribution and glucose intolerance among
Greenland Inuit. Diabetes Care 36, 2988–2994.
19. Bjerregaard, P., Curtis, T., Borch-Johnsen, K., Mulvad, G.,
Becker, U., Andersen, S., and Backer, V. (2003). Inuit health
in Greenland: a population survey of life style and disease in
Greenland and among Inuit living in Denmark. Int. J. Circum-
polar Health 62 (Suppl 1 ), 3–79.
20. Jørgensen, M.E., Glumer, C., Bjerregaard, P., Gyntelberg, F.,
Jørgensen, T., and Borch-Johnsen, K.; Grennland Population
Study (2003). Obesity and central fat pattern among
Greenland Inuit and a general population of Denmark (In-
ter99): relationship to metabolic risk factors. Int. J. Obes. Re-
lat. Metab. Disord. 27, 1507–1515.
21. Voight, B.F., Kang, H.M., Ding, J., Palmer, C.D., Sidore, C.,
Chines, P.S., Burtt, N.P., Fuchsberger, C., Li, Y., Erdmann, J.,
et al. (2012). The metabochip, a custom genotyping array
for genetic studies of metabolic, cardiovascular, and anthropo-
metric traits. PLoS Genet. 8, e1002793.
22. International HapMap Consortium (2003). The International
HapMap Project. Nature 426, 789–796.
23. Alexander, D.H., Novembre, J., and Lange, K. (2009). Fast
model-based estimation of ancestry in unrelated individuals.
Genome Res. 19, 1655–1664.
24. Moltke, I., and Albrechtsen, A. (2014). RelateAdmix: a soft-
ware tool for estimating relatedness between admixed individ-
uals. Bioinformatics 30, 1027–1028.
25. Abecasis, G.R., Altshuler, D., Auton, A., Brooks, L.D., Durbin,
R.M., Gibbs, R.A., Hurles, M.E., and McVean, G.A.; 1000 Ge-
nomes Project Consortium (2010). A map of human genome
variation from population-scale sequencing. Nature 467,
1061–1073.
26. Patterson, N., Price, A.L., and Reich, D. (2006). Population
structure and eigenanalysis. PLoS Genet. 2, e190.
27. Nielsen, R., Korneliussen, T., Albrechtsen, A., Li, Y., andWang,
J. (2012). SNP calling, genotype calling, and sample allele fre-
quency estimation from New-Generation Sequencing data.
PLoS ONE 7, e37558.
28. Korneliussen, T.S., Albrechtsen, A., and Nielsen, R. (2014).
ANGSD: Analysis of Next Generation Sequencing Data. BMC
Bioinformatics 15, 356.
29. Pickrell, J.K., and Pritchard, J.K. (2012). Inference of popula-
tion splits and mixtures from genome-wide allele frequency
data. PLoS Genet. 8, e1002967.
30. Patterson, N., Moorjani, P., Luo, Y., Mallick, S., Rohland, N.,
Zhan, Y., Genschoreck, T., Webster, T., and Reich, D. (2012).
Ancient admixture inhumanhistory.Genetics192, 1065–1093.
31. Busing, F.M., Meijer, E., and VanDer Leeden, R. (1999). Delete-
m jackknife for unequal m. Stat. Comput. 9, 3–8.
32. Delaneau, O., and Marchini, J.; 1000 Genomes Project Con-
sortium (2014). Integrating sequence and array data to create
an improved 1000 Genomes Project haplotype reference
panel. Nat. Commun. 5. Published online June 13, 2014.
http://dx.doi.org/10.1038/ncomms4934.
33. Maples, B.K., Gravel, S., Kenny, E.E., and Bustamante, C.D.
(2013). RFMix: a discriminative modeling approach for rapid
and robust local-ancestry inference. Am. J. Hum. Genet. 93,
278–288.
American Journal of Human Genetics 96, 1–16, January 8, 2015 15
Please cite this article in press as: Moltke et al., Uncovering the Genetic History of the Present-Day Greenlandic Population, The AmericanJournal of Human Genetics (2015), http://dx.doi.org/10.1016/j.ajhg.2014.11.012
34. Bjerregaard, P. (2011). Inuit Health in Transition—Greenland
survey 2005–2010. Population sample and survey methods.
SIF Writings on Greenland (Copenhagen: National Institute
of Public Health).
35. Weir, B.S., and Cockerham, C.C. (1984). Estimating F statistics
for the analysis of population structure. Evolution 38, 1358–
1370.
36. Price, A.L., Helgason, A., Palsson, S., Stefansson, H., St Clair,
D., Andreassen, O.A., Reich, D., Kong, A., and Stefansson, K.
(2009). The impact of divergence time on the nature of popu-
lation structure: an example from Iceland. PLoS Genet. 5,
e1000505.
37. Verdu, P., and Rosenberg, N.A. (2011). A general mechanistic
model for admixture histories of hybrid populations. Genetics
189, 1413–1426.
16 The American Journal of Human Genetics 96, 1–16, January 8, 201
38. Liang, M., and Nielsen, R. (2014). Understanding Admixture
Fractions. bioRxiv http://dx.doi.org/10.1101/008078.
39. Falush, D., Stephens,M., and Pritchard, J.K. (2003). Inference of
population structure using multilocus genotype data: linked
loci and correlated allele frequencies. Genetics 164, 1567–1587.
40. Pool, J.E., and Nielsen, R. (2009). Inference of historical
changes in migration rate from the lengths of migrant tracts.
Genetics 181, 711–719.
41. Gravel, S. (2012). Population genetics models of local
ancestry. Genetics 191, 607–619.
42. Liang, M., and Nielsen, R. (2014). The lengths of admixture
tracts. Genetics 197, 953–967.
43. Mary-Rousseliere, G. (1980). Qitdlarssuaq, l’histoire d’une
migration polaire (Montreal: Presses de l’Universite de Mon-
treal).
5
The American Journal of Human Genetics, Volume 96
Supplemental Data
Uncovering the Genetic History of the Present-Day
Greenlandic Population
Ida Moltke, Matteo Fumagalli, Thorfinn S. Korneliussen, Jacob E. Crawford, Peter
Bjerregaard, Marit E. Jørgensen, Niels Grarup, Hans Christian Gulløv, Allan Linneberg,
Oluf Pedersen, Torben Hansen, Rasmus Nielsen, and Anders Albrechtsen
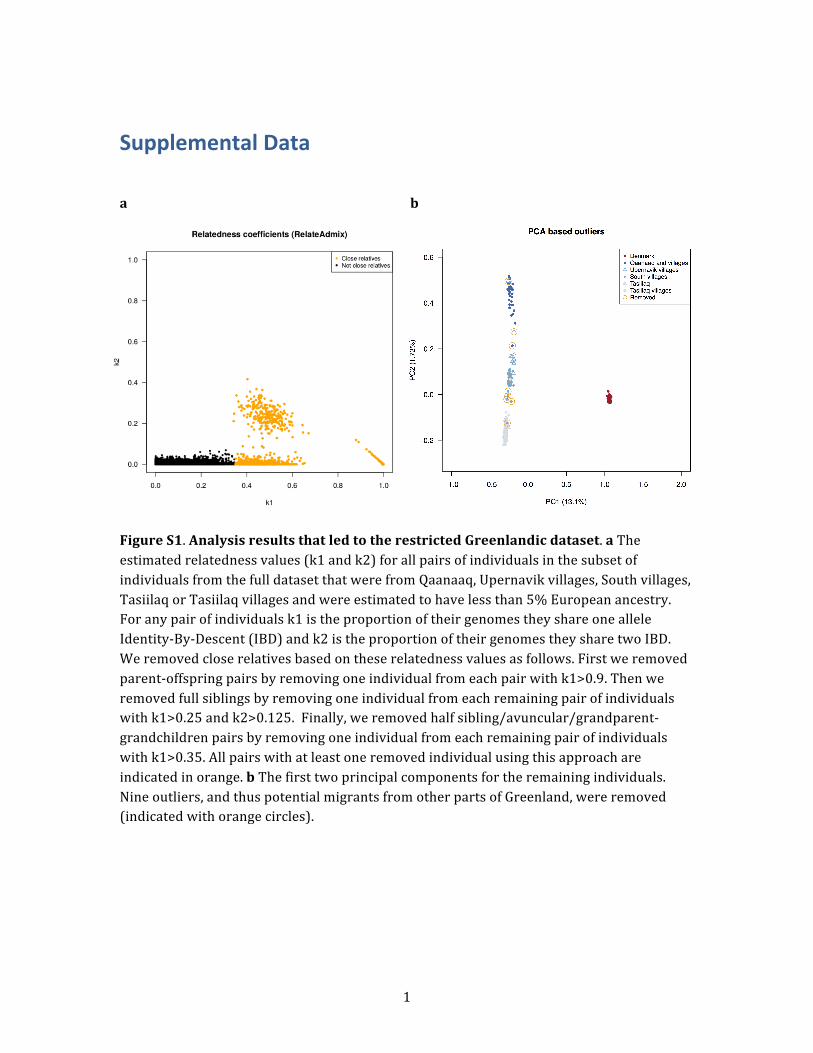
1
Supplemental Data
a b
Figure S1. Analysis results that led to the restricted Greenlandic dataset. a The estimated relatedness values (k1 and k2) for all pairs of individuals in the subset of individuals from the full dataset that were from Qaanaaq, Upernavik villages, South villages, Tasiilaq or Tasiilaq villages and were estimated to have less than 5% European ancestry. For any pair of individuals k1 is the proportion of their genomes they share one allele Identity-‐By-‐Descent (IBD) and k2 is the proportion of their genomes they share two IBD. We removed close relatives based on these relatedness values as follows. First we removed parent-‐offspring pairs by removing one individual from each pair with k1>0.9. Then we removed full siblings by removing one individual from each remaining pair of individuals with k1>0.25 and k2>0.125. Finally, we removed half sibling/avuncular/grandparent-‐grandchildren pairs by removing one individual from each remaining pair of individuals with k1>0.35. All pairs with at least one removed individual using this approach are indicated in orange. b The first two principal components for the remaining individuals. Nine outliers, and thus potential migrants from other parts of Greenland, were removed (indicated with orange circles).
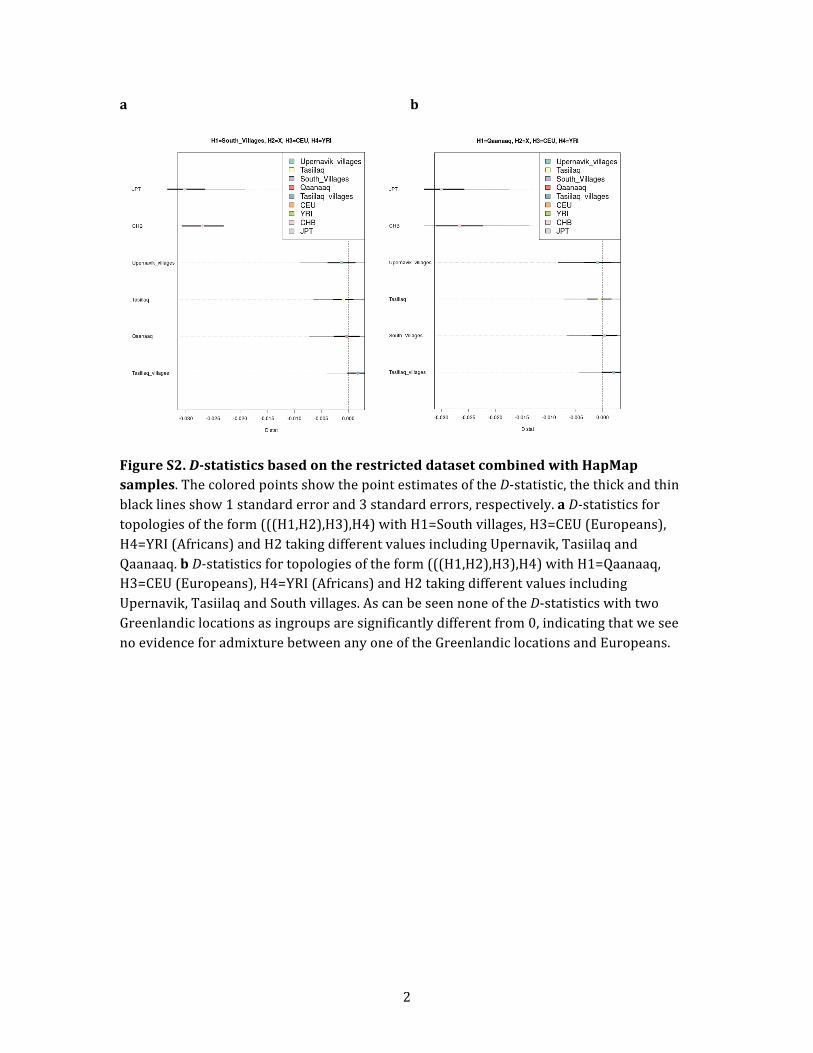
2
a b
Figure S2. D-‐statistics based on the restricted dataset combined with HapMap samples. The colored points show the point estimates of the D-‐statistic, the thick and thin black lines show 1 standard error and 3 standard errors, respectively. a D-‐statistics for topologies of the form (((H1,H2),H3),H4) with H1=South villages, H3=CEU (Europeans), H4=YRI (Africans) and H2 taking different values including Upernavik, Tasiilaq and Qaanaaq. b D-‐statistics for topologies of the form (((H1,H2),H3),H4) with H1=Qaanaaq, H3=CEU (Europeans), H4=YRI (Africans) and H2 taking different values including Upernavik, Tasiilaq and South villages. As can be seen none of the D-‐statistics with two Greenlandic locations as ingroups are significantly different from 0, indicating that we see no evidence for admixture between any one of the Greenlandic locations and Europeans.
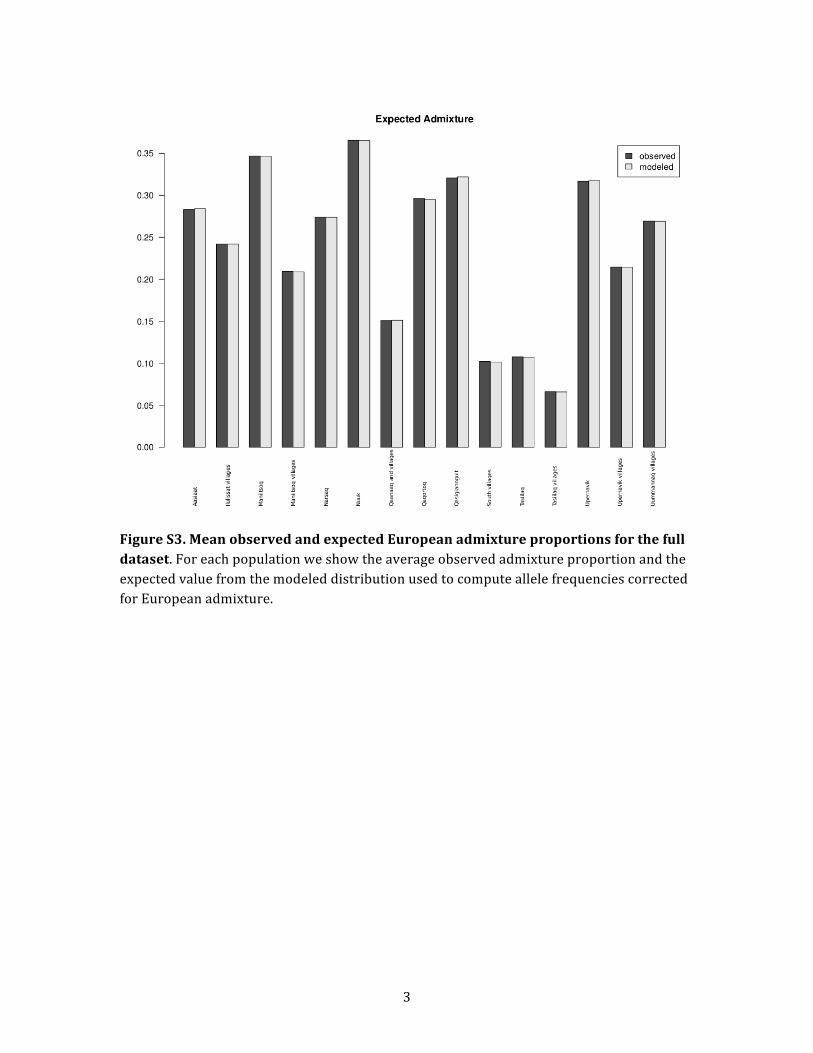
3
Figure S3. Mean observed and expected European admixture proportions for the full dataset. For each population we show the average observed admixture proportion and the expected value from the modeled distribution used to compute allele frequencies corrected for European admixture.
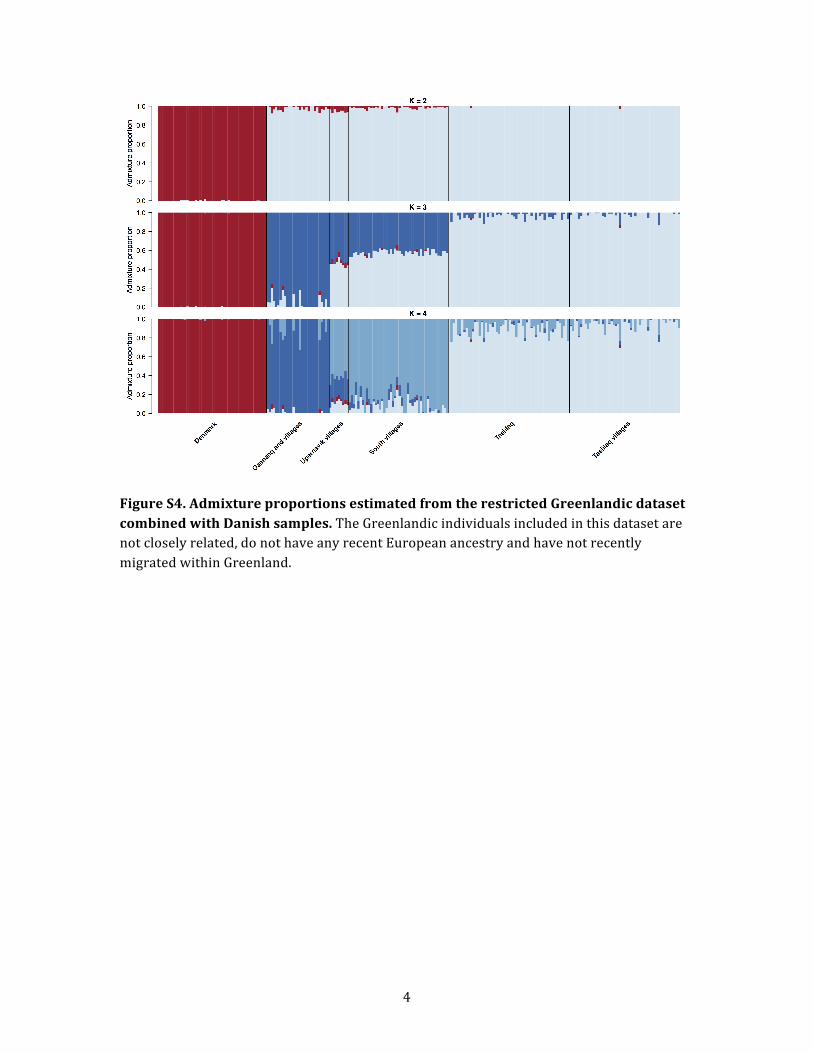
4
Figure S4. Admixture proportions estimated from the restricted Greenlandic dataset combined with Danish samples. The Greenlandic individuals included in this dataset are not closely related, do not have any recent European ancestry and have not recently migrated within Greenland.
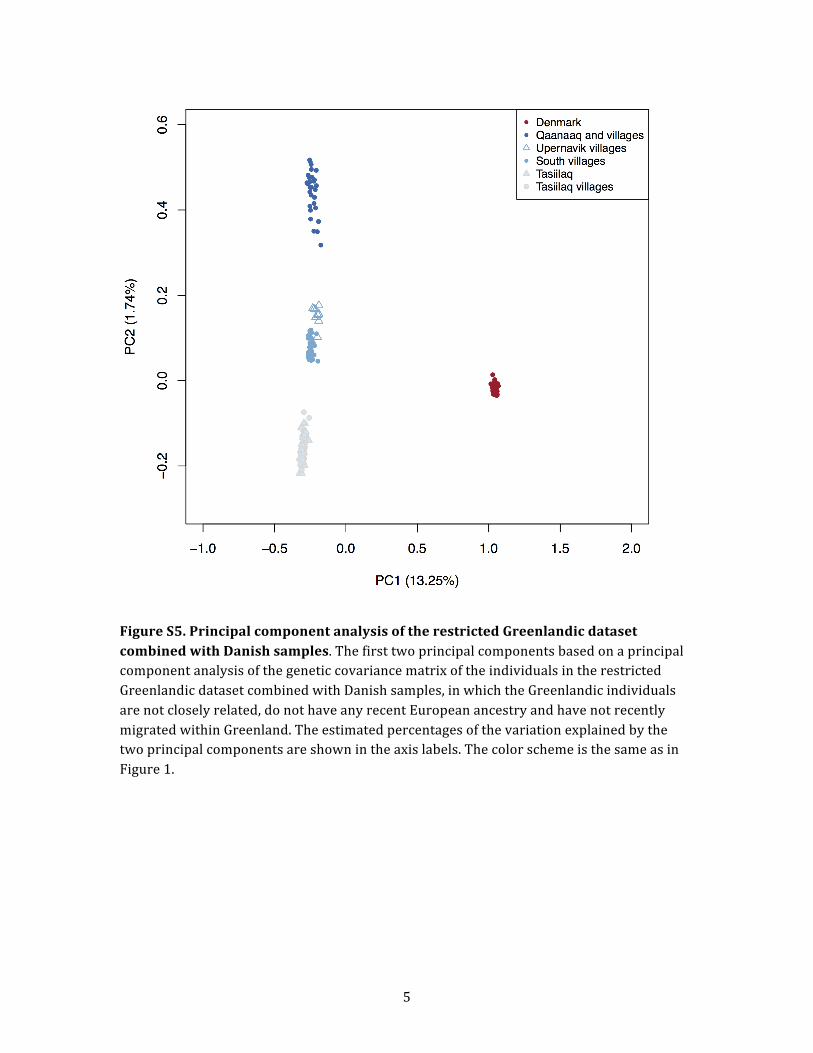
5
Figure S5. Principal component analysis of the restricted Greenlandic dataset combined with Danish samples. The first two principal components based on a principal component analysis of the genetic covariance matrix of the individuals in the restricted Greenlandic dataset combined with Danish samples, in which the Greenlandic individuals are not closely related, do not have any recent European ancestry and have not recently migrated within Greenland. The estimated percentages of the variation explained by the two principal components are shown in the axis labels. The color scheme is the same as in Figure 1.
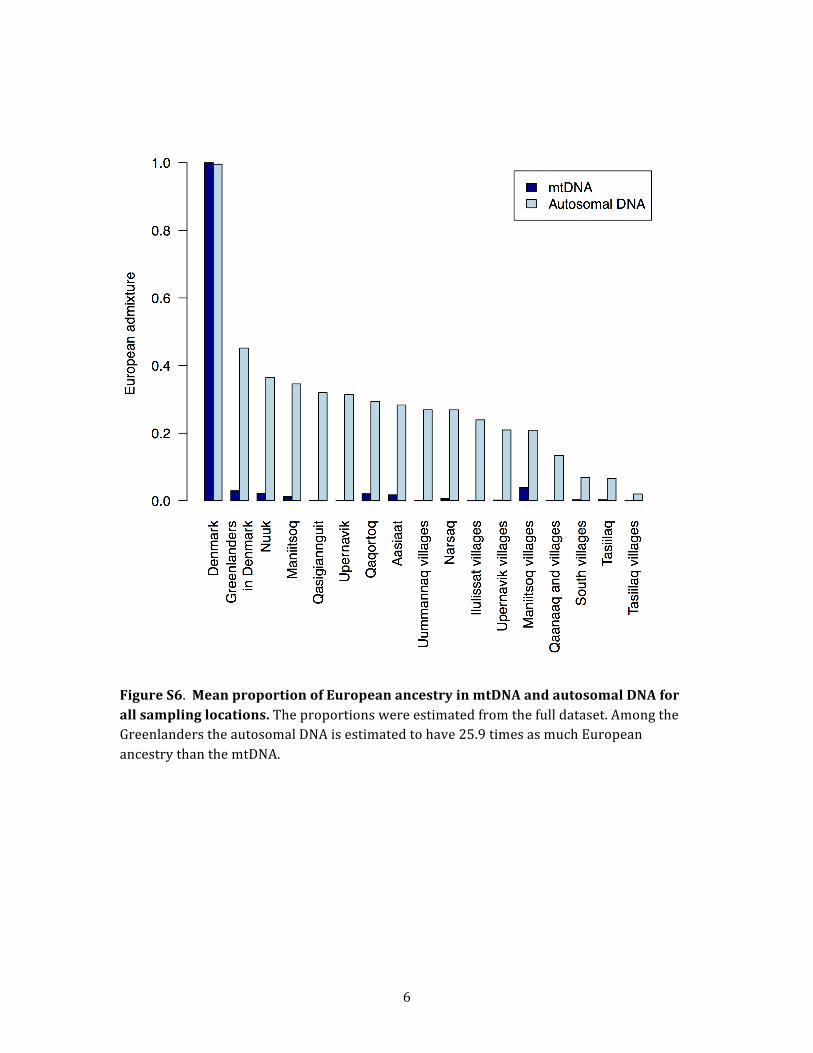
6
Figure S6. Mean proportion of European ancestry in mtDNA and autosomal DNA for all sampling locations. The proportions were estimated from the full dataset. Among the Greenlanders the autosomal DNA is estimated to have 25.9 times as much European ancestry than the mtDNA.
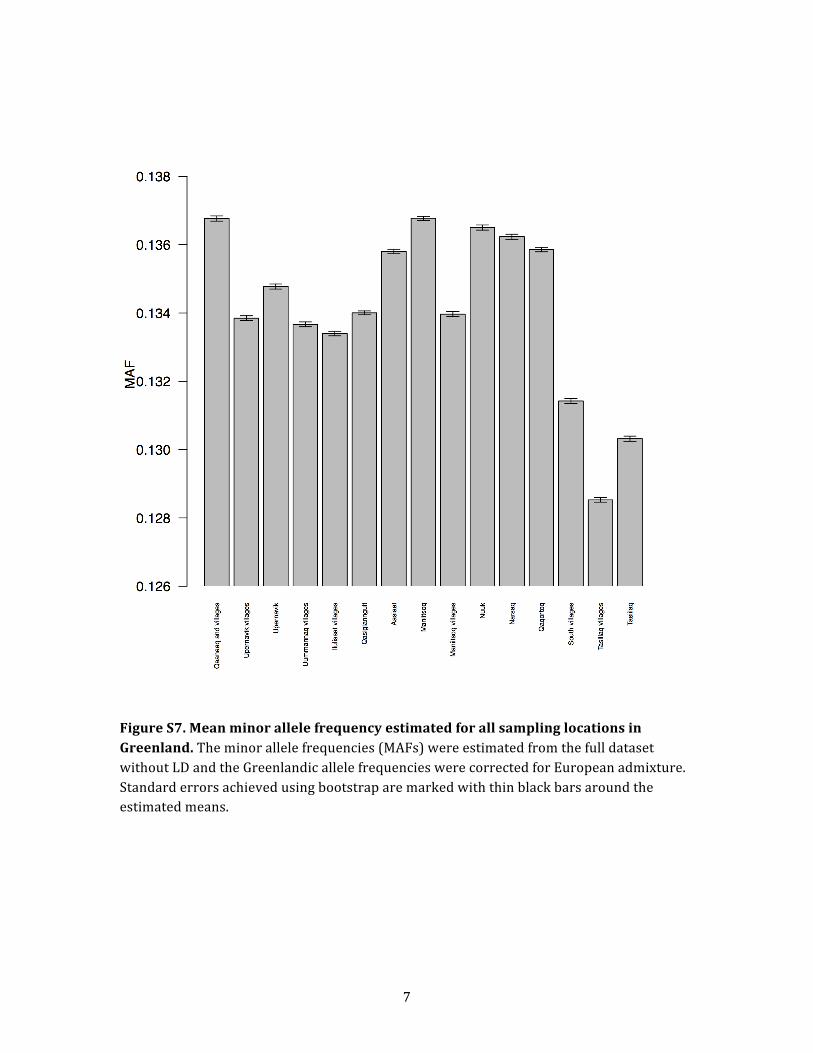
7
Figure S7. Mean minor allele frequency estimated for all sampling locations in Greenland. The minor allele frequencies (MAFs) were estimated from the full dataset without LD and the Greenlandic allele frequencies were corrected for European admixture. Standard errors achieved using bootstrap are marked with thin black bars around the estimated means.
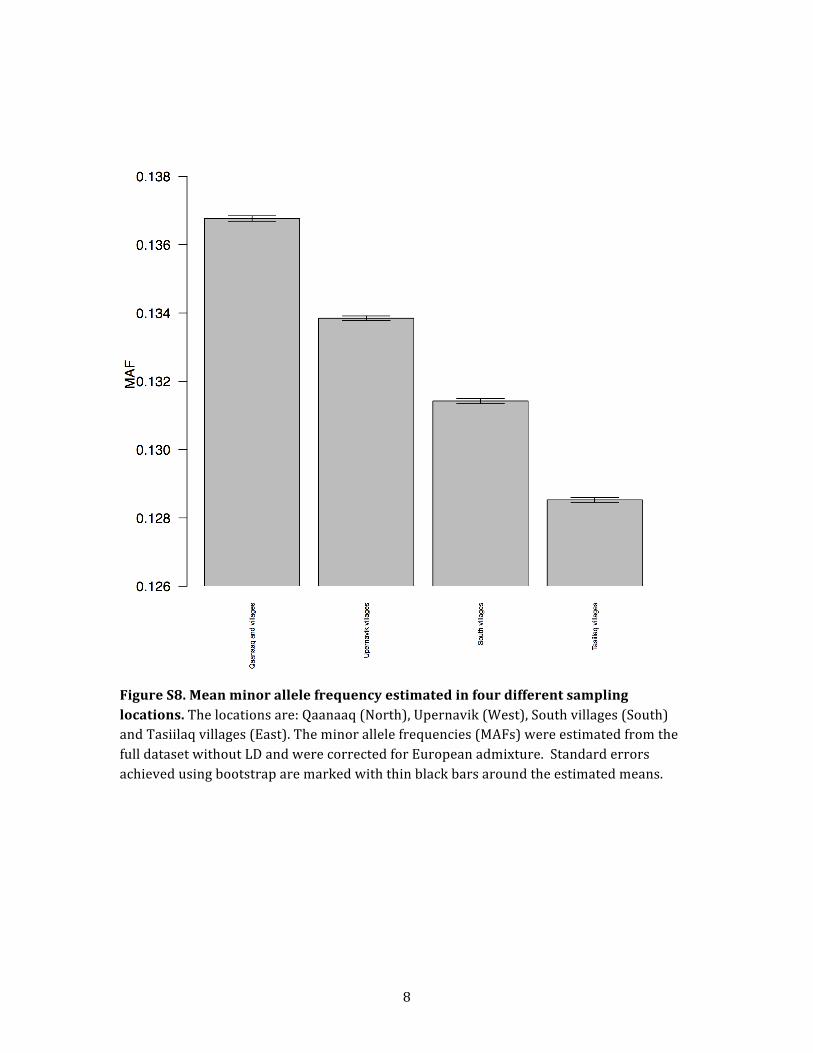
8
Figure S8. Mean minor allele frequency estimated in four different sampling locations. The locations are: Qaanaaq (North), Upernavik (West), South villages (South) and Tasiilaq villages (East). The minor allele frequencies (MAFs) were estimated from the full dataset without LD and were corrected for European admixture. Standard errors achieved using bootstrap are marked with thin black bars around the estimated means.
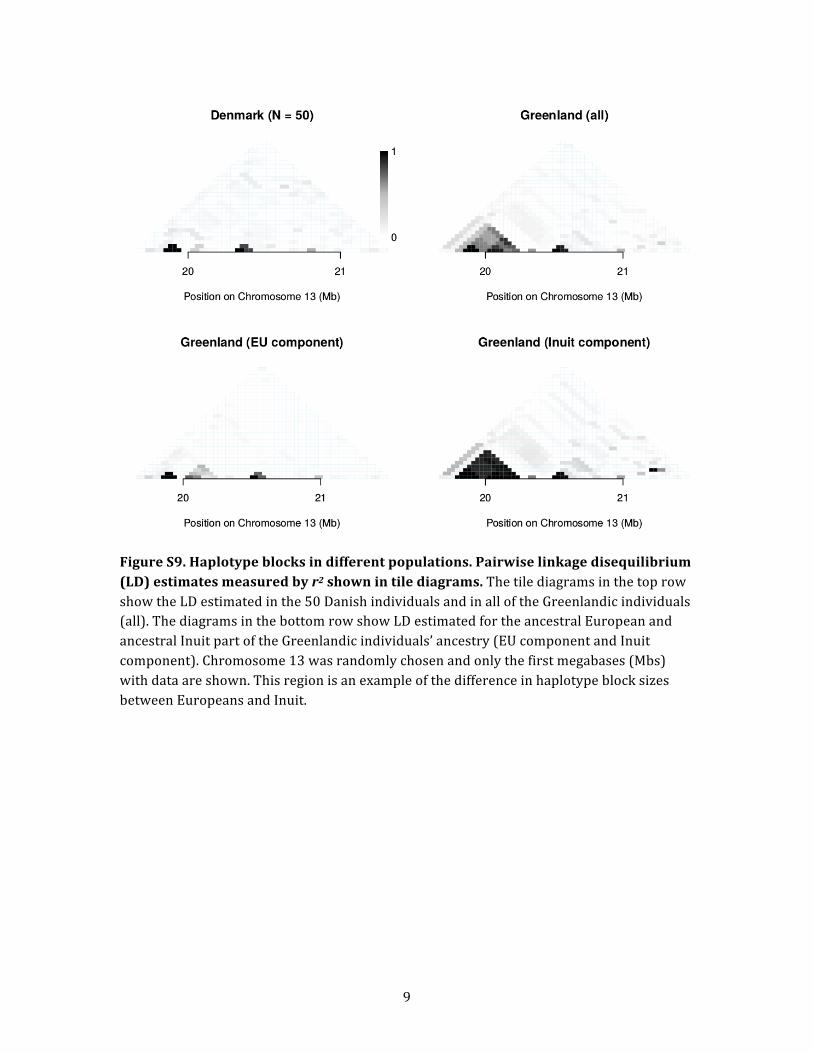
9
Figure S9. Haplotype blocks in different populations. Pairwise linkage disequilibrium (LD) estimates measured by r2 shown in tile diagrams. The tile diagrams in the top row show the LD estimated in the 50 Danish individuals and in all of the Greenlandic individuals (all). The diagrams in the bottom row show LD estimated for the ancestral European and ancestral Inuit part of the Greenlandic individuals’ ancestry (EU component and Inuit component). Chromosome 13 was randomly chosen and only the first megabases (Mbs) with data are shown. This region is an example of the difference in haplotype block sizes between Europeans and Inuit.
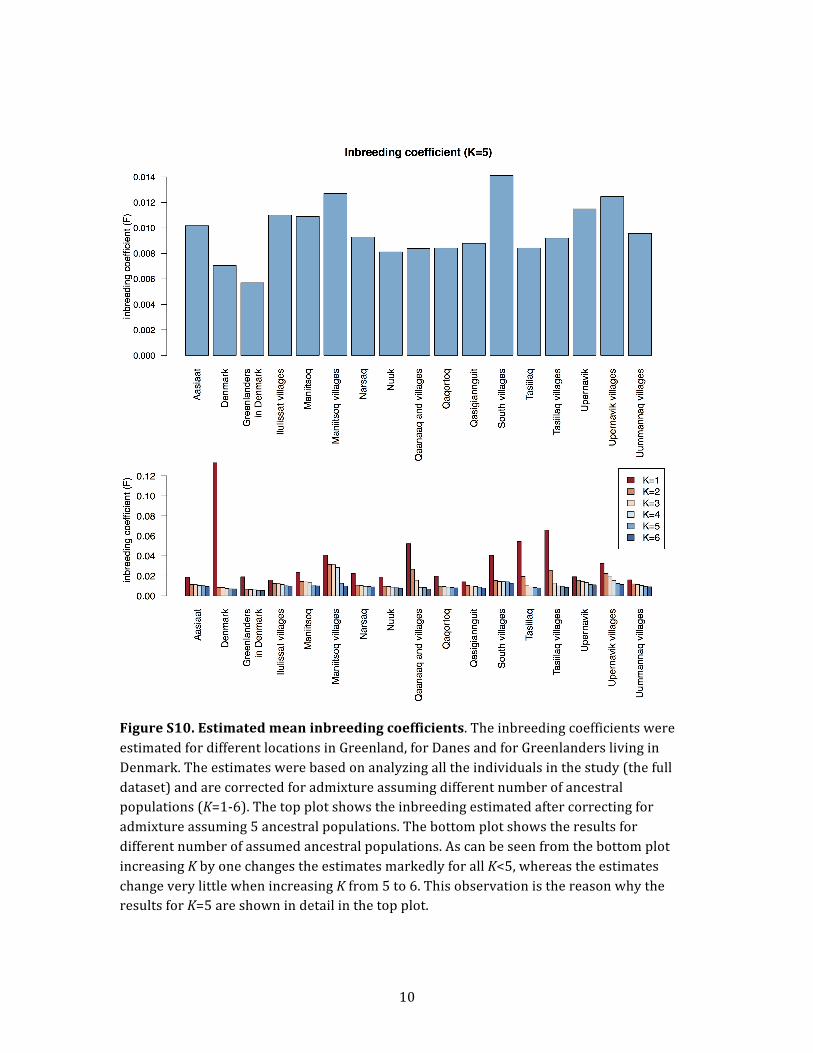
10
Figure S10. Estimated mean inbreeding coefficients. The inbreeding coefficients were estimated for different locations in Greenland, for Danes and for Greenlanders living in Denmark. The estimates were based on analyzing all the individuals in the study (the full dataset) and are corrected for admixture assuming different number of ancestral populations (K=1-‐6). The top plot shows the inbreeding estimated after correcting for admixture assuming 5 ancestral populations. The bottom plot shows the results for different number of assumed ancestral populations. As can be seen from the bottom plot increasing K by one changes the estimates markedly for all K<5, whereas the estimates change very little when increasing K from 5 to 6. This observation is the reason why the results for K=5 are shown in detail in the top plot.
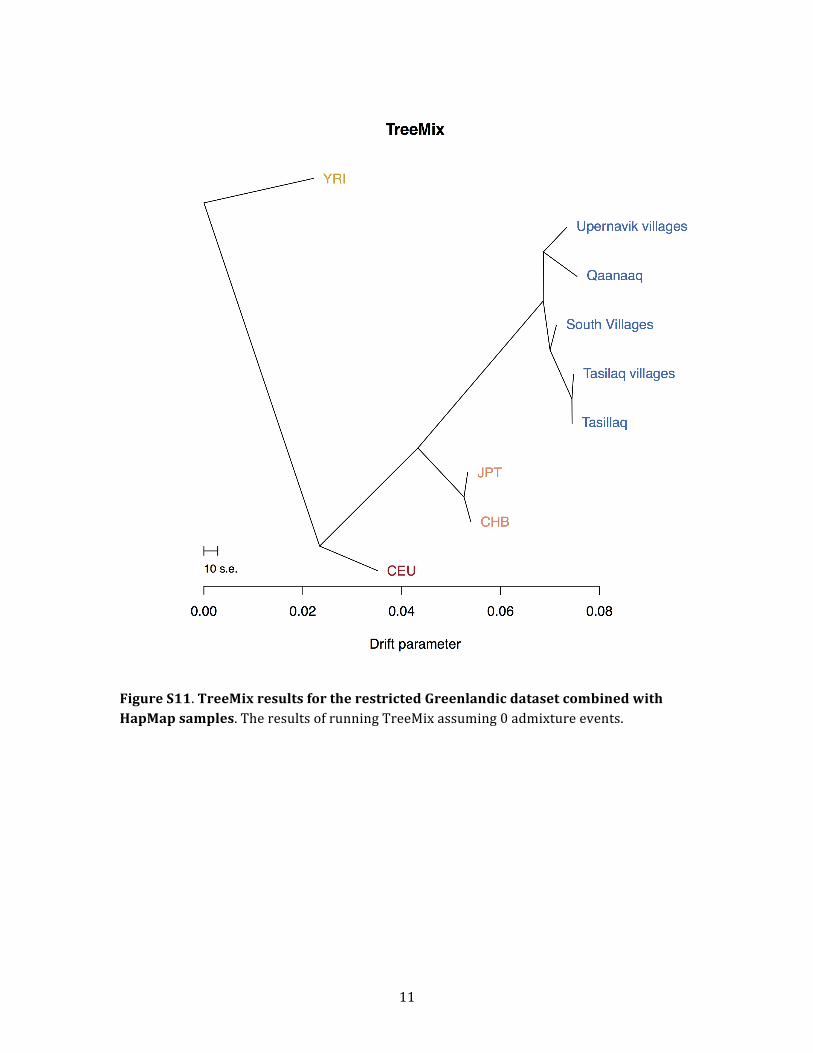
11
Figure S11. TreeMix results for the restricted Greenlandic dataset combined with HapMap samples. The results of running TreeMix assuming 0 admixture events.
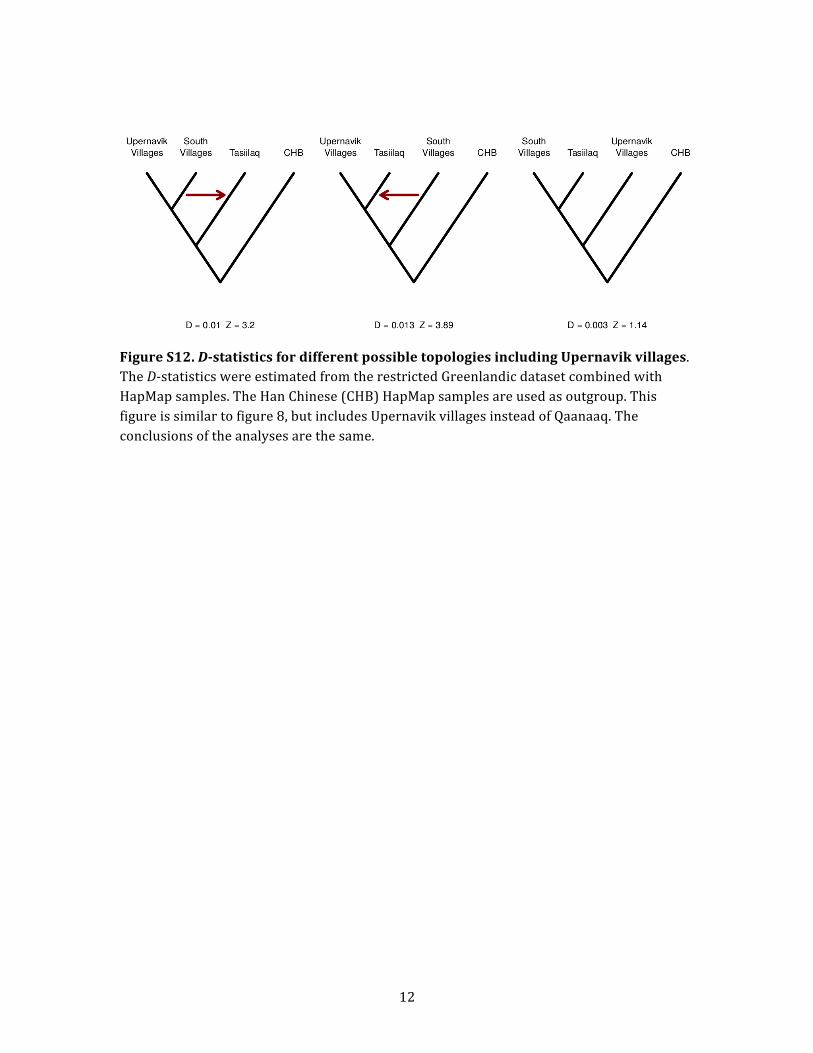
12
Figure S12. D-‐statistics for different possible topologies including Upernavik villages. The D-‐statistics were estimated from the restricted Greenlandic dataset combined with HapMap samples. The Han Chinese (CHB) HapMap samples are used as outgroup. This figure is similar to figure 8, but includes Upernavik villages instead of Qaanaaq. The conclusions of the analyses are the same.
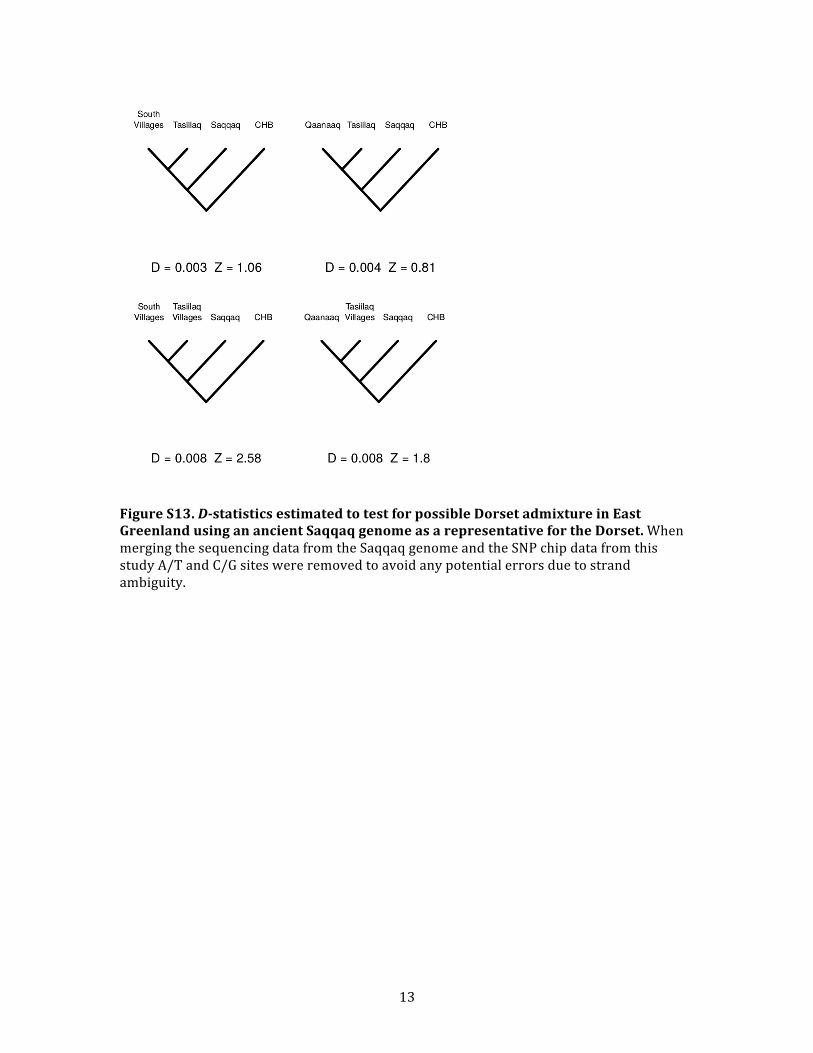
13
Figure S13. D-‐statistics estimated to test for possible Dorset admixture in East Greenland using an ancient Saqqaq genome as a representative for the Dorset. When merging the sequencing data from the Saqqaq genome and the SNP chip data from this study A/T and C/G sites were removed to avoid any potential errors due to strand ambiguity.
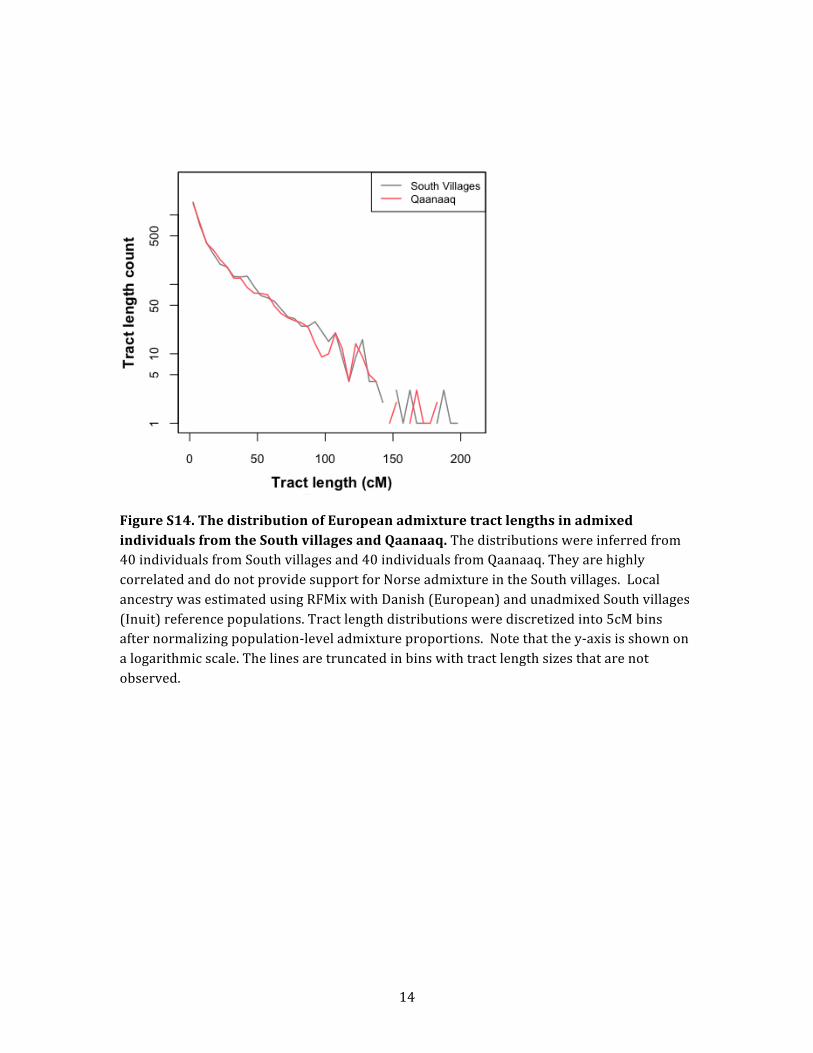
14
Figure S14. The distribution of European admixture tract lengths in admixed individuals from the South villages and Qaanaaq. The distributions were inferred from 40 individuals from South villages and 40 individuals from Qaanaaq. They are highly correlated and do not provide support for Norse admixture in the South villages. Local ancestry was estimated using RFMix with Danish (European) and unadmixed South villages (Inuit) reference populations. Tract length distributions were discretized into 5cM bins after normalizing population-‐level admixture proportions. Note that the y-‐axis is shown on a logarithmic scale. The lines are truncated in bins with tract length sizes that are not observed.
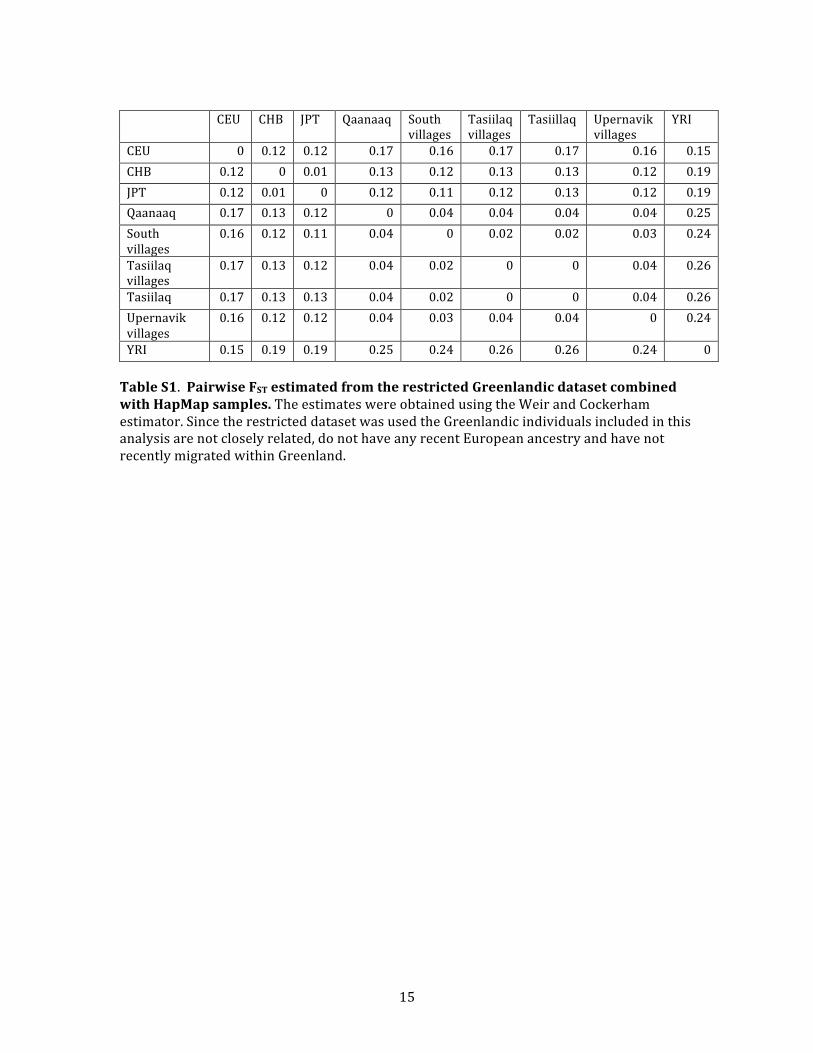
15
CEU CHB JPT Qaanaaq South villages
Tasiilaq villages
Tasiillaq Upernavik villages
YRI
CEU 0 0.12 0.12 0.17 0.16 0.17 0.17 0.16 0.15 CHB 0.12 0 0.01 0.13 0.12 0.13 0.13 0.12 0.19 JPT 0.12 0.01 0 0.12 0.11 0.12 0.13 0.12 0.19 Qaanaaq 0.17 0.13 0.12 0 0.04 0.04 0.04 0.04 0.25 South villages
0.16 0.12 0.11 0.04 0 0.02 0.02 0.03 0.24
Tasiilaq villages
0.17 0.13 0.12 0.04 0.02 0 0 0.04 0.26
Tasiilaq 0.17 0.13 0.13 0.04 0.02 0 0 0.04 0.26 Upernavik villages
0.16 0.12 0.12 0.04 0.03 0.04 0.04 0 0.24
YRI 0.15 0.19 0.19 0.25 0.24 0.26 0.26 0.24 0
Table S1. Pairwise FST estimated from the restricted Greenlandic dataset combined with HapMap samples. The estimates were obtained using the Weir and Cockerham estimator. Since the restricted dataset was used the Greenlandic individuals included in this analysis are not closely related, do not have any recent European ancestry and have not recently migrated within Greenland.
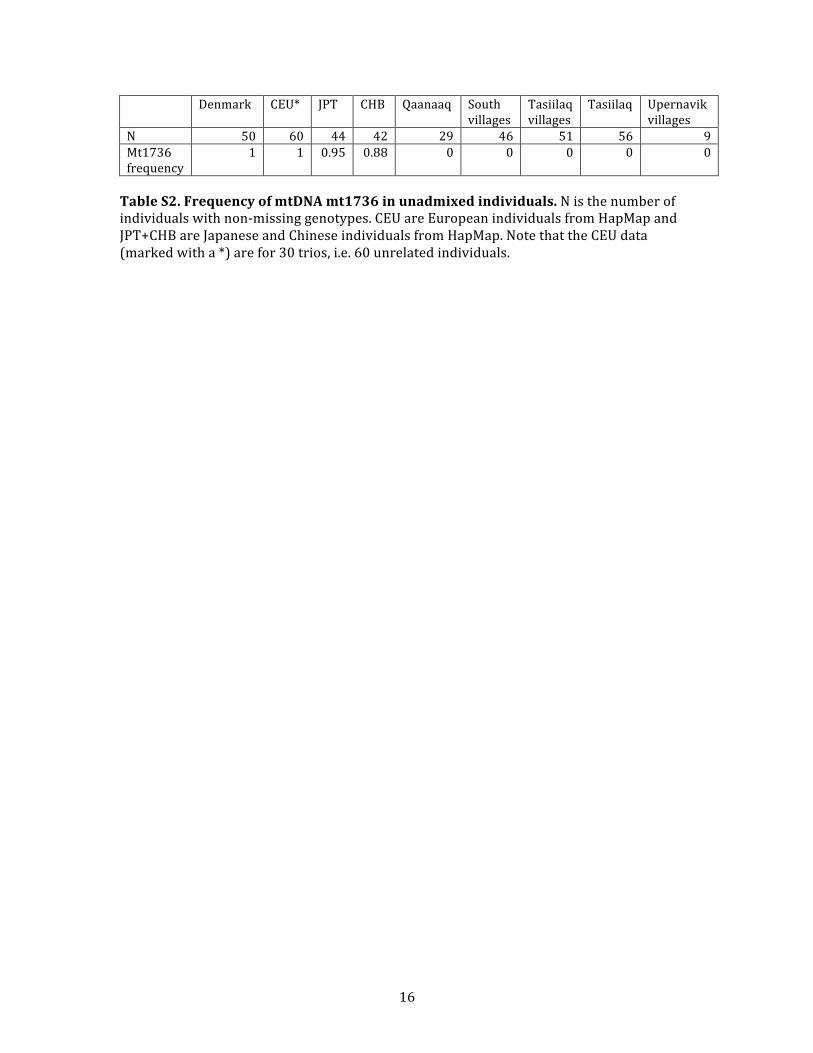
16
Denmark CEU* JPT CHB Qaanaaq South villages
Tasiilaq villages
Tasiilaq Upernavik villages
N 50 60 44 42 29 46 51 56 9 Mt1736 frequency
1 1 0.95 0.88 0 0 0 0 0
Table S2. Frequency of mtDNA mt1736 in unadmixed individuals. N is the number of individuals with non-‐missing genotypes. CEU are European individuals from HapMap and JPT+CHB are Japanese and Chinese individuals from HapMap. Note that the CEU data (marked with a *) are for 30 trios, i.e. 60 unrelated individuals.
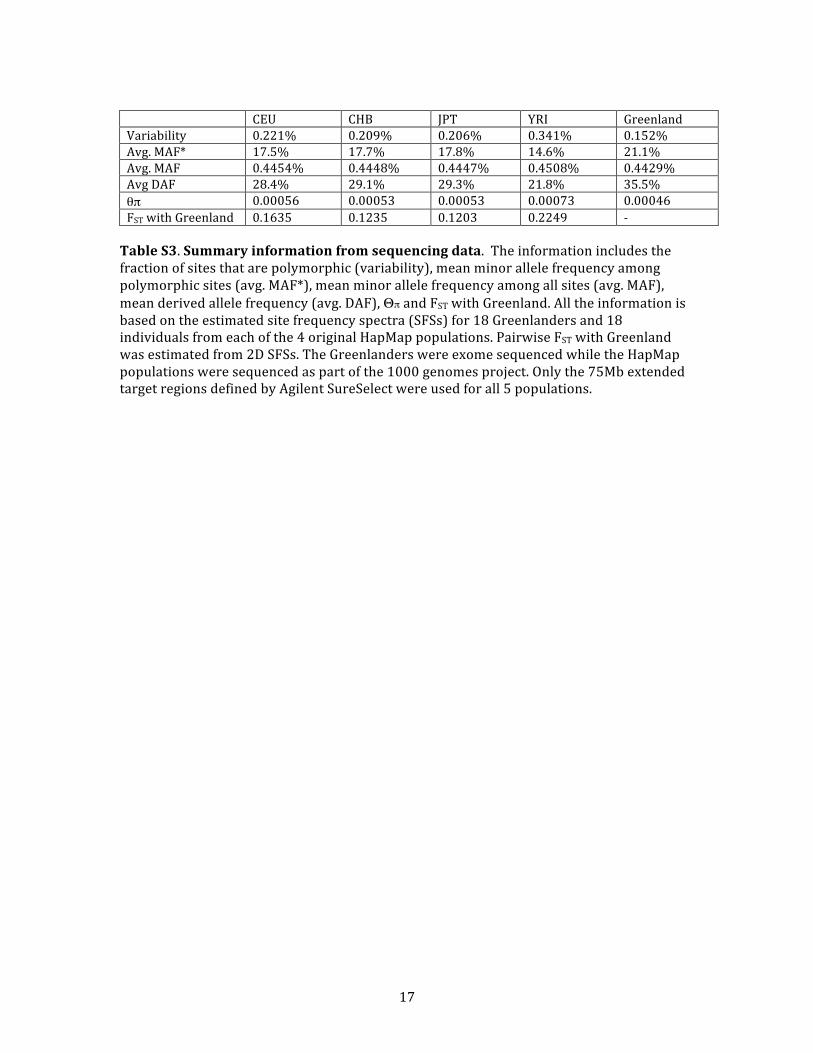
17
CEU CHB JPT YRI Greenland Variability 0.221% 0.209% 0.206% 0.341% 0.152% Avg. MAF* 17.5% 17.7% 17.8% 14.6% 21.1% Avg. MAF 0.4454% 0.4448% 0.4447% 0.4508% 0.4429% Avg DAF 28.4% 29.1% 29.3% 21.8% 35.5% θπ 0.00056 0.00053 0.00053 0.00073 0.00046 FST with Greenland 0.1635 0.1235 0.1203 0.2249 -‐
Table S3. Summary information from sequencing data. The information includes the fraction of sites that are polymorphic (variability), mean minor allele frequency among polymorphic sites (avg. MAF*), mean minor allele frequency among all sites (avg. MAF), mean derived allele frequency (avg. DAF), Θπ and FST with Greenland. All the information is based on the estimated site frequency spectra (SFSs) for 18 Greenlanders and 18 individuals from each of the 4 original HapMap populations. Pairwise FST with Greenland was estimated from 2D SFSs. The Greenlanders were exome sequenced while the HapMap populations were sequenced as part of the 1000 genomes project. Only the 75Mb extended target regions defined by Agilent SureSelect were used for all 5 populations.