unctad ad hoc expert meeting on assessing port...
TRANSCRIPT

UNCTAD Ad Hoc Expert Meeting on
Assessing Port Performance
Room XXVI Palais des Nations
Geneva, Switzerland
12 December 2012
The Measurement of Port Efficiency
by
Prof. Kevin Cullinane Director, Transport Research Institute
Edinburgh Napier University United Kingdom
This expert paper is reproduced by the UNCTAD secretariat in the form and language in which it has been received. The views expressed are those of the author and do not necessarily reflect the view of the United Nations.

12/13/2012
1
Prof. Kevin Cullinane Director of TRI
The Measurement of Port Efficiency
Defining ‘Efficiency’ • Technical Productivity relates to the physical amount of all
input factors used in the production process, measured by the simple ratio of output over input. Increasing Productivity need not be economically efficient - trade-off with other valuable resources.
• Economic Productivity relates to the value of all inputs used to produce a given output.
• Efficiency (technical and/or economic) relates to the difference between the actual, relative to the ideal, level of (technical and/or economic) productivity.
• Scale efficiency refers to the difference between actual, relative to the ideal, production size.

12/13/2012
2
A Refresher in Elementary Economics: Technical Efficiency and Production Functions
0
y
x
C B
A
D
E
FOptimal
Scale
Source: Derived from Coelli et al (1998, p. 5)
GH
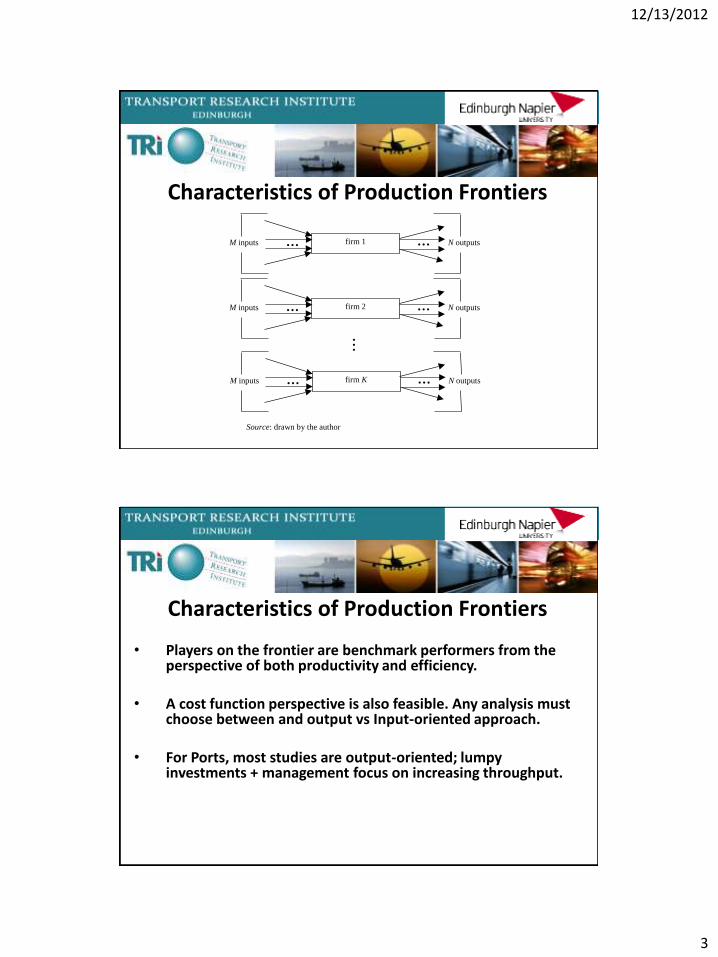
Characteristics of Production Frontiers
• Production functions represent the industry situation at current levels of technology.
• The function is defined as a frontier. i.e. it is not based on an average of individual players that comprise the industry. The term ‘Frontier’ emphasises the top level of performance for the industry; a level to which individual players already perform or may aspire.
12/13/2012
3
Characteristics of Production Frontiers
firm 1… …M inputs N outputs
firm 2… …M inputs N outputs
...
firm K… …M inputs N outputs
Source: drawn by the author
Characteristics of Production Frontiers
• Players on the frontier are benchmark performers from the perspective of both productivity and efficiency.
• A cost function perspective is also feasible. Any analysis must choose between and output vs Input-oriented approach.
• For Ports, most studies are output-oriented; lumpy investments + management focus on increasing throughput.

12/13/2012
4
Why Measure Productivity and Efficiency • Quantifying the scope for efficiency savings in the use of resources and/or
for augmenting output • Determining the most suitable benchmark • Identifying good operating practices • Quantifying the marginal rates of substitution between factors of
production • Determining the most efficient operating scale
This may benefit: • Individual firms – management can influence sources of productive
efficiency to improve matters and their competitive position • Industry – how far can output be increased simply through efficiency gains
to compete with overseas industries • Macroeconomy – in terms of providing a criterion by which economic
systems may be compared and the decision made as to which to adopt
8
Farrell’s (1957) efficiency measurement
Non-parametric frontier
DEA FDH
Parametric frontier
Deterministic Stochastic
MP MLE RA
MLE normal-half normal normal-truncated normal normal-exponential normal-gamma
Derived Including Solutions
Alternative Approaches to Efficiency Measurement

12/13/2012
5
Introduction to DEA
Outputs
Inputs
DEA
0
B
C
A
P(B) = AB/0A
E
Optimal scale
TE(B)DEA = (AB/0A)/(AC/0A)
F
BC = DEA Inefficiency
Models Assumptions Efficiency Component
The Normal-
Half normal
model
vk ~ iid ),0( 2
vN
uk ~ iid ),0( 2
uN
vk and uk are distributed
independently of each other
and of the regressors
k
k
k
kkuE21
The Normal-
Exponential
model
vk ~ iid ),0( 2
vN
uk ~ iid exponential
vk and uk are distributed
independently of each other
and of the regressors
v
vk
v
vk
v
vkkkuE
2
2
2
The Normal-
Truncated
normal model
vk ~ iid ),0( 2
vN
uk ~ iid ),( 2
uN
vk and uk are distributed
independently of each other
and of the regressors
k
kkuE ]|[
The Normal-
Gamma model vk ~ iid ),0( 2
vN
uk ~ iid gamma
vk and uk are distributed
independently of each other
and of the regressors
]),/([
],0|[),(
),(
),1(]|[
22
vuvk
k
p
k
k
k
kk
Nz
zzEph
ph
phuE
Note: 2/122 )( vu , vu / , k = vk - uk, and )( and )( are the standard normal
cumulative distribution and density functions.
Introduction to SFA

12/13/2012
6
Input x
Ou
tpu
t y
a
b
c
e
d
g
f DEA Frontier
df = DEA inefficiency
DEA
non-parametric, piecewise linear frontier
no measurement error is considered
o
Input x
Ou
tpu
t y
a
b
c
e
d
g
f DEA Frontier
df = DEA inefficiency
SFA inefficiency
statistical noise
8.05.0 xy
non-parametric, piecewise linear frontier
DEA
no measurement error is considered
SFA
Parametric frontier with a particular functional form
Allows for measurement error
o
12/13/2012
7
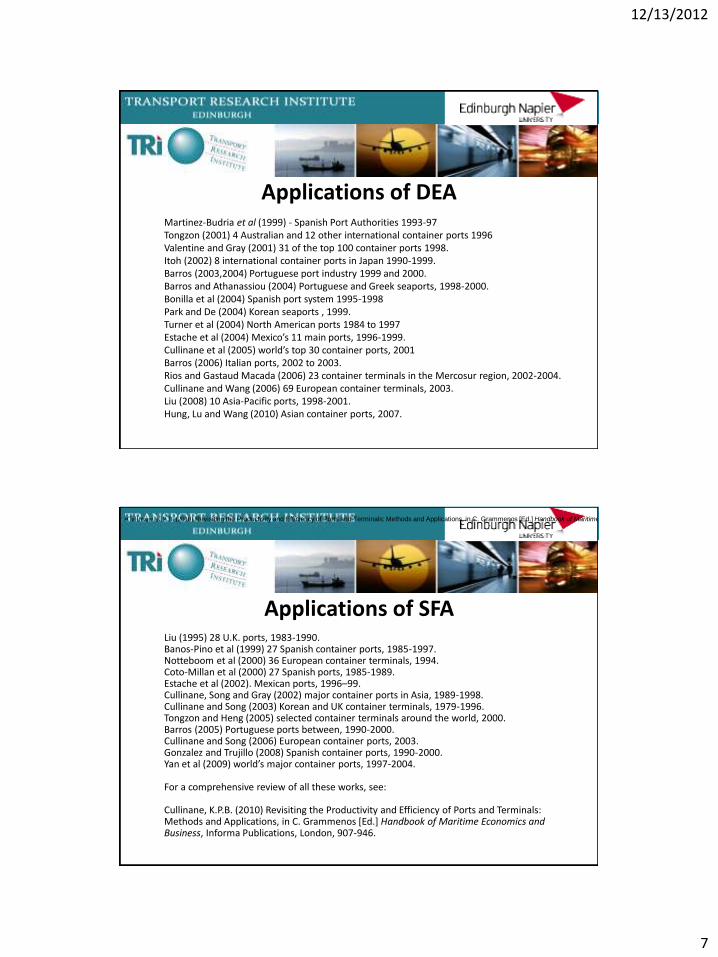
Applications of DEA Martinez-Budria et al (1999) - Spanish Port Authorities 1993-97 Tongzon (2001) 4 Australian and 12 other international container ports 1996 Valentine and Gray (2001) 31 of the top 100 container ports 1998. Itoh (2002) 8 international container ports in Japan 1990-1999. Barros (2003,2004) Portuguese port industry 1999 and 2000. Barros and Athanassiou (2004) Portuguese and Greek seaports, 1998-2000. Bonilla et al (2004) Spanish port system 1995-1998 Park and De (2004) Korean seaports , 1999. Turner et al (2004) North American ports 1984 to 1997 Estache et al (2004) Mexico’s 11 main ports, 1996-1999. Cullinane et al (2005) world’s top 30 container ports, 2001 Barros (2006) Italian ports, 2002 to 2003. Rios and Gastaud Macada (2006) 23 container terminals in the Mercosur region, 2002-2004. Cullinane and Wang (2006) 69 European container terminals, 2003. Liu (2008) 10 Asia-Pacific ports, 1998-2001. Hung, Lu and Wang (2010) Asian container ports, 2007.
Applications of SFA Liu (1995) 28 U.K. ports, 1983-1990. Banos-Pino et al (1999) 27 Spanish container ports, 1985-1997. Notteboom et al (2000) 36 European container terminals, 1994. Coto-Millan et al (2000) 27 Spanish ports, 1985-1989. Estache et al (2002). Mexican ports, 1996–99. Cullinane, Song and Gray (2002) major container ports in Asia, 1989-1998. Cullinane and Song (2003) Korean and UK container terminals, 1979-1996. Tongzon and Heng (2005) selected container terminals around the world, 2000. Barros (2005) Portuguese ports between, 1990-2000. Cullinane and Song (2006) European container ports, 2003. Gonzalez and Trujillo (2008) Spanish container ports, 1990-2000. Yan et al (2009) world’s major container ports, 1997-2004. For a comprehensive review of all these works, see: Cullinane, K.P.B. (2010) Revisiting the Productivity and Efficiency of Ports and Terminals: Methods and Applications, in C. Grammenos [Ed.] Handbook of Maritime Economics and Business, Informa Publications, London, 907-946.
•Cullinane, K.P.B. (2010) Revisiting the Productivity and Efficiency of Ports and Terminals: Methods and Applications, in C. Grammenos [Ed.] Handbook of Maritime Economics and Business, Informa Publications, London, 907-946.

12/13/2012
8
Characteristics of Port Efficiency Studies
• All such studies are data-driven. • Data used tends to be generally available and proprietary and, therefore,
relatively cheap and easy to collect – hence, the focus on containers. • Since individual port efficiency estimates are all estimated relative to the
rest of the sample under study, they cannot be compared across studies. • Only broad conclusions can be compared – e.g. on private sector
involvement. • Although methods appear complex, analysis is comparatively easy –
largely black box approaches, with wide availability of both DEA and SFA software.
• Data is the problem.
Data Issues
• Defining the port sector (industry) whose production function needs to be estimated – i.e. whole ports or terminals, across what cargo types (container, bulk, ro-ro, break-bulk, general cargo, cars etc), over what geographical range (i.e. what is the objective of the analysis – e.g. African ports).
• Over what time period and periodicity – time series, cross-section, panel. Data per annum, per month etc.
• Identification of input and output variables.

12/13/2012
9
Mainstream Efficiency Variables
Capital – Gantry Cranes – RTGs – Straddle Carriers – Land – Berthage – Yardage
Labour – No. of Employees
– % Mant. vs Manual
– Average Age of workers
– Hours per week
– Idle time
Physical Inputs
Mainstream Efficiency Variables
Capital – Amortised capital
Investment – Equipment cost – Cost of materials and
other direct costs – Value of land
Labour – Total cost of management – Total cost of manual labour – Administration cost – Average gross cost per
employee
Monetary Inputs
12/13/2012
10
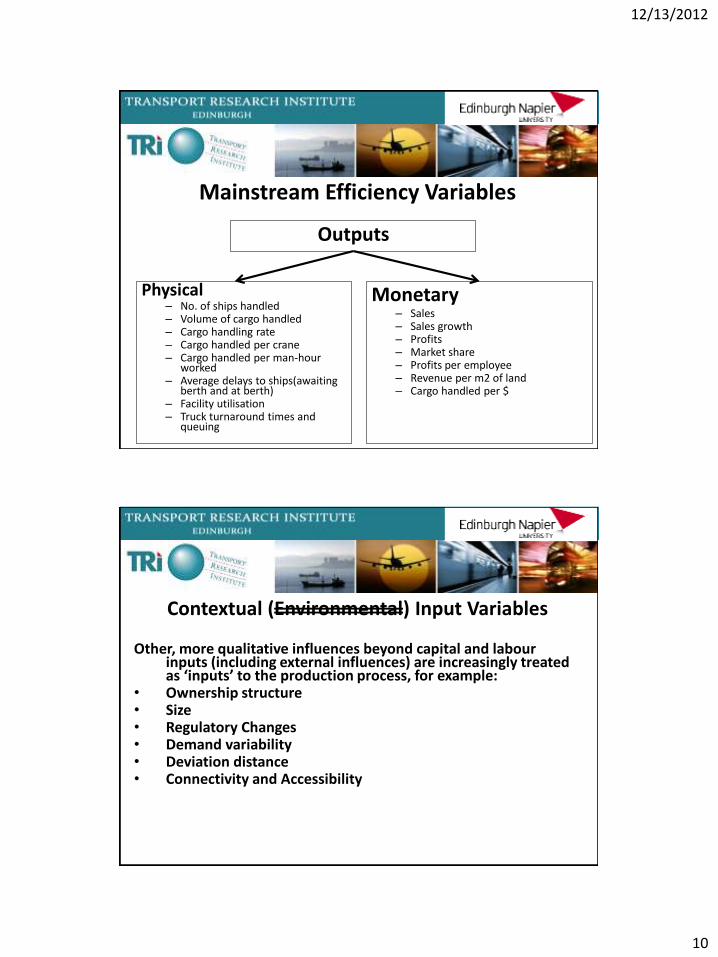
Mainstream Efficiency Variables
Physical – No. of ships handled – Volume of cargo handled – Cargo handling rate – Cargo handled per crane – Cargo handled per man-hour
worked – Average delays to ships(awaiting
berth and at berth) – Facility utilisation – Truck turnaround times and
queuing
Monetary – Sales – Sales growth – Profits – Market share – Profits per employee – Revenue per m2 of land – Cargo handled per $
Outputs
Contextual (Environmental) Input Variables
Other, more qualitative influences beyond capital and labour inputs (including external influences) are increasingly treated as ‘inputs’ to the production process, for example:
• Ownership structure • Size • Regulatory Changes • Demand variability • Deviation distance • Connectivity and Accessibility

12/13/2012
11
Potential New Output Variables
Environmental impacts as negative outputs of the production process Effectiveness variables – e.g. customer satisfaction
• Greater influence over port choice decision and competiveness • Needs to be tailor-made
Time in port of both ships and cargo as the output of the port production process
• Need to control for congestion time to focus solely on handling efficiency
• Better reflection of inventory costs to shippers • Allows for choice aspect of transhipment ports where speed of
transit to feeders is primary concern to port choice decision maker, rather than cargo handling efficiency at berth.
Conclusions • Conventional efficiency estimation based on the
frontier approach and applying DEA and SFA models is relatively straightforward.
• These models are sufficiently flexible to allow a number of useful variations to have been developed.
• The efficiency outcomes from such models are limited, however, by the fact that they depend intrinsically upon the composition of the database analysed and, as such, results cannot be compared between applications.
• A major issue is the quality and availability of data to drive the empirical models and efficiency estimations.

12/13/2012
12
Conclusions • Any prescriptive set of efficiency indicators must start
with the easy and cheap to collect input/output variables.
• These should be supplemented by qualitative contextual input variables, including customer satisfaction and other effectiveness-related data, which is feasible to collect on a systematic basis.
• Time in port as an output of port production may be a reasonable proxy for effectiveness criteria.
• There is an increasing need to account for environmental performance – perhaps as a negative output of production provides a valid route.
• Any systematic and sustainable performance evaluation must be based on data which is economic to collect on a continuous basis.