under construction july 2016 construction & engineering ... bangkok came in second with 112...
TRANSCRIPT
UNDER CONSTRUCTION
Regional Thematic
UNDER CONSTRUCTION

Regional Sector Update
See important disclosures at the end of this report 1
Powered by the EFA Platform
25 July 2016 Construction & Engineering | Construction
Construction Overweight
Stocks Covered: 10
As Many As Stars In The Sky Ratings (Buy/Neutral/Sell): 6 / 7 / 0
Last 12m Earnings Revision Trend: Negative Although four ASEAN countries – Indonesia, Malaysia, Singapore and Thailand – are facing the threat of an economic slowdown, each is relying on different engines to stimulate their economies. All four countries (based on our survey in each capital city) still report progress in terms of construction activities from both the private and public sectors. Our RHB construction analysts maintain their positive view on the sector with Top Picks as follows: 1. Indonesia: Adhi Karya Persero; 2. Malaysia: Sunway Construction and Gadang Holdings; 3. Thailand: Sino-Thai Engineering & Construction.
Top Picks Target Price
Adhi Karya Persero (ADHI IJ) – BUY IDR 3,400
Gadang Holdings (GADG MK) – BUY MYR 3.10
Sino-Thai Engineering & Construction (STEC TB) - BUY
THB29.00
Sunway Construction (SCGB MK) - BUY MYR 1.86
Crane count in four ASEAN countries
0
10
20
30
40
50
60
0
20
40
60
80
100
120
140
Indonesia Malaysia Singapore Thailand
No. of crane No. of project
No. of crane No. of project
Source: RHB
Table Of Contents
Why counting cranes? 2
Indonesia 3
Malaysia 8
Singapore 18
Thailand 28
Adhi Karya Persero (ADHI IJ) 37
Gadang Holdings (GADG MK) 40
Sino-Thai Engineering & Construction (STEC TB) 43
Sunway Construction (SCGB MK) 46
Different engines in different countries. In order to boost their economies and
prevent a slowdown, Singapore and Malaysia are focusing on export growth and domestic consumption respectively, while Thailand and Indonesia are relying on investments in public infrastructure projects. In spite of the different stimulus instruments, construction activities remain abundant within a 3km radius around the centre of each capital city – we counted many cranes working actively in our surveyed area. Kuala Lumpur ranks the top among the four, with 131 cranes. Bangkok came in second with 112 cranes. Jakarta and Singapore are almost equal, with about 66 and 52 cranes respectively.
What can be learnt from the crane survey?
Indonesia: Jakarta, with many infrastructure projects under construction, is set
to develop new projects. This is especially in terms of new skyscrapers aligned with mass rapid transit (MRT) routes. In the meantime, Indonesia’s residential property sector has been facing slow demand growth since FY15, which has led to delays of developers’ new project launches. Still, office and apartment projects under construction remain on track and are a dominant presence in Jakarta’s central business district (CBD).
Malaysia: The busiest construction activities in this country will not end soon, as
the Government has assured new infrastructure projects will be implemented as planned. However, there is a likely trend for developers to slow down their launches for residential and non-residential projects due to the weak property market. Our analyst believes infrastructure spending by the Government will boost new construction projects awarded to contractors in FY16-17.
Singapore: As the most developed and most congested country among the four
(with a construction cycle that is getting ahead of the others), Singapore is focusing on quality rather than quantity. There is a growing number of new mixed-use projects plus energy-efficient buildings. These are supported by planned construction of more transportation alternatives for a better access to the CBD area.
Thailand: Bangkok’s CBD is dominated by SET-listed companies’ condominium
projects for the mid- to high-end market. There are obvious trends in the CBD, including:
i. Facility expansion of long-term growth businesses such as hospitals and a university campus;
ii. The game of mixed-use projects played by Thai landlords; iii. Initial signs that the hotel sector will expand to a new location in the CBD.
P/E (x) P/B (x) Yield (%)
Dec-17F Dec-17F Dec-17F
Adhi Karya Persero IDR2,720 IDR3,400 11.2 1.5 3.4 BUY
Gadang Holdings MYR2.48 MYR3.10 6.7 1.0 2.9 BUY
Sino-Thai Engineering & Construction PCLTHB25.00 THB29.00 23.9 3.4 1.7 BUY
Sunw ay Construction Group MYR1.65 MYR1.86 13.3 3.3 2.6 BUY
Company Name Price Target Rating
Source: Company data, RHB
Analysts
Dony Gunawan
+6221 2970 7063
Ng Sem Guan, CFA
+603 9207 7678
Jarick Seet
+65 6232 3891
Chatree Srismaicharoen
+66 2862 9743

Construction Regional Sector Update
25 July 2016
See important disclosures at the end of this report 2
Why Counting Cranes? According to RHB’s estimate, the four ASEAN countries in our survey – Indonesia, Malaysia, Singapore, and Thailand – have the potential to see their GDPs increase gradually in FY16-17. Although all four economies have faced economic challenges due to internal and external threats, their governments are focusing on different engines to boost GDP growth to a higher level. Indonesia and Thailand remain focused on public investments in infrastructure projects, while Singapore and Malaysia are relying on the export sector and domestic consumption respectively. It is interesting to note, however, that the growth of construction activities in Indonesia, Malaysia and Thailand is estimated to be far above their respective GDP growth. Meanwhile, the construction sector in Singapore is significant to some degree.
Figure 1: RHB’s estimates on construction growth and as a percentage of GDP Indonesia Malaysia Singapore Thailand FY16F FY17F FY16F FY17F FY16F FY17F FY16F FY17F GDP Growth (%) 5.1 5.3 3.9 4.0 1.8 2.0 3.2 3.5
Construction % of GDP 10.5 10.5 4.5 4.5 13.2 13.3 8.7 9.0
Growth (%) 8.2 8.5 6.0 5.3 4.6 1.1 13.5 17.3
Public construction % of GDP NA NA NA NA 8.8 8.6 4.7 5.1
Growth (%) NA NA NA NA 8.4 9.1 18.6 23.6 Private construction
% of GDP NA NA NA NA 4.4 4.7 4.0 3.8 Growth (%) NA NA NA NA -3.0 -3.6 7.5 10.1
Source: RHB
Crane counting is the method we have adopted to measure the construction activities in each country, in terms of quality and quantity. In addition to collating the number of cranes counted in each CBD area (within a 3km radius of the centre of the capital city), we also detail out the current situation and circumstances as well as the future construction activity trends in each country.
Below is a summary of the results of our crane counting surveys. We counted a total of 361 cranes and 176 projects under construction for all four countries.
Figure 2: Summary of cranes and projects in the four ASEAN countries surveyed Total No. of cranes No. of projects Residential No. of cranes No. of projects
Malaysia 131 48 Malaysia 33 20 Thailand 112 55 Thailand 43 33 Indonesia 66 19 Indonesia 9 3 Singapore 52 54 Singapore 25 25
Office No. of cranes No. of projects Hotel No. of cranes No. of projects Malaysia 21 3 Malaysia 18 4 Thailand 17 8 Thailand 6 2 Indonesia 30 10 Indonesia - - Singapore 16 10 Singapore 7 12
Mixed-use No. of cranes No. of projects Other No. of cranes No. of projects Malaysia 34 11 Malaysia 25 10 Thailand 29 4 Thailand 17 8 Indonesia 21 4 Indonesia 6 2 Singapore - - Singapore 4 7
Source: RHB
We will detail our findings from the crane survey in alphabetical order of the countries, ie Indonesia first, followed by Malaysia, Singapore, and Thailand. The analysts behind each survey are listed below:
Indonesia Dony Gunawan [email protected] Malaysia Ng Sem Guan [email protected] Singapore Jarick Seet [email protected] Thailand Chatree Srismaicharoen [email protected]
Construction Regional Sector Update
25 July 2016
See important disclosures at the end of this report 3
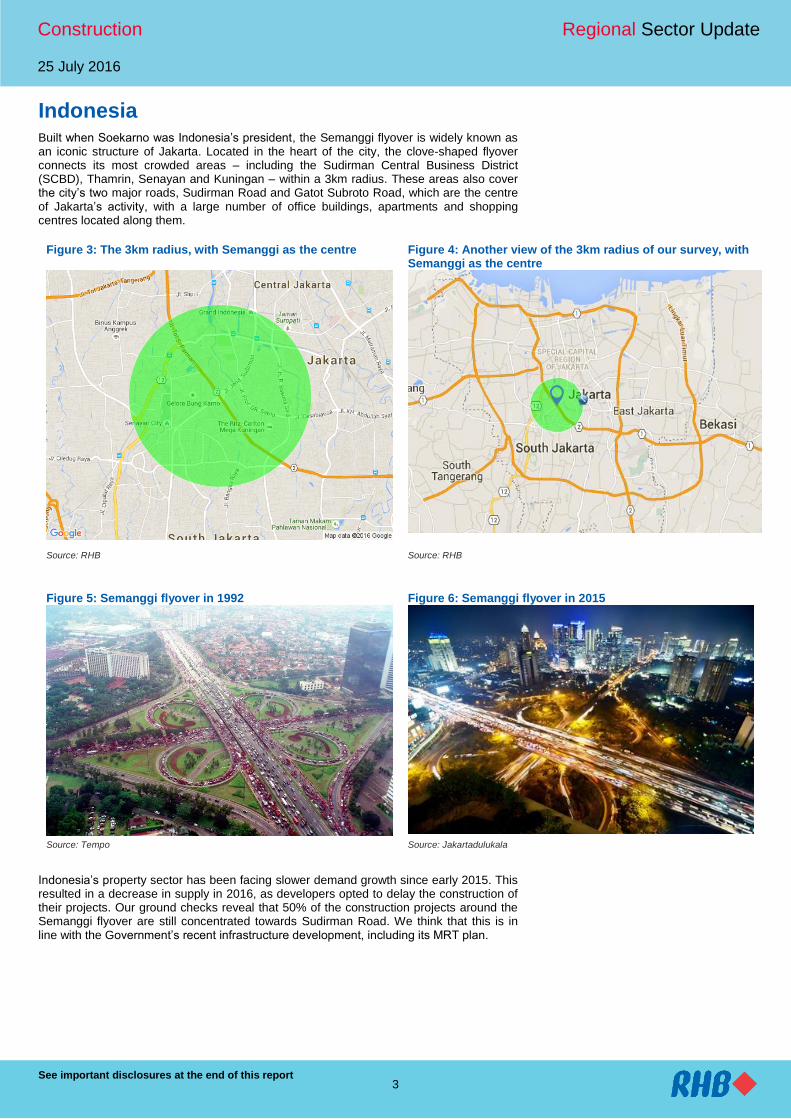
Indonesia Built when Soekarno was Indonesia’s president, the Semanggi flyover is widely known as an iconic structure of Jakarta. Located in the heart of the city, the clove-shaped flyover connects its most crowded areas – including the Sudirman Central Business District (SCBD), Thamrin, Senayan and Kuningan – within a 3km radius. These areas also cover the city’s two major roads, Sudirman Road and Gatot Subroto Road, which are the centre of Jakarta’s activity, with a large number of office buildings, apartments and shopping centres located along them.
Figure 3: The 3km radius, with Semanggi as the centre Figure 4: Another view of the 3km radius of our survey, with Semanggi as the centre
Source: RHB Source: RHB
Figure 5: Semanggi flyover in 1992 Figure 6: Semanggi flyover in 2015
Source: Tempo Source: Jakartadulukala
Indonesia’s property sector has been facing slower demand growth since early 2015. This resulted in a decrease in supply in 2016, as developers opted to delay the construction of their projects. Our ground checks reveal that 50% of the construction projects around the Semanggi flyover are still concentrated towards Sudirman Road. We think that this is in line with the Government’s recent infrastructure development, including its MRT plan.

Construction Regional Sector Update
25 July 2016
See important disclosures at the end of this report 4
Figure 7: Commercial property supply growth in the Jabodetabek area
Figure 8: Pipeline of apartments and office projects in Jakarta
Title:
Source:
Please fill in the values above to have them entered in your report
6.2
3.1
23.2
3.6
-5
0
5
10
15
20
25
30
35
40
1Q13 2Q13 3Q13 4Q13 1Q14 2Q14 3Q14 4Q14 1Q15 2Q15 3Q15 4Q15
% YoY
Off ices Retails Apartments Hotels
Title:
Source:
Please fill in the values above to have them entered in your report
54
35
46
13
26
19
15
0
10
20
30
40
50
60
2016 2017 2018 2019
No of Buildings
Apartment Off ice
Source: Bank of Indonesia Source: Colliers International Indonesia
During our ground checks, we counted 19 different projects and 66 cranes within the 3km radius of Semanggi. Most of the construction works were for office buildings (14 projects were visible). According to Colliers, Jakarta’s CBD has recorded a total supply of 5.27m sqm (+7.7% YoY) in office space as at 1Q16. The data from Colliers also indicated that 75% of the 1m sqm projected office supply in 2019 will be located in Sudirman, Kuningan and Gatot Subroto.
The apartment segment came in second, with a total seven projects counted – some of them by well-known property developers including Ciputra Group [which consists of Ciputra Surya (CTRS IJ, BUY, TP: IDR5,000), Ciputra Development (CTRA IJ, BUY, TP: IDR1,530) and Ciputra Property (CTRP IJ, NR)], Astra Group (ASII IJ, BUY, TP: IDR7,350) and Lippo Group, ie Lippo Karawaci (LPKR IJ, NEUTRAL, TP: IDR1,460). We also note that there are not as many apartment projects near the CBD area, while the take-up rate for luxury apartments is low.
There are two infrastructure projects, including the MRT construction and Semanggi flyover extension. During our ground checks, we counted four cranes working on the infrastructure projects alone. The Semanggi flyover extension will provide an alternative two-way connection from Sudirman to Gatot Subroto. Works on the project began recently, and it is targeted to be ready on 1 Aug 2017. The Semanggi flyover contract was won by Wijaya Karya (WIKA IJ, NEUTRAL, TP: IDR2,665) with a contract value estimated at IDR563bn.
Figure 9: Current progress of Semanggi Flyover 2 Figure 10: Design of Semanggi Flyover 2
Source: RHB Source: Ahok
Construction Regional Sector Update
25 July 2016
See important disclosures at the end of this report 5
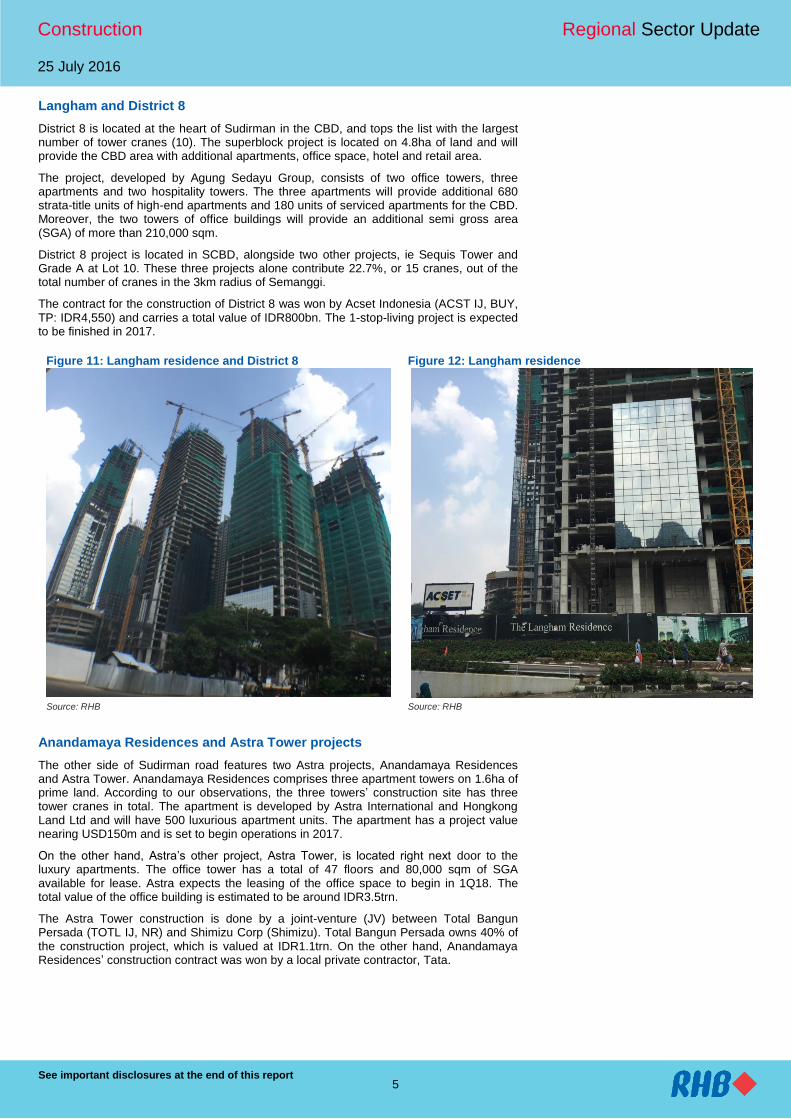
Langham and District 8
District 8 is located at the heart of Sudirman in the CBD, and tops the list with the largest number of tower cranes (10). The superblock project is located on 4.8ha of land and will provide the CBD area with additional apartments, office space, hotel and retail area.
The project, developed by Agung Sedayu Group, consists of two office towers, three apartments and two hospitality towers. The three apartments will provide additional 680 strata-title units of high-end apartments and 180 units of serviced apartments for the CBD. Moreover, the two towers of office buildings will provide an additional semi gross area (SGA) of more than 210,000 sqm.
District 8 project is located in SCBD, alongside two other projects, ie Sequis Tower and Grade A at Lot 10. These three projects alone contribute 22.7%, or 15 cranes, out of the total number of cranes in the 3km radius of Semanggi.
The contract for the construction of District 8 was won by Acset Indonesia (ACST IJ, BUY, TP: IDR4,550) and carries a total value of IDR800bn. The 1-stop-living project is expected to be finished in 2017.
Figure 11: Langham residence and District 8 Figure 12: Langham residence
Source: RHB Source: RHB
Anandamaya Residences and Astra Tower projects
The other side of Sudirman road features two Astra projects, Anandamaya Residences and Astra Tower. Anandamaya Residences comprises three apartment towers on 1.6ha of prime land. According to our observations, the three towers’ construction site has three tower cranes in total. The apartment is developed by Astra International and Hongkong Land Ltd and will have 500 luxurious apartment units. The apartment has a project value nearing USD150m and is set to begin operations in 2017.
On the other hand, Astra’s other project, Astra Tower, is located right next door to the luxury apartments. The office tower has a total of 47 floors and 80,000 sqm of SGA available for lease. Astra expects the leasing of the office space to begin in 1Q18. The total value of the office building is estimated to be around IDR3.5trn.
The Astra Tower construction is done by a joint-venture (JV) between Total Bangun Persada (TOTL IJ, NR) and Shimizu Corp (Shimizu). Total Bangun Persada owns 40% of the construction project, which is valued at IDR1.1trn. On the other hand, Anandamaya Residences’ construction contract was won by a local private contractor, Tata.

Construction Regional Sector Update
25 July 2016
See important disclosures at the end of this report 6
Figure 13: A view of construction works for Astra Tower Figure 14: Astra Tower and Anandamaya Residences projects
Source: Indopora Source: RHB
Figure 15: Artist impression of Anandamaya Residences and Astra Tower
Source: Company
MRT is the main catalyst
We think that the main catalyst for the development along the CBD area is still the construction of the MRT network. The first phase of the MRT will span 15.7km and connect Lebak Bulus (South Jakarta) and Bundaran HI (Thamrin, Central Jakarta). On Sudirman Road, we counted at least two mobile cranes and two crawler cranes on the site. Construction started back in 2013 and is expected to start operations by early 2019. YTD, construction of the first phase of the MRT system is 43% complete, and will be ready to serve 212,000-960,000 passengers per day when operations begin. The total construction value for the MRT project is USD1.29bn.
The construction project is divided into eight civil engineering projects and one for operations & maintenance (O&M) consulting. These civil projects include elevated civil works, underground works, railway systems and track works and rolling stock. Wijaya Karya is one of the many contractors for the first phase of the project. The company is responsible for Construction Package (CP) 101-102 for elevated works with Tokyu Corp (Tokyu), and CP 104-105 for underground works with Shimizu, Obayashi Corp (Obayashi) and Jaya Konstruksi.

Construction Regional Sector Update
25 July 2016
See important disclosures at the end of this report 7
Figure 16: A portion of the MRT Jakarta tunnel Figure 17: Building the elevated track for the MRT
Source: SkyscraperCity Source: SkyscraperCity
Outlook
Currently, we see that the CBD area within a 3km radius of Semanggi is already diversified and well developed with a mix of apartments, office buildings and retail spaces. Most of the available land plots are already included in the development plan for the next three years. Future developments within the CBD will mostly centralise around the revitalisation of old buildings. Therefore, we expect to see more skyscrapers in Jakarta’s CBD in the future.
On the other hand, we also note the Government’s plan to accelerate infrastructure and public transportation development, both in and out of the CBD area. This plan includes the development of the MRT and light rail transit (LRT) networks. Jakarta Propertindo (Jakpro) recently announced that it will continue the construction of the inner city LRT in September. The inner city LRT is set to connect North Jakarta and South Jakarta, as well as West Jakarta and East Jakarta. With the improvements in infrastructure and public transportation, we think the CBD area in Jakarta will not be as central as it is today, but will eventually widen to other areas. In the future, we expect to see skyscrapers projects in the outer CBD areas, including Kuningan and TB Simatupang.
Our outlook on the construction sector is still robust, supported by the many infrastructure projects across the nation. Therefore, state-owned contractors such as Adhi Karya (ADHI IJ, BUY, TP: IDR3,400), Waskita Karya (WSKT IJ, NR), Pembangunan Perumahan (PTPP IJ, BUY, TP: IDR4,200) and Wijaya Karya will be the biggest beneficiaries of this development. We also think infrastructure development will also boost the demand for properties, in the future – which will also benefit construction companies.
Figure 18: Crane counts survey table Project name Project type Project owner Location No of cranes
Telkom Landmark Tower Office Building Telekomunikasi Indonesia Gatot Subroto 2 tower cranes
Grade A lot 10 Office Building Hongkong Land SCBD 2 tower cranes and 1 crawler crane
Sequis Tower Office Building Sequis SCBD/Sudirman 2 tower cranes
Langham & District 8 Office & Apartment Building Langham SCBD 10 tower cranes
Simpang Susun Semanggi 2 Road Government Sudirman 2 crawler cranes
Anandamaya & Astra Tower Office Building, Shopping Mall & Apartment Building
Astra & Hongkong Land Sudirman/Benhil 6 tower cranes
Benhil Central Apartment Building Kurnia Realty and Pasar Jaya Sudirman 4 mobile cranes
Lippo Thamrin Office Building Lippo Group Thamrin 1 tower crane
Plaza CIMB Office Building CIMB Sudirman 4 crawler cranes
MRT Jakarta MRT Government Sudirman 2 mobile and 2 crawler cranes
WTC 2 Office Building Pollux Sudirman 2 crawler cranes
Menara Pertiwi Tower Office Building Wiratara Prima Mega Kuningan 5 tower cranes
Chitaland Tower Office Building Sigmatech Satrio 3 crawler and 3 mobile cranes
Ciputra World 2 Office & Apartment Building Ciputra Group Satrio 2 tower cranes
Satrio Tower Office Building Mitra Pertala Perkasa Satrio 2 tower cranes
Mangkuluhur City Office & Apartment Building KG Global Gatot Subroto 3 tower cranes
South hills Apartment Building Tan Kian Group Setiabudi 2 mobile cranes
La Vie Apartment Apartment Building Wilsor Group Setiabudi 3 tower cranes
Icon Complex Office Building Duta Anggada Group Setiabudi 3 tower cranes
Source: RHB

Construction Regional Sector Update
25 July 2016
See important disclosures at the end of this report 8
Malaysia The Petronas Twin Towers, the most iconic building in Kuala Lumpur's Golden Triangle, was chosen as our reference point for our 3km radius crane survey. The 88-storey twin towers, which soar to a height of 451.9 metres, were once the tallest buildings in the world – and remain the tallest twin structures to date.
The 3km radius from the Petronas Twin Towers covers the entire Golden Triangle, which is known as Kuala Lumpur's commercial, shopping and entertainment hub. This is actually a large area that encompasses a number of major streets. Three major roads – Jalan Imbi, Jalan Sultan Ismail and Jalan Raja Chulan feature towering skyscrapers, shopping malls and world-class hotels. Aside from the Golden Triangle, we also sub-divided the remaining area into six districts – Titiwangsa, Datuk Keramat, Kampung Baru, Old City Centre, Ampang and Pudu/Loke Yew
Figure 19: 3km radius, with the Petronas Twin Towers as the centre
Figure 20: 3km radius map feature the Petronas Twin Towers as the centre
Source: RHB Source: RHB
Our survey showed that most of the major developments in Kuala Lumpur’s city centre are still very much concentrated within the Golden Triangle, with 19 major projects now in various stages of completion and 55 cranes (43 mobile and 12 tower cranes) currently deployed in this area. That said, the old city centre is not forgotten, as we found 12 projects currently ongoing with 32 cranes (20 mobile and 12 tower cranes) deployed at this district. The Pudu/Loke Yew area, which is situated next to the Golden Triangle and old city centre, is the third-busiest place in terms of construction, as there are seven ongoing major projects with 27 cranes (20 mobile and seven tower) deployed at this district at the moment. The rest of the four districts only have 2-3 mega projects that are currently in various stages of completion, with up to five cranes being deployed at each of these districts at the time of our survey.
Figure 21: Survey results for Kuala Lumpur Figure 22: Number of cranes by districts in Kuala Lumpur
Source: RHB Source: RHB

Construction Regional Sector Update
25 July 2016
See important disclosures at the end of this report 9
Figure 23: Types of cranes used
Source: RHB
Figure 24: Types of developments in Kuala Lumpur Figure 25: Types of developments in Kuala Lumpur
Source: RHB Source: RHB
Developments within the Kuala Lumpur city centre are currently concentrated on serviced apartments and condominiums, with 11 and nine such projects being built respectively. We also observed that mixed-use developments are currently trending, with 11 ongoing projects under construction. This type of development normally includes common areas and a cohesive design. The modern mixed-use development offers the feel of a small town in the middle of a major metropolis. Although we witnessed eight infrastructure-related projects currently under construction, five of these were related to the construction of the underground station for the MRT network. Some MRT track works for the areas that we surveyed may be in final stages of construction, but they were not visible, given that they are situated underground.
In the two days that we carried out our site survey, we also realised that there are still some pockets of prime vacant land. However, most may have been identified for various developments like residential, office or mixed-used high-rise projects. Although there was no physical work being carried out, we believe some of those may have already obtained approvals from the relevant government authorities. We believe those developers may prefer to wait for market sentiment to improve before announcing any official launches.

Construction Regional Sector Update
25 July 2016
See important disclosures at the end of this report 10
Figure 26: Vacant land fenced off along Jalan Conlay Figure 27: Vacant land fenced off along Jalan Kia Peng
Source: RHB Source: RHB
The biggest plot of land that may potentially be used for future development is situated in the Kampung Baru area (please note that this area is spelt in a variety of ways). The 115-year-old village, the city’s oldest Malay settlement, is located on land that was granted to the Malay community by the fourth Sultan of Selangor, Sultan Abdul Samad (1804-1898). Since the 1970s, the authorities have been trying to develop this Malay enclave, but the biggest stumbling block is the fact that the 121.9ha plot of land comprises 1,355 lots that are owned by more than 5,300 people.
In spite of this hurdle, the Kampong Bharu Development Corp (PKB) is in the process of studying the detailed Kampung Baru 2020 master plan. PKB plans to transform the rustic village into a new Malay cultural centre and the city’s new economic hub, with:
i. 1,900 hotel rooms;
ii. 30m sq ft of office space;
iii. 17,500 residential units;
iv. 12% green and water feature spaces.
One of the main projects identified is the Kampong Bharu City Centre (KBCC), which will become the focal point of the area. Projects under KBCC include a park called KBCC Central Park with pedestrian walkways, pocket parks and water features. This includes 12 iconic buildings with four signature towers that have a collective GDV in the billions of MYR. While there are various challenges to redevelop this piece of prime land, we are keeping a close eye on its progress.
Figure 28: An aerial view of Kampung Baru Figure 29: Artist impression of a redeveloped Kampung Baru
Source: The Star Source: RHB

Construction Regional Sector Update
25 July 2016
See important disclosures at the end of this report 11
We decided to feature five major projects within the survey area that are still in early stages of construction.
Merdeka PNB118 (PNB118)
Merdeka PNB118 is a 118-storey tower within a 19-acre, multi-phase development. Scheduled for completion in 2020, the tower will house Permodalan Nasional’s (PNB) group of companies over 60 floors. It will also comprise 23 floors of rentable commercial space and an 18-story luxury hotel with 236 rooms, as well as multiple sky lobbies and observation decks. The first phase of the project consists of a 118-storey iconic tower and shopping mall with a development cost of MYR5bn.
International consultancy firm Turner International is the project manager. The first contract for Merdeka PNB118, worth MYR74m, was won by Pintaras Jaya (PINT MK, NEUTRAL, TP: MYR3.47) for foundation and piling works back in Mar 2014. These works were completed in late 2015. Meanwhile, South Korea’s Samsung C&T Corp is partnering with local firm UEM Group to build a MYR3.4bn tower. We estimate that the construction of this project is approximately 15% completed.
Figure 30: Artist impression of Merdeka PNB118 Figure 31: Site progress of Merdeka PNB118
Source: KL118 Source: RHB
Tun Razak Exchange (TRX)
The TRX Master Plan includes a total of 25 buildings and over 21m sq ft of total building gross floor area (GFA) spread across office, residential, hotel, retail, food & beverage (F&B) and cultural offerings. The TRX has a development period of 15 years, and will be completed in phases. The initial Phase 1 is slated for completion in 2018. Strategically located at the southern gateway to Kuala Lumpur’s city centre, the TRX is flanked by main arterial roads. It is a natural extension to the Golden Triangle – the city’s commercial, entertainment and shopping belt. The development will offer an unrivalled connectivity to the existing city centre and the rest of the Greater Kuala Lumpur area, given its:
i. Excellent accessibility and connectivity via an integrated underground MRT interchange station;
ii. Direct connectivity to key roads and major highways.
In Oct 2015, WCT (WCTHG MK, BUY, TP: MYR1.84) won a major infrastructure package at the TRX, valued at MYR754.8m. The 2-year contract covers:
i. Underground road structures;
ii. Installation of direct buried utilities;
iii. At-grade and elevated roadway;
iv. Associated earthworks;
v. Mechanical and electrical works.

Construction Regional Sector Update
25 July 2016
See important disclosures at the end of this report 12
A leading Indonesian property developer, Mulia Group, will develop the TRX’s landmark Signature Tower building. TRX City SB, the master developer of TRX, is currently inviting contractors to participate in a pre-qualification exercise for the proposed traffic dispersion and improvement to a part of Jalan Tun Razak (JTR), as well as the construction of the TRX Ingress and Egress. The development is less than 5% complete and construction activities are likely to stretch over a period of 15 years.
Figure 32: TRX Master plan Figure 33: Site progress of TRX
Source: TRX Source: RHB
Bukit Bintang City Centre (BBCC)
The history of the redevelopment of the old Pudu Prison site, which is now called BBCC, can be traced back some 20 years when the 19.4-acre prime land first became vacant. In Feb 2015, the Urban Development Authority (UDA) decided to partner Eco World Development Group for the redevelopment under a JV partnership with the Employees Provident Fund (EPF) via a special-purpose vehicle (SPV) BBCC Development SB (BBCCD) on a 40:40:20 basis.
While construction works have yet to begin, the BBCC’s showroom, site office and car park are all ready for the first official launch of the office tower in 3Q16. BBCCD signed the head of terms agreements with Mitsui Fudosan (Asia) Pte Ltd (Mitsui Fudosan) for the development, ownership and operation of the 1.4m sq ft retail mall through the establishment of a JV company. Phase 1 of the project will consist of a 45-storey block of strata offices and two blocks of serviced residences, comprising 680 units.
Apart from that, BBCCD also signed an agreement with Zepp Hall Network Inc (Zepp Hall), which will see the development of a live concert hall in BBCC that can host an audience of more than 2,000 people. Official awards are expected to be dished out in various packages as at 2H16. The actual site progress is said to begin from 3Q16 or 4Q16, according to our sources.
Figure 34: Artist impression of BBCC Figure 35: BBCC site office and car park
Source: BBCC Development (BBCCD) Source: RHB
Construction Regional Sector Update
25 July 2016
See important disclosures at the end of this report 13
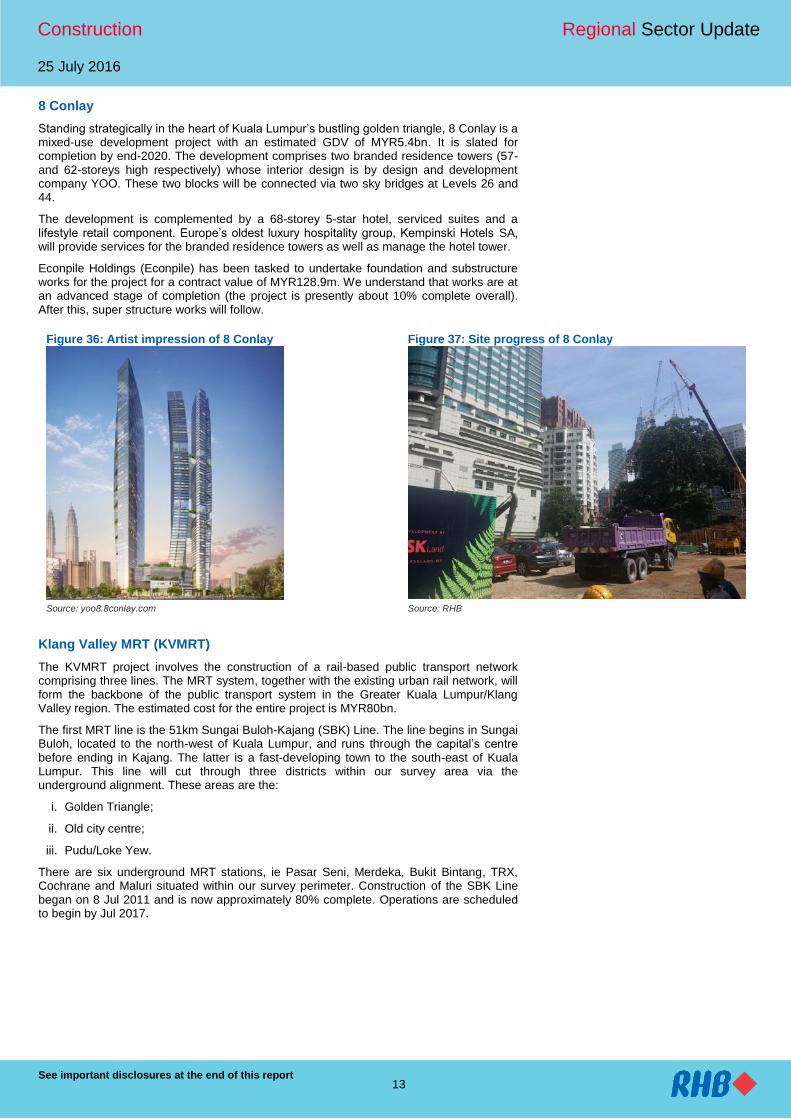
8 Conlay
Standing strategically in the heart of Kuala Lumpur’s bustling golden triangle, 8 Conlay is a mixed-use development project with an estimated GDV of MYR5.4bn. It is slated for completion by end-2020. The development comprises two branded residence towers (57- and 62-storeys high respectively) whose interior design is by design and development company YOO. These two blocks will be connected via two sky bridges at Levels 26 and 44.
The development is complemented by a 68-storey 5-star hotel, serviced suites and a lifestyle retail component. Europe’s oldest luxury hospitality group, Kempinski Hotels SA, will provide services for the branded residence towers as well as manage the hotel tower.
Econpile Holdings (Econpile) has been tasked to undertake foundation and substructure works for the project for a contract value of MYR128.9m. We understand that works are at an advanced stage of completion (the project is presently about 10% complete overall). After this, super structure works will follow.
Figure 36: Artist impression of 8 Conlay Figure 37: Site progress of 8 Conlay
Source: yoo8.8conlay.com Source: RHB
Klang Valley MRT (KVMRT)
The KVMRT project involves the construction of a rail-based public transport network comprising three lines. The MRT system, together with the existing urban rail network, will form the backbone of the public transport system in the Greater Kuala Lumpur/Klang Valley region. The estimated cost for the entire project is MYR80bn.
The first MRT line is the 51km Sungai Buloh-Kajang (SBK) Line. The line begins in Sungai Buloh, located to the north-west of Kuala Lumpur, and runs through the capital’s centre before ending in Kajang. The latter is a fast-developing town to the south-east of Kuala Lumpur. This line will cut through three districts within our survey area via the underground alignment. These areas are the:
i. Golden Triangle;
ii. Old city centre;
iii. Pudu/Loke Yew.
There are six underground MRT stations, ie Pasar Seni, Merdeka, Bukit Bintang, TRX, Cochrane and Maluri situated within our survey perimeter. Construction of the SBK Line began on 8 Jul 2011 and is now approximately 80% complete. Operations are scheduled to begin by Jul 2017.
Construction Regional Sector Update
25 July 2016
See important disclosures at the end of this report 14
The Sungai Buloh-Serdang-Putrajaya (SSP) Line is the second line. Construction is just about to begin, and full services are scheduled to kick off in 2Q22. The SSP Line will serve a corridor with a population of around 2m people that stretches from Sungai Buloh to Putrajaya. It will include:
i. Sri Damansara;
ii. Kepong;
iii. Batu;
iv. Jalan Sultan Azlan Shah;
v. Jalan Tun Razak;
vi. Kuala Lumpur City Centre (KLCC);
vii. TRX;
viii. Kuchai Lama;
ix. Seri Kembangan;
x. Cyberjaya.
Meanwhile, within our survey area, the SSP Line will cut through Titiwangsa, Kampung Baru and the Golden Triangle. The seven stops expected within the city are:
i. Titiwangsa;
ii. Hospital Kuala Lumpur;
iii. Kampung Baru North;
iv. Ampang Park;
v. KLCC East;
vi. Conlay;
vii. A transiting station at the TRX.
Therefore, we expect this project to keep construction activities in Kuala Lumpur buoyant for the next five years.

Construction Regional Sector Update
25 July 2016
See important disclosures at the end of this report 15
Conclusion
The construction sector emerged relatively unscathed from the recalibrated Budget 2016 tabled by Prime Minister Dato’ Sri Najib Razak in January. The focus remains on projects and programmes that are rakyat-centric, and have a high multiplier effect and low import
content. Physical projects that will be prioritised include the construction of affordable houses, hospitals, schools and roads, as well as public transport and security.
Dato’ Sri Najib reaffirmed the implementation of the following projects:
i. Mass Rapid Transit Line 2 (MRT2);
ii. Light Rail Transit 3 (LRT3);
iii. The Refinery and Petrochemical Integrated Development (RAPID) project;
iv. The Pan Borneo Highway;
v. The Malaysian Vision Valley;
vi. Cyber City Centre;
vii. High-Speed Rail (HSR).
These projects, according to the Prime Minister, are to be carried out as planned. Therefore, the infrastructure boom may keep local contractors busy, at least for the short to medium term, in our opinion.
Meanwhile, we believe the value of projects awarded to contractors domestically in 2016 and 2017 may likely surpass that of 2015’s. This will be thanks to the Government’s spending on infrastructure. That said, we are unsure if it can exceed the record set in 2014 of MYR171.6bn. This is as developers are likely to slow down their launches for residential and non-residential projects on the back of a weak property market.
Figure 38: Value of projects awarded to contractors in Malaysia
Source: CIDB Malaysia
Construction Regional Sector Update
25 July 2016
See important disclosures at the end of this report 16
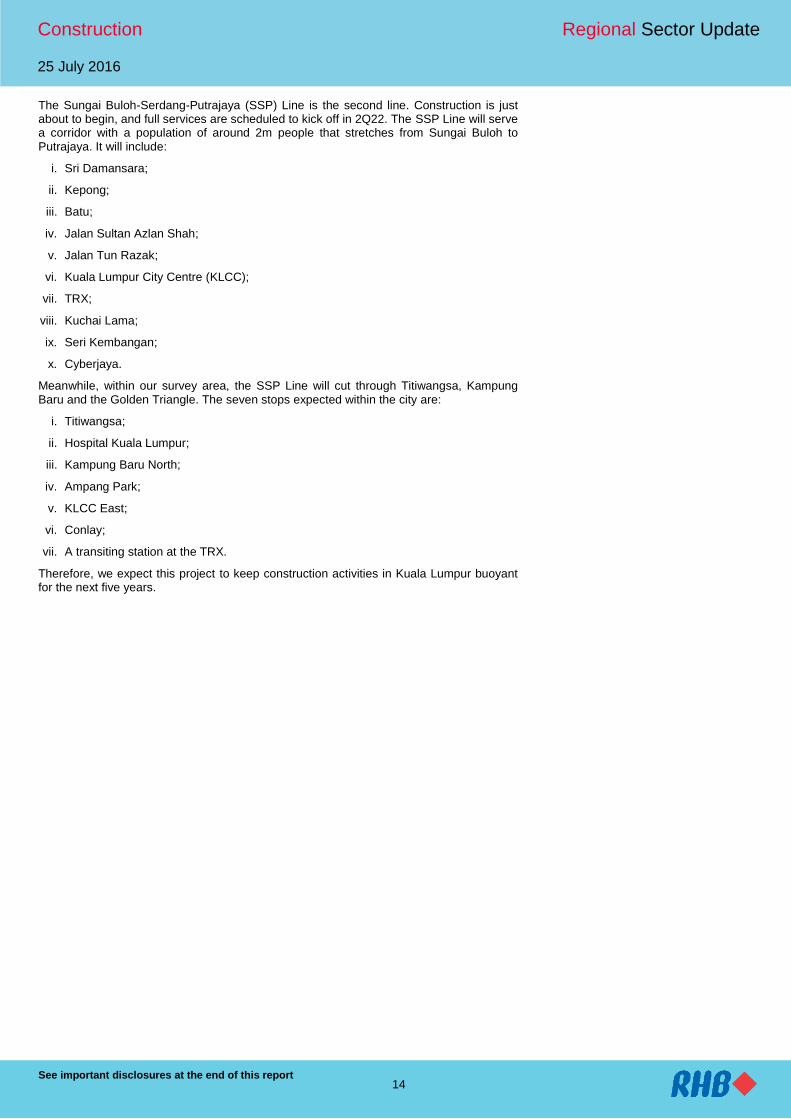
Figure 39: Crane count survey table I Project No of cranes
Name Type Owner District Mobile crane
Tower crane
Progress
GH KL Hospital MOH Titiwangsa 1 1 70%
Setia Sky Residences Serviced apartments SP Setia Titiwangsa 1 95%
Eko Titiwangsa Commercial (mixed development)
Ekovest Titiwangsa 2 5%
Datum Jelatek Condominiums Datum Corp International Datuk Keramat 2 1 10%
Moonlight Terrace Condominiums (two blocks) Faber Union SB Datuk Keramat 2 75%
The Colony by Infinitum Serviced apartments Macly Equity SB Kampung Baru 1 10%
Mercu Zikay Residence Condominiums Zikay Group Kampung Baru 1 70%
Plaza Haji Taib Retail Kha Seng Group Old City Centre 1 40%
UDA Holdings Condominiums (one block) UDA Holdings Old City Centre 1 50%
Safuan Suites Serviced apartments Safuan Group Old City Centre 1 5%
Meridian 101º Serviced apartments (two blocks)
YTL Corp Old City Centre 2 40%
Merdeka PNB118 Mixed development PNB Old City Centre 4 2 15%
MRT (Merdeka Station) Infrastructure MRT Corp Old City Centre 2 70%
MRT (Pasar Seni) Infrastructure MRT Corp Old City Centre 4 70%
River of Life Infrastructure DBKL Old City Centre 1 70%
Daya Bumi extension Offices & commercial space Komplex Dayabumi SB Old City Centre 6 10%
The Robertson Residences Mixed development Gamuda Land Old City Centre 1 4 30%
n.a. Hotel (one block) MG Capital Old City Centre 1 1 5%
The Manhattan Condominiums GD Capital Holdings Old City Centre 1 5%
Dorsett Residences Serviced apartments Permaju Dorsett Bukit Bintang SB
Golden Triangle 1 1 65%
Tribeca Mixed development Low Yat Group Golden Triangle 1 5%
M101 Bukit Bintang Mixed development M101 Bukit Bintang SB Golden Triangle 1 25%
MRT (Bukit Bintang Station)
Infrastructure MRT Corp Golden Triangle 3 70%
Menara Khuan Choo Mixed development Malton Golden Triangle 1 20%
Pavilion Suites Serviced apartments Malton Golden Triangle 1 30%
8 Conlay Mixed development KSK Land Golden Triangle 4 10%
Four Seasons KL Hotel Venus Assets SB Golden Triangle 5 3 50%
W Hotel Hotel Tropicana Corp Golden Triangle 5 1 50%
The Ritz-Carlton Residences
Condominiums YTL Corp Golden Triangle 1 90%
Equatorial Plaza Hotel Hotel Equatorial (M) SB Golden Triangle 2 30%
Bangunan MAS refurbishment
Offices MAS Golden Triangle 1 70%
Sky Suites KLCC Serviced apartment s (three blocks)
Timeless Realty SB Golden Triangle 2 10%
Source: RHB

Construction Regional Sector Update
25 July 2016
See important disclosures at the end of this report 17
Figure 40: Crane count survey table II Project No of cranes
Name Type Owner District Mobile crane
Tower crane
Progress
n.a. Serviced apartments (two blocks)
TA Dev / TA Global Golden Triangle 2 10%
n.a. Condominiums (one block) En. Leong Seong Cheong Golden Triangle 1 5%
Aria Residence Serviced apartments (two block)
Hap Seng Consolidated Golden Triangle 1 5%
Tun Razak Exchange Commercial IMDB & Others Golden Triangle 14 5%
n.a. Serviced apartments n.a. Golden Triangle 1 10%
n.a. Serviced apartments n.a. Golden Triangle 3 5%
Damai Residences Condominiums (one block) Tan & Tan Ampang 1 60%
Road Widening (Jalan Jelatek)
Infrastructure n.a. Ampang 1 10%
Picasso Residences Condominiums (two blocks) Premier De Muara Sdn Bhd Ampang 3 10%
Bukit Bintang City Central Mixed development Eco World & UDA Holdings & EPF
Pudu/Loke Yew 2 1%
MRT (Maluri Station) Infrastructure MRT Corp Pudu/Loke Yew 4 65%
MRT (Cochrane Station) Infrastructure MRT Corp Pudu Loke Yew 4 70%
Tun Razak Traffic Dispersal Infra MOW Pudu/Loke Yew 3 25%
MyTown Shopping Centre Mixed development Boustead Holdings & Ikano Pudu/Loke Yew 3 3 70%
Sunway Velocity Mixed development Sunway Pudu/Loke Yew 4 3 70%
ICC Pudu Mixed development Kuala Lumpur City Hall (DBKL)
Pudu/Loke Yew 1 80%
92 39 37%
Source: RHB

Construction Regional Sector Update
25 July 2016
See important disclosures at the end of this report 18
Singapore We surveyed the CBD region of Singapore and we believe that there is long-term growth potential for the construction sector. The following are our key findings during our crane-counting exercise:
i. A total of 52 cranes within the CBD region – construction progress is on track;
ii. Office developments constitute the main component and are mostly within Singapore’s downtown core region;
iii. Other classes of developments are well spread across the CBD region.
Figure 41: 52 cranes surveyed in the CBD region in total
Source: RHB
We observed that the construction progress of the development projects within the CBD is on track for completion. In this region, we counted a total of 52 cranes. We also note that residential projects are the highest in terms of numbers, but office developments are the largest in terms of project scale.
Figure 42: Zooming into the CBD region Figure 43: Developments are mostly office space
Office Retail Hotel Residential Total
Number of projects
under development10 7 12 25 54
Number of cranes 16 4 7 25 52
GFA/ units 5,251,880 514,647 3,657 4,302 5,774,486
Source: RHB Source: RHB
Construction Regional Sector Update
25 July 2016
See important disclosures at the end of this report 19
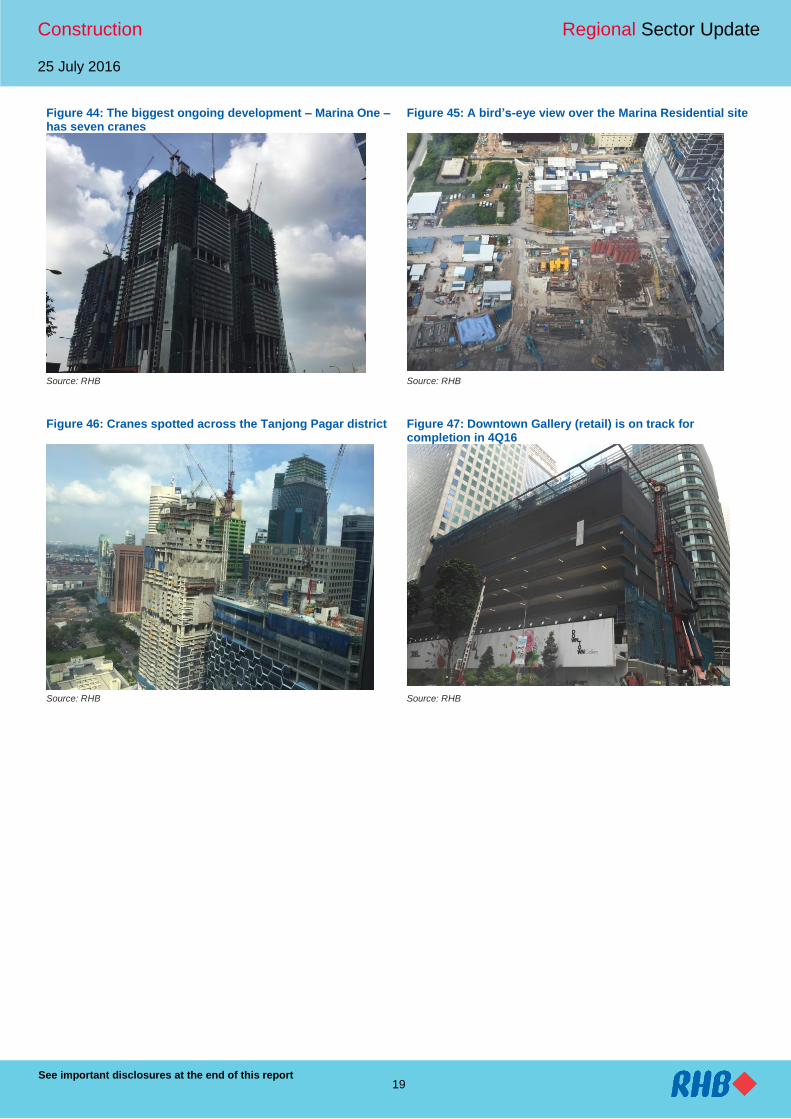
Figure 44: The biggest ongoing development – Marina One – has seven cranes
Figure 45: A bird’s-eye view over the Marina Residential site
Source: RHB Source: RHB
Figure 46: Cranes spotted across the Tanjong Pagar district Figure 47: Downtown Gallery (retail) is on track for completion in 4Q16
Source: RHB Source: RHB

Construction Regional Sector Update
25 July 2016
See important disclosures at the end of this report 20
Figure 48: Guoco Tower will be the tallest building in Singapore
Figure 49: Frasers Tower will be the only CBD office supply in 2018
Source: RHB Source: RHB
The future of Singapore’s CBD
The CBD region is the bloodline of Singapore’s future economy. Since the late 1980s, the Government has pushed initiatives to develop and maintain the sustainability of this region.
The crucial task now is how to maintain the sustainability of the CBD, in order to keep Singapore’s economic status intact. To this end, three mega trends (strongly backed by the Government) will emerge in the CBD region:
i. An increase in the number of mixed developments;
ii. Development of better transport accessibility;
iii. An increase in the number of energy-efficient buildings.
Figure 50: Huge transformation of Marina Bay since the late 1980s
Source: Ministry of National Development (MND)
Construction Regional Sector Update
25 July 2016
See important disclosures at the end of this report 21
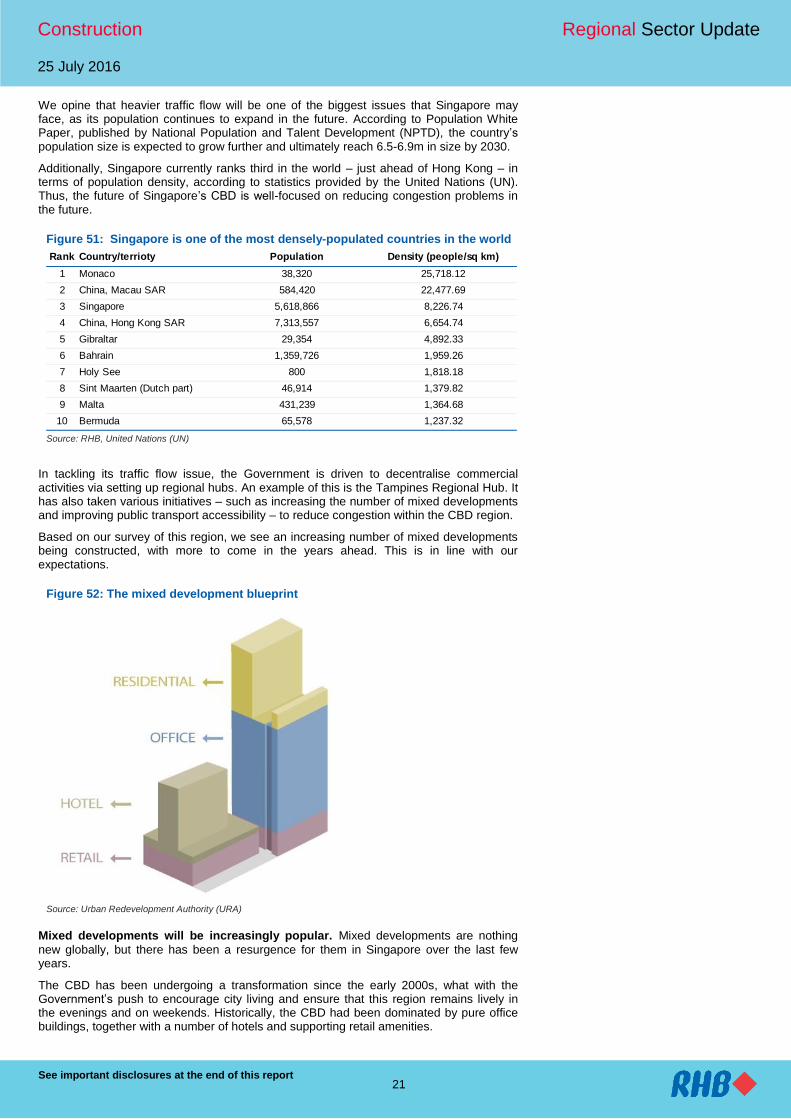
We opine that heavier traffic flow will be one of the biggest issues that Singapore may face, as its population continues to expand in the future. According to Population White Paper, published by National Population and Talent Development (NPTD), the country’s population size is expected to grow further and ultimately reach 6.5-6.9m in size by 2030.
Additionally, Singapore currently ranks third in the world – just ahead of Hong Kong – in terms of population density, according to statistics provided by the United Nations (UN). Thus, the future of Singapore’s CBD is well-focused on reducing congestion problems in the future.
Figure 51: Singapore is one of the most densely-populated countries in the world
Rank Country/terrioty Population Density (people/sq km)
1 Monaco 38,320 25,718.12
2 China, Macau SAR 584,420 22,477.69
3 Singapore 5,618,866 8,226.74
4 China, Hong Kong SAR 7,313,557 6,654.74
5 Gibraltar 29,354 4,892.33
6 Bahrain 1,359,726 1,959.26
7 Holy See 800 1,818.18
8 Sint Maarten (Dutch part) 46,914 1,379.82
9 Malta 431,239 1,364.68
10 Bermuda 65,578 1,237.32
Source: RHB, United Nations (UN)
In tackling its traffic flow issue, the Government is driven to decentralise commercial activities via setting up regional hubs. An example of this is the Tampines Regional Hub. It has also taken various initiatives – such as increasing the number of mixed developments and improving public transport accessibility – to reduce congestion within the CBD region.
Based on our survey of this region, we see an increasing number of mixed developments being constructed, with more to come in the years ahead. This is in line with our expectations.
Figure 52: The mixed development blueprint
Source: Urban Redevelopment Authority (URA)
Mixed developments will be increasingly popular. Mixed developments are nothing
new globally, but there has been a resurgence for them in Singapore over the last few years.
The CBD has been undergoing a transformation since the early 2000s, what with the Government’s push to encourage city living and ensure that this region remains lively in the evenings and on weekends. Historically, the CBD had been dominated by pure office buildings, together with a number of hotels and supporting retail amenities.
Construction Regional Sector Update
25 July 2016
See important disclosures at the end of this report 22
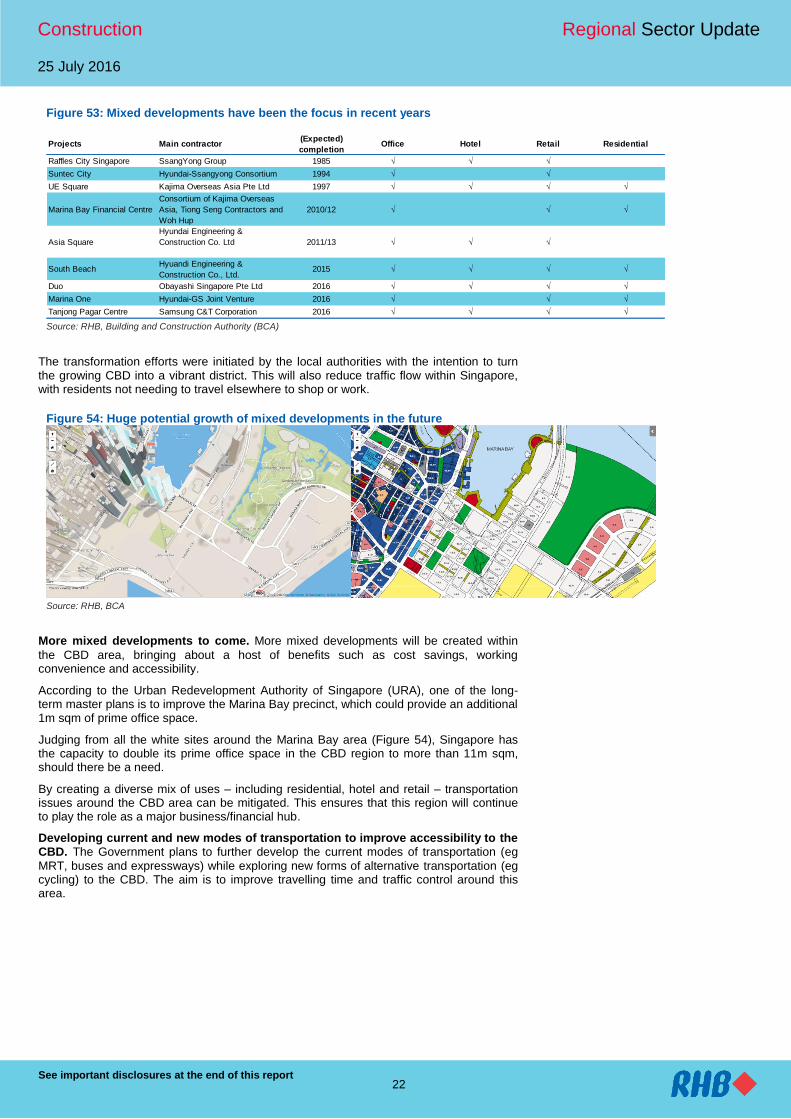
Figure 53: Mixed developments have been the focus in recent years
Projects Main contractor(Expected)
completionOffice Hotel Retail Residential
Raffles City Singapore SsangYong Group 1985 √ √ √
Suntec City Hyundai-Ssangyong Consortium 1994 √ √
UE Square Kajima Overseas Asia Pte Ltd 1997 √ √ √ √
Marina Bay Financial Centre
Consortium of Kajima Overseas
Asia, Tiong Seng Contractors and
Woh Hup
2010/12 √ √ √
Asia Square
Hyundai Engineering &
Construction Co. Ltd 2011/13 √ √ √
South BeachHyuandi Engineering &
Construction Co., Ltd.2015 √ √ √ √
Duo Obayashi Singapore Pte Ltd 2016 √ √ √ √
Marina One Hyundai-GS Joint Venture 2016 √ √ √
Tanjong Pagar Centre Samsung C&T Corporation 2016 √ √ √ √ Source: RHB, Building and Construction Authority (BCA)
The transformation efforts were initiated by the local authorities with the intention to turn the growing CBD into a vibrant district. This will also reduce traffic flow within Singapore, with residents not needing to travel elsewhere to shop or work.
Figure 54: Huge potential growth of mixed developments in the future
Source: RHB, BCA
More mixed developments to come. More mixed developments will be created within
the CBD area, bringing about a host of benefits such as cost savings, working convenience and accessibility.
According to the Urban Redevelopment Authority of Singapore (URA), one of the long-term master plans is to improve the Marina Bay precinct, which could provide an additional 1m sqm of prime office space.
Judging from all the white sites around the Marina Bay area (Figure 54), Singapore has the capacity to double its prime office space in the CBD region to more than 11m sqm, should there be a need.
By creating a diverse mix of uses – including residential, hotel and retail – transportation issues around the CBD area can be mitigated. This ensures that this region will continue to play the role as a major business/financial hub.
Developing current and new modes of transportation to improve accessibility to the CBD. The Government plans to further develop the current modes of transportation (eg
MRT, buses and expressways) while exploring new forms of alternative transportation (eg cycling) to the CBD. The aim is to improve travelling time and traffic control around this area.

Construction Regional Sector Update
25 July 2016
See important disclosures at the end of this report 23
Figure 55: One of the main MRT developments is to develop the Thomson East Coast Line (TEL)
Source: RHB, Land Transport Authority (LTA)
Key MRT developments within the CBD region are:
i. The Thomson East Coast Line (TEL) is expected to open in 2019. It will bring about greater accessibility to the CBD area by connecting the Eastern Region Line with the Thomson Line;
ii. The Downtown Line is also expected to have all stations up and ready by 2017, making it easier for more commuters to access CBD areas;
iii. Circle Line Stage 6 (CCL6) is slated to be ready by 2025, which will allow commuters staying in the west of the republic to have better access to the CBD area.
Other than the completion of new MRT lines, the Singapore Land Transport Authority (LTA) aims to have more than 90% of all buildings in CBD to be within 400m of the nearest MRT station by 2025. The walking routes will also be sheltered to facilitate travelling within the CBD area.
Bus services towards the CBD. The Bus Service Enhancement Programme (BSEP)
aims to create more bus services in the CBD area. Commuters now enjoy direct journeys to the CBD following the implementation of five new City Direct Services (CDS) in February-March, bringing the total number of CDS to 20.
Expressways. The completion of the North-South Expressway (NSE) by 2020 will link
areas like Bishan, Toa Payoh and Novena to the CBD. Commuters in the north-south region should see a significant 30% improvement in their travelling times. For example, with the new NSE expressway, it will take only 20-30 minutes to travel from Yishun to the CBD vs 30-35 minutes currently.

Construction Regional Sector Update
25 July 2016
See important disclosures at the end of this report 24
Figure 56: Cycling route to the CBD
Source: URA
Cycling infrastructure. The URA plans to shift focus towards cycling as a form of
alternative transport, especially towards the CBD area. One option that it is considering is redesigning Kallang Park Connector to be a north-south commuter cycling route from the central to the CBD areas. Cyclists will take an average of 30-45 minutes to travel from one end to the other.
Green is the new black. Adopting cleaner energy will be a major trend within Singapore’s
infrastructure sector. As a low-lying, densely-populated island in the tropics, the country is vulnerable to the impact of climate change.
In view of this, it is essential for Singapore to move towards becoming a nation with “greener buildings”, which will reduce its energy intensity. As such, the Government targets to:
i. Increase greenery in high-rise buildings to 50ha by 2030;
ii. To have 80% of the current existing buildings achieve the Building & Construction Authority’s (BCA) Green Mark certification, at the very least.
The BCA’s Green Mark scheme is a green building rating system that evaluates a building for its environmental impact and performance. The assessment criteria for the certification cover:
i. Energy efficiency;
ii. Water efficiency;
iii. Environmental protection;
iv. Indoor environment quality;
v. Other green features and innovations.
Therefore, we expect energy-saving infrastructure to increase, not only within the CBD region, but across Singapore as well.

Construction Regional Sector Update
25 July 2016
See important disclosures at the end of this report 25
Figure 57: Funds have been set up to achieve a greener nation
Source: BCA
Initiative well backed by the Government. As shown in Figure 57, multiple funds have
been set up by the authorities to build a more sustainable Singapore. The largest initiative is the SGD52m Green Buildings Innovation Cluster (GBIC), an integrated building energy efficiency research, development & demonstration (RD&D) hub that aims to help bolster the link between research and how it translates into public policy.
Green buildings since 2000. Capital Tower (along Robinson Road) became Singapore’s
first intelligent building when it was completed in 2000. It has set the trend for green buildings on the island.
Figure 58: High growth of green buildings in Singapore
Title:
Source:
Please fill in the values above to have them entered in your report
17 33127
239427
732
1,171
1,557
2,0032,155
2,524
0.0
100.0
200.0
300.0
400.0
500.0
600.0
700.0
800.0
900.0
0
500
1,000
1,500
2,000
2,500
3,000
Sep
-05
Sep
-06
Sep
-07
Sep
-08
Sep
-09
Sep
-10
Sep
-11
Sep
-12
Sep
-13
Sep
-14
Sep
-15
[LHS] Number of green buildings [RHS] GFA (m sq f t)
Source: RHB, BCA
Since the BCA’s Green Mark scheme kicked off in 2005, the number of green buildings in Singapore has surged to more than 2,500 today from 17 originally. This translates into over 70m sqm of GFA, or c.29% of total GFA in the country.
Interestingly, green building tenants tend to be multi-national corporations (MNCs) and large locally-listed organisations. This is because they have carbon commitments and climate policies to adhere to, according to a 19 Oct 2015 report by the Business Times.

Construction Regional Sector Update
25 July 2016
See important disclosures at the end of this report 26
Figure 59: Projects under construction I
Project Name Project type Project Owner District # of cranesConstruction
progress (%)
Marina One Office M+S Pte Ltd Marina Bay 7 83%
SBF Centre (strata titled) Office FEO Shenton Way 1 83%
EON Shenton (strata titled) Office 70 Shenton Pte Ltd Shenton Way 0 83%
GSH Plaza (strata titled) Office Plaza Venture Pte Ltd Raffles Place 1 83%
Duo Office M+S Pte Ltd Beach Rd/ City Hall 1 89%
Guoco Tower Office GuocoLand Tanjong Pagar 1 97%
Redevelopment of International Factors
Building and Robinson TowersOffice Tuan Sing Robinson Road 1 50%
5 Shenton Way Office UIC Land Shenton Way 1 75%
Oxley Tower (strata titled) Office Oxley Holdings Robinson Road 1 73%
Frasers Tower Office Frasers Centrepoint Shenton Way 2 31%
Havelock II RetailHorizon Value Investments SP3 Pte Ltd
(Gutherie GTS Limited)Havelock Road 0 97%
Hotel Development at Middle Road
(Former Midlink Plaza)Retail 122 Middle Investment Pte Ltd 122 Middle Road 0 97%
Duo Galleria Retail Ophir-Rochor Commercial Pte Ltd Fraser Street 0 83%
Refurbishment of Gallery Hotel Retail RB Corp Pte Ltd Nanson Road 1 83%
Downtown Gallery Retail OUE Shenton Way 1 75%
City Gate Retail Bayfront Ventures Pte Ltd Beach Road 1 22%
Office/shopping development (Former
Tower Fifteen, Sky Tower)Retail Fragrance Grandeur Pte Ltd Hoe Chiang Road 1 0%
Mercure Singapore Middle Road Hotel Accor Middle Road 0 97%
M Social Hotel Millennium Hotels Robertson Quay 0 97%
Premier Inn Singapore HotelMaster Contract Services Pte Ltd/ Fine
Grain Property ConsortiumBeach Road 0 97%
InterContinental Singapore Robertson
Quay (formerly Gallery Hotel)Hotel Frasers Hospitality Trust Havelock Road 0 83%
Swissôtel Merchant Court Hotel Accor Merchant Road 0 83%
Novotel Singapore on Stevens Hotel Oxley Gem Pte Ltd Stevens Road 1 33%
Somerset Grand Cairnhill Singapore
RedevelopmentHotel CapitaLand Cairnhill Road 1 33%
Murray House Hotel China Classic Pte Ltd Maxwell Road 1 33%
Ibis Singapore on Stevens Hotel Oxley Gem Pte Ltd Stevens Road 1 33%
YOTEL Orchard Road Hotel Yat Yuen Hong Co Orchard Road 1 33%
The Biltmore Hotel Granmil Holdings Pte Ltd Cuscaden Road 1 0%
Frasers @ China Street Hotel Frasers Centrepoint China Street 1 0% Source: RHB

Construction Regional Sector Update
25 July 2016
See important disclosures at the end of this report 27
Figure 60: Projects under construction II
Project Name Project type Project Owner District # of cranes Construction
progress (%)
3 Orchard By-The-Park Residential YTL Westwood Properties Pte Ltd Orchard Boulevard 1 58%
Cairnhill Nine Residential CH Commercial Pte Ltd/CH Residential
Pte Ltd
Cairnhill Road 1 58%
DUO Residences Residential Ophir-Rochor Commercial Pte Ltd/Ophir-
Rochor Hotel Pte Ltd/Ophir-Rochor
Fraser Street 1 50%
Eon Shenton Residential 70 Shenton Pte Ltd Shenton Way 1 13%
Ferra Residential Far East Lighthouse Pte Ltd/Orchard
Landmark Pte Ltd
Leonie Hill 1 17%
Goodwood Grand Residential Feature (Balmoral) Pte Ltd Balmoral Road 1 17%
Gramercy Park Residential Aston Properties Pte Ltd Grange Road 1 83%
Liv On Sophia Residential RH Mount Sophia Pte Ltd Adis Road 1 0%
Liv on Wilkie Residential RH Rochor Pte Ltd Wilkie Terrace 1 0%
Lloyd Sixtyfive Residential TG (2010) Pte Ltd Lloyd Road 1 83%
New Futura Residential City Sunshine Holdings Pte Ltd Leonie Hill Road 1 0%
One Balmoral Residential Hong Leong Holdings Ltd Balmoral Road 1 58%
Oxley Edge Residential Oxley Mosaic Pte Ltd River Valley Road 1 83%
Residential apartments Residential Yow Cheong Pte Ltd Balmoral Road 1 58%
Residential apartments Residential Celestial Fortune Pte Ltd Draycott Park 1 58%
Robinson Suites Residential 50 Robinson Pte Ltd Robinson Road 1 83%
Service apartments in OUE Downtown 1 Residential Alkas Realty Pte Ltd Shenton Way 1 83%
Sophia Hills Residential Hoi Hup Sunway Mount Sophia Pte Ltd Mount Sophia 1 28%
Strata housing development Residential Far East Land And Housing
Development Co Pte Ltd
Peirce Road 1 28%
The Met @ 18 Residential Newfort Realty Pte Ltd Mount Elizabeth 1 28%
The Rise @ Oxley - Residences Residential Oxley Rise Pte Ltd Oxley Rise 1 13%
The Scotts Tower Residential Far East Success Development Pte
Ltd/Whitewater Properties Pte Ltd
Scotts Road 1 33%
The Siena Residential Far East SOHO Pte Ltd Tan Kim Cheng Road 1 50%
Valley House Residential Kwan Im Thong Hood Cho Temple River Valley Road 1 50%
Wallich Residence at Tanjong Pagar Centre Residential Belmeth Pte Ltd/Guston Pte Ltd/Perfect
Eagle Pte Ltd
Wallich Street 1 83%
Source: RHB

Construction Regional Sector Update
25 July 2016
See important disclosures at the end of this report 28
Thailand For Bangkok, which is also known as the City of Angels, we made the 304m tall Baiyoke Tower II the centre of our survey area. This is because this 85-storey building has been the tallest structure in the city since 1997. However, there are two new skyscrapers in the pipeline that will be taller than this building:
i. The MahaNakhon project, located next to RHB Securities’ (Thailand) head office, will be 10m higher than Baiyoke Tower II and is expected to be fully completed within 4Q16. However, Baiyoke Tower II’s location – at the centre of the CBD – seems more superior and the radius around the building covers many types of construction projects, ie residential, commercial, government centres, etc;
ii. The 615m-high Super Tower will be almost double the height of the MahaNakhon. The project, which has not begun construction yet, is set to be the tallest structure in Bangkok by FY19 at the earliest. However, the Super Tower will be located outside of the CBD.
We choose Baiyoke Tower II as the centre of our survey area, due to the following factors:
i. It is located in Bangkok’s CBD and is the tallest structure within a 3km radius. The survey area covers two districts fully and eight districts partially (out of a total of 50 districts in Bangkok). Note that these 10 districts are significant to the city in terms of economic contributions, ie more than 50% of Bangkok’s tax revenue comes from these areas;
ii. With its location, we are able to cover diversified economic activities that are found in different areas. There are several well-known commercial projects towards the south, such as Siam Paragon, Central World and Silom Road. Towards the north lie a hub of government agencies and a military base. Eastwards, there are new-generation residential projects that are popular, especially mid- to high-end condominiums, in Asoke, Ploenchit, Nana, Rama IX and Ratchadapisek amongst others. Meanwhile, towards the west, communities in the old part of Central Bangkok have been living there for a long time.
Figure 61: Baiyoke Tower II is the centre of our survey area Figure 62: Condominium projects dominate the CBD area
Source: RHB Source: RHB
Construction Regional Sector Update
25 July 2016
See important disclosures at the end of this report 29
Figure 63: Crane-counting results by project type Figure 64: Crane-counting results by district
Source: RHB Source: RHB
We found 112 cranes within our survey area, which is surprising when compared to our pre-survey estimate. As expected, the majority (43 cranes) could be found at the construction sites of condominium projects, ie residential projects within the CBD area that feature units that will be affordable and see strong demand from homebuyers.
About 55% of condominium sites under construction are located in the east, ie a popular location for both real and investment demand. This is because this area is the prime spot for properties that fetch the highest prices in Thailand. Prices range from THB150,000 per sqm to THB500,000 per sqm. This is beyond what is affordable for a mid-level salary earner. The projects are also close to Bangkok Mass Transit System (BTS Skytrain) routes and the underground MRT network that is currently in use.
We found that construction activities are in full swing, and the projects have an average presales rate of over 50%. One of the most noteworthy condominium projects is Rhythm Rangnam, developed by AP (Thailand) (AP TB, BUY, TP: THB8.50), which booked 100% in presales within the first day of its grand opening due to the limited supply of condominium projects within the Ratchathewi district.
As the high price of land in the surveyed area seems to be an entry barrier for small- to medium-sized developers, 79% of new condominium projects are developed by SET-listed companies with strong reputations in the high-end market. We did note the case of the AQ Aria Asoke project, which was being developed by AQ Estate (AQ TB, NR), a company whose financial position is not too upbeat. In a recent filing on the SET, medium-sized developer Chewathai (CHEWA TB, NR), which was listed in April, announced the acquisition of AQ Aria Asoke from AQ Estate. It plans to rename the project as Chewathai Residence Asoke. This implies that most developers, both SET-listed and non-listed, will likely develop projects in this area if the opportunity arises.
Figure 65: Examples of condominium projects developed by SET-listed companies with a dominant presence in the CBD
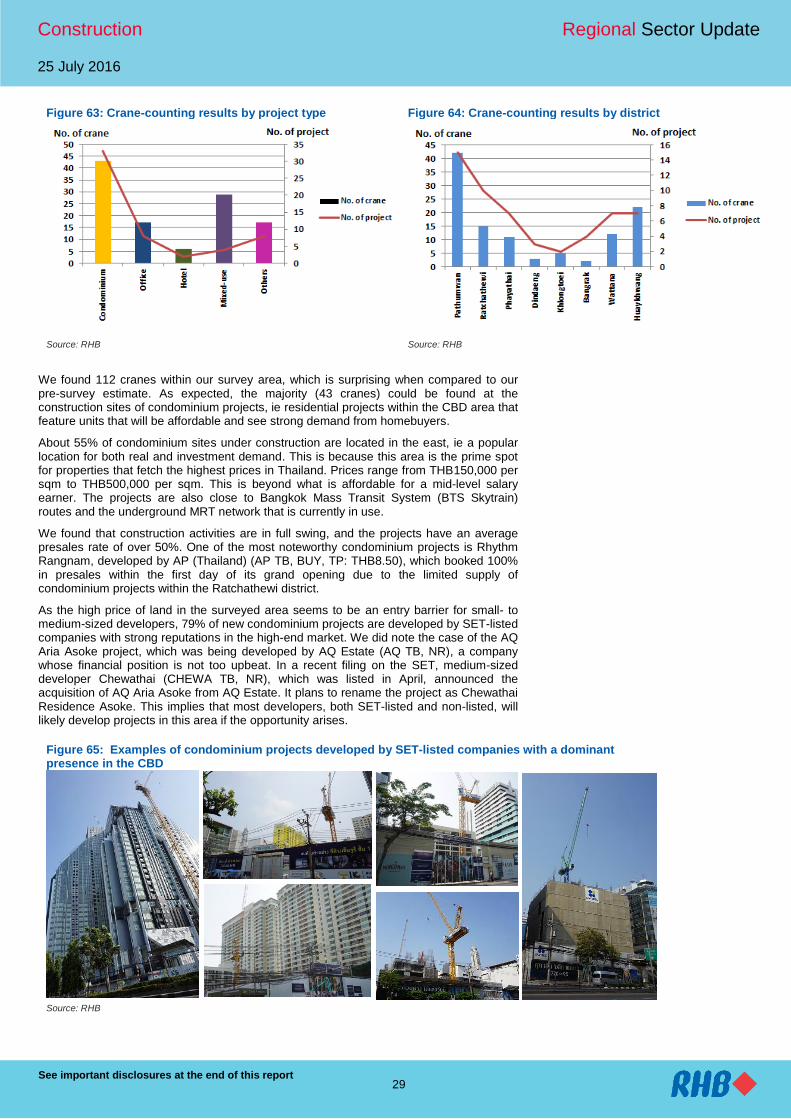
Source: RHB

Construction Regional Sector Update
25 July 2016
See important disclosures at the end of this report 30
Figure 66: There are only a few condominium projects developed by non-listed companies in the CBD, due to the high prices of land, which are a barrier to entry
Source: RHB
In addition to the actual number of cranes exceeding our expectation, we were also surprised to find some industries in expansion mode. These include:
i. Healthcare sector. There are nine cranes (or 8% of the total crane count) actively
involved in works for companies within this sector. Many are public and private hospitals that have strong reputations locally. We found three leading public healthcare institutions – Rajavithi Hospital, Phramongkutklao Hospital and the Thai Red Cross College of Nursing – under the process of new construction activities. The highlight development in this sector is the new 25-storey medical centre under Rajavithi Hospital. The latter has been providing medical services for 65 years now and its new building is designed to provide medical services. This is essential as Bangkok’s low-income segment is dependent on public hospitals, which normally recruit highly-experienced doctors but charge much lower rates vis-à-vis private hospitals. Currently, low-income patients spend half a day on average while waiting to see a doctor. The factors behind the expansion of public hospitals (as well as private hospitals) in Bangkok and nationwide are:
a. The rising proportion of the aging population in Thailand is anticipated to constitute 20% of the total population in FY25;
b. The low number of doctors to the total population should be rising to be on par with other ASEAN member states;
c. The urbanisation trend.
Figure 67: Proportion of aging population to reach 20% within FY25
Year Total population
(million) % of total population
Age: 0-14 years Age: 15-59 years Age: 60 years and above 2010 67.0 21.2 67.1 11.7 2015 69.1 20.2 66.0 13.8
2020F 70.8 19.0 64.2 16.8 2025F 72.3 18.0 62.0 20.0
Source: Office of The National Economic and Social Development Board

Construction Regional Sector Update
25 July 2016
See important disclosures at the end of this report 31
Figure 68: Rajavithi Hospital is constructing a new – and its largest building – in the healthcare sector
Source: RHB
Figure 69: New research centre being built for Phramongkutklao Hospital
Figure 70: Thai Red Cross College is constructing a new building to expand its capacity to educate new nursing students
Source: RHB Source: RHB
ii. Education sector. Although the crane count for projections under construction for
the education sector stood at four only (or 3.5% of the total crane count), this indicated that schools are keen to capture the strong demand for higher-level education. Such education will be needed for Thailand’s “Generation Z”, ie those born in 1997 and thereafter will complete Bachelor degree from university in the next few years. Education is a long-term business, as a more educated Generation Y enters parenthood. We think this generation will tend to have a bigger budget to spare for the education of their children and siblings. We discovered three construction sites for university campuses. Two of these are new faculty buildings, while the third is a car park facility for Master of Business Administration (MBA) students.

Construction Regional Sector Update
25 July 2016
See important disclosures at the end of this report 32
Figure 71: Construction works for the educational centre for environmental studies under Chulalongkorn University’s faculty of architecture
Figure 72: Construction site of the operations centre for Chulalongkorn University’s health science department
Source: RHB Source: RHB
Figure 73: New car parking building for students at the University of the Thai Chamber of Commerce (UTCC) campus
Source: RHB
iii. Hotel sector to expand to new locations. Normally, 4-5 star hotels in Bangkok are
concentrated in the central area of the CBD. However, we found one mixed-use project in the northern part of this district, which currently has offices and condominiums only. This 34-floor project combines a 180-room hotel with office spaces. The hotel opens up a new option for hospitality facilities to be located with easy access to the BTS Skytrain network – especially since land prices in the CBD have surged in the past few years. This may give hotel developers ideas on alternative locations to expand new projects.

Construction Regional Sector Update
25 July 2016
See important disclosures at the end of this report 33
Figure 74: Ari Hill, a mixed-use building comprising offices and a hotel
Figure 75: Ari Hill project’s progress
Source: Urban Capital Source: RHB
The game of landlords
Within the 28.3 sq km surveyed area, we also discovered what seems to be a classic game of Monopoly being played by the city’s landlords. Currently, there are three big land plots in Bangkok’s CBD with high potential for large-scale projects – and each plot is owned by a different entity. Chulalongkorn University owns the first plot, which is located close to its campus and near Siam Square. The latter is a trendy shopping area for Thai teenagers.
The second plot is owned under a leasehold concession by the Sirivadhanabhakdi family, which owns Chang Beer and the TCC Group. It is located in a prime area, at the Wireless Road intersection near the Japanese embassy and the beginning of Sathorn Road. However, these two entities are historically slow movers by nature and we expect no significant construction activities at this moment.
Construction is active at the third plot of land called Langsuan Village. Spanning 56 rai (or about 9ha), it is owned by Siam Sindhorn Co Ltd, which, in turn, is under the auspices of the Crown Property Bureau. Langsuan Village is located in a peaceful and green part of the CBD. It offers a view of Lumpini Park, the most popular recreational area for employees after working hours. Our ground checks show that Langsuan Village currently has 17 cranes (15% of the total crane count). This is the highest number of cranes in our surveyed areas. Construction is at an early stage, with foundation works done by SEAFCO Pcl (SEAFCO TB, NR). As the plot of land is large, the project is a mixed-use development comprising:
i. Four leasehold condominium buildings;
ii. Three serviced apartment blocks;
iii. A hotel;
iv. A health centre;
v. An art museum.
Some construction works in the project will be completed from FY19 onwards, and this project is set to transform the area from being a quiet place during the weekends to a busy area every day.
However, the slow movement of two land plots mentioned above can be seen as a positive factor that will not lead to an oversupplied situation within the area. This is because the three areas are located within a 10 minute drive from each another. Therefore, there is a pipeline of mix-used projects and construction in this prime CBD area, which will continue to be active for the next five years.
Construction Regional Sector Update
25 July 2016
See important disclosures at the end of this report 34
Figure 76: The master plan of the Langsuan Village project
Source: www.langsuanvillage.com
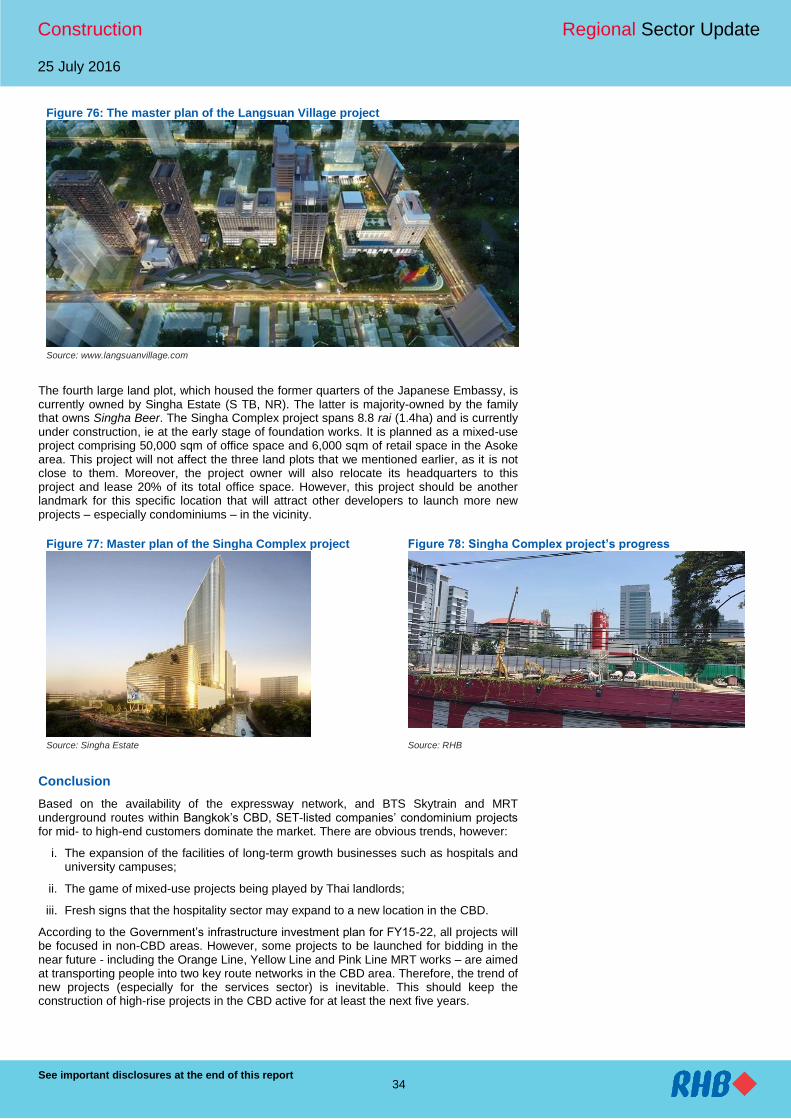
The fourth large land plot, which housed the former quarters of the Japanese Embassy, is currently owned by Singha Estate (S TB, NR). The latter is majority-owned by the family that owns Singha Beer. The Singha Complex project spans 8.8 rai (1.4ha) and is currently under construction, ie at the early stage of foundation works. It is planned as a mixed-use project comprising 50,000 sqm of office space and 6,000 sqm of retail space in the Asoke area. This project will not affect the three land plots that we mentioned earlier, as it is not close to them. Moreover, the project owner will also relocate its headquarters to this project and lease 20% of its total office space. However, this project should be another landmark for this specific location that will attract other developers to launch more new projects – especially condominiums – in the vicinity.
Figure 77: Master plan of the Singha Complex project Figure 78: Singha Complex project’s progress
Source: Singha Estate Source: RHB
Conclusion
Based on the availability of the expressway network, and BTS Skytrain and MRT underground routes within Bangkok’s CBD, SET-listed companies’ condominium projects for mid- to high-end customers dominate the market. There are obvious trends, however:
i. The expansion of the facilities of long-term growth businesses such as hospitals and university campuses;
ii. The game of mixed-use projects being played by Thai landlords;
iii. Fresh signs that the hospitality sector may expand to a new location in the CBD.
According to the Government’s infrastructure investment plan for FY15-22, all projects will be focused in non-CBD areas. However, some projects to be launched for bidding in the near future - including the Orange Line, Yellow Line and Pink Line MRT works – are aimed at transporting people into two key route networks in the CBD area. Therefore, the trend of new projects (especially for the services sector) is inevitable. This should keep the construction of high-rise projects in the CBD active for at least the next five years.
Construction Regional Sector Update
25 July 2016
See important disclosures at the end of this report 35
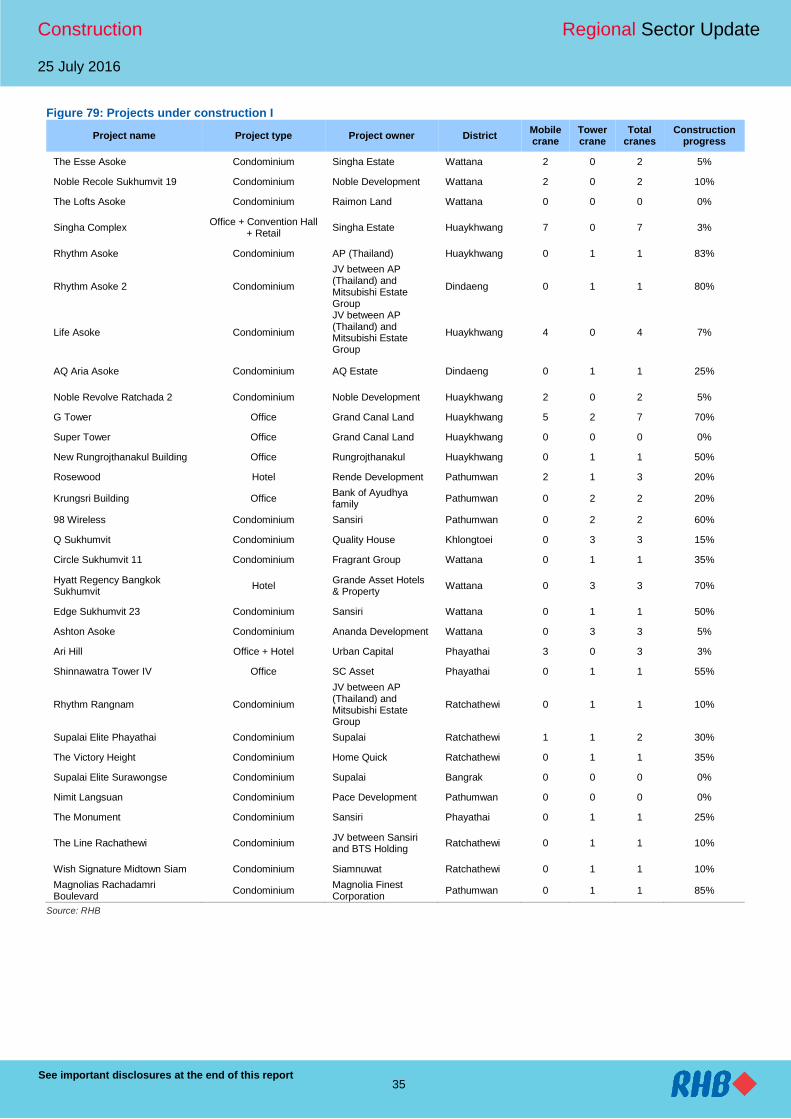
Figure 79: Projects under construction I
Project name Project type Project owner District Mobile crane
Tower crane
Total cranes
Construction progress
The Esse Asoke Condominium Singha Estate Wattana 2 0 2 5%
Noble Recole Sukhumvit 19 Condominium Noble Development Wattana 2 0 2 10%
The Lofts Asoke Condominium Raimon Land Wattana 0 0 0 0%
Singha Complex Office + Convention Hall
+ Retail Singha Estate Huaykhwang 7 0 7 3%
Rhythm Asoke Condominium AP (Thailand) Huaykhwang 0 1 1 83%
Rhythm Asoke 2 Condominium
JV between AP (Thailand) and Mitsubishi Estate Group
Dindaeng 0 1 1 80%
Life Asoke Condominium
JV between AP (Thailand) and Mitsubishi Estate Group
Huaykhwang 4 0 4 7%
AQ Aria Asoke Condominium AQ Estate Dindaeng 0 1 1 25%
Noble Revolve Ratchada 2 Condominium Noble Development Huaykhwang 2 0 2 5%
G Tower Office Grand Canal Land Huaykhwang 5 2 7 70%
Super Tower Office Grand Canal Land Huaykhwang 0 0 0 0%
New Rungrojthanakul Building Office Rungrojthanakul Huaykhwang 0 1 1 50%
Rosewood Hotel Rende Development Pathumwan 2 1 3 20%
Krungsri Building Office Bank of Ayudhya family
Pathumwan 0 2 2 20%
98 Wireless Condominium Sansiri Pathumwan 0 2 2 60%
Q Sukhumvit Condominium Quality House Khlongtoei 0 3 3 15%
Circle Sukhumvit 11 Condominium Fragrant Group Wattana 0 1 1 35%
Hyatt Regency Bangkok Sukhumvit
Hotel Grande Asset Hotels & Property
Wattana 0 3 3 70%
Edge Sukhumvit 23 Condominium Sansiri Wattana 0 1 1 50%
Ashton Asoke Condominium Ananda Development Wattana 0 3 3 5%
Ari Hill Office + Hotel Urban Capital Phayathai 3 0 3 3%
Shinnawatra Tower IV Office SC Asset Phayathai 0 1 1 55%
Rhythm Rangnam Condominium
JV between AP (Thailand) and Mitsubishi Estate Group
Ratchathewi 0 1 1 10%
Supalai Elite Phayathai Condominium Supalai Ratchathewi 1 1 2 30%
The Victory Height Condominium Home Quick Ratchathewi 0 1 1 35%
Supalai Elite Surawongse Condominium Supalai Bangrak 0 0 0 0%
Nimit Langsuan Condominium Pace Development Pathumwan 0 0 0 0%
The Monument Condominium Sansiri Phayathai 0 1 1 25%
The Line Rachathewi Condominium JV between Sansiri and BTS Holding
Ratchathewi 0 1 1 10%
Wish Signature Midtown Siam Condominium Siamnuwat Ratchathewi 0 1 1 10%
Magnolias Rachadamri Boulevard
Condominium Magnolia Finest Corporation
Pathumwan 0 1 1 85%
Source: RHB

Construction Regional Sector Update
25 July 2016
See important disclosures at the end of this report 36
Figure 80: Projects under construction II
Project name Project type Project owner District Mobile crane
Tower crane
Total cranes
Construction progress
Saladaeng One Condominium SC Asset Bangrak 1 0 1 5%
Ideo Q Siam-Ratchathewi Condominium Ananda Development Ratchathewi 0 2 2 10%
Ideo Q Chula-Samyan Condominium Ananda Development Bangrak 0 1 1 98%
Ashton Chula-Silom Condominium Ananda Development Bangrak 0 0 0 0%
Q Chidlom Condominium Ananda Development Pathumwan 1 1 2 3%
Maestro 14 Condominium Major Development Ratchathewi 0 0 0 0%
Metro Luxe Condominium Property Perfect Phayathai 0 0 0 0%
Pearl Bangkok Office TCT (owned by Thongma Vijitphongpun)
Phayathai 0 3 3 65%
Car Parking building Car Parking building University of the Thai Chamber of Commerce
Dindaeng 0 1 1 25%
Metro Luxe Phahol-Suthisarn Condominium Property Perfect Phayathai 0 1 1 70%
New Medical Center Building Hospital Rajavithi Hospital Ratchathewi 0 2 2 75%
New Research Center Building Hospital Phramongkutklao Hospital
Ratchathewi 0 3 3 20%
Operation Center for Health Science Department
Multi-purpose Building Chulalongkorn University
Pathumwan 0 2 2 70%
Educational Center for Environment
Multi-purpose Building Chulalongkorn University
Pathumwan 0 1 1 10%
Smile Square Shopping Center +
Office + Retail + Condominium + Hotel
Asia Thaiyuan Construction & Development
Ratchathewi 0 2 2 20%
Thavorn Tractor Building Office Thavorn Tractor Engineering
Pathumwan 0 1 1 20%
Sync Nature @ Siam Condominium Saichol Patana Pathumwan 0 1 1 60%
Gaysorn Office Tower Office Gaysorn Property Pathumwan 0 2 2 35%
Budget Bureau (New building) Government Office Ministry of Finance Phayathai 1 1 2 15%
Thai Red Cross College of Nursing (New building)
Hospital Chulalongkorn Hospital
Pathumwan 4 0 4 3%
New Khlongtoei branch office State Agency Office Metropolitan Electricity Authority
Khlongtoei 2 0 2 5%
Sindhorn Midtown Condominium Siam Sindhorn Pathumwan 3 0 3 3%
Sindhorn Residence Condominium Siam Sindhorn Pathumwan 0 1 1 75%
Langsuan Village Mixed-use Siam Sindhorn Pathumwan 17 0 17 5%
Source: RHB
Indonesia Company Update
See important disclosures at the end of this report 37
Powered by the EFA Platform
25 July 2016 Construction & Engineering | Construction
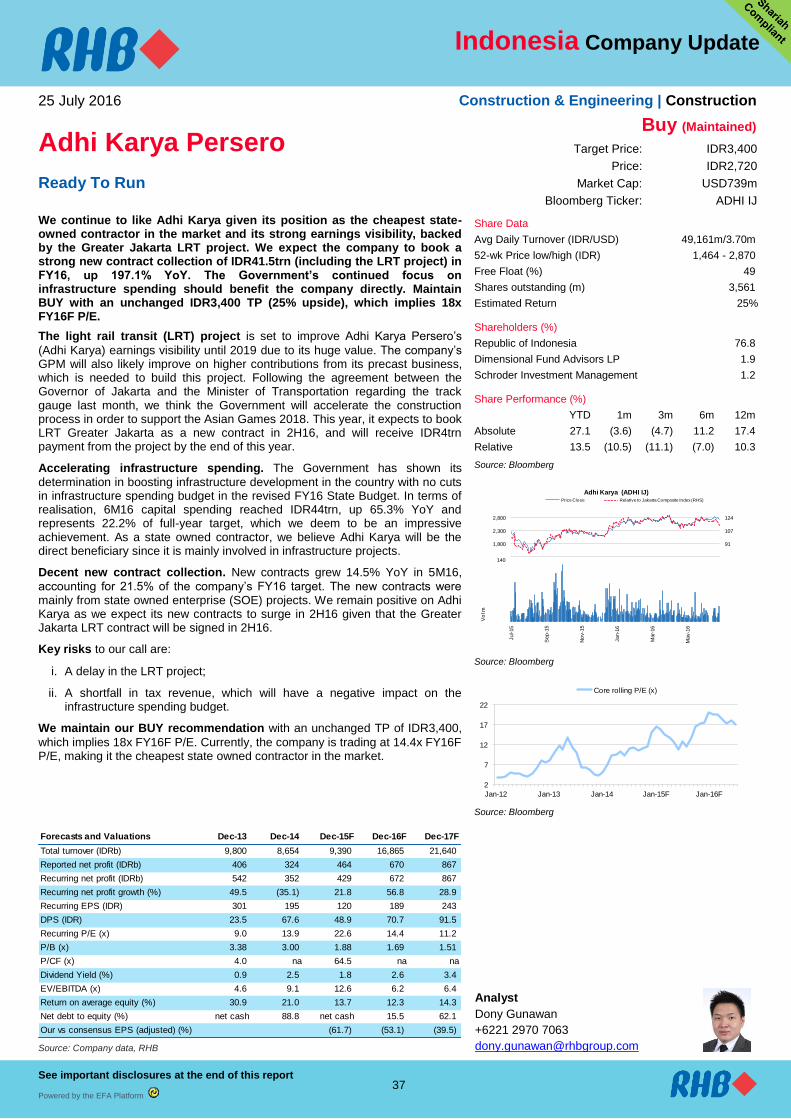
Adhi Karya Persero Buy (Maintained)
Target Price: IDR3,400
Price: IDR2,720
Ready To Run Market Cap: USD739m
Bloomberg Ticker: ADHI IJ We continue to like Adhi Karya given its position as the cheapest state-owned contractor in the market and its strong earnings visibility, backed by the Greater Jakarta LRT project. We expect the company to book a strong new contract collection of IDR41.5trn (including the LRT project) in FY16, up 197.1% YoY. The Government’s continued focus on infrastructure spending should benefit the company directly. Maintain BUY with an unchanged IDR3,400 TP (25% upside), which implies 18x FY16F P/E.
Share Data
Avg Daily Turnover (IDR/USD) 49,161m/3.70m
52-wk Price low/high (IDR) 1,464 - 2,870
Free Float (%) 49
Shares outstanding (m) 3,561
Estimated Return 25%
Shareholders (%)
Republic of Indonesia 76.8
Dimensional Fund Advisors LP 1.9
Schroder Investment Management 1.2
Share Performance (%)
YTD 1m 3m 6m 12m
Absolute 27.1 (3.6) (4.7) 11.2 17.4
Relative 13.5 (10.5) (11.1) (7.0) 10.3
Source: Bloomberg
74
91
107
124
1,300
1,800
2,300
2,800
Adhi Karya (ADHI IJ)Price Close Relative to Jakarta Composite Index (RHS)
20
40
60
80
100
120
140
Jul-15
Sep
-15
No
v-1
5
Jan-1
6
Mar-
16
May-1
6
Vo
l m
Source: Bloomberg
2
7
12
17
22
Jan-12 Jan-13 Jan-14 Jan-15F Jan-16F
Core rolling P/E (x)
Source: Bloomberg
The light rail transit (LRT) project is set to improve Adhi Karya Persero’s
(Adhi Karya) earnings visibility until 2019 due to its huge value. The company’s GPM will also likely improve on higher contributions from its precast business, which is needed to build this project. Following the agreement between the Governor of Jakarta and the Minister of Transportation regarding the track gauge last month, we think the Government will accelerate the construction process in order to support the Asian Games 2018. This year, it expects to book LRT Greater Jakarta as a new contract in 2H16, and will receive IDR4trn payment from the project by the end of this year.
Accelerating infrastructure spending. The Government has shown its
determination in boosting infrastructure development in the country with no cuts in infrastructure spending budget in the revised FY16 State Budget. In terms of realisation, 6M16 capital spending reached IDR44trn, up 65.3% YoY and represents 22.2% of full-year target, which we deem to be an impressive achievement. As a state owned contractor, we believe Adhi Karya will be the direct beneficiary since it is mainly involved in infrastructure projects.
Decent new contract collection. New contracts grew 14.5% YoY in 5M16,
accounting for 21.5% of the company’s FY16 target. The new contracts were mainly from state owned enterprise (SOE) projects. We remain positive on Adhi Karya as we expect its new contracts to surge in 2H16 given that the Greater Jakarta LRT contract will be signed in 2H16.
Key risks to our call are:
i. A delay in the LRT project;
ii. A shortfall in tax revenue, which will have a negative impact on the infrastructure spending budget.
We maintain our BUY recommendation with an unchanged TP of IDR3,400,
which implies 18x FY16F P/E. Currently, the company is trading at 14.4x FY16F P/E, making it the cheapest state owned contractor in the market.
Forecasts and Valuations Dec-13 Dec-14 Dec-15F Dec-16F Dec-17F
Total turnover (IDRb) 9,800 8,654 9,390 16,865 21,640
Reported net profit (IDRb) 406 324 464 670 867
Recurring net profit (IDRb) 542 352 429 672 867
Recurring net profit growth (%) 49.5 (35.1) 21.8 56.8 28.9
Recurring EPS (IDR) 301 195 120 189 243
DPS (IDR) 23.5 67.6 48.9 70.7 91.5
Recurring P/E (x) 9.0 13.9 22.6 14.4 11.2
P/B (x) 3.38 3.00 1.88 1.69 1.51
P/CF (x) 4.0 na 64.5 na na
Dividend Yield (%) 0.9 2.5 1.8 2.6 3.4
EV/EBITDA (x) 4.6 9.1 12.6 6.2 6.4
Return on average equity (%) 30.9 21.0 13.7 12.3 14.3
Net debt to equity (%) net cash 88.8 net cash 15.5 62.1
Our vs consensus EPS (adjusted) (%) (61.7) (53.1) (39.5)
Source: Company data, RHB
Analyst
Dony Gunawan
+6221 2970 7063

Adhi Karya Persero Indonesia Company Update
Construction & Engineering | Construction
38
Financial Exhibits
2016-02-28
Asia
Indonesia
Construction & Engineering
Adhi Karya Persero
Bloomberg ADHI IJ
Buy
Valuation basis
We value the company based on 18x FY16F P/E, (+1SD from its 4-year mean).
Key drivers
Our call is based on the following: i. The Greater Jakarta LRT project will boost Adhi
Karya’s earnings visibility given its significant value as well as increase the company’s GPM, coming from precast products;
ii. Adhi Karya is the cheapest contractor in the market with more than 30% discount to the sector.
Key risks
Key risks include: i. A delay in the LRT project; ii. Infrastructure spending cut.
Company Profile
Adhi Karya is Indonesia’s fourth largest state-owned enterprise (SOE) construction player by revenue and market capitalisation. The company engages in general construction, engineering, procurement & construction (EPC), as well as property development.
Financial summary Dec-13 Dec-14 Dec-15F Dec-16F Dec-17F
Recurring EPS (IDR) 301 195 120 189 243
EPS (IDR) 225 180 130 188 243
DPS (IDR) 23.5 67.6 48.9 70.7 91.5
BVPS (IDR) 805 907 1,447 1,605 1,807
Weighted avg adjusted shares (m) 1,801 1,801 3,561 3,561 3,561
Valuation metrics Dec-13 Dec-14 Dec-15F Dec-16F Dec-17F
Recurring P/E (x) 9.0 13.9 22.6 14.4 11.2
P/E (x) 12.1 15.1 20.9 14.4 11.2
P/B (x) 3.38 3.00 1.88 1.69 1.51
FCF Yield (%) 23.0 (30.9) (5.0) (10.3) (24.7)
Dividend Yield (%) 0.9 2.5 1.8 2.6 3.4
EV/EBITDA (x) 4.6 9.1 12.6 6.2 6.4
EV/EBIT (x) 4.6 8.9 13.5 6.8 7.0
Income statement (IDRb) Dec-13 Dec-14 Dec-15F Dec-16F Dec-17F
Total turnover 9,800 8,654 9,390 16,865 21,640
Gross profit 1,193 998 975 2,017 2,564
EBITDA 874 622 620 1,439 1,813
Depreciation and amortisation (10) 15 (41) (132) (160)
Operating profit 864 637 579 1,307 1,652
Net interest (75) (103) (86) (92) (94)
Income from associates & JVs 54 11 32 16 28
Pre-tax profit 714 595 746 1,227 1,587
Taxation (306) (268) (281) (552) (714)
Minority interests (2) (3) (1) (5) (6)
Recurring net profit 542 352 429 672 867
Cash flow (IDRb) Dec-13 Dec-14 Dec-15F Dec-16F Dec-17F
Change in working capital 162 (1,584) (258) (1,731) (3,291)
Cash flow from operations 1,220 (1,313) 150 (589) (2,065)
Capex (94) (201) (634) (405) (330)
Cash flow from investing activities (921) (426) (1,123) (1,468) (793)
Proceeds from issue of shares (87) (19) 0 0 0
Dividends paid (42) (122) (65) (93) (134)
Cash flow from financing activities 635 415 3,908 1,846 156
Balance sheet (IDRb) Dec-13 Dec-14 Dec-15F Dec-16F Dec-17F
Total cash and equivalents 1,940 811 4,317 4,170 1,340
Tangible fixed assets 271 496 1,099 1,402 1,609
Total investments 671 720 698 1,711 2,136
Total other assets 101 77 273 451 566
Total assets 9,721 10,459 16,761 24,479 27,521
Short-term debt 206 658 1,115 1,000 1,100
Other liabilities 222 166 181 387 347
Total liabilities 8,261 8,818 11,599 18,733 21,048
Shareholders' equity 1,451 1,634 5,154 5,717 6,435
Minority interests 9 7 8 15 19
Total equity 1,460 1,641 5,162 5,746 6,473
Net debt (231) 1,458 (1,199) 889 4,019
Total liabilities & equity 9,721 10,459 16,761 24,479 27,521
Key metrics Dec-13 Dec-14 Dec-15F Dec-16F Dec-17F
Revenue growth (%) 28.5 (11.7) 8.5 79.6 28.3
Recurrent EPS growth (%) 49.5 (35.1) (38.4) 56.8 28.9
Gross margin (%) 12.2 11.5 10.4 12.0 11.8
Operating EBITDA margin (%) 8.9 7.2 6.6 8.5 8.4
Net profit margin (%) 4.1 3.7 4.9 4.0 4.0
Dividend payout ratio (%) 10.4 37.6 37.6 37.6 37.6
Capex/sales (%) 1.0 2.3 6.8 2.4 1.5
Interest cover (x) 8.01 4.67 4.24 8.83 10.64
Source: Company data, RHB

Adhi Karya Persero Indonesia Company Update
Construction & Engineering | Construction
39
SWOT Analysis
One of the most experienced companies in the construction industry
As an SOE, it is easier for the company to obtain government projects
Delay in the LRT project
Late disbursement of infrastructure spending from the Government
Being the LRT’s operator could harm its cash flow
The Government plans to ramp up the infrastructure sector
The inevitable need for public transportation in Indonesia
Dependent on government projects
Recommendation Chart
84
584
1,084
1,584
2,084
2,584
3,084
3,584
Jul-11 Nov-12 Feb-14 May-15
Price Close
950
640
2,3
00
3,0
00
3,2
00
4,2
00
3,7
45
2,7
20
3,2
40
2,7
40
3,4
30
3,4
00
Recommendations & Target Price
Buy Neutral Sell Trading Buy Take Prof it Not Rated
Source: RHB, Bloomberg
Date Recommendation Target Price Price
2016-02-29 Buy 3,400 2,610
2016-02-15 Buy 3,430 2,730
2015-11-10 Buy 2,740 2,225
2014-12-17 Neutral 3,240 2,452
2014-11-18 Neutral 2,720 2,282
2014-11-04 Neutral 2,720 2,248
2014-09-03 Buy 3,745 2,647
2013-07-25 Buy 4,200 2,630
2013-05-20 Buy 3,200 2,736
2013-04-11 Buy 3,200 2,524
Source: RHB, Bloomberg

Malaysia Company Update
See important disclosures at the end of this report 40
Powered by the EFA Platform
25 July 2016 Construction & Engineering | Engineering & Construction
Gadang Holdings Buy (Maintained)
Target Price: MYR3.10
Price: MYR2.48
Awaiting a Re-Rating Catalyst Market Cap: USD159m
Bloomberg Ticker: GADG MK Gadang is awaiting a re-rating catalyst to boost its valuations. Nevertheless, we opine that the stock valuation remains undemanding, given its strong earnings visibility. It currently trades at about 4-6x forward P/Es for FY17-19, below our benchmark 1-year forward target P/E for small- and mid-cap construction stocks. Based on the firm’s track record, we believe it is likely to benefit from the rise in infrastructure spending locally. Maintain BUY with an unchanged SOP-derived TP of MYR3.10 (25% upside).
Share Data
Avg Daily Turnover (MYR/USD) 2.56m/0.52m
52-wk Price low/high (MYR) 1.16 - 2.54
Free Float (%) 56
Shares outstanding (m) 259
Estimated Return 25%
Shareholders (%)
Meloria SB 13.5
Sumber Raswira SB 12.6
Franklin Resources Inc. 5.1
Share Performance (%)
YTD 1m 3m 6m 12m
Absolute 17.0 18.7 15.9 10.7 72.2
Relative 19.1 17.5 19.4 8.7 76.4
Source: Bloomberg
77
110
144
177
1.0
1.5
2.0
2.5
Gadang Holdings (GADG MK)Price Close Relative to FTSE Bursa Malaysia KLCI Index (RHS)
2
4
6
8
10
12
14
16
Ju
l-1
5
Se
p-1
5
No
v-1
5
Ja
n-1
6
Ma
r-1
6
Ju
n-1
6
Vo
l m
Source: Bloomberg
3.3
4.3
5.3
6.3
7.3
8.3
9.3
Jan-14 Jan-15 Jan-16
Core rolling P/E (x)
Source: Bloomberg
Strong presence in the Refinery And Petrochemical Integrated Development (RAPID) project. Gadang has established itself as a niche
player in large-scale earthworks contracts, particularly in the RAPID project. In addition, it has progressed in tandem with RAPID, by securing two packages of infrastructure and civil works totalling ~MYR560m in FY16. As at May, its outstanding construction orderbook stood at ~MYR656.7m, which will be recognised progressively over the next two years.
Beyond RAPID. About 80% of Gadang’s outstanding orderbook is derived from
RAPID. The company has been actively tendering jobs beyond this project. As at mid-June, its tenderbook stood at ~MYR5.5bn, comprising mostly highway construction works. Gadang is considered one of those in the running for a viaduct job for the Mass Rapid Transit (MRT) Line 2 (MRT2) project, given that it is one of the main contractors for MRT Line 1 (MRT1) alignment. In the past, it was able to secure jobs worth MYR300-500m pa. As such, we consider our MYR300m pa orderbook replenishment rate assumption to be reasonably conservative.
Property segment remains cautiously positive. Despite the weak property
market conditions, we believe Gadang’s earnings visibility for its property division over the next 12-18 months remains intact. This is underpinned by its unbilled property sales of ~MYR233.7m as at May. Additionally, we view Gadang’s focus on the affordable housing segment as a positive due to this sector’s resilient demand.
Forecasts and risks. We maintain our earnings forecasts at this juncture. Key risks include:
i. An inability to replenish its construction orderbook; ii. A significant slowdown in local property sector; iii. A hike in input costs.
Maintain BUY. We derive a TP of MYR3.10 (25% upside) based on SOP
valuation. This implies 8.3x 2017F P/E, which is below our benchmark 1-year forward target P/E for small- and mid-cap construction stocks. We reiterate our BUY call on Gadang – our small-cap Top Pick for the construction sector, given its undemanding valuations and good earnings visibility.
Forecasts and Valuations May-15 May-16 May-17F May-18F May-19F
Total turnover (MYRm) 587 676 671 784 692
Reported net profit (MYRm) 60 94 96 96 113
Recurring net profit (MYRm) 60 94 96 96 113
Recurring net profit growth (%) 37.9 58.0 2.3 (0.3) 17.5
Recurring EPS (MYR) 0.29 0.40 0.37 0.37 0.58
DPS (MYR) 0.05 0.07 0.07 0.08 0.08
Recurring P/E (x) 8.59 6.25 6.65 6.67 4.26
P/B (x) 1.41 1.21 1.06 0.94 0.41
P/CF (x) 6.0 na 2.0 6.3 13.1
Dividend Yield (%) 2.0 2.8 2.8 3.0 3.2
EV/EBITDA (x) 4.19 3.36 1.98 1.52 (0.39)
Return on average equity (%) 17.5 20.7 17.0 14.9 15.4
Net debt to equity net cash net cash net cash net cash net cash
Our vs consensus EPS (adjusted) (%) 18.1 11.6 54.4
Source: Company data, RHB
Analyst
Ng Suk Yee
+603 9207 7604
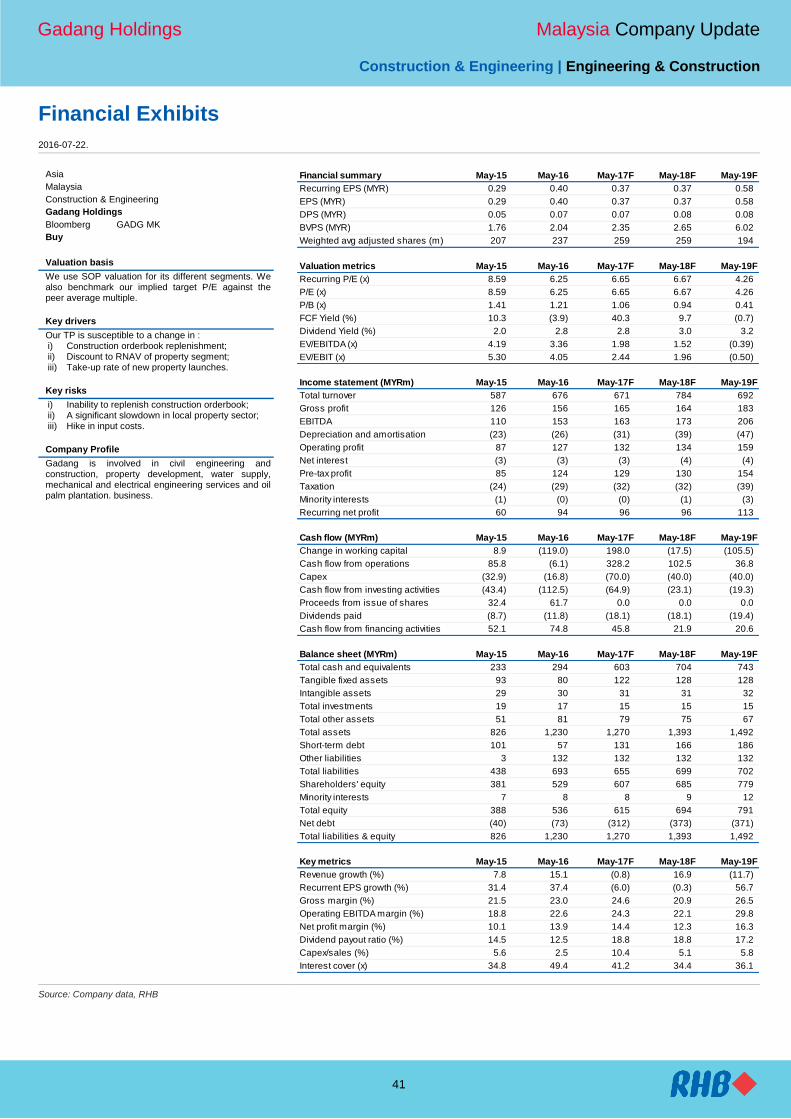
Gadang Holdings Malaysia Company Update
Construction & Engineering | Engineering & Construction
41
Financial Exhibits
2016-07-22.
Asia
Malaysia
Construction & Engineering
Gadang Holdings
Bloomberg GADG MK
Buy
Valuation basis
We use SOP valuation for its different segments. We also benchmark our implied target P/E against the peer average multiple.
Key drivers
Our TP is susceptible to a change in : i) Construction orderbook replenishment; ii) Discount to RNAV of property segment; iii) Take-up rate of new property launches.
Key risks
i) Inability to replenish construction orderbook; ii) A significant slowdown in local property sector; iii) Hike in input costs.
Company Profile
Gadang is involved in civil engineering and construction, property development, water supply, mechanical and electrical engineering services and oil palm plantation. business.
Financial summary May-15 May-16 May-17F May-18F May-19F
Recurring EPS (MYR) 0.29 0.40 0.37 0.37 0.58
EPS (MYR) 0.29 0.40 0.37 0.37 0.58
DPS (MYR) 0.05 0.07 0.07 0.08 0.08
BVPS (MYR) 1.76 2.04 2.35 2.65 6.02
Weighted avg adjusted shares (m) 207 237 259 259 194
Valuation metrics May-15 May-16 May-17F May-18F May-19F
Recurring P/E (x) 8.59 6.25 6.65 6.67 4.26
P/E (x) 8.59 6.25 6.65 6.67 4.26
P/B (x) 1.41 1.21 1.06 0.94 0.41
FCF Yield (%) 10.3 (3.9) 40.3 9.7 (0.7)
Dividend Yield (%) 2.0 2.8 2.8 3.0 3.2
EV/EBITDA (x) 4.19 3.36 1.98 1.52 (0.39)
EV/EBIT (x) 5.30 4.05 2.44 1.96 (0.50)
Income statement (MYRm) May-15 May-16 May-17F May-18F May-19F
Total turnover 587 676 671 784 692
Gross profit 126 156 165 164 183
EBITDA 110 153 163 173 206
Depreciation and amortisation (23) (26) (31) (39) (47)
Operating profit 87 127 132 134 159
Net interest (3) (3) (3) (4) (4)
Pre-tax profit 85 124 129 130 154
Taxation (24) (29) (32) (32) (39)
Minority interests (1) (0) (0) (1) (3)
Recurring net profit 60 94 96 96 113
Cash flow (MYRm) May-15 May-16 May-17F May-18F May-19F
Change in working capital 8.9 (119.0) 198.0 (17.5) (105.5)
Cash flow from operations 85.8 (6.1) 328.2 102.5 36.8
Capex (32.9) (16.8) (70.0) (40.0) (40.0)
Cash flow from investing activities (43.4) (112.5) (64.9) (23.1) (19.3)
Proceeds from issue of shares 32.4 61.7 0.0 0.0 0.0
Dividends paid (8.7) (11.8) (18.1) (18.1) (19.4)
Cash flow from financing activities 52.1 74.8 45.8 21.9 20.6
Balance sheet (MYRm) May-15 May-16 May-17F May-18F May-19F
Total cash and equivalents 233 294 603 704 743
Tangible fixed assets 93 80 122 128 128
Intangible assets 29 30 31 31 32
Total investments 19 17 15 15 15
Total other assets 51 81 79 75 67
Total assets 826 1,230 1,270 1,393 1,492
Short-term debt 101 57 131 166 186
Other liabilities 3 132 132 132 132
Total liabilities 438 693 655 699 702
Shareholders' equity 381 529 607 685 779
Minority interests 7 8 8 9 12
Total equity 388 536 615 694 791
Net debt (40) (73) (312) (373) (371)
Total liabilities & equity 826 1,230 1,270 1,393 1,492
Key metrics May-15 May-16 May-17F May-18F May-19F
Revenue growth (%) 7.8 15.1 (0.8) 16.9 (11.7)
Recurrent EPS growth (%) 31.4 37.4 (6.0) (0.3) 56.7
Gross margin (%) 21.5 23.0 24.6 20.9 26.5
Operating EBITDA margin (%) 18.8 22.6 24.3 22.1 29.8
Net profit margin (%) 10.1 13.9 14.4 12.3 16.3
Dividend payout ratio (%) 14.5 12.5 18.8 18.8 17.2
Capex/sales (%) 5.6 2.5 10.4 5.1 5.8
Interest cover (x) 34.8 49.4 41.2 34.4 36.1
Source: Company data, RHB

Gadang Holdings Malaysia Company Update
Construction & Engineering | Engineering & Construction
42
SWOT Analysis
Strong presence in the construction sector’s niche large-scale earthworks segment
Lack of scale while competing with other larger-scale construction players in mega infrastructure projects
Potential beneficiary of selected infrastructure projects slated for implementation under the 11
th
Malaysia Plan (11MP)
Ventures into the renewable energy sector via greenfield mini hydropower plant projects in Indonesia
Highly dependent on public infrastructure spending and private development projects
Recommendation Chart
0.3
0.8
1.3
1.8
2.3
2.8
Jul-11 Nov-12 Feb-14 May-15
Price Close
na
2.7
3
2.8
3
2.8
5
3.1
0 Recommendations & Target Price
Buy Neutral Sell Trading Buy Take Profit Not Rated
Source: RHB, Bloomberg
Date Recommendation Target Price Price
2016-04-29 Buy 2.85 2.08
2016-01-22 Buy 2.83 2.24
2015-12-16 Buy 2.73 2.16
Source: RHB, Bloomberg

Thailand Company Update
See important disclosures at the end of this report 43
Powered by the EFA Platform
25 July 2016 Construction & Engineering | Construction
Sino-Thai Engineering & Construction PCL
Buy (Maintained) Target Price: THB29.00
Price: THB25.00
Solid In Both Public And Private Projects Market Cap: USD1,089m
Bloomberg Ticker: STEC TB We maintain our BUY rating on Sino-Thai Engineering & Construction (Sino-Thai) with an unchanged TP of THB29.00 (16% upside), given: 1. The three new MRT projects that will be tendered within 4Q16 bode
well for Sino-Thai’s construction business in high-rise building; 2. An opportunity for Sino-Thai to invest in public–private
partnership (PPP) in MRT projects.
Share Data
Avg Daily Turnover (THB/USD) 167m/4.71m
52-wk Price low/high (THB) 17.5 - 26.3
Free Float (%) 71
Shares outstanding (m) 1,525
Estimated Return 16%
Shareholders (%)
Thai NVDR 11.3
Mr Seranee Chanwirakul 7.7
Ms Naiphak Chanwirakul 7.7
Share Performance (%)
YTD 1m 3m 6m 12m
Absolute 0.0 11.6 9.2 14.7 8.2
Relative (16.7) 6.1 2.7 (3.8) 4.4
Source: Bloomberg
79
87
94
102
109
117
124
16
18
20
22
24
26
28
Sino Thai Engineering & Construction Plc (STEC TB)Price Close Relative to Stock Exchange of Thailand Index (RHS)
10
20
30
40
50
60
70
Ju
l-1
5
Se
p-1
5
No
v-1
5
Ja
n-1
6
Ma
r-1
6
Ju
n-1
6
Vo
l m
Source: Bloomberg
10
15
20
25
30
35
Jan-13 Jan-14 Jan-15 Jan-16F
Core rolling P/E (x)
Source: Bloomberg
Exposure to high-rise construction. Sino-Thai is a pure play in the
construction business with some exposure to the construction of high-rise buildings. We found a high-rise public project – the new Budget Bureau office constructed by Sino-Thai within our surveyed area. The company has gained a long-time outstanding reputation in both private and public sectors in the construction of high-rise buildings. This has benefitted the company especially when the Government’s new infrastructure projects are delayed. Apart from the new Budget Bureau office, Sino-Thai is also constructing other high-rise buildings outside our surveyed area such as the new Parliament building on the Chao Phraya river bank, Supreme Court near the Grand Palace in Bangkok, and the head office of CAT Telecom. Note that Sino-Thai’s construction work of high-rise buildings represents 25% of its total current orderbook.
Benefitting from new mass rapid transit (MRT) routes. The recent clear-cut
bidding time frame for the three MRT routes (Pink, Yellow and Orange) should be a positive for new public and private projects located outside Bangkok’s central business district (CBD). In addition to Sino-Thai’s direct bidding in these three MRT projects, the company will likely secure construction projects for the expansion of government authorities’ offices in Bangkok’s outskirts as well as new hospital branches to meet the needs of the growing ageing population, given its extensive experience in these specific areas. We expect its orderbook to grow 24% YoY by year-end.
Earnings growth to resume. We maintain our forecast for FY16 core profit to
surge 31% YoY to THB1.51bn, given that: i. Revenue momentum will likely improve from 2H16 onwards based on new
projects awarded late last year such as the double-track railway project and additional works in small power plants (SPPs);
ii. GPMs should return to a higher level of 9.7% in FY16 vs 9.4% in FY15.
Maintain BUY. Sino-Thai is Thailand’s largest pure-play construction company
that stands to benefit from the upcoming infrastructure bidding as well as the expansion of the private sector. Key strengths include:
i. Its strong cash position which should help the company secure new orders;
ii. Potential earnings growth supported by infrastructure projects in the bidding pipeline.
Our TP is based on 29x FY16F P/E, which is +1.5SD above its 8-year mean.
Forecasts and Valuations Dec-14 Dec-15 Dec-16F Dec-17F Dec-18F
Total turnover (THBm) 21,652 18,331 21,875 24,542 27,854
Reported net profit (THBm) 1,521 1,527 1,511 1,596 1,705
Recurring net profit (THBm) 1,521 1,156 1,511 1,596 1,705
Recurring net profit growth (%) 1.4 (24.0) 30.7 5.6 6.8
Recurring EPS (THB) 1.00 0.76 0.99 1.05 1.12
DPS (THB) 0.40 0.40 0.40 0.42 0.45
Recurring P/E (x) 25.1 33.0 25.2 23.9 22.4
P/B (x) 4.55 4.10 3.74 3.41 3.11
P/CF (x) na na 16.8 18.9 20.8
Dividend Yield (%) 1.6 1.6 1.6 1.7 1.8
EV/EBITDA (x) 14.5 18.4 14.6 13.5 12.0
Return on average equity (%) 19.0 17.3 15.5 14.9 14.6
Net debt to equity net cash net cash net cash net cash net cash
Our vs consensus EPS (adjusted) (%) 20.2 8.7 (6.8)
Source: Company data, RHB
Analyst
Chatree Srismaicharoen
+66 2862 9743

Sino-Thai Engineering & Construction PCL Thailand Company Update
Construction & Engineering | Construction
44
Financial Exhibits
2016-07-05.
Asia
Thailand
Construction & Engineering
Sino-Thai Engineering & Construction PCL
Bloomberg STEC TB
Buy
Valuation basis
P/E compared to the company's historical average
Key drivers
i. Upcoming infrastructure bidding in Thailand; ii. Opportunity to upgrade its track records to be
on par with that of the two largest players .
Key risks
i. An increase in major construction material prices;
ii. Shortage of unskilled workers; iii. Delay in the bidding of new project.
Company Profile
Sino-Thai Engineering & Construction (Sino-Thai) is one of the leading engineers and contractors in the country, with over 40 years of experience in private and public projects. Its competitive advantage lies in its extensive experience in the construction of power and petrochemical plants.
Financial summary Dec-14 Dec-15 Dec-16F Dec-17F Dec-18F
Recurring EPS (THB) 1.00 0.76 0.99 1.05 1.12
EPS (THB) 1.00 1.00 0.99 1.05 1.12
DPS (THB) 0.40 0.40 0.40 0.42 0.45
BVPS (THB) 5.49 6.09 6.68 7.33 8.03
Weighted avg adjusted shares (m) 1,525 1,525 1,525 1,525 1,525
Valuation metrics Dec-14 Dec-15 Dec-16F Dec-17F Dec-18F
Recurring P/E (x) 25.1 33.0 25.2 23.9 22.4
P/E (x) 25.1 25.0 25.2 23.9 22.4
P/B (x) 4.55 4.10 3.74 3.41 3.11
FCF Yield (%) (6.9) (9.2) 3.9 3.1 1.5
Dividend Yield (%) 1.6 1.6 1.6 1.7 1.8
EV/EBITDA (x) 14.5 18.4 14.6 13.5 12.0
EV/EBIT (x) 18.2 25.5 19.3 17.8 15.7
Income statement (THBm) Dec-14 Dec-15 Dec-16F Dec-17F Dec-18F
Total turnover 21,652 18,331 21,875 24,542 27,854
Gross profit 2,217 1,731 2,112 2,263 2,542
EBITDA 2,061 1,777 2,181 2,313 2,573
Depreciation and amortisation (427) (494) (534) (561) (602)
Operating profit 1,634 1,283 1,647 1,752 1,971
Net interest 220 59 102 103 67
Income from associates & JVs 11 17 18 25 30
Pre-tax profit 1,919 1,866 1,872 2,001 2,168
Taxation (389) (321) (357) (395) (452)
Minority interests (10) (18) (4) (9) (12)
Recurring net profit 1,521 1,156 1,511 1,596 1,705
Cash flow (THBm) Dec-14 Dec-15 Dec-16F Dec-17F Dec-18F
Change in working capital (2,546) (3,781) 5 (254) (519)
Cash flow from operations (940) (2,363) 2,264 2,022 1,834
Capex (1,676) (1,151) (793) (853) (1,270)
Cash flow from investing activities 1,625 1,980 (1,382) (1,149) (1,326)
Dividends paid (763) (610) (610) (610) (641)
Cash flow from financing activities (892) (712) (432) (572) (593)
Balance sheet (THBm) Dec-14 Dec-15 Dec-16F Dec-17F Dec-18F
Total cash and equivalents 5,565 2,065 3,049 3,630 3,585
Tangible fixed assets 3,166 3,197 3,409 3,603 4,000
Total investments 3,216 3,854 3,949 4,063 4,347
Total other assets 60 39 21 25 30
Total assets 25,004 22,661 26,919 29,197 31,937
Short-term debt 160 152 187 200 223
Other liabilities 146 161 213 239 249
Total liabilities 16,454 13,153 16,514 17,802 19,467
Shareholders' equity 8,377 9,293 10,194 11,181 12,245
Minority interests 198 216 221 230 242
Total equity 8,549 9,508 10,404 11,395 12,470
Net debt (5,304) (1,831) (2,637) (3,179) (3,087)
Total liabilities & equity 25,004 22,661 26,919 29,197 31,937
Key metrics Dec-14 Dec-15 Dec-16F Dec-17F Dec-18F
Revenue growth (%) (2.9) (15.3) 19.3 12.2 13.5
Recurrent EPS growth (%) (9.9) (24.0) 30.7 5.6 6.8
Gross margin (%) 10.2 9.4 9.7 9.2 9.1
Operating EBITDA margin (%) 9.5 9.7 10.0 9.4 9.2
Net profit margin (%) 7.0 8.3 6.9 6.5 6.1
Dividend payout ratio (%) 50.2 40.0 40.4 38.2 37.6
Capex/sales (%) 7.7 6.3 3.6 3.5 4.6
Interest cover (x) 89.6 95.3 106.3 62.2 60.6
Source: Company data, RHB

Sino-Thai Engineering & Construction PCL Thailand Company Update
Construction & Engineering | Construction
45
SWOT Analysis
One of the three largest construction companies in Thailand with expertise in building the MRT system, power plants and steel structures
Strong financial position, with net cash since 2Q09
Competition from overseas companies that have new technology know-how, especially for construction jobs
Cost overruns due to fluctuations in construction material prices
Upcoming infrastructure projects to be launched by the Government
Entering into new businesses such as real estate
Low diversification of income sources
Recommendation Chart
4
9
14
19
24
29
34
Jul-11 Nov-12 Feb-14 May-15
Price Close
na
16.5
27.3
36.6
30.8
33.0
32.0
20.0
24.5
27.5
31.5
25.5
25.5
25.5
29.0
Recommendations & Target Price
Buy Neutral Sell Trading Buy Take Profit Not Rated
Source: RHB, Bloomberg
Date Recommendation Target Price Price
2016-05-17 Buy 29.0 21.7
2016-02-22 Buy 29.0 19.6
2015-11-12 Buy 29.0 24.9
2015-08-26 Buy 29.0 24.8
2015-08-11 Buy 25.5 22.2
2015-07-21 Neutral 25.5 22.9
2015-06-05 Buy 25.5 22.9
2015-05-15 Buy 31.5 20.1
2015-02-16 Buy 31.5 25.5
2014-09-11 Buy 31.5 25.8
Source: RHB, Bloomberg
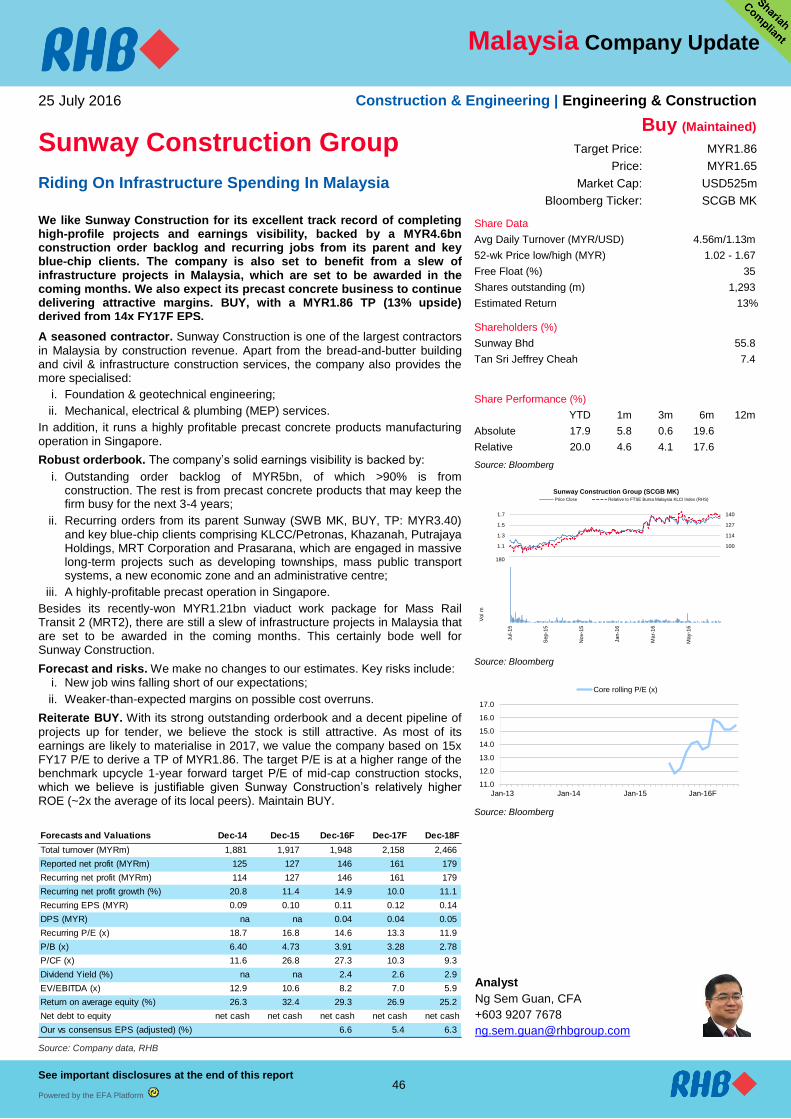
Malaysia Company Update
See important disclosures at the end of this report 46
Powered by the EFA Platform
25 July 2016 Construction & Engineering | Engineering & Construction
Sunway Construction Group Buy (Maintained)
Target Price: MYR1.86
Price: MYR1.65
Riding On Infrastructure Spending In Malaysia Market Cap: USD525m
Bloomberg Ticker: SCGB MK We like Sunway Construction for its excellent track record of completing high-profile projects and earnings visibility, backed by a MYR4.6bn construction order backlog and recurring jobs from its parent and key blue-chip clients. The company is also set to benefit from a slew of infrastructure projects in Malaysia, which are set to be awarded in the coming months. We also expect its precast concrete business to continue delivering attractive margins. BUY, with a MYR1.86 TP (13% upside) derived from 14x FY17F EPS.
Share Data
Avg Daily Turnover (MYR/USD) 4.56m/1.13m
52-wk Price low/high (MYR) 1.02 - 1.67
Free Float (%) 35
Shares outstanding (m) 1,293
Estimated Return 13%
Shareholders (%)
Sunway Bhd 55.8
Tan Sri Jeffrey Cheah 7.4
Share Performance (%)
YTD 1m 3m 6m 12m
Absolute 17.9 5.8 0.6 19.6
Relative 20.0 4.6 4.1 17.6
Source: Bloomberg
87
100
114
127
140
0.9
1.1
1.3
1.5
1.7
Sunway Construction Group (SCGB MK)Price Close Relative to FTSE Bursa Malaysia KLCI Index (RHS)
20
40
60
80
100
120
140
160
180
Ju
l-1
5
Se
p-1
5
No
v-1
5
Ja
n-1
6
Ma
r-1
6
Ma
y-1
6
Vo
l m
Source: Bloomberg
11.0
12.0
13.0
14.0
15.0
16.0
17.0
Jan-13 Jan-14 Jan-15 Jan-16F
Core rolling P/E (x)
Source: Bloomberg
A seasoned contractor. Sunway Construction is one of the largest contractors
in Malaysia by construction revenue. Apart from the bread-and-butter building and civil & infrastructure construction services, the company also provides the more specialised:
i. Foundation & geotechnical engineering;
ii. Mechanical, electrical & plumbing (MEP) services.
In addition, it runs a highly profitable precast concrete products manufacturing operation in Singapore.
Robust orderbook. The company’s solid earnings visibility is backed by:
i. Outstanding order backlog of MYR5bn, of which >90% is from construction. The rest is from precast concrete products that may keep the firm busy for the next 3-4 years;
ii. Recurring orders from its parent Sunway (SWB MK, BUY, TP: MYR3.40) and key blue-chip clients comprising KLCC/Petronas, Khazanah, Putrajaya Holdings, MRT Corporation and Prasarana, which are engaged in massive long-term projects such as developing townships, mass public transport systems, a new economic zone and an administrative centre;
iii. A highly-profitable precast operation in Singapore.
Besides its recently-won MYR1.21bn viaduct work package for Mass Rail Transit 2 (MRT2), there are still a slew of infrastructure projects in Malaysia that are set to be awarded in the coming months. This certainly bode well for Sunway Construction.
Forecast and risks. We make no changes to our estimates. Key risks include: i. New job wins falling short of our expectations;
ii. Weaker-than-expected margins on possible cost overruns.
Reiterate BUY. With its strong outstanding orderbook and a decent pipeline of
projects up for tender, we believe the stock is still attractive. As most of its earnings are likely to materialise in 2017, we value the company based on 15x FY17 P/E to derive a TP of MYR1.86. The target P/E is at a higher range of the benchmark upcycle 1-year forward target P/E of mid-cap construction stocks, which we believe is justifiable given Sunway Construction’s relatively higher ROE (~2x the average of its local peers). Maintain BUY.
Forecasts and Valuations Dec-14 Dec-15 Dec-16F Dec-17F Dec-18F
Total turnover (MYRm) 1,881 1,917 1,948 2,158 2,466
Reported net profit (MYRm) 125 127 146 161 179
Recurring net profit (MYRm) 114 127 146 161 179
Recurring net profit growth (%) 20.8 11.4 14.9 10.0 11.1
Recurring EPS (MYR) 0.09 0.10 0.11 0.12 0.14
DPS (MYR) na na 0.04 0.04 0.05
Recurring P/E (x) 18.7 16.8 14.6 13.3 11.9
P/B (x) 6.40 4.73 3.91 3.28 2.78
P/CF (x) 11.6 26.8 27.3 10.3 9.3
Dividend Yield (%) na na 2.4 2.6 2.9
EV/EBITDA (x) 12.9 10.6 8.2 7.0 5.9
Return on average equity (%) 26.3 32.4 29.3 26.9 25.2
Net debt to equity net cash net cash net cash net cash net cash
Our vs consensus EPS (adjusted) (%) 6.6 5.4 6.3
Source: Company data, RHB
Analyst
Ng Sem Guan, CFA
+603 9207 7678
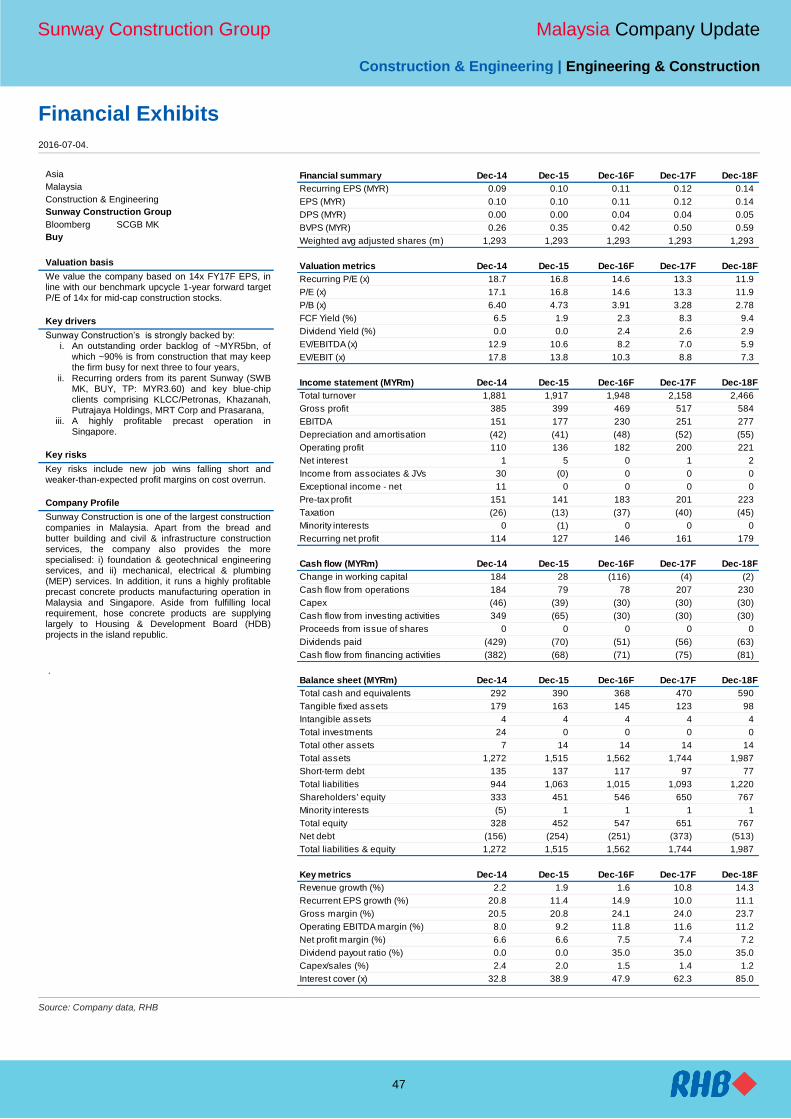
Sunway Construction Group Malaysia Company Update
Construction & Engineering | Engineering & Construction
47
Financial Exhibits
2016-07-04.
Asia
Malaysia
Construction & Engineering
Sunway Construction Group
Bloomberg SCGB MK
Buy
Valuation basis
We value the company based on 14x FY17F EPS, in line with our benchmark upcycle 1-year forward target P/E of 14x for mid-cap construction stocks.
Key drivers
Sunway Construction’s is strongly backed by: i. An outstanding order backlog of ~MYR5bn, of
which ~90% is from construction that may keep the firm busy for next three to four years,
ii. Recurring orders from its parent Sunway (SWB MK, BUY, TP: MYR3.60) and key blue-chip clients comprising KLCC/Petronas, Khazanah, Putrajaya Holdings, MRT Corp and Prasarana,
iii. A highly profitable precast operation in Singapore.
Key risks
Key risks include new job wins falling short and weaker-than-expected profit margins on cost overrun.
Company Profile
Sunway Construction is one of the largest construction companies in Malaysia. Apart from the bread and butter building and civil & infrastructure construction services, the company also provides the more specialised: i) foundation & geotechnical engineering services, and ii) mechanical, electrical & plumbing (MEP) services. In addition, it runs a highly profitable precast concrete products manufacturing operation in Malaysia and Singapore. Aside from fulfilling local requirement, hose concrete products are supplying largely to Housing & Development Board (HDB) projects in the island republic.
.
Financial summary Dec-14 Dec-15 Dec-16F Dec-17F Dec-18F
Recurring EPS (MYR) 0.09 0.10 0.11 0.12 0.14
EPS (MYR) 0.10 0.10 0.11 0.12 0.14
DPS (MYR) 0.00 0.00 0.04 0.04 0.05
BVPS (MYR) 0.26 0.35 0.42 0.50 0.59
Weighted avg adjusted shares (m) 1,293 1,293 1,293 1,293 1,293
Valuation metrics Dec-14 Dec-15 Dec-16F Dec-17F Dec-18F
Recurring P/E (x) 18.7 16.8 14.6 13.3 11.9
P/E (x) 17.1 16.8 14.6 13.3 11.9
P/B (x) 6.40 4.73 3.91 3.28 2.78
FCF Yield (%) 6.5 1.9 2.3 8.3 9.4
Dividend Yield (%) 0.0 0.0 2.4 2.6 2.9
EV/EBITDA (x) 12.9 10.6 8.2 7.0 5.9
EV/EBIT (x) 17.8 13.8 10.3 8.8 7.3
Income statement (MYRm) Dec-14 Dec-15 Dec-16F Dec-17F Dec-18F
Total turnover 1,881 1,917 1,948 2,158 2,466
Gross profit 385 399 469 517 584
EBITDA 151 177 230 251 277
Depreciation and amortisation (42) (41) (48) (52) (55)
Operating profit 110 136 182 200 221
Net interest 1 5 0 1 2
Income from associates & JVs 30 (0) 0 0 0
Exceptional income - net 11 0 0 0 0
Pre-tax profit 151 141 183 201 223
Taxation (26) (13) (37) (40) (45)
Minority interests 0 (1) 0 0 0
Recurring net profit 114 127 146 161 179
Cash flow (MYRm) Dec-14 Dec-15 Dec-16F Dec-17F Dec-18F
Change in working capital 184 28 (116) (4) (2)
Cash flow from operations 184 79 78 207 230
Capex (46) (39) (30) (30) (30)
Cash flow from investing activities 349 (65) (30) (30) (30)
Proceeds from issue of shares 0 0 0 0 0
Dividends paid (429) (70) (51) (56) (63)
Cash flow from financing activities (382) (68) (71) (75) (81)
Balance sheet (MYRm) Dec-14 Dec-15 Dec-16F Dec-17F Dec-18F
Total cash and equivalents 292 390 368 470 590
Tangible fixed assets 179 163 145 123 98
Intangible assets 4 4 4 4 4
Total investments 24 0 0 0 0
Total other assets 7 14 14 14 14
Total assets 1,272 1,515 1,562 1,744 1,987
Short-term debt 135 137 117 97 77
Total liabilities 944 1,063 1,015 1,093 1,220
Shareholders' equity 333 451 546 650 767
Minority interests (5) 1 1 1 1
Total equity 328 452 547 651 767
Net debt (156) (254) (251) (373) (513)
Total liabilities & equity 1,272 1,515 1,562 1,744 1,987
Key metrics Dec-14 Dec-15 Dec-16F Dec-17F Dec-18F
Revenue growth (%) 2.2 1.9 1.6 10.8 14.3
Recurrent EPS growth (%) 20.8 11.4 14.9 10.0 11.1
Gross margin (%) 20.5 20.8 24.1 24.0 23.7
Operating EBITDA margin (%) 8.0 9.2 11.8 11.6 11.2
Net profit margin (%) 6.6 6.6 7.5 7.4 7.2
Dividend payout ratio (%) 0.0 0.0 35.0 35.0 35.0
Capex/sales (%) 2.4 2.0 1.5 1.4 1.2
Interest cover (x) 32.8 38.9 47.9 62.3 85.0
Source: Company data, RHB

Sunway Construction Group Malaysia Company Update
Construction & Engineering | Engineering & Construction
48
SWOT Analysis
A wide range of capabilities - building construction, civil & infrastructure, foundation & geotechnical engineering, and mechanical, electrical & plumbing
A strong external client base comprising Putrajaya Holdings, KLCC Group, Prasarana, MRT Corp and Khazanah
Intense competition in general contracting services
Volatility in construction material costs
Well-positioned to capitalise on spending on MRT developments in Malaysia
Recurring construction jobs from parent
Reliance on construction jobs in Malaysia
Vulnerable to a prolonged slowdown in the local property market
Substantial head office costs
Recommendation Chart
1.0
1.1
1.2
1.3
1.4
1.5
1.6
1.7
1.8
Jul-15 Nov-15 Feb-16 May-16
Price Close
na
1.4
0
1.5
3
1.5
8
1.8
6 Recommendations & Target Price
Buy Neutral Sell Trading Buy Take Profit Not Rated
Source: RHB, Bloomberg
Date Recommendation Target Price Price
2016-03-29 Buy 1.86 1.67
2016-02-26 Buy 1.58 1.40
2015-11-25 Buy 1.53 1.37
2015-09-17 Buy 1.40 1.16
Source: RHB, Bloomberg

Construction Regional Sector Update
49
RHB Guide to Investment Ratings Buy: Share price may exceed 10% over the next 12 months Trading Buy: Share price may exceed 15% over the next 3 months, however longer-term outlook remains uncertain Neutral: Share price may fall within the range of +/- 10% over the next 12 months Take Profit: Target price has been attained. Look to accumulate at lower levels Sell: Share price may fall by more than 10% over the next 12 months Not Rated: Stock is not within regular research coverage
Investment Research Disclaimers
RHB has issued this report for information purposes only. This report is intended for circulation amongst RHB and its affiliates’ clients generally or such
persons as may be deemed eligible by RHB to receive this report and does not have regard to the specific investment objectives, financial situation and
the particular needs of any specific person who may receive this report. This report is not intended, and should not under any circumstances be construed
as, an offer or a solicitation of an offer to buy or sell the securities referred to herein or any related financial instruments.
This report may further consist of, whether in whole or in part, summaries, research, compilations, extracts or analysis that has been prepared by RHB’s
strategic, joint venture and/or business partners. No representation or warranty (express or implied) is given as to the accuracy or completeness of such
information and accordingly investors should make their own informed decisions before relying on the same.
This report is not directed to, or intended for distribution to or use by, any person or entity who is a citizen or resident of or located in any locality, state,
country or other jurisdiction where such distribution, publication, availability or use would be contrary to the applicable laws or regulations. By accepting
this report, the recipient hereof (i) represents and warrants that it is lawfully able to receive this document under the laws and regulations of the jurisdiction
in which it is located or other applicable laws and (ii) acknowledges and agrees to be bound by the limitations contained herein. Any failure to comply with
these limitations may constitute a violation of applicable laws.
All the information contained herein is based upon publicly available information and has been obtained from sources that RHB believes to be reliable and
correct at the time of issue of this report. However, such sources have not been independently verified by RHB and/or its affiliates and this report does not
purport to contain all information that a prospective investor may require. The opinions expressed herein are RHB’s present opinions only and are subject
to change without prior notice. RHB is not under any obligation to update or keep current the information and opinions expressed herein or to provide the
recipient with access to any additional information. Consequently, RHB does not guarantee, represent or warrant, expressly or impliedly, as to the
adequacy, accuracy, reliability, fairness or completeness of the information and opinion contained in this report. Neither RHB (including its officers,
directors, associates, connected parties, and/or employees) nor does any of its agents accept any liability for any direct, indirect or consequential losses,
loss of profits and/or damages that may arise from the use or reliance of this research report and/or further communications given in relation to this report.
Any such responsibility or liability is hereby expressly disclaimed.
Whilst every effort is made to ensure that statement of facts made in this report are accurate, all estimates, projections, forecasts, expressions of opinion
and other subjective judgments contained in this report are based on assumptions considered to be reasonable and must not be construed as a
representation that the matters referred to therein will occur. Different assumptions by RHB or any other source may yield substantially different results
and recommendations contained on one type of research product may differ from recommendations contained in other types of research. The
performance of currencies may affect the value of, or income from, the securities or any other financial instruments referenced in this report. Holders of
depositary receipts backed by the securities discussed in this report assume currency risk. Past performance is not a guide to future performance. Income
from investments may fluctuate. The price or value of the investments to which this report relates, either directly or indirectly, may fall or rise against the
interest of investors.
This report does not purport to be comprehensive or to contain all the information that a prospective investor may need in order to make an investment
decision. The recipient of this report is making its own independent assessment and decisions regarding any securities or financial instruments referenced
herein. Any investment discussed or recommended in this report may be unsuitable for an investor depending on the investor’s specific investment
objectives and financial position. The material in this report is general information intended for recipients who understand the risks of investing in financial
instruments. This report does not take into account whether an investment or course of action and any associated risks are suitable for the recipient. Any
recommendations contained in this report must therefore not be relied upon as investment advice based on the recipient's personal circumstances.
Investors should make their own independent evaluation of the information contained herein, consider their own investment objective, financial situation
and particular needs and seek their own financial, business, legal, tax and other advice regarding the appropriateness of investing in any securities or the
investment strategies discussed or recommended in this report.
This report may contain forward-looking statements which are often but not always identified by the use of words such as “believe”, “estimate”, “intend”
and “expect” and statements that an event or result “may”, “will” or “might” occur or be achieved and other similar expressions. Such forward-looking
statements are based on assumptions made and information currently available to RHB and are subject to known and unknown risks, uncertainties and
other factors which may cause the actual results, performance or achievement to be materially different from any future results, performance or
achievement, expressed or implied by such forward-looking statements. Caution should be taken with respect to such statements and recipients of this

Construction Regional Sector Update
50
report should not place undue reliance on any such forward-looking statements. RHB expressly disclaims any obligation to update or revise any forward-
looking statements, whether as a result of new information, future events or circumstances after the date of this publication or to reflect the occurrence of
unanticipated events.
The use of any website to access this report electronically is done at the recipient’s own risk, and it is the recipient’s sole responsibility to take precautions
to ensure that it is free from viruses or other items of a destructive nature. This report may also provide the addresses of, or contain hyperlinks to,
websites. RHB takes no responsibility for the content contained therein. Such addresses or hyperlinks (including addresses or hyperlinks to RHB own
website material) are provided solely for the recipient’s convenience. The information and the content of the linked site do not in any way form part of this
report. Accessing such website or following such link through the report or RHB website shall be at the recipient’s own risk.
This report may contain information obtained from third parties. Third party content providers do not guarantee the accuracy, completeness, timeliness or
availability of any information and are not responsible for any errors or omissions (negligent or otherwise), regardless of the cause, or for the results
obtained from the use of such content. Third party content providers give no express or implied warranties, including, but not limited to, any warranties of
merchantability or fitness for a particular purpose or use. Third party content providers shall not be liable for any direct, indirect, incidental, exemplary,
compensatory, punitive, special or consequential damages, costs, expenses, legal fees, or losses (including lost income or profits and opportunity costs) in
connection with any use of their content.
The research analysts responsible for the production of this report hereby certifies that the views expressed herein accurately and exclusively reflect his or
her personal views and opinions about any and all of the issuers or securities analysed in this report and were prepared independently and autonomously.
The research analysts that authored this report are precluded by RHB in all circumstances from trading in the securities or other financial instruments
referenced in the report, or from having an interest in the company(ies) that they cover.
RHB and/or its affiliates and/or their directors, officers, associates, connected parties and/or employees, may have, or have had, interests in the securities
or qualified holdings, in subject company(ies) mentioned in this report or any securities related thereto and may from time to time add to or dispose of, or
may be materially interested in, any such securities. Further, RHB and/or its affiliates may have, or have had, business relationships with the subject
company(ies) mentioned in this report and may from time to time seek to provide investment banking or other services to the subject company(ies)
referred to in this research report. As a result, investors should be aware that a conflict of interest may exist.
The contents of this report is strictly confidential and may not be copied, reproduced, published, distributed, transmitted or passed, in whole or in part, to
any other person without the prior express written consent of RHB and/or its affiliates. This report has been delivered to RHB and its affiliates’ clients for
information purposes only and upon the express understanding that such parties will use it only for the purposes set forth above. By electing to view or
accepting a copy of this report, the recipients have agreed that they will not print, copy, videotape, record, hyperlink, download, or otherwise attempt to
reproduce or re-transmit (in any form including hard copy or electronic distribution format) the contents of this report. RHB and/or its affiliates accepts no
liability whatsoever for the actions of third parties in this respect.
The contents of this report are subject to copyright. Please refer to Restrictions on Distribution below for information regarding the distributors of this
report. Recipients must not reproduce or disseminate any content or findings of this report without the express permission of RHB and the distributors.
The securities mentioned in this publication may not be eligible for sale in some states or countries or certain categories of investors. The recipient of this
report should have regard to the laws of the recipient’s place of domicile when contemplating transactions in the securities or other financial instruments
referred to herein. The securities discussed in this report may not have been registered in such jurisdiction. Without prejudice to the foregoing, the
recipient is to note that additional disclaimers, warnings or qualifications may apply based on geographical location of the person or entity receiving this
report.
RESTRICTIONS ON DISTRIBUTION
Malaysia
This report is issued and distributed in Malaysia by RHB Research Institute Sdn Bhd. The views and opinions in this report are our own as of the date
hereof and is subject to change. If the Financial Services and Markets Act of the United Kingdom or the rules of the Financial Conduct Authority apply to a
recipient, our obligations owed to such recipient therein are unaffected. RHB Research Institute Sdn Bhd has no obligation to update its opinion or the
information in this report.
Thailand
This report is issued and distributed in the Kingdom of Thailand by RHB Securities (Thailand) PCL, a licensed securities company that is authorised by the
Ministry of Finance, regulated by the Securities and Exchange Commission of Thailand and is a member of the Stock Exchange of Thailand. The Thai
Institute of Directors Association has disclosed the Corporate Governance Report of Thai Listed Companies made pursuant to the policy of the Securities
and Exchange Commission of Thailand. RHB Securities (Thailand) PCL does not endorse, confirm nor certify the result of the Corporate Governance
Report of Thai Listed Companies.

Construction Regional Sector Update
51
Indonesia
This report is issued and distributed in Indonesia by PT RHB Securities Indonesia. This research does not constitute an offering document and it should
not be construed as an offer of securities in Indonesia. Any securities offered or sold, directly or indirectly, in Indonesia or to any Indonesian citizen or
corporation (wherever located) or to any Indonesian resident in a manner which constitutes a public offering under Indonesian laws and regulations must
comply with the prevailing Indonesian laws and regulations.
Singapore
This report is issued and distributed in Singapore by RHB Research Institute Singapore Pte Ltd and it may only be distributed in Singapore to accredited
investors, expert investors and institutional investors as defined in the Financial Advisers Regulations and the Securities and Futures Act (Chapter 289), as
amended from time to time. By virtue of distribution to these categories of investors, RHB Research Institute Singapore Pte Ltd and its representatives are
not required to comply with Section 36 of the Financial Advisers Act (Chapter 110) (Section 36 relates to disclosure of RHB Research Institute Singapore
Pte Ltd ’s interest and/or its representative's interest in securities). Recipients of this report in Singapore may contact RHB Research Institute Singapore
Pte Ltd in respect of any matter arising from or in connection with the report.
Hong Kong
This report is issued and distributed in Hong Kong by RHB Securities Hong Kong Limited (興業金融證券有限公司) (CE No.: ADU220) (“RHBSHK”) which is
licensed in Hong Kong by the Securities and Futures Commission for Type 1 (dealing in securities) and Type 4 (advising on securities) regulated activities.
Any investors wishing to purchase or otherwise deal in the securities covered in this report should contact RHB Securities Hong Kong Limited.
United States
This report was prepared by RHB and is being distributed solely and directly to “major” U.S. institutional investors as defined under, and pursuant to, the
requirements of Rule 15a-6 under the U.S. Securities and Exchange Act of 1934, as amended (the “Exchange Act”). RHB is not registered as a broker-
dealer in the United States and does not offer brokerage services to U.S. persons. Any order for the purchase or sale of the securities discussed herein
that are listed on Bursa Malaysia Securities Berhad must be placed with and through Auerbach Grayson (“AG”). Any order for the purchase or sale of all
other securities discussed herein must be placed with and through such other registered U.S. broker-dealer as appointed by RHB from time to time as
required by the Exchange Act Rule 15a-6.
This report is confidential and not intended for distribution to, or use by, persons other than the recipient and its employees, agents and advisors, as
applicable.
Additionally, where research is distributed via Electronic Service Provider, the analysts whose names appear in this report are not registered or qualified
as research analysts in the United States and are not associated persons of Auerbach Grayson AG or such other registered U.S. broker-dealer as
appointed by RHB from time to time and therefore may not be subject to any applicable restrictions under Financial Industry Regulatory Authority
(“FINRA”) rules on communications with a subject company, public appearances and personal trading.
Investing in any non-U.S. securities or related financial instruments discussed in this research report may present certain risks. The securities of non-U.S.
issuers may not be registered with, or be subject to the regulations of, the U.S. Securities and Exchange Commission. Information on non-U.S. securities
or related financial instruments may be limited. Foreign companies may not be subject to audit and reporting standards and regulatory requirements
comparable to those in the United States.
The financial instruments discussed in this report may not be suitable for all investors.
Transactions in foreign markets may be subject to regulations that differ from or offer less protection than those in the United States.
OWNERSHIP AND MATERIAL CONFLICTS OF INTEREST
Malaysia
RHB does not have qualified shareholding (1% or more) in the subject company (ies) covered in this report except for:
a) -
RHB and/or its subsidiaries are not liquidity providers or market makers for the subject company (ies) covered in this report except for:
a) -
RHB and/or its subsidiaries have not participated as a syndicate member in share offerings and/or bond issues in securities covered in this report in the
last 12 months except for:
a) -
RHB has not provided investment banking services to the company/companies covered in this report in the last 12 months except for:
a) -

Construction Regional Sector Update
52
Thailand
RHB Securities (Thailand) PCL and/or its directors, officers, associates, connected parties and/or employees, may have, or have had, interests and/or
commitments in the securities in subject company(ies) mentioned in this report or any securities related thereto. Further, RHB Securities (Thailand) PCL
may have, or have had, business relationships with the subject company(ies) mentioned in this report. As a result, investors should exercise their own
judgment carefully before making any investment decisions.
Indonesia
PT RHB Securities Indonesia is not affiliated with the subject company(ies) covered in this report both directly or indirectly as per the definitions of
affiliation above.
Pursuant to the Capital Market Law (Law Number 8 Year 1995) and the supporting regulations thereof, what constitutes as affiliated parties are as follows:
1. Familial relationship due to marriage or blood up to the second degree, both horizontally or vertically;
2. Affiliation between parties to the employees, Directors or Commissioners of the parties concerned;
3. Affiliation between 2 companies whereby one or more member of the Board of Directors or the Commissioners are the same;
4. Affiliation between the Company and the parties, both directly or indirectly, controlling or being controlled by the Company;
5. Affiliation between 2 companies which are controlled, directly or indirectly, by the same party; or
6. Affiliation between the Company and the main Shareholders.
PT RHB Securities Indonesia is not an insider as defined in the Capital Market Law and the information contained in this report is not considered as insider
information prohibited by law.
Insider means:
a. a commissioner, director or employee of an Issuer or Public Company;
b. a substantial shareholder of an Issuer or Public Company;
c. an individual, who because of his position or profession, or because of a business relationship with an Issuer or Public Company, has access to
inside information; and
d. an individual who within the last six months was a Person defined in letters a, b or c, above.
Singapore
RHB Research Institute Singapore Pte Ltd and/or its subsidiaries and/or associated companies do not make a market in any securities covered in this
report, except for:
(a) -
The staff of RHB Research Institute Singapore Pte Ltd and its subsidiaries and/or its associated companies do not serve on any board or trustee positions
of any issuer whose securities are covered in this report, except for:
(a) -
RHB Research Institute Singapore Pte Ltd and/or its subsidiaries and/or its associated companies do not have and have not within the last 12 months had
any corporate finance advisory relationship with the issuer of the securities covered in this report or any other relationship (including a shareholding of 1%
or more in the securities covered in this report) that may create a potential conflict of interest, except for:
(a) -
Hong Kong
RHBSHK or any of its group companies may have financial interests in in relation to an issuer or a new listing applicant (as the case may be) the securities
in respect of which are reviewed in the report, and such interests aggregate to an amount equal to or more than (a) 1% of the subject company’s market
capitalization (in the case of an issuer as defined under paragraph 16 of the Code of Conduct for Persons Licensed by or Registered with the Securities
and Futures Commission (the “Code of Conduct”); and/or (b) an amount equal to or more than 1% of the subject company’s issued share capital, or issued
units, as applicable (in the case of a new listing applicant as defined in the Code of Conduct). Further, the analysts named in this report or their associates
may have financial interests in relation to an issuer or a new listing applicant (as the case may be) in the securities which are reviewed in the report.

Construction Regional Sector Update
53
RHBSHK or any of its group companies may make a market in the securities covered by this report.
RHBSHK or any of its group companies may have analysts or their associates, individual(s) employed by or associated with RHBSHK or any of its group
companies serving as an officer of the company or any of the companies covered by this report.
RHBSHK or any of its group companies may have received compensation or a mandate for investment banking services to the company or any of the
companies covered by this report within the past 12 months.
Note: The reference to “group companies” above refers to a group company of RHBSHK that carries on a business in Hong Kong in (a) investment
banking; (b) proprietary trading or market making; or (c) agency broking, in relation to securities listed or traded on The Stock Exchange of Hong Kong
Limited.
Kuala Lumpur Hong Kong Singapore
RHB Research Institute Sdn Bhd Level 11, Tower One, RHB Centre
Jalan Tun Razak Kuala Lumpur
Malaysia Tel : +(60) 3 9280 2185 Fax : +(60) 3 9284 8693
RHB Securities Hong Kong Ltd.
12th Floor
World-Wide House 19 Des Voeux Road Central, Hong Kong
Tel : +(852) 2525 1118 Fax : +(852) 2810 0908
RHB Research Institute Singapore
Pte Ltd. 10 Collyer Quay
#09-08 Ocean Financial Centre Singapore 049315
Tel : +(65) 6533 1818 Fax : +(65) 6532 6211
Jakarta Shanghai Bangkok
PT RHB Securities Indonesia
Wisma Mulia, 20th Floor Jl. Jenderal Gatot Subroto No. 42
Jakarta 12710, Indonesia Tel : +(6221) 2783 0888 Fax : +(6221) 2783 0777
RHB (China) Investment Advisory Co. Ltd.
Suite 4005, CITIC Square 1168 Nanjing West Road
Shanghai 20041 China
Tel : +(8621) 6288 9611 Fax : +(8621) 6288 9633
RHB Securities (Thailand) PCL
10th Floor, Sathorn Square Office Tower 98, North Sathorn Road, Silom
Bangrak, Bangkok 10500 Thailand
Tel: +(66) 2 862 9999 Fax : +(66) 2 862 9799