under pressure : emergency department performance in … · 2 health quality ontario | under...
TRANSCRIPT

Under PressureEmergency department performance in Ontario
Let’s make our health system healthier

Health Quality Ontario is the provincial advisor on the quality of health care. We are motivated by this single-minded purpose: better health for all Ontarians.
importantly, patient experience. We then produce comprehensive, objective reports based on data, facts and the voices of patients, caregivers and those who work each day in the health system. As well, we make recommendations on how to improve care using the best evidence. Finally, we support large-scale quality improvements by working with our partners to facilitate ways for health care providers to learn from each other and share innovative approaches.
Why It MattersWe recognize that, as a system, there is much to be proud of, but also that it often falls short of being the best it can be. Plus, certain vulnerable segments of the population are not receiving acceptable levels of attention. Our intent at Health Quality Ontario is to continuously improve the quality of health care in this province regardless of who you are or where you live. We are driven by the desire to make the system better, and by the inarguable fact that better has no limit.
System Performance ReportingSince 2006, Health Quality Ontario has been creating a better health system by reporting on its performance. Our public reporting not only gives Ontarians the information they need to understand about their health system, it can also lead to direct improvements. Our public reporting products include: Measuring Up, our yearly report on the health system’s performance,
specialized reports that delve into focused topics and online reporting of health system indicators.
The Common Quality AgendaThe Common Quality Agenda is the name for a set of measures or indicators selected by Health Quality Ontario in collaboration with health system partners to focus performance reporting. Health Quality Ontario uses the Common Quality Agenda to focus improvement efforts and to track long-term progress in meeting health system goals to make the health system more transparent and accountable. The indicators promote integrated, patient-centred care and form the foundation of our yearly report, Measuring Up. As we grow our public reporting on health system performance, the Common Quality Agenda will evolve and serve as a cornerstone for all of our public reporting products.
Learn more about Health Quality Ontario at www.hqontario.ca
ISBN 978-1-4606-8828-1 (Print)
ISBN 978-1-4606-8829-8 (PDF)
Suggested citation: Health Quality Ontario. Under Pressure:
Emergency department performance in Ontario. Toronto: Queen’s
Printer for Ontario; 2016.
On the cover: Dr. Ian Chernoff at a hospital in Toronto. See
page 19 for his story. We thank Dr. Chernoff and the other people
who shared their experiences in Ontario’s health system.
(Cover photo by Roger Yip)
Who We AreWe are a scientifically rigorous group with diverse areas of expertise. We strive for complete objectivity, and look at things from a vantage point that allows us to see the forest and the trees. We work in partnership with health care providers and organizations across the system, and engage with patients themselves, to help initiate substantial and sustainable change to the province’s complex health system.
What We DoWe define the meaning of quality as it pertains to health care, and provide strategic advice so all the parts of the system can improve. We also analyze virtually all aspects of Ontario’s health care. This includes looking at the overall health of Ontarians, how well different areas of the system are working together, and most

Table of Contents
Photo of Dr. Graham Slaughter by Roger Yip. See his story on page 27.
Foreword 2
Executive Summary 4
1. Emergency Patients are Changing 6
Visits are on the rise 9
Patients are getting older 10
People are coming to emergency sicker 11
What does it mean for patients? 14
2. How Ontario is Meeting the Challenge 18
Emergency departments are doing better 21
Improvement still needed in some areas 23
High-acuity patients wait longer to see a doctor 23
Admitted patients may spend a long time in emergency 23
3. ADifferentEmergencyDepartmentforDifferentOntarians 26
Urban residents spend more time in emergency 29
Residents of low-income neighbourhoods visit theemergency department more often 30
Recent immigrants make fewer visits to theemergency department 31
4. The Road Ahead 34
Methods Notes 37 Acknowledgments 40
References 42
2 Health Quality Ontario | Under Pressure: Emergency department performance in Ontario
than a dozen emergency departments across the province, I can attest that when other parts of the system are functioning poorly or there are major health crises (such as flu outbreaks and large traumas) the impact on the emergency department is quickly felt.
That’s why this report is so important.
It’s of some comfort to learn, as this report shows, that patients are spending less time in Ontario’s emergency departments and seeing emergency doctors more quickly than in previous years. Strategies and innovations locally and at the system level have stimulated substantial improvements in hospital emergency departments.
But it’s not all good news. Too many seriously ill patients have to wait more than three hours to see an emergency doctor. And too many admitted patients have to wait more than a day lying on a stretcher in an emergency department cubicle, or in a hallway, waiting for an inpatient bed to become available. Many would say even one patient is too many to be waiting in a hallway for so long.
Every part of the health care system is important and plays a vital role in the care and healing of millions of Ontarians. The emergency departments across this province are among the most visible parts. Ranging in size from a handful of beds in a remote Ontario community to huge multi-site technology-laden centres in urban settings, they serve as critical points of care at some of the most life-threatening moments in our lives and those of our loved ones. For this reason our expectations are great for emergency departments, and they serve as a touchstone and a promise of ‘care when you need it.’
Emergency departments are also a critical barometer of the functioning of the health care system. Some have called them the ‘canary in the coalmine.’ They often serve as the intersection point of numerous health sectors and play a key role in helping patients navigate the system. When emergency departments are not working well the ripples can be felt throughout the system. Similarly, as a physician who has worked in more
Foreword
Foreword
Dr. Joshua Tepper President and Chief Executive Officer

3Health Quality Ontario | Under Pressure: Emergency department performance in Ontario
Foreword
next 25 years. The number of people aged 65 and older – who tend to require more complex emergency care – is expected to more than double over the next 25 years.
Inside emergency departments, the search for new and better ways of doing things continues, but some of the solutions need to be found elsewhere in the health system, starting with better capacity planning within and across hospitals. Beyond this, in the community, sustained focus on issues such as coordination of care, access and equity will be necessary to help maintain people’s health and minimize their need for emergency care.
Let’s celebrate the good news about how emergency departments have ably managed with the challenges they have faced, and commend the hard work done by so many people to achieve the improvements made so far. But considering the challenges that remain, the hard work is only beginning.
Patients who live in urban areas, where emergency departments are more crowded, are the ones most affected by lengthy waits for care. These patients spend almost 50% longer in emergency and wait more time to see a doctor than people in rural areas.
In an effort to keep people healthy and to divert less-seriously ill people away from emergency departments, numerous efforts have been made to strengthen primary care and home care over the last decade, thus providing alternatives to emergency department care.
Yet the flow of patients into hospital emergency departments continues unabated at a time when many are stretched to capacity. Over the period covered by our report there has been a 13% increase in patient visits.
Patients are already lying in hallways and being seen by doctors in waiting rooms. Under current conditions, the ability of Ontario’s emergency departments to care properly for patients could be seriously compromised by an occurrence as predictable as a bad flu season or as unpredictable as a SARS outbreak or a major weather event.
The pressure on emergency departments is not going to ease anytime soon. The province’s population is projected to grow by 30% over the
Dr. Joshua Tepper President and CEO Health Quality Ontario
Sincerely,

4 Health Quality Ontario | Under Pressure: Emergency department performance in Ontario
all visits. Visits by people aged 65 and older rose 29.1% over the past seven years.
Emergency department patients are becoming collectively sicker. Over the past seven years, visits made by high-acuity discharged patients increased 44.1%, and visits by patients who were admitted to hospital rose 17.5%.
Emergency departments are under a great deal of pressure as Ontarians visit them more frequently than ever. Many patients wait too long in crowded emergency departments to be seen by a doctor.
So, while progress has been made in overall performance, an emergency department could be strained beyond its capacity to provide quality care to all its patients by a bad flu season, or if a hospital nearby has to temporarily close its emergency department.
Here’s what the data show:
Growth in emergency department visits is outpacing population growth. Over the past seven years, the number of annual visits to Ontario’s emergency departments increased 13.4% – more than double the 6.2% increase in the province’s population.
Visits by older patients – who tend to require more complex care – are increasing overall as Ontario’s population ages, and increasing as a percentage of
There is good news in this report about emergency department care in Ontario. The data show emergency department visits are getting shorter, and that a greater percentage of visits are being completed within the provincial length-of-stay targets set for them.
Over the past seven years, the proportion of visits completed within the four-hour target for low-acuity patients who are not admitted to hospital increased to 89.9% from 84.6%, and the proportion of visits completed within the eight-hour target for high-acuity patients and admitted patients taken together as a group rose to 85.7% from 79.8%.
Another positive finding is that the majority of people in Ontario appear satisfied with the emergency care they receive. In 2014/15, 72.6% of respondents to a patient experience survey reported receiving excellent, very good or good care.
However, a closer look at the data reveals some troubling trends.
Executive Summary
Executive Summary
Visits made by high-acuity discharged patients increased 44.1%
Visits by patients who were admitted to hospital rose 17.5%
Over the past seven years:ED
17.5%
44.1%
Over the past seven years, visits made by high-acuity discharged patients increased 44.1%, and visits by patients who were admitted to hospital rose 17.5%.
Total cost of home-care palliative care
That total includes:
The cost of home-based palliative care
$25,000/MONTH
$17,500/monthLost wages and leisure time for caregivers
$6,400/monthHealth care system costs
$700/monthOut-of-pocket expenses for patient and family
$170Third-party insurer costs

5Health Quality Ontario | Under Pressure: Emergency department performance in Ontario
The strain on emergency department capacity is also evident in the overall longer waits for care experienced by patients who live in urban areas, where emergency departments tend to be busier and more crowded.
In 2014/15, urban residents spent longer in the emergency department and had longer times to physician initial assessment than those living in rural areas. Approximately 86% of people in Ontario live in urban areas.
The maximum amount of time within which nine out of 10 urban residents completed their emergency visit was 8.3 hours overall for all acuity levels, compared to 5.6 hours for rural residents, while the maximum amount of time nine out of 10 urban residents waited to see a doctor in emergency was 3.1 hours overall for all acuity levels, and 2.6 hours for rural residents.
The strain that exists on emergency departments, and on other parts of the health system that affect the ability of emergency departments to provide quality care, is evident in the data.
For example, in 2014/15, the maximum amount of time within which nine out of 10 admitted patients completed their visit was 29.4 hours. A large portion of that time – 22.5 hours – was spent waiting to be admitted to hospital. These are the patients who have to endure long hours and sometimes even days lying on stretchers in examination rooms or hallways, waiting for a bed to open up in an inpatient ward.
Waits for admission are one aspect of emergency department performance linked to problems elsewhere in the health system – in this case a lack of available inpatient beds, a problem which in turn is often linked to a lack of available beds in long-term care homes.
Whatever the cause, waits in emergency for an inpatient bed are major contributors to the emergency department overcrowding that can affect the care of all patients. The consequences can include poor quality of care, increased morbidity and mortality, and increased risk of errors by overworked and overstressed medical staff.
Executive Summary
The data also indicate that some people may be going to emergency for health problems that don’t require emergency department care – another factor contributing to overcrowding that is related to issues elsewhere in the health system. In a 2013 survey, 47% of adults in Ontario reported going to emergency for a condition they thought could have been treated by their primary care provider, if that doctor, nurse practitioner or other provider had been available.
Many individuals and organizations have tried hard to improve the quality of care provided in Ontario’s emergency departments. The Emergency Room Wait Times Strategy launched in 2008 and then expanded by the Ministry of Health and Long-Term Care has brought positive results in areas such as patient satisfaction and length of stay.
As Ontario’s population grows and ages and emergency visits are likely to continue to increase, the pressure on emergency departments to handle more and sicker patients with greater efficiency will likely continue and even intensify.
Visits made by high-acuity discharged patients increased 44.1%
Visits by patients who were admitted to hospital rose 17.5%
Over the past seven years,
Rural Urban
17.5%
44.1%
The maximum amount of time within which nine out of 10 urban residents completed their emergency visit was 8.3 hours overall for all acuity levels, compared to 5.6 hours for rural residents, while the maximum amount of time nine out of 10 urban residents waited to see a doctor in emergency was 3.1 hours overall for all acuity levels, and 2.6 hours for rural residents.
Total cost of home-care palliative care
That total includes:
The cost of home-based palliative care
$25,000/MONTH
$17,500/monthLost wages and leisure time for caregivers
$6,400/monthHealth care system costs
$700/monthOut-of-pocket expenses for patient and family
$170Third-party insurer costs
5.6 hrs 8.3 hrs
2.6 hrs 3.1 hrsTO SEE AN EMERGENCY DOCTOR
TO COMPLETE AN EMERGENCY VISIT

1. Emergency Department Patients are Changing
1. Emergency Department Patients are Changing
7Health Quality Ontario | Under Pressure: Emergency department performance in Ontario
1. Emergency Department Patients are Changing
Paula and David: Difficult experiences amid excellent careSince being rushed to emergency with respiratory and heart problems on his last day of work before retirement in 2013, David has spent a year-and-half in hospital. He is now at home on 24-hour oxygen and uses a ventilator at night. His wife Paula has accompanied him to the emergency department about 10 times since that day.
On two of those occasions, David was in critical condition and was taken almost immediately to the intensive care unit. “He never had to wait on a gurney in emerg for anything,” notes Paula. On other occasions, when David was having trouble breathing, the emergency visit usually lasted only two to three hours. “When he would just need a respiratory intervention, that was done in a very timely fashion and we were on our way.”
However, while David has received a lot of excellent care in emergency departments, there were a lot of negative experiences as well, says Paula.
One time, David’s family doctor sent them to emergency with a letter explaining he needed to be seen as soon as possible. David was confused and
incoherent, and his blood pressure was elevated. After showing the letter to the triage nurse, he waited two hours to see a doctor. “It turned out he had carbon dioxide blood poisoning and he could have died waiting,” says Paula.
Many of their other difficult experiences in hospital emergency departments were related to crowding. For example, Paula says they have frequently waited for care amid other patients who were coughing, sneezing and vomiting and were quite likely infectious, which was particularly upsetting when David was in such frail health.
Paula has also experienced a lack of privacy and consideration in busy emergency departments. When David was taken to emergency on his final workday, she remembers being told by a doctor in a busy waiting area that he was in critical condition. The doctor then left without answering questions or directing her to someone who might answer them. “I was just left standing there,” she recalls. “You’re in shock. That was a really big disconnect with the doctor. That was a horrible experience.”
But on another occasion when David was brought to another emergency department in critical condition, she was given a chair to sit on outside the room where he was being treated, and first a nurse and then a doctor came out to talk to her. “That was a totally different experience,” she recalls.
“ I was just left standing there,” she recalls. “You’re in shock.”

8 Health Quality Ontario | Under Pressure: Emergency department performance in Ontario
1. Emergency Department Patients are Changing
A new reality for emergency departmentsWhether they’ve been in a serious car accident, are experiencing chest pain, or have a respiratory infection that’s making it hard to breathe, people in Ontario count on hospital emergency departments to be there for them when they need them, around the clock, every day of the year.
Even when people aren’t dealing with an immediate health crisis or don’t require admission to hospital, an emergency department may provide their first point of contact with the health system for addressing their health issue, and then connect them for further care and treatment to other parts of the system such as family doctors, specialists, clinics and community health services.
For those who do need to be admitted to an inpatient bed, emergency departments are an important gateway to hospital care. More than half of admissions to Ontario hospitals come through emergency.[1]
Emergency departments perform a crucial role in the health care system. But people in Ontario seem to be depending on them more than in the past. In recent years, visits to emergency departments have increased at more than double the rate of growth in the province’s population.[2]

9Health Quality Ontario | Under Pressure: Emergency department performance in Ontario
1. Emergency Department Patients are Changing
Visits are on the riseIn 2014/15, people in Ontario made approximately 5.9 million visits as patients to emergency departments (Figure 1). That was a 13.4% increase over the 5.2 million visits they made in 2008/09.[2] Over the same period, the province’s population increased by 6.2%.[3]
The number of annual visits to the emergency department is likely to keep rising since Ontario’s population is projected to increase by 30% over the next quarter century.[3]
FIGURE 1Emergency department visits, in Ontario, 2008/09 to 2014/15
Data source(s): National Ambulatory Care Reporting System (NACRS), Registered Persons Database (RPDB), provided by the Institute for Clinical Evaluative Sciences (ICES)
6,000,000
5,000,000
4,000,000
3,000,000
2,000,000
1,000,000
0
Number of Unscheduled ED Visits
2008/09 2009/10 2010/11 2011/12 2012/13 2013/14 2014/15 Fiscal Year
5,194,718 5,325,217 5,400,435 5,618,952 5,682,088 5,722,097 5,891,843

10 Health Quality Ontario | Under Pressure: Emergency department performance in Ontario
1. Emergency Department Patients are Changing
FIGURE 2Emergency department visits, in Ontario, by age group, 2008/09 and 2014/15
Data source(s): National Ambulatory Care Reporting System (NACRS), Registered Persons Database (RPDB), provided by the Institute for Clinical Evaluative Sciences (ICES)
Patients are getting olderAt the same time as Ontario’s emergency departments have been dealing with an increasing volume of patients, those patients’ needs have been changing.
In 2014/15, people aged 65 and older made approximately 1.3 million visits to emergency departments, an increase of 29.1% over the 1 million visits they made in 2008/09 (Figure 2). Visits by all the patients in other age groups combined rose by 9.6% over the same period. While the percentage increase in visits by the 65-plus group was the biggest, it increased for all age groups.[2]
The proportion of visits made by people 65 and older increased to 22.4% of all visits in 2014/15, from 19.7% in 2008/09. In 2014/15, this equated to about 60 visits per 100 people aged 65 and older in Ontario.
This pattern of increased visits by older adults is likely to accelerate in coming years, since the number of people aged 65 and older in Ontario is projected to more than double over the next quarter century, and the proportion of the population in that age group will increase to 25.3% from 16.0%.[3]
The overall aging of the population will likely increase the need for the more complex emergency care older adults tend to require.
Older adults frequently need more complex care because they often experience symptoms that make the cause of their health problem difficult to diagnose; they may suffer from side effects associated with the multiple medications many take; they may have several chronic diseases that require concurrent treatment; they may have physical disabilities that require assessment and management; and some
might have cognitive problems that make it difficult for them to describe their health issues, understand what they are being told, or follow up on their care once they leave emergency.[4]
Overall, older patients are more likely to spend a longer time in emergency and are more likely to be admitted, compared to their younger counterparts.[5]
Number of Unscheduled ED Visits
0-4
5-19
20-44
45-64
65+
AgeGroup
2014/15
2008/09
438,319
813,898
1,688,688
1,232,782
1,021,031
467,423
836,988
1,831,685
1,438,065
1,317,682
+ 6.6%
+ 2.8%
+ 8.5%
+ 16.7%
+ 29.1%

11Health Quality Ontario | Under Pressure: Emergency department performance in Ontario
1. Emergency Department Patients are Changing
People are coming to emergency sickerPartially as a result of the growth in visits by people aged 65 and older, there has been an increase in emergency department visits by patients with serious health conditions, as indicated by the number who are admitted to hospital, and by their scores on the Canadian Triage and Acuity Scale (CTAS).
The CTAS scale prioritizes patients by urgency to help determine the order in which they are seen and treated. Every emergency patient is assigned a CTAS score when they undergo triage – a brief assessment of their condition – shortly after arrival.
For the purposes of the indicators used in this report, patients are divided into three groups. To do that, patients were first identified according to their CTAS scores as either “high-acuity” or “low-acuity.”
High-acuity patients have conditions that, as described by the CTAS guidelines, may threaten their lives and require immediate aggressive intervention; or that are a potential threat to life or limb function and require rapid medical intervention; or that could potentially progress to a serious problem requiring aggressive or rapid intervention.[6]
Low-acuity patients have conditions that would benefit from medical intervention or reassurance within two hours; or for which investigation and treatment could be delayed or referred to other areas of the hospital or health system.[6]
Patients at either acuity level may be discharged home after their visit, admitted as an inpatient to the hospital, or discharged to be transferred to another health facility.
High-acuity patients who are not admitted are referred to in this report as “high-acuity discharged,” and low-acuity patients who are not admitted are referred to as “low-acuity discharged.” All patients at either acuity level who are admitted to the hospital are grouped together and referred to as “admitted” patients.

12 Health Quality Ontario | Under Pressure: Emergency department performance in Ontario
1. Emergency Department Patients are Changing
FIGURE 3Emergency department visits, in Ontario, by patient group, 2008/09 and 2014/15
Data source(s): National Ambulatory Care Reporting System (NACRS), Registered Persons Database (RPDB), provided by the Institute for Clinical Evaluative Sciences (ICES)
Number of Unscheduled ED Visits
2014/15
2008/09
+ 17.5%
+ 44.1%
- 14.6%
PatientGroup
Alladmitted
High-acuitydischarged
Low-acuitydischarged
501,068
2,183,303
2,302,786
588,732
3,145,767
1,965,571
Between 2008/09 and 2014/15, the number of emergency department visits made annually by high-acuity discharged patients increased 44.1%, to approximately 3.1 million visits from 2.2 million, while the number made by low-acuity discharged patients decreased 14.6%, to approximately 2.0 million visits from 2.3 million. Visits by admitted patients rose 17.5%, to approximately 589,000 visits from 501,000 (Figure 3).
These changes over time shifted the overall acuity level of the patient caseload handled by Ontario’s emergency departments. Visits by high-acuity discharged patients rose to 53.4% of all visits by all patients, from 42.0%. Visits by low-acuity discharged patients fell to 33.4% of all visits, from 44.3%. Only visits by patients who were admitted remained relatively steady, increasing to 10.0% of all visits from 9.6%.[2]
13Health Quality Ontario | Under Pressure: Emergency department performance in Ontario
1. Emergency Department Patients are Changing
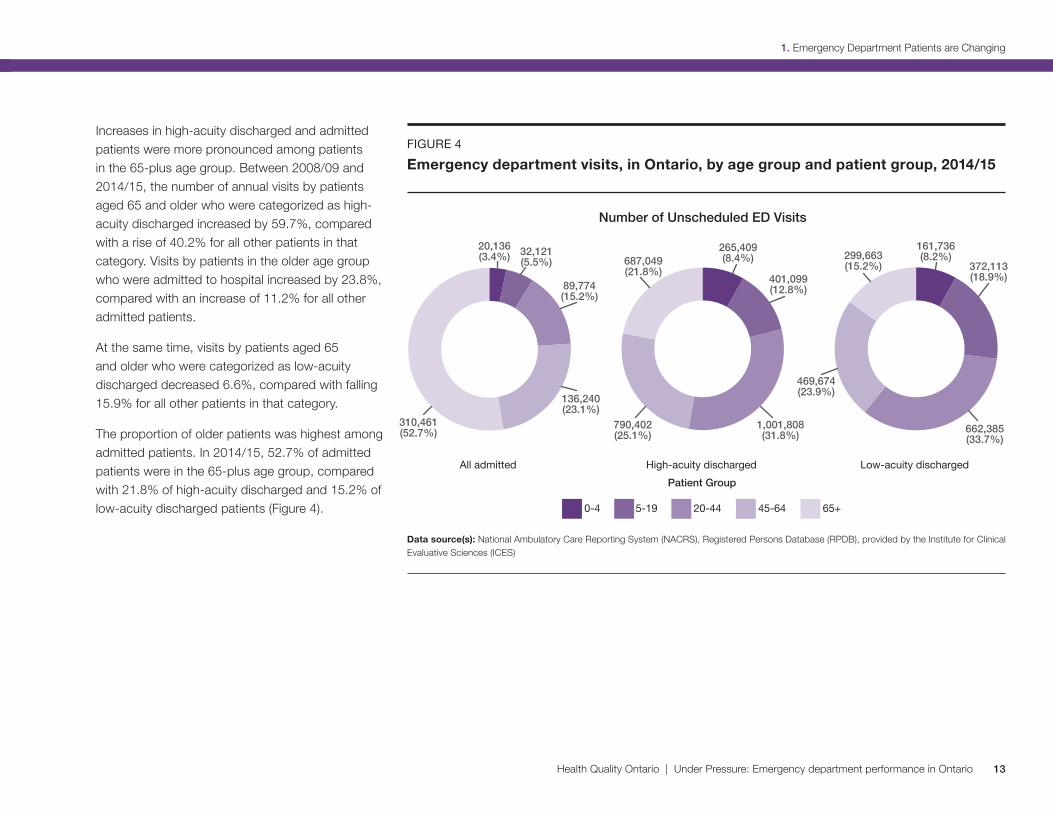
Increases in high-acuity discharged and admitted patients were more pronounced among patients in the 65-plus age group. Between 2008/09 and 2014/15, the number of annual visits by patients aged 65 and older who were categorized as high-acuity discharged increased by 59.7%, compared with a rise of 40.2% for all other patients in that category. Visits by patients in the older age group who were admitted to hospital increased by 23.8%, compared with an increase of 11.2% for all other admitted patients.
At the same time, visits by patients aged 65 and older who were categorized as low-acuity discharged decreased 6.6%, compared with falling 15.9% for all other patients in that category.
The proportion of older patients was highest among admitted patients. In 2014/15, 52.7% of admitted patients were in the 65-plus age group, compared with 21.8% of high-acuity discharged and 15.2% of low-acuity discharged patients (Figure 4).
FIGURE 4Emergency department visits, in Ontario, by age group and patient group, 2014/15
Data source(s): National Ambulatory Care Reporting System (NACRS), Registered Persons Database (RPDB), provided by the Institute for Clinical Evaluative Sciences (ICES)
0-4 5-19 20-44 45-64 65+
Number of Unscheduled ED Visits
Patient Group
All admitted High-acuity discharged Low-acuity discharged
136,240(23.1%)
89,774(15.2%)
32,121(5.5%)
20,136(3.4%)
1,001,808(31.8%)
790,402(25.1%)
687,049(21.8%)
161,736(8.2%)
372,113(18.9%)
469,674(23.9%)
299,663(15.2%)
662,385(33.7%)
310,461(52.7%)
265,409(8.4%)
401,099(12.8%)

14 Health Quality Ontario | Under Pressure: Emergency department performance in Ontario
1. Emergency Department Patients are Changing
What does it mean for patients?Emergency departments are designed to handle a flow of many patients of different ages with many different health problems. But there are times when their capacity is strained.
When they have to deal with too many patients at once it can lead to crowding and longer stays in emergency. If more patients are sicker or older and need more complex care requiring more emergency staff and resources, that can also result in longer stays for everyone.
Long stays in emergency and long waits to see a doctor are not merely inconvenient or uncomfortable. There can be serious negative consequences when patients have to wait for care in crowded emergency departments.
Some of those consequences were outlined in a report[7] on improving access to emergency care authored by a committee of representatives from the Ontario Hospital Association, the Ontario Medical Association and the Ontario Ministry of Health and Long-Term Care. They included: patient suffering, poor patient outcomes, increased morbidity and mortality, poor quality of care, contribution to infectious disease outbreaks and increased risk of medical error.
A number of studies have found increased risk of adverse events for patients cared for in emergency departments at times when lengths of stay were longer or they were overcrowded – with those adverse events including significant treatment delays for time-sensitive conditions, and admission to hospital or death within a week after the visit.[8,9,10]
One study analyzed deaths among non-admitted patients within a week after visiting high-volume Ontario emergency departments. The authors estimated that between 2003 and 2007, there could have been 6.5%, or 558, fewer deaths among high-acuity patients and 12.7%, or 261, fewer deaths among low-acuity patients if the average length of stay in those emergency departments had been shortened by one hour.[9]
Reasons for the increased risk associated with longer lengths of stay might include delays in treatment, or changes in the way decisions are made and care is provided when emergency staff are pressed for time amid a backlog of patients.[9,10]

15Health Quality Ontario | Under Pressure: Emergency department performance in Ontario
1. Emergency Department Patients are Changing
Who sees the doctor first?Triage is the process that determines the order in which emergency department patients see a doctor and are cared for. At high-volume hospitals, a “pre-triage” assessment that takes about two minutes may precede triage to determine in what order several waiting patients should be triaged.
The triage itself usually begins with a nurse asking the patient to describe their health problem and symptoms. The nurse will assess the patient’s physical appearance and their apparent degree of distress, and take vital signs such as heart rate and blood pressure as appropriate, before assigning the patient a priority score.
Hospitals in Canada must base that score on the five-level Canadian Triage and Acuity Scale (CTAS). The highest score is Level 1, which,
according to the CTAS guidelines, would include patients with conditions such as cardiac arrest or major trauma that threaten life or pose an imminent risk of deterioration. The lowest is Level 5, which would cover patients with conditions such as a sore throat or sprained ankle for which care could be delayed or possibly referred to other areas of the hospital or health care system.
The “high-acuity” patients described in this report include patients scored at Levels 1 to 3 on the CTAS scale, while the “low-acuity” patients are those with scores of 4 or 5.
Triage depends to some extent on the instincts and experience of the health professional performing it.
“Effective triage requires the use of sight, hearing, smell and touch,” state the CTAS triage
guidelines. “There are many non-verbal clues: facial grimaces, cyanosis, fear... Listen to what the patient is saying and pay attention to questions they are reluctant or unable to answer. Listen for a cough, hoarseness, laboured respiration... Touch the patient; assess heart rate and skin temperature and moisture. Notice odours such as the smell of ketones, alcohol, or infection.”[6]
The guidelines detail many factors that need to be considered in assigning a CTAS score to patients, but also encourage triage personnel to follow their instincts and experience to “up triage” patients who seem to them to require care more urgently than their symptom profile would suggest. At the same time, the guidelines say such instincts should not be used to “down triage” a patient when their symptoms suggest there may be a problem, but they look well.
16 Health Quality Ontario | Under Pressure: Emergency department performance in Ontario
1. Emergency Department Patients are Changing
Photo of Joy McCarron by Roger Yip.
A new tool for better triageTo improve the accuracy and efficiency of the triage process that determines the order in which emergency department patients are seen, hospitals across Ontario will soon be adopting a new electronic triage system. It’s being developed and implemented by Cancer Care Ontario – the Ontario government’s principal advisor on cancer and chronic kidney disease care and on access to care for key health services.
The new system, called eCTAS, is based on the Canadian Triage and Acuity Scale (CTAS) that assigns each patient a score that reflects the urgency of their illness. The goal of eCTAS is to improve triage by guiding emergency nurses through a comprehensive, common assessment and documentation process that is expected to lead to more accurate and more consistent evaluation of each patient’s condition.
“It was designed by emergency nurses in Ontario specifically for emergency nurses to triage patients,” says Joy McCarron, a nurse who is Cancer Care Ontario’s clinical leader for the implementation of eCTAS across the province. She has over 20 years of experience in triage and triage training.
While eCTAS will automatically assign patients a CTAS score based on information about their condition that is entered into a computer by the triage nurse, nurses will still be free to use their own clinical judgment to assign patients a higher score indicating a more urgent need for care.
Many Ontario hospitals are already using electronic triage, but they are using a variety of systems, with mixed results, says McCarron. She says some of the systems, for example, require too much information that turns the process into a broader assessment
rather than triage, which slows the triage process and thereby slows patient flow in emergency.
The eCTAS system will be made available to all hospitals in the province. When hospitals were asked to volunteer to be among the first to adopt it, 23 volunteered, more than double what was anticipated, notes McCarron.
Across Ontario, 122 of the 128 hospitals that have emergency departments have signed on to be part of the eCTAS initiative. By 2018, says McCarron, it’s expected that eCTAS will be used in hospitals that care for 87% of the province’s population.
As part of the evaluation being done on eCTAS, McCarron, an expert triage auditor, performed live triage audits – sitting at the triage desk and seeing and hearing the same patients as triage nurses on duty. Once eCTAS is implemented, live audits will be repeated to see how the results of the triage nurses compare to the results of an expert auditor after the system is in place. Pre-implementation triage time was also evaluated to ensure eCTAS implementation does not significantly affect triage assessment time.
“We expect there to be a learning curve,” says McCarron, “and so initially we expect some hospitals to experience a bit longer triage, which will be rectified by the staff becoming more familiar with the new system.”
It remains to be seen whether eCTAS will shorten the triage process by making it more efficient, says McCarron. But it is meant to improve consistency and accuracy, which should improve overall emergency care. “At the very least, we’ll know who the sick patients are, where right now there’s a risk that we may not be identifying all of the very ill patients.”

17Health Quality Ontario | Under Pressure: Emergency department performance in Ontario
1. Emergency Department Patients are Changing
The patient’s time in emergencyThere are a number of factors that affect the length of a patient’s stay in the emergency department.
First, the nature of their health problem and the acuity level assessed for it at triage will help determine how long it will take before the patient sees a doctor. If the doctor orders diagnostic tests such as x-rays or blood work, those will have to be completed and processed before the patient sees the doctor again to discuss the results.
The visit may also include a consultation with a specialist, more tests, treatment, an observation period to see the results of treatment, or a wait for a decision by a doctor on whether the patient should be admitted to the hospital, sent home or transferred to another facility.
If they are admitted, there will likely be a wait for an inpatient bed; if they are discharged home, there may be a wait for instructions on self-care or for follow-up with a doctor in the community; and if they are transferred, there could be a wait for an ambulance to transport them to another care facility.
While the patient’s own needs are key to determining their path through emergency, if other people in emergency have more urgent need for diagnosis and treatment, that may result in longer waits for care that prolong the patient’s visit, and could affect the amount of time and attention the patient receives from individual members of staff.[9]

2. How Ontario is Meeting the Challenge
2. HowOntario isMeeting theChallenge
Photo of Dr. Ian Chernoff by Roger Yip.

19Health Quality Ontario | Under Pressure: Emergency department performance in Ontario
2. How Ontario is Meeting the Challenge
Finding creative ways to adaptWhile some doctors may see emergency medicine as too hectic and devoid of opportunities to form the long-term relationships with patients that many doctors cherish, emergency physician Dr. Ian Chernoff considers caring for 25 to 30 new patients every day to be an opportunity to do a lot of good.
“In terms of just having the potential to be a positive force in health care for a maximum number of patients, it is hard to match the opportunity that emergency medicine presents,” explains Dr. Chernoff, who works full-time in the emergency department at Mount Sinai Hospital.
“Often we’re seeing people and families at absolutely pivotal and once-in-a-lifetime moments,” he notes. “I’ve always felt quite privileged to be able to be involved with people at those times of their lives. There’s just an immense opportunity there to try to be a good person and a good physician and provide compassionate care.”
Dr. Chernoff has been providing care to emergency patients for 19 years, and things have changed quite a bit over those years. Overall, he’s seeing more patients, more older patients, and more patients with complex health problems.
Emergency medicine has adapted to the pressures created by these changes in many ways that have
actually improved care, says Dr. Chernoff. For example, there are more types of staff available – such as physician assistants, nurse practitioners, advanced practice geriatric nurses and physiotherapists – to provide care. And there is much more of a team approach, he explains, with doctors sharing important decision-making roles with these new staff members.
Staff also have more options other than admission to hospital available for patients whose needs can’t be completely addressed during their emergency visit, including home care and community health services.
But these kinds of changes haven’t relieved all the pressure. Dr. Chernoff says the two biggest barriers his emergency department faces in trying to deal efficiently with more patients, and patients with increasingly complex conditions, are the small physical space available to care for them, and a shortage of inpatient beds for patients waiting in emergency for admission.
When Dr. Chernoff started working at Mount Sinai Hospital’s emergency department 10 years ago, five extra beds in a hallway were used for patient overflow. Now there are five more in another hallway, and five more in a hall in the waiting area. And it’s still often not enough.
“I now routinely go out and assess patients in the waiting room, and that’s suboptimal in many ways,” says Dr. Chernoff, adding he does those assessments to at least get care started for patients when there are no emergency beds available.
Waiting room assessments are among the many “creative” adaptations he says emergency departments are making to deal with patient overflows. But he believes the crowding does affect quality of care to some extent. “For an elderly patient who is already ill enough that they’ve had to come to the emergency department, if they have to lie in a hallway and there’s bright light and there’s noise and they don’t sleep for a period of time, that is not good for their medical condition.”
An expansion of his emergency department is already in the works, and Dr. Chernoff believes such growth in capacity is sometimes needed in addition to innovation and adaptation.
“I think things need to move in concert. You can be the most efficient emergency department on the planet, but if there are not more inpatient beds and there is not more physical space to see patients, if nothing else changes and the pressures just get added upon, then ultimately, of course, there’s only so much you can do in such circumstances.”

20 Health Quality Ontario | Under Pressure: Emergency department performance in Ontario
2. How Ontario is Meeting the Challenge
Measuring performanceAt a time when Ontario’s emergency departments are dealing with significant change in the numbers and types of patients coming through their doors, it’s important to look at the quality of care those patients are receiving.
One way to examine quality is through emergency department performance indicators that evaluate timeliness of care, such as “time to physician initial assessment,” “length of stay” and “left without being seen.”
Time to physician initial assessment measures the time from when a patient is triaged or registered (whichever happens first) to when they are seen by a doctor. Length of stay measures the time from when a patient is triaged or registered to when they are discharged from emergency to go home, are admitted to an inpatient bed, or are transferred to another acute care facility. Left without being seen tracks how many people leave the emergency department before being examined by a doctor.
21Health Quality Ontario | Under Pressure: Emergency department performance in Ontario
2. How Ontario is Meeting the Challenge
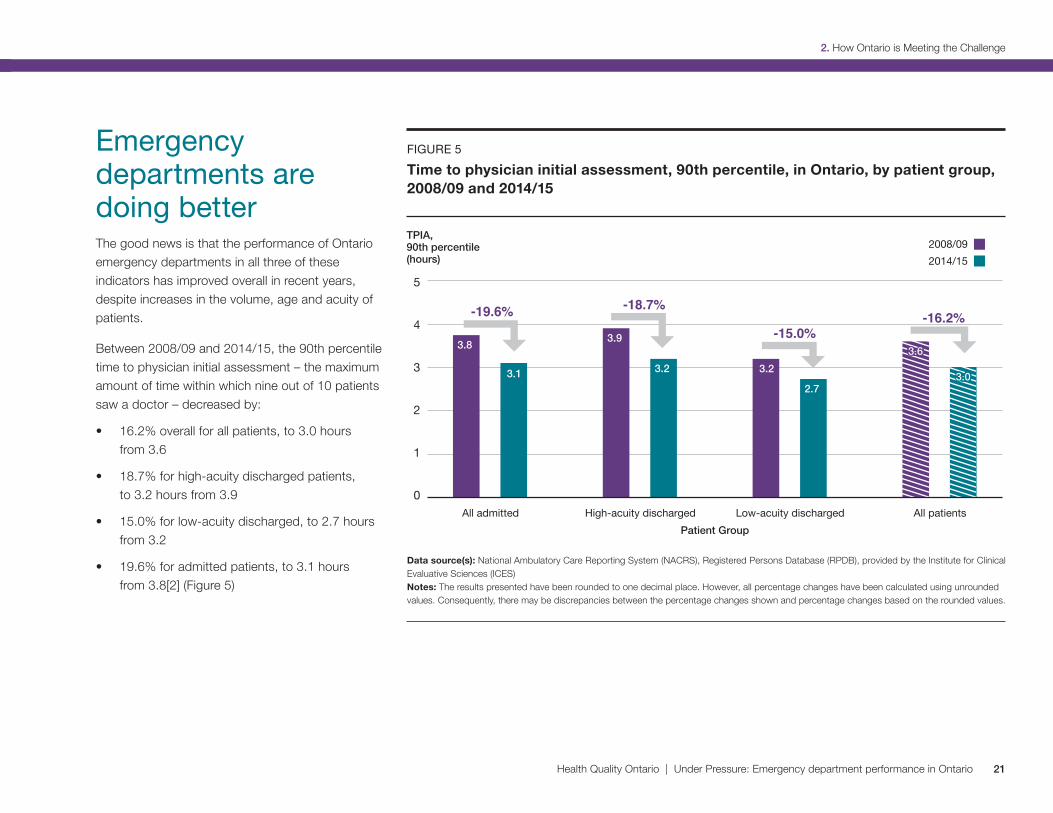
Emergency departments are doing betterThe good news is that the performance of Ontario emergency departments in all three of these indicators has improved overall in recent years, despite increases in the volume, age and acuity of patients.
Between 2008/09 and 2014/15, the 90th percentile time to physician initial assessment – the maximum amount of time within which nine out of 10 patients saw a doctor – decreased by:
• 16.2% overall for all patients, to 3.0 hours from 3.6
• 18.7% for high-acuity discharged patients, to 3.2 hours from 3.9
• 15.0% for low-acuity discharged, to 2.7 hours from 3.2
• 19.6% for admitted patients, to 3.1 hours from 3.8[2] (Figure 5)
FIGURE 5Time to physician initial assessment, 90th percentile, in Ontario, by patient group, 2008/09 and 2014/15
Data source(s): National Ambulatory Care Reporting System (NACRS), Registered Persons Database (RPDB), provided by the Institute for Clinical Evaluative Sciences (ICES) Notes: The results presented have been rounded to one decimal place. However, all percentage changes have been calculated using unrounded values. Consequently, there may be discrepancies between the percentage changes shown and percentage changes based on the rounded values.
5
4
3
2
1
0
TPIA, 90th percentile (hours)
Patient Group
2014/152008/09
All admitted High-acuity discharged Low-acuity discharged All patients
-15.0%-16.2%-19.6% -18.7%
3.6 3.6 3.8
3.9
3.2 3.1 3.2
2.7 3.0 3.0
22 Health Quality Ontario | Under Pressure: Emergency department performance in Ontario
2. How Ontario is Meeting the Challenge
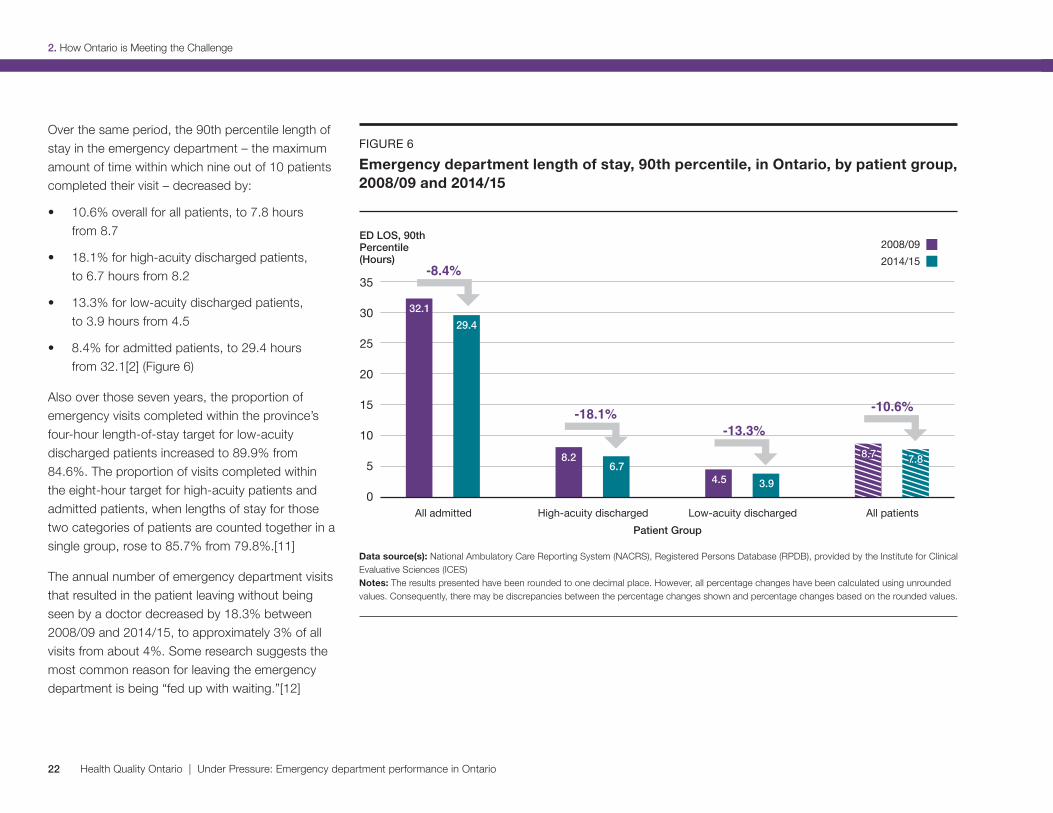
Over the same period, the 90th percentile length of stay in the emergency department – the maximum amount of time within which nine out of 10 patients completed their visit – decreased by:
• 10.6% overall for all patients, to 7.8 hours from 8.7
• 18.1% for high-acuity discharged patients, to 6.7 hours from 8.2
• 13.3% for low-acuity discharged patients, to 3.9 hours from 4.5
• 8.4% for admitted patients, to 29.4 hours from 32.1[2] (Figure 6)
Also over those seven years, the proportion of emergency visits completed within the province’s four-hour length-of-stay target for low-acuity discharged patients increased to 89.9% from 84.6%. The proportion of visits completed within the eight-hour target for high-acuity patients and admitted patients, when lengths of stay for those two categories of patients are counted together in a single group, rose to 85.7% from 79.8%.[11]
The annual number of emergency department visits that resulted in the patient leaving without being seen by a doctor decreased by 18.3% between 2008/09 and 2014/15, to approximately 3% of all visits from about 4%. Some research suggests the most common reason for leaving the emergency department is being “fed up with waiting.”[12]
FIGURE 6Emergency department length of stay, 90th percentile, in Ontario, by patient group, 2008/09 and 2014/15
Data source(s): National Ambulatory Care Reporting System (NACRS), Registered Persons Database (RPDB), provided by the Institute for Clinical Evaluative Sciences (ICES) Notes: The results presented have been rounded to one decimal place. However, all percentage changes have been calculated using unrounded values. Consequently, there may be discrepancies between the percentage changes shown and percentage changes based on the rounded values.
35
30
25
20
15
10
5
0
ED LOS, 90th Percentile (Hours)
Patient Group
2014/152008/09
All admitted High-acuity discharged Low-acuity discharged All patients
8.7 8.7
32.1
8.2
4.5
29.4
6.7
3.9
7.8 7.8
-8.4%
-18.1%-13.3%
-10.6%

23Health Quality Ontario | Under Pressure: Emergency department performance in Ontario
2. How Ontario is Meeting the Challenge
Another important quality indicator is patient experience. The majority of people in Ontario appear to be satisfied with the care they have received in the province’s emergency departments. In a 2014/15 patient experience survey of Ontarians aged 16 and over conducted on behalf of the Ministry of Health and Long-Term Care, 72.6% of respondents reported receiving excellent, very good or good care. However, the other 27.4% – more than one in four respondents – rated their care as fair or poor.[13]
There were fewer positive ratings among people aged 16 to 44, at 68.8%, and more from people aged 75 and older, at 86.7%. Among rural residents, 83.5% rated their experience as positive, compared to 70.6% of urban residents.[13]
Improvement still needed in some areasEven though lengths of stay and waits to see a doctor were shorter, and the majority of patients were satisfied, emergency departments were not necessarily performing as well as they should be for all patients.
High-acuity patients wait longer to see a doctor The data showed that the 90th percentile time to physician initial assessment in Ontario was longer for high-acuity discharged and admitted patients, at 3.2 and 3.1 hours respectively, than for low-acuity discharged patients, at 2.7 hours, in 2014/15 (Figure 5). This is not necessarily the result most people would expect – since a major goal of triage is to have higher-acuity patients seen sooner.
However, the high-acuity discharged group includes a range of patients, from those who need to see a doctor immediately (CTAS Level 1) to those who have potentially serious conditions but can wait without suffering harm (CTAS Level 3). So the longer wait for the group as a whole does not necessarily mean patients triaged at the top priority level, for example, had to wait hours to see a doctor. In fact, the data showed that the wait was shorter for patients with the most urgent, life-threatening conditions.[2]
One reason low-acuity discharged patients as a group may see a doctor faster might be because many hospitals stream them to separate areas of the emergency department designed to handle lower-acuity patients more efficiently.
Low-acuity discharged patients can often stay in a chair to see a doctor and often don’t require much medical equipment for diagnosis and treatment. So, they may not have to wait for an emergency bed and other equipment to be available, as high-acuity discharged and admitted patients often do. Emergency departments often move low-acuity patients into rapid assessment zones designed for patients who don’t need to use a bed in emergency, so that all patients can be cared for more efficiently.
Admitted patients may spend a long time in emergencyWhile the 8.4% decrease in the 90th percentile length of stay for admitted patients was a significant improvement, that still meant nine out of 10 admitted patients spent up to 29.4 hours in the emergency department in 2014/15. A large portion of that time – 22.5 hours – was spent waiting in the emergency department to go to an inpatient ward.[2]
There are several consequences that may arise from emergency patients having to wait such a long time for admission to an inpatient hospital bed. They include discomfort for the patient and possibly less than optimum care as a result of not being in the hospital ward a doctor has decided is best suited for their care.

24 Health Quality Ontario | Under Pressure: Emergency department performance in Ontario
2. How Ontario is Meeting the Challenge
Why the 90th percentile?Time to physician initial assessment and emergency department length of stay are measured in this report at the 90th percentile – the amount of time within which nine out of 10 patients will have seen a doctor or completed their visit.
The 90th percentile indicator was chosen because it represents the maximum wait to see a doctor or length of stay for the vast majority – 90% – of patients. So, it’s a point of measurement that includes most extreme scenarios in which patients have to wait longer to see a doctor or stay longer in emergency than patients at the median or average time points.
Provincial and individual hospital targets for length of stay and time to physician initial assessment are also set at the 90th percentile, to more fully reflect what the emergency department experience may be like for a wide range of patients.
As well, because they usually have to occupy a bed in emergency while they wait, sometimes for many hours, admitted patients may impede access to emergency beds, doctors, nurses and other resources for other patients still waiting for care.
A lack of available inpatient beds for patients from emergency may be linked to many possible factors. For example, a hospital may simply not have enough beds to meet the needs of the growing community it is serving;[14] inefficient inpatient bed management may lead to patients not moving in and out of hospital wards as quickly as possible; or inefficient housekeeping practices may mean inpatient beds are not readied for the next patient quickly enough.[15]
Lack of inpatient bed availability is also frequently attributed to inpatient beds being occupied by patients who don’t require hospital care but are waiting for a space in a health care facility appropriate for their needs – such as a long-term care home or a rehabilitation facility. These patients are often identified as requiring an “alternate level of care.”
In 2014/15 in Ontario, 13.7% of “inpatient days,” or of all the days each individual hospital bed in the province was occupied by a patient, were used for patients identified as needing an alternate level of care.[16] That was an improvement, down by 14.3%* from 2011/12. The 2014/15 figure amounted to approximately 4,000 inpatient days being used at any given time that year for patients waiting to receive care elsewhere.
To whatever extent patients requiring an alternate level of care may affect emergency department lengths of stay, it is an issue for which at least part of the solution lies in other parts of the health system. Hospitals can certainly work on improving the flow of patients through their emergency departments and inpatient wards, but there is not much they can do to free up inpatient beds occupied by patients waiting for places in long-term care homes, for example.
* Incomplete fiscal year: July 2011 - March 2012.

25Health Quality Ontario | Under Pressure: Emergency department performance in Ontario
2. How Ontario is Meeting the Challenge
Targeting improvementPerformance improvements over recent years have resulted in Ontario hospitals collectively meeting two of the province-wide targets set for emergency department length of stay in 2014/15: four hours for low-acuity discharged patients and eight hours for high-acuity discharged patients. The provincial target of a maximum eight-hour length of stay in emergency for admitted patients is not being met on a province-wide basis.
To drive improvements across the province, each hospital, locally, has its own set of individual targets related to provincial targets for emergency department length of stay. Some of those targets are incorporated into the Hospital Service Accountability Agreement each hospital has with its Local Health Integration Network.
Hospitals may also set improvement targets for their emergency departments in the Quality Improvement Plans they are required to draw up annually. These are submitted to Health Quality Ontario on April 1 of every year. The plans and their targets must reflect the province’s health care priorities, as well as locally relevant quality issues.
Health Quality Ontario reviews and analyzes the Quality Improvement Plans to produce reports that share consolidated data and observations with hospitals and the public. The reports spread knowledge about effective improvement strategies and help align quality improvement efforts – in emergency and other areas of care – across the province.

Photo of Dr. Graham Slaughter by Roger Yip.
3. A Different Emergency Department for Different Ontarians
3. A Different Emergency Department for Different Ontarians

27Health Quality Ontario | Under Pressure: Emergency department performance in Ontario
3. A Different Emergency Department for Different Ontarians
Rapid Referral Clinic a win for everyoneA new way of doing things is helping to improve care for some patients coming in with complex health conditions to the busy emergency department at Sunnybrook Health Sciences Centre.
Adult patients with serious health issues who need prompt, but not immediate, care may be referred by an emergency department doctor to Sunnybrook’s Rapid Referral Clinic. There, they will be seen within a few days by an internist – a doctor who specializes in the diagnosis and nonsurgical treatment of adults.
These are patients who might otherwise have to wait many hours in emergency for a consultation with an internist and for diagnostic testing, or be admitted to hospital for their condition to be investigated, or be discharged home to wait weeks or even months to see a specialist and have diagnostic tests done.
Instead, patients get to leave the emergency department with an appointment to be seen, often the next day, at the Rapid Referral Clinic.
“We have expedited access to the same type of testing that can happen in the emergency room, in order to get investigations done,” explains Dr. Graham Slaughter, who heads the clinic. Patients who need laboratory tests, or tests such as CT scans, ultrasound scans and pulmonary function tests, can have them done the same day. The clinic also has
expedited access to consultations with specialists in areas such as neurology and rheumatology. And, if necessary, patients can be admitted to hospital.
Donald came to the clinic as a patient after going to the emergency department on the advice of his doctor, who was concerned when the 89-year-old developed jaundice, which can indicate problems with the liver. After spending seven hours in emergency he was referred to the clinic, where he saw Dr. Slaughter the next day.
“I was extremely impressed by him,” says Donald. “He arranged for me to have, first of all, a CT scans and then on the results of that, a liver biopsy, all in fairly short order.”
Donald believes the clinic “cuts down on a lot of angst and worry” for patients like himself who are anxious to find out what’s wrong with them. He notes he might have had to wait a couple of months for a CT scan if he had not gone to emergency and been referred to the clinic. “Naturally if there’s a possibility of cancer lurking around in the background, it could possibly even save your life.”
Donald’s scan indicated a mass in his liver that could be cancer, so Dr. Slaughter also arranged an appointment for him with a specialist at the hospital’s cancer centre. Despite the worrisome outcome of his visit to the clinic, Donald is pleased
that the time from that visit to his visit with a cancer specialist will only be two to three weeks. “Waiting is very stressful,” he says, “waiting and not knowing.”
The clinic isn’t appropriate for patients such as those who need oxygen or intravenous antibiotics, or whose condition is already being monitored by a specialist. But when referral to the clinic is appropriate, it’s a win for everyone involved.
For the hospital, it means being able to reduce emergency department crowding and admissions. For the patient, it means being able to go home and still receive the care they need in a timely manner.
“You also are trying to keep them in their own bed and as much as possible going about their lives as ordinarily as possible,” says Dr. Slaughter. “An admission can be a horribly intrusive thing.”
Sunnybrook’s own data show 22% of the patients seen at the clinic would have been admitted to hospital if it were not available. The clinic has also created cost efficiencies that freed up approximately $1 million per year. And, it has resulted in satisfied patients.
“Patients seem to be genuinely happy with the effort that’s put forward, with the relative speed at which they get seen and the thoroughness of the work that we do,” says Dr. Slaughter.

28 Health Quality Ontario | Under Pressure: Emergency department performance in Ontario
3. A Different Emergency Department for Different Ontarians
Rosemary: A long wait in painRosemary’s back pain took a horrible turn for the worse immediately after she took what was supposed to be a soothing bath on the advice of her physiotherapist.
“I was standing in my bathroom and I suddenly had this pain, but it was overwhelming,” she recalls. “That’s all I remember, standing in the bathroom with this pain and then the next thing I remember I’m waking up and my head is beside the toilet and I’m lying on the bathroom floor and all I could do was scream.”
Rosemary crawled very slowly to her bed. She didn’t go to emergency until she could find someone to look after her three dogs. After she called 911 and was taken by ambulance to an urban community hospital emergency department, Rosemary waited five or six hours on a stretcher in a hallway before a doctor saw her. The pain medication she had been taking at home had begun to wear off soon after her arrival.
“They told me I couldn’t take anything that wasn’t administered by them and they were too busy to see me, and I’m lying there in complete agony with no help.” She says she was in a
hallway for her entire 15-hour stay in emergency, except for the brief periods when she was taken for testing and catheterization.
“I think two or three doctors came to me while I was in emerg. They asked me the same questions: ‘Do you know what happened? What do you think caused it?’ Two, three minutes and then they were gone. The third guy, which I suspect was like eight hours there now, gave me a pain pill which didn’t take the pain away, just made me feel a little bit better.”
After a CT scan was done, Rosemary was told she appeared to have a large but non-malignant tumour at the base of her spine, and that she would have an MRI scan to determine exactly what was wrong. She was given medication called gabapentin, which made the pain go away for about an hour-and-a-half at a time, and a few hours later she was admitted to the hospital as an inpatient.
But Rosemary says some misunderstanding or miscommunication must have occurred because she was in a lot of pain but was no longer given gabapentin in the inpatient ward, even though she had told the nurse in emergency that it relieved her pain.
She says such problems could be dealt with more effectively if patients had immediate access to their records, because she saw in her records after leaving the hospital that the nurse had written that Rosemary didn't want gabapentin.
The MRI scan showed Rosemary had a ruptured disc that had initially looked like a tumour because so much disc material had escaped. She spent 10 days in hospital and a year incapacitated at home, and is still not able to do all the things she did six years ago before her injury.
Rosemary says she has visited emergency departments about a dozen other times over the past eight years and the visits have lasted eight or nine hours each time. She believes that’s too long and that emergency care can and should be improved.
“It is not efficient, it is not functioning well. It’s not like the people there aren’t trying. They’re just overwhelmed, and when people get overwhelmed they actually get less productive.”

29Health Quality Ontario | Under Pressure: Emergency department performance in Ontario
3. A Different Emergency Department for Different Ontarians
Certain population groups do not have the same emergency department experience as others – with some groups collectively staying longer in emergency or spending a longer time there before seeing a doctor, and some visiting emergency more often. Some of these differences in patient experience and utilization point to possible inefficiencies and inequities in the health system as a whole.
Urban residents spend more time in emergencyIn 2014/15, patients living in urban areas spent longer in the emergency department and waited longer to see an emergency doctor than those living in rural areas. This was true regardless of acuity level. Approximately 86% of people in Ontario live in urban areas.[17]
The 90th percentile length of stay in emergency for urban residents was 8.3 hours overall for all acuity levels, compared to 5.6 hours for rural residents. The biggest difference in stay lengths was for admitted patients, with urban admitted patients spending up to 30.3 hours in emergency at the 90th percentile, while rural admitted patients spent up to 21.2 hours (Figure 7).
The 90th percentile time to physician initial assessment for urban residents was 3.1 hours overall for all acuity levels, and 2.6 hours for rural residents.
For example, in 2014/15, the 90th percentile length of stay for all emergency patients at teaching hospitals in Ontario was 11.0 hours, compared to 7.6 hours for community hospitals and 4.3 hours for small hospitals.[2]
Stays in emergency and waits to see a doctor could be longer for urban residents because patient length of stay and time to physician initial assessment are longer in teaching and community hospitals, which are usually located in urban centres and are usually more busy and crowded.
FIGURE 7Emergency department length of stay, 90th percentile, in Ontario, by patient group and urban/rural patient location, 2014/15
35
30
25
20
15
10
5
0
ED LOS, 90th Percentile (Hours)
Patient Group
All admitted High-acuity discharged Low-acuity discharged All patients
Urban (Patient)Rural (Patient)
8.3 8.3
30.3
6.8
4.0
21.2
6.1 3.5
5.6 5.6
Data source(s): National Ambulatory Care Reporting System (NACRS), Registered Persons Database (RPDB), provided by the Institute for Clinical Evaluative Sciences (ICES)

30 Health Quality Ontario | Under Pressure: Emergency department performance in Ontario
3. A Different Emergency Department for Different Ontarians
FIGURE 8Percentage of adults (aged 16 and older) who visited an emergency department because they were sick or had a health-related problem in the previous 12 months, in Ontario, by immigration status, April 2014 to March 2015
Data source(s): Health Care Experience Survey, Ministry of Health and Long-Term Care, April 2014 to March 2015 Notes: There is a statistically significant difference between Canadian-born respondents and immigrants (both established and recent). See Methods Notes for a description of statistical significance.
Residents of low-income neighbourhoods visit the emergency department more oftenPeople from low-income neighbourhoods go to the emergency department more frequently than those from higher-income neighbourhoods. In 2014/15, 23.4% of the one-fifth of Ontario’s population living in the lowest-income neighbourhoods visited an emergency department, compared to 16.6% of the one-fifth of the population living in the highest-income neighbourhoods.[2]
The possibilities suggested by this finding include that people from low-income neighbourhoods may be less able to access care elsewhere, may be unable to access care in time to prevent the need for an emergency visit, or may be less healthy and need emergency health care more often.
Similar factors may be at play for residents of rural regions, who in 2014/15 visited the emergency department at a rate of 59 visits per 100 people, compared to 40 visits per 100 for urban residents.[2] Research suggests a greater proportion of primary care in rural areas is delivered through hospitals and emergency departments, particularly where few after-hours services are available.[18,19]
100
80
60
40
20
0
Percent
Immigration Status
Canadian born Established immigrant (10+ years) Recent immigrant (< 10 years)
26.2 19.2
16.3
31Health Quality Ontario | Under Pressure: Emergency department performance in Ontario
3. A Different Emergency Department for Different Ontarians
Recent immigrants make fewer visits to the emergency departmentSome people are going to the emergency department less often than others. In 2014/15, among Ontarians who immigrated to Canada within the previous 10 years, 16.3% reported visiting an emergency department in the previous 12 months, compared to 19.2% of established immigrants in the province, and 26.2% of those born in Canada (Figure 8).[13]

32 Health Quality Ontario | Under Pressure: Emergency department performance in Ontario
3. A Different Emergency Department for Different Ontarians
Could some emergency patients be cared for elsewhere? In 2014/15, 33.4% of all visits to the emergency department were made by patients who were categorized as having low-acuity conditions and were discharged home after their visit.
It’s not clear exactly what proportion of people who go to the emergency department for low-acuity conditions could be treated by a primary care provider. Patients with low-acuity conditions may need emergency department care, for example, to deal with a complex wound.
In 2013/14, an estimated one in five emergency department visits in Canada by patients who were not admitted to hospital were for conditions that can be treated at a doctor’s office or clinic, such as sore throats and ear infections.[20]
Nor is it clear how much the number of low-acuity patients flowing into emergency departments affect the quality of care received by all emergency patients.
Certainly, low-acuity patients, like all patients, contribute to whatever overcrowding exists in emergency departments. As well, their care requires the use of limited emergency department resources such as doctors, nurses, medical technicians, clerical staff, equipment, and diagnostic imaging services, which may affect the availability of those resources for the care of sicker patients.
However, low-acuity patients are usually the quickest and easiest to deal with and data show they are in and out the fastest. They probably do not slow down the flow of patients as much as, for example, high-acuity patients who need a lot of tests and consultations or who occupy space in emergency departments for hours while waiting for admission to hospital.
An Ontario study that looked at all visits to emergency departments over a one-year period found that the presence of low-acuity patients
was associated with an insignificant increase for other emergency patients in length of stay and wait time to see a doctor. It concluded that reducing the number of low-acuity patients was unlikely to lessen emergency department crowding or shorten stays or waits to see a doctor for other patients.[21]
Treating a patient with a low-acuity condition in primary care may be less expensive than treating them in an emergency department. The average cost of a visit to emergency in Canada has been estimated at five times the cost of a visit to a family practitioner – though the calculation of the average cost for an emergency visit included high-acuity patients.[22]
However, the marginal cost of treating a low-acuity patient in emergency may not be higher in some cases – considering the emergency department resources required are usually already in place, while the primary care resources required to provide the same service may not be.

The extent to which Ontarians use emergency departments for low-acuity conditions appears to be related at least partially to a problem in another part of the health system – lack of timely access to primary care.
In a 2014 survey, 94% of people in the province aged 16 and over said they had a family doctor or other primary care provider, but only 44% reported being able to get an appointment with them the same or next day when they were ill.[23]
In 2013, almost half of adult Ontarians – 47% – reported going to the emergency department for a condition they thought could have been treated by their primary care provider, if that doctor, nurse practitioner or other provider had been available. This rate was higher for Ontario than for its socioeconomically similar international counterparts, with Switzerland coming in at 36% and France lowest at 24% (Figure 9).[24]
FIGURE 9Percentage of adults who report that the last time they went to the hospital emergency department it was for a condition that they thought could have been treatedbythedoctorsorstaffattheplacewheretheyusuallygetmedicalcareif they had been available, in Canada and internationally, 2013
Data source: 2013 Commonwealth Fund International Health Policy Survey of the General Public Notes: Within Canada, there is no statistically significant difference between Ontario and the other provinces. Internationally, there is a statistically significant difference* between Ontario, Australia, France, Germany, the Netherlands, New Zealand, Norway, Switzerland, and the United Kingdom. See Methods Notes for a description of statistical significance
Percent
100
80
60
40
20
0
Provinces/Countries
Ontario
Can
ada
Uni
ted
Sta
tes
Sw
eden
Sw
itzer
land
Uni
ted
Kin
gdom
Ger
man
y
Nor
way
Net
herla
nds
Aus
tral
ia
New
Zea
land
Fran
ce
47 46 44 41 36* 34*
30* 30* 29* 27* 26* 24*
33Health Quality Ontario | Under Pressure: Emergency department performance in Ontario
3. A Different Emergency Department for Different Ontarians

4. The Road Ahead
Photo of Joy McCarron by Roger Yip. See her story on page 16.
4. The Road Ahead
35Health Quality Ontario | Under Pressure: Emergency department performance in Ontario
4. The Road Ahead
Some of the quality improvement measures undertaken by hospitals include:
• Rapid referral clinics to get patients referred quickly to specialists outside the emergency department when appropriate
• Setting up “medical directives” under which nurses can order certain tests and procedures for certain conditions to speed up the diagnostic process
• Streaming patients to specialized zones for treating particular types of health issues such as heart problems or mental illness
• Streaming low-acuity patients to separate urgent care centres inside their emergency departments to free up resources for high-acuity patients
• Establishing medical assessment units to accept and monitor some emergency patients before they may be discharged or admitted
• Extending hours for diagnostic imaging services so fewer patients have to occupy emergency beds for hours while waiting for ultrasound or CT scans
• Bringing other health professionals such as orthopedic technicians, medical lab assistants and physiotherapists into emergency departments to allow doctors and nurses time to deal with more patients
• Implementing the Emergency DepartmentProcess Improvement Program to helpemergency departments reduce patient lengthof stay, based on “Lean” methodologies aimedat identifying and removing unnecessary stepsin a work process
• Expanding alternatives to emergencydepartment services by improving support forpatients with chronic conditions, creating moreurgent care centres and working to increasepublic awareness of other places to receiveimmediate, unscheduled health care
• Supporting faster discharge from hospital ofpatients requiring an alternate level of care,by increasing home care and community careservices and developing long-term care beds
The provincial government’s Patients First: Action Plan for Health Care also includes funding and measures to reduce emergency department length of stay.
Ontario hospitals and long-term care homes, as well as other parts of the health system, have worked in concert with the government to make changes aimed at addressing some of the challenges that affect emergency department performance. Hospitals have adopted process improvement programs, worked to meet targets and worked to take advantage of Pay for Results incentives.
A considerable effort has been made in recent years to improve emergency department performance, by the Ontario government and by hospitals across the province.
In 2008, the government launched its Emergency Room Wait Times Strategy to reduce lengths of stay in the province’s emergency departments. That strategy was expanded in subsequent years and has included:
• Measuring and reporting on patient time spentin the emergency department, and measuringpatient satisfaction
• Setting targets by acuity for emergencydepartment lengths of stay:
• at a maximum of eight hours at the 90thpercentile for high-acuity dischargedpatients or admitted patients (meaningnine out of 10 patients should completetheir visit within eight hours)
• at a maximum of four hours at the 90thpercentile for low-acuity dischargedpatients (meaning nine out of 10 patientsshould complete their visit within four hours)
• Implementing a Pay for Results program thatprovides financial incentives to hospitals forcontinued performance improvement andhigh sustained performance in emergencydepartment patient length of stay
36 Health Quality Ontario | Under Pressure: Emergency department performance in Ontario
4. The Road Ahead
• Using patient flow coordinators and discharge planners to improve the movement of patients through hospitals and their emergency departments
Health Quality Ontario has launched an Emergency Department Return Visit Quality Program to monitor return visits to hospital emergency departments to identify adverse events and quality issues. The program is mandatory for all 73 high-volume emergency departments participating in the Pay for Results program, but all Ontario hospitals are encouraged to participate.
Programs in the community have also been developed to keep patients from needing to go to the emergency department. They include:
• Having “advance practice paramedics” monitor patients with chronic health issues in their own homes
• The establishment of Health Links to better coordinate the care of patients with chronic or complex health conditions
• The adoption of the Home First strategy to help hospital inpatients be discharged to their own homes with home care in place, rather than remaining in hospital to wait for a place in a long-term care home
• Participation by long-term care homes in programs to reduce emergency department visits by their residents
Given all that has been done, it’s difficult to know precisely how and to what degree each of these initiatives has helped reduce emergency department length of stay and wait time to see a doctor, or improved performance in other quality measures. What’s needed now is careful evaluation of the actions that have been taken to determine which have been most effective and how they should be carried into the future.
But that won’t likely be enough. As Ontario’s population grows and ages and emergency visits continue to increase, the pressure on emergency departments to handle more and sicker patients with greater efficiency – and on the health system to help keep patients from needing emergency care – will likely continue and even intensify.

37Health Quality Ontario | Under Pressure: Emergency department performance in Ontario
Methods Notes
Methods NotesBelow is a brief description of the methods used in this report. For more detail, please see the Technical Appendix on our website (www.hqontario.ca).
Data sourcesThe findings presented in this report are based on analysis of administrative and survey data, as well as on stories from patients and caregivers with lived experience.
Results were obtained from the following data providers: the Institute for Clinical Evaluative Sciences (ICES), the Ontario Ministry of Health and Long-Term Care and Social Science Research Solutions.
Indicator selectionTimely access to emergency department care is important to patients, health care providers and the public. Measuring the use of hospital emergency departments and the length of patients’ visits, as well as changes in these measures over time, provides information not only about care within hospitals but also about how well other parts of the health system are working. For these reasons, this report focuses on who accesses emergency departments, how long they wait to see a physician and how long their visits take. Where possible, changes over time are reported.
Key measures of emergency department performance in this report include:
• 90th percentile emergency department wait time to physician initial assessment
• 90th percentile emergency department length of stay
• 90th percentile emergency wait time for inpatient bed for admitted patients
The following data sources were used:
• 2013 Commonwealth Fund International Health Policy Survey of the General Public (Commonwealth Fund Survey)
• 2014/15 Health Care Experience Survey (HCES)
• National Ambulatory Care Reporting System (NACRS)
• Registered Persons Database (RPDB)
Defining emergency department visitsEmergency department (ED) use was based on all unplanned ED visits by Ontarians, as identified in the NACRS. These visits and the population identified served as the basis for the rest of the indicators analyzed using administrative databases.

Methods Notes
38 Health Quality Ontario | Under Pressure: Emergency department performance in Ontario
In addition, information about Ontarians’ recent use of emergency departments and their perception of the care they received while there is provided using survey data. Specifically:
• The percentage of adults (aged 16 and older) in Ontario who visited an emergency department because they were sick or had a health-related problem in the previous 12 months (HCES)
• The percentage of adults (aged 16 and older) in Ontario who reported receiving excellent/very good/good or fair/poor medical care in the emergency department (HCES)
• The percentage of adults who reported that the last time they went to a hospital emergency department it was for a condition that they thought could have been treated by the doctors or staff at the place where they usually get medical care if they had been available (Commonwealth Fund Survey)
• “High-acuity discharged” includes patients with CTAS scores of 1, 2 or 3 and visit disposition of 01, 04-05 or 08-15 (discharged, transferred)
• “Low-acuity discharged” includes patients with CTAS scores of 4 or 5 and visit disposition of 01, 04-05 or 08-15 (discharged, transferred)
• “Admitted” includes patients with any CTAS score (CTAS 1-5), and patients missing a CTAS score, who have a visit disposition of 06 (admitted into the reporting facility as an inpatient to critical care unit or operating room directly from the ambulatory care visit functional centre) or 07 (admitted into the reporting facility as an inpatient to another unit of the reporting facility directly from the ambulatory care visit functional centre)
Data from the 2014/15 Health Care Experience Survey were weighted to reflect the design characteristics of the survey and the population of Ontario. Urban/rural status is defined using Statistics Canada’s Statistical Area Classification. Respondents who answered “don’t know” or who “refused” are excluded from results.
Analysis To better understand how different populations utilize and experience care at emergency departments, utilization and wait times were examined using select stratifications such as age group, sex, rural/urban location of the patient and hospital, neighbourhood income, immigration status, hospital type and patient group.
Time to physician initial assessment, wait time for an inpatient bed for admitted patients and emergency department length of stay are measured in this report at the 90th percentile – the amount of time within which nine out of 10 patients saw a doctor or completed their visit. The 90th percentile indicator was chosen because it represents the maximum wait to see a doctor or length of stay for the vast majority – 90% – of patients.
For the purposes of the emergency department wait time indicators used in this report, patients are divided into three groups according to Canadian Triage and Acuity Scale (CTAS) scores and visit disposition status as found in the NACRS. The three patient groups are as follows:

39Health Quality Ontario | Under Pressure: Emergency department performance in Ontario
Methods Notes
Data from the 2013 Commonwealth Fund International Health Policy Survey of the General Public are based on participants 18 years of age and older who were interviewed by telephone (land line or cellphone) between March and June 2013. In Canada, 5,412 respondents were surveyed; the Ontario population was oversampled (1,543 respondents) to enable the calculation of provincial estimates from the survey.
For a full list of data sources and methods as they relate to each indicator, please refer to the Technical Appendix.
Significance testingSignificance testing was not performed for administrative data.
Health Care Experience Survey data significance testingConfidence intervals around each result were calculated at the 95% confidence level. Results from the HCES state an increase/decrease or higher/lower result only when the 95% confidence intervals of the results do not overlap (i.e., when the differences in the results are statistically significant).
Commonwealth Fund survey data significance testingSocial Sciences Research Solutions conducted statistical analyses to compare responses across countries and provinces within Canada. For provincial comparisons, statistical tests were conducted to compare each province’s responses to those of every other province and to Canada as a whole. Ontario’s results were also compared to other countries. Significance was assessed based on a P-value of less than 0.05, meaning that there was less than a 5% probability that the difference was due to chance rather than real differences in respondents’ experiences.
LimitationsThere are certain limitations of the analysis that should be considered when interpreting the results. Some of the limitations are specific to the data source, the indicator and the methodology used to calculate it. For further details, please see the individual Indicator Templates in the online Technical Appendix.

40 Health Quality Ontario | Under Pressure: Emergency department performance in Ontario
Acknowledgments
Management Dr. Joshua Tepper President and Chief Executive Officer
Dr. Irfan Dhalla Vice President, Evidence Development and Standards
Lee Fairclough Vice President, Quality Improvement
Mark Fam Vice President, Corporate Services
Anna Greenberg Vice President, Health System Performance
Jennie Pickard Director, Strategic Partnerships
Michelle Rossi Director, Policy and Strategy
Jennifer Schipper Chief of Communications and Patient Engagement
Dr.JeffreyTurnbullChief, Clinical Quality
Biographies are posted at: www.hqontario.ca/about-us/executive-leadership-team
Board Andreas Laupacis Chair
Marie E. Fortier Vice-Chair
Richard Alvarez
Tom Closson
Jeremy Grimshaw
Shelly Jamieson
Stewart Kennedy
Julie Maciura
Angela Morin
James Morrisey
Rick Vanderlee
Tazim Virani
Biographies are posted at: www.hqontario.ca/about-us/governance
Acknowledgments
41Health Quality Ontario | Under Pressure: Emergency department performance in Ontario
Acknowledgments
Report development Health Quality Ontario thanks the patients and providers who shared their personal stories: David and Paula, Donald, Rosemary, Graham Slaughter, Ian Chernof, and Joy McCarron
This report was developed by a muti-disciplinary team from Health Quality Ontario, including Susan Brien, Gail Dobell, Ryan Emond, Louise Grenier, Sharon Gushue, Isra Khalil, Jonathan Lam, Eseeri Mabira, Ivana McVety, and Marianne Takacs.
Health Quality Ontario thanks the many dedicated people who contributed to this report, including those who reviewed the draft or provided input at different stages of development:
Aamir Bharmal, Lucas Chartier, Allison Costello, Imtiaz Daniel, Charissa Fajardo, Jessica Hill, Sarah Newberry, Hindy Ross, Michael Schull, Colleen Wong and the Emergency Department LHIN Leads: Andrew Affleck, Gary Bota, Ian Digby, Jonathan Dreyer, Ken Edwards, William (Bill) Krizmanich, Rakesh Kumar, Eric Letovsky, Gary Mann, Naveed Mohammad, David Ng, Howard Ovens, Rebecca Van Iersel, and Shaun Visser.
Notes: Some of the indicators in this report were derived using health administrative datasets from Ontario. These datasets were linked using unique encoded identifiers and analyzed at ICES.
ICES is funded by an annual grant from the Ontario Ministry of Health and Long-Term Care. The opinions, results and conclusions reported in this paper are those of the authors and are independent from the funding sources. No endorsement by the Institute for Clinical Evaluative Sciences or the Ontario Ministry of Health and Long-Term Care is intended or should be inferred.
Additionally, parts of this material are based on data and information compiled and provided by CIHI. However, the analyses, conclusions, opinions and statements expressed herein are those of the author, and not necessarily those of CIHI.
42 Health Quality Ontario | Under Pressure: Emergency department performance in Ontario
References
References1 Canadian Institute for Health Information, Understanding Emergency
Department Wait Times: Access to Inpatient Beds and Patient Flow, Ottawa, Ont., 2007. Available from: https://secure.cihi.ca/free_products/Emergency_Department_Wait_Times_III_2007_e.pdf
2 Data Source: National Ambulatory Care Reporting System, Canadian Institute for Health Information
3 Ontario Ministry of Finance. Ontario population projections update, 2015-2041—III. Projections results. Spring 2016 [cited 2016 Aug 9]. Available from: http://www.fin.gov.on.ca/en/economy/demographics/projections/
4 Melady D. Geri-EM. Personalized e-learning in geriatric emergency medicine. Schwartz-Reisman Emergency Centre, Mount Sinai Hospital, Toronto; 2013 [cited 2016 Aug 9]. Available from: http://geri-em.com/
5 Canadian Institute for Health Information, Emergency Department Visits 2014-2015, Ottawa, Ont. Available from: https://secure.cihi.ca/free_products/NACRS_ED_QuickStats_Infosheet_2014-15_ENweb.pdf
6 Beveridge R, Clarke B, Janes L, Savage N, Thompson J, Dodd G, Murray M, Nijssen-Jordan C, Warren D, Vadeboncoeur A. Implementation Guidelines, Canadian Association of Emergency Physicians, 2016 [cited 2016 Aug 9]. Available from: http://caep.ca/resources/ctas/implementation-guidelines
7 Physician Hospital Care Committee, a tripartite committee of the Ontario Hospital Association, the Ontario Medical Association and the Ontario Ministry of Health and Long-Term Care, Improving Access to Emergency Care: Addressing System Issues, August 2006. [cited 2016 Aug 9]. Available from: http://www.health.gov.on.ca/en/common/ministry/publications/reports/improving_access/improving_access.pdf
8 Schull MJ, Vermeulen M, Guttmann A, Stukel T. Better performance on length-of-stay benchmarks associated with reduced risk following emergency department discharge: an observational cohort study. Canadian Journal of Emergency Medicine. 2015; 17(3):253-262
9 Guttmann A, Schull MJ, Vermeulen MJ, Stukel TA. Association between waiting times and short term mortality and hospital admission after departure from emergency department: population based cohort study from Ontario, Canada. BMJ 2011; 342:d2983
10 Bernstein SL, Aronsky D, Duseja R, Epstein S, Handel D, Hwang U, McCarthy M, McConnell KJ, Pines JM, Rathlev N, Schafermeyer R, Zwemer F, Schull M, Asplin BR. The effect of emergency department crowding on clinically oriented outcomes. Society for Academic Emergency Medicine, Emergency Department Crowding Task Force (2008). [cited 2016 Aug 10]. Available from: http://onlinelibrary.wiley.com/doi/10.1111/j.1553-2712.2008.00295.x/full
11 Data Source: Emergency Department Reporting System (EDRS)(April 2008 to October 2009) & National Ambulatory Care Reporting System (NACRS) Level 1 (November 2009 to March 2015, provided by Access to Care, Cancer Care Ontario

43Health Quality Ontario | Under Pressure: Emergency department performance in Ontario
References
12 Rowe BH, Channan P, Bulllard M, Blitz S, Saunders D, Roseychuk RJ, Lari H, Craig WR, Holroyd BR. (2006). Characteristics of patients who leave emergency departments without being seen. Academic Emergency Medicine. 13 (8): 848 – 852.
13 Data Source: Health Care Experience Survey, provided by the Ministry of Health and Long-Term Care.
14 Affleck A, Parks P, Drummond A, Rowe BH, Ovens HJ. Emergency department overcrowding and access block. (2013). Canadian Journal of Emergency Medicine. 15(6): 359-370. [cited 2016 Aug 12]. Available from: http://caep.ca/sites/caep.ca/files/caep/PositionStatments/edoc_document_final_eng.pdf
15 Auditor General of Ontario, Hospital emergency departments, 2010 Annual Report of the Office of the Auditor General of Ontario (Chapter. 3, Section. 3.05), 2010. cited 2016 Aug 10]. Available from: http://www.auditor.on.ca/en/content/annualreports/arreports/en10/305en10.pdf
16 Cancer Care Ontario, Wait Time Information System and Bed Census Summary.
17 Data Source: Statistics Canada. Population, urban and rural, by province and territory (Ontario) www.statcan.gc.ca/tables_tableaux/sum-som/101/cst01/demo62g-eng.htm
18 Mian O, Pong R. Does better access to FPs decrease the likelihood of emergency department use? Results of the Primary Care Access Survey. Canadian Family Physician. 2012. 58 (11); e658-e666.
19 North West Local Health Integration Network. 2015–2016 North West Local Health Integration Network Annual Business Plan. [cited 2016 Aug 10]. Available from: http://www.northwestlhin.on.ca/accountability/annualbusinessplan.aspx
20 Canadian Institute for Health Information, Sources of Potentially Avoidable Emergency Department Visits, Ottawa, Ont. 2014. Available from: https://secure.cihi.ca/free_products/ED_Report_ForWeb_EN_Final.pdf
21 Schull MJ, Kiss A, Szalai JP. The effect of low-complexity patients on emergency department waiting times. Annals of Emergency Medicine. 2007. 49 (3); 257 – 264 [cited 2016 Aug 10]. Available from: http://www.annemergmed.com/article/S0196-0644(06)00884-5/pdf
22 Canadian Institute for Health Information. Hospital cost drivers technical report. What factors have determined hospital expenditure trends in Canada? Ottawa, Ont.: CIHI, 2012 [cited 2016 Aug 10]. Available from: https://www.cihi.ca/en/hospital_costdriver_tech_en.pdf
23 Health Quality Ontario. Quality in primary care: setting a foundation for monitoring and reporting in Ontario. Toronto: Queen’s Printer for Ontario; 2015.
24 Data Source: Commonwealth Fund International Health Policy Survey 2013 of the General Public, provided by Social Sciences Research Solutions.

Health Quality Ontario 130 Bloor Street West 10th FloorToronto, ON M5S 1N5
Telephone: 416-323-6868 Toll-free: 1-866-623-6868 Email: [email protected] www.hqontario.ca
© Queen’s Printer for Ontario, 2016