underfloor heating demo report
TRANSCRIPT
Demonstration Thermography report
Company
Device
Customer
E-Mail: [email protected]
Phone: 01420 544433
Andy McGrath
Tester:
32 degree wide angle lensLens:
1434423Serial No.:Testo 880-3
Alton
Thermal Street
A N Other Underfloor HeatingCo
29th January 2009Measuring Date:
Alton
Underfloor Heating System
Office Floor
Measuring Site:
Demonstration Thermography Report, to demonstrate the Capabilities ofthe Testo 880 series Thermal Imaging camera and the Testo IR software
Task
Alton, GU34 2QJ
Newman Lane
Testo Ltd
1/7Page
Demonstration Thermography report
File:
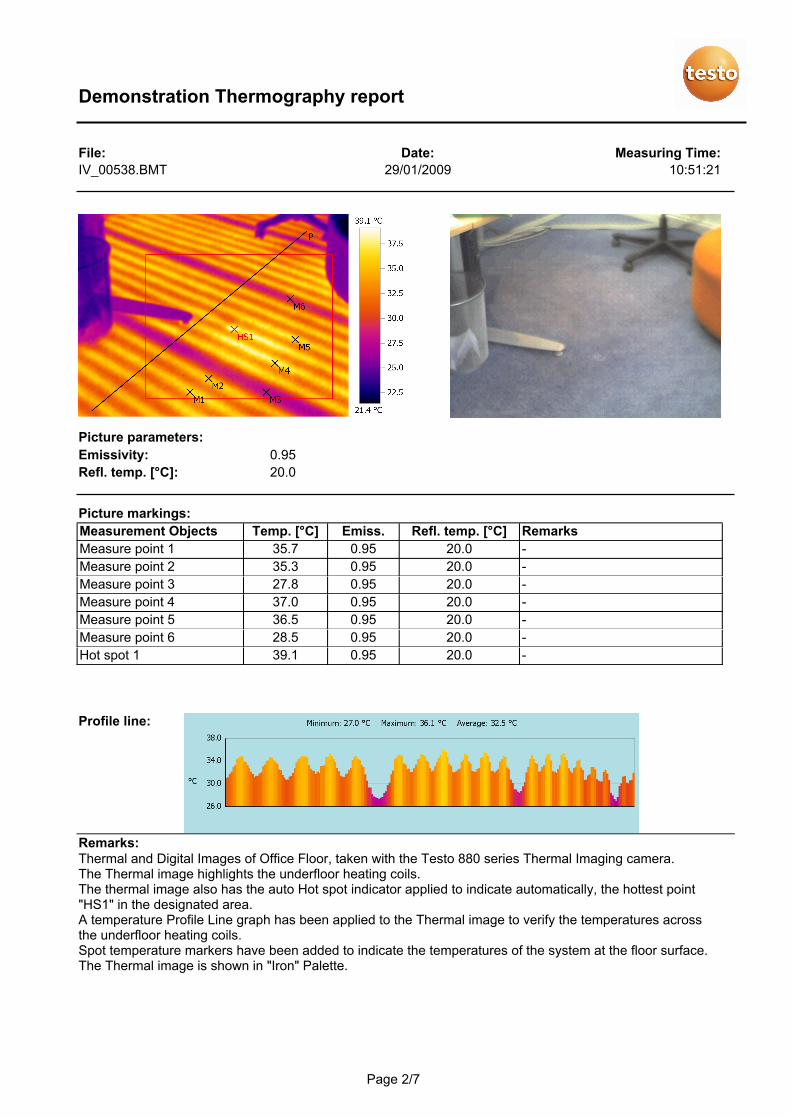
IV_00538.BMT 29/01/2009
Measuring Time:
10:51:21
20.0Refl. temp. [°C]:
0.95Emissivity:
Picture parameters:
Date:
Picture markings:
RemarksRefl. temp. [°C]Emiss.Temp. [°C]Measurement Objects
-20.00.9535.7Measure point 1
-20.00.9535.3Measure point 2
-20.00.9527.8Measure point 3
-20.00.9537.0Measure point 4
-20.00.9536.5Measure point 5
-20.00.9528.5Measure point 6
-20.00.9539.1Hot spot 1
Profile line:
Thermal and Digital Images of Office Floor, taken with the Testo 880 series Thermal Imaging camera.The Thermal image highlights the underfloor heating coils.The thermal image also has the auto Hot spot indicator applied to indicate automatically, the hottest point"HS1" in the designated area.A temperature Profile Line graph has been applied to the Thermal image to verify the temperatures acrossthe underfloor heating coils.Spot temperature markers have been added to indicate the temperatures of the system at the floor surface.The Thermal image is shown in "Iron" Palette.
Remarks:
2/7Page
Demonstration Thermography report
File:
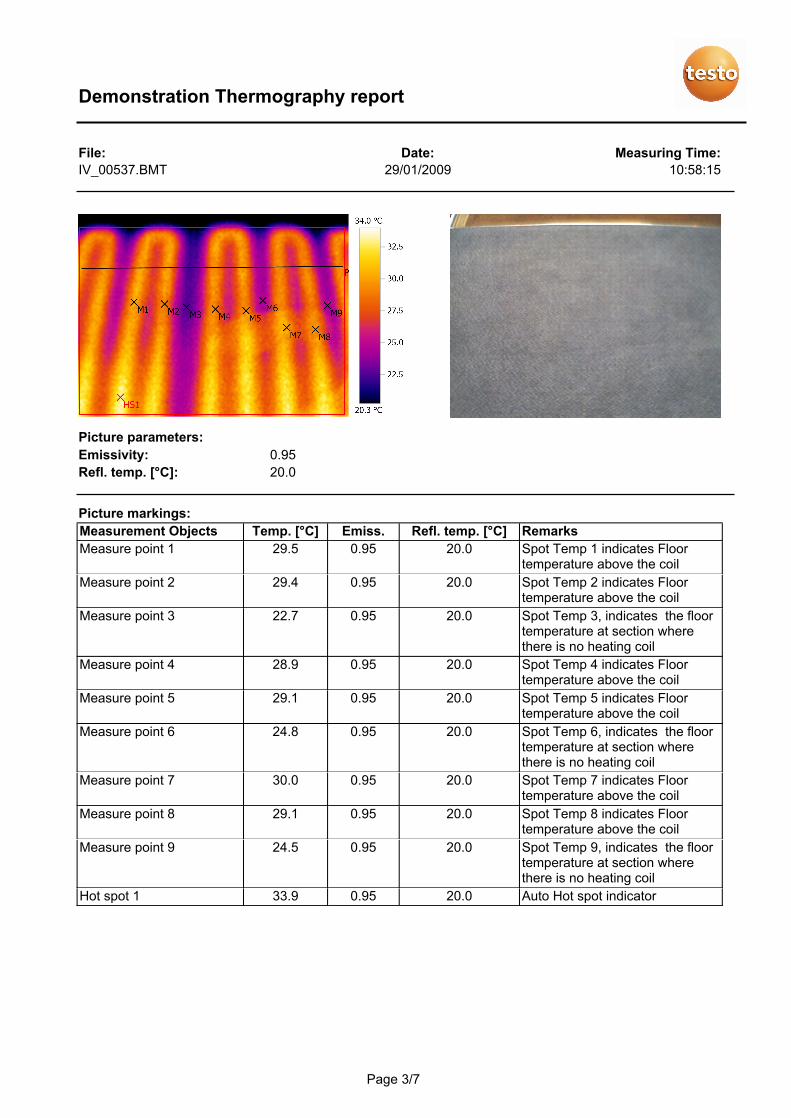
IV_00537.BMT 29/01/2009
Measuring Time:
10:58:15
20.0Refl. temp. [°C]:
0.95Emissivity:
Picture parameters:
Date:
Picture markings:
RemarksRefl. temp. [°C]Emiss.Temp. [°C]Measurement Objects
Spot Temp 1 indicates Floortemperature above the coil
20.00.9529.5Measure point 1
Spot Temp 2 indicates Floortemperature above the coil
20.00.9529.4Measure point 2
Spot Temp 3, indicates the floortemperature at section wherethere is no heating coil
20.00.9522.7Measure point 3
Spot Temp 4 indicates Floortemperature above the coil
20.00.9528.9Measure point 4
Spot Temp 5 indicates Floortemperature above the coil
20.00.9529.1Measure point 5
Spot Temp 6, indicates the floortemperature at section wherethere is no heating coil
20.00.9524.8Measure point 6
Spot Temp 7 indicates Floortemperature above the coil
20.00.9530.0Measure point 7
Spot Temp 8 indicates Floortemperature above the coil
20.00.9529.1Measure point 8
Spot Temp 9, indicates the floortemperature at section wherethere is no heating coil
20.00.9524.5Measure point 9
Auto Hot spot indicator20.00.9533.9Hot spot 1
3/7Page
Demonstration Thermography report
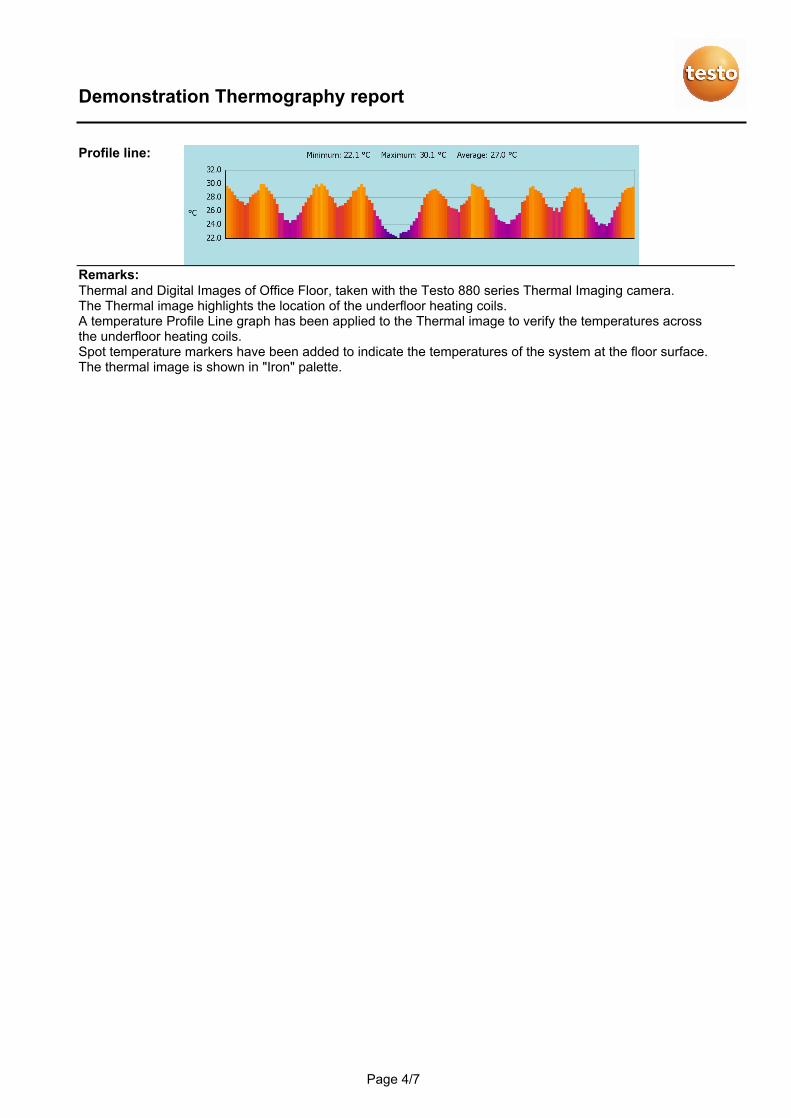
Profile line:
Thermal and Digital Images of Office Floor, taken with the Testo 880 series Thermal Imaging camera.The Thermal image highlights the location of the underfloor heating coils.A temperature Profile Line graph has been applied to the Thermal image to verify the temperatures acrossthe underfloor heating coils.Spot temperature markers have been added to indicate the temperatures of the system at the floor surface.The thermal image is shown in "Iron" palette.
Remarks:
4/7Page
Demonstration Thermography report
File:
IV_00535.BMT 29/01/2009
Measuring Time:
10:56:07
20.0Refl. temp. [°C]:
0.95Emissivity:
Picture parameters:
Date:
Picture markings:
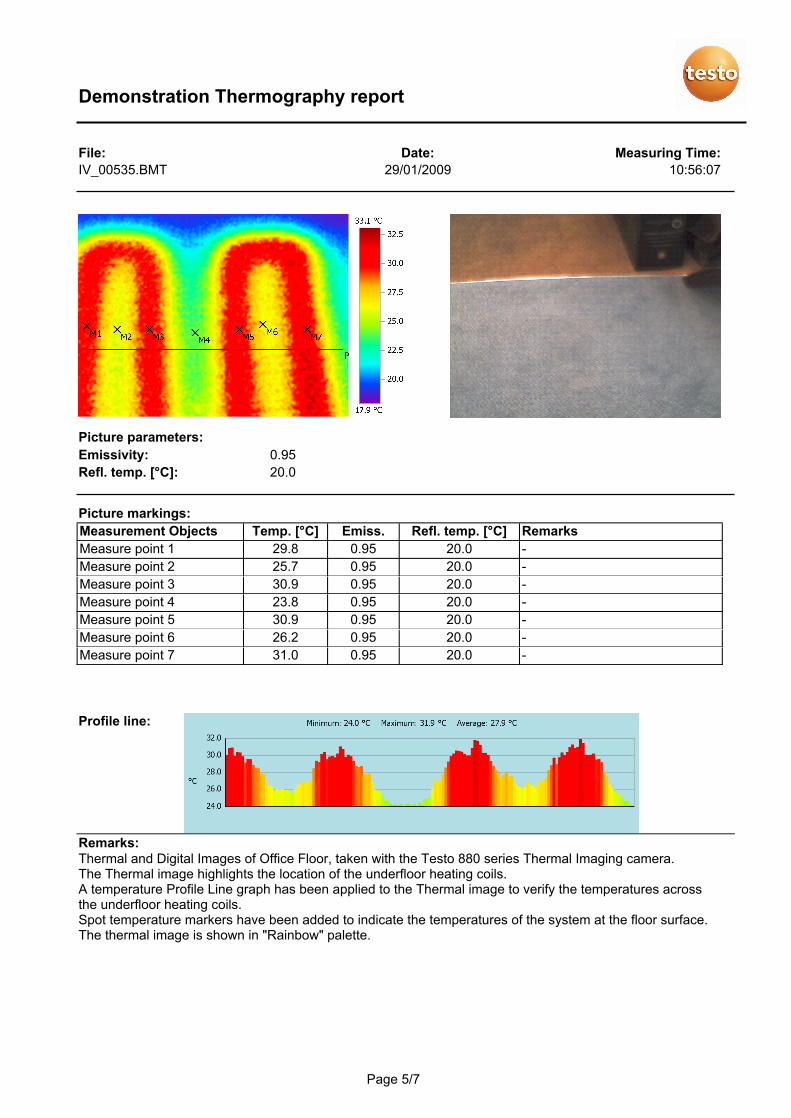
RemarksRefl. temp. [°C]Emiss.Temp. [°C]Measurement Objects
-20.00.9529.8Measure point 1
-20.00.9525.7Measure point 2
-20.00.9530.9Measure point 3
-20.00.9523.8Measure point 4
-20.00.9530.9Measure point 5
-20.00.9526.2Measure point 6
-20.00.9531.0Measure point 7
Profile line:
Thermal and Digital Images of Office Floor, taken with the Testo 880 series Thermal Imaging camera.The Thermal image highlights the location of the underfloor heating coils.A temperature Profile Line graph has been applied to the Thermal image to verify the temperatures acrossthe underfloor heating coils.Spot temperature markers have been added to indicate the temperatures of the system at the floor surface.The thermal image is shown in "Rainbow" palette.
Remarks:
5/7Page
Demonstration Report utilising the Testo 880 series Thermal Imaging camera and Testo IR software.The objective of the report is to demonstrate the the report producing capabilities of the software and the images captured with the Testo 880 series Thermal Imaging camera.The report is for demonstration purposes only.
This is an example of the "Standard" report template from the software, using images from the Testo 880 series Thermal Imaging camera compiled into a Report using the Testo IR software.
Thermal and Digital images of an Office Floor, with an Underfloor Heating system.
Demonstration Thermography report
File:
IV_00543.BMT 29/01/2009
Measuring Time:
10:58:56
20.0Refl. temp. [°C]:
0.95Emissivity:
Picture parameters:
Date:
Picture markings:
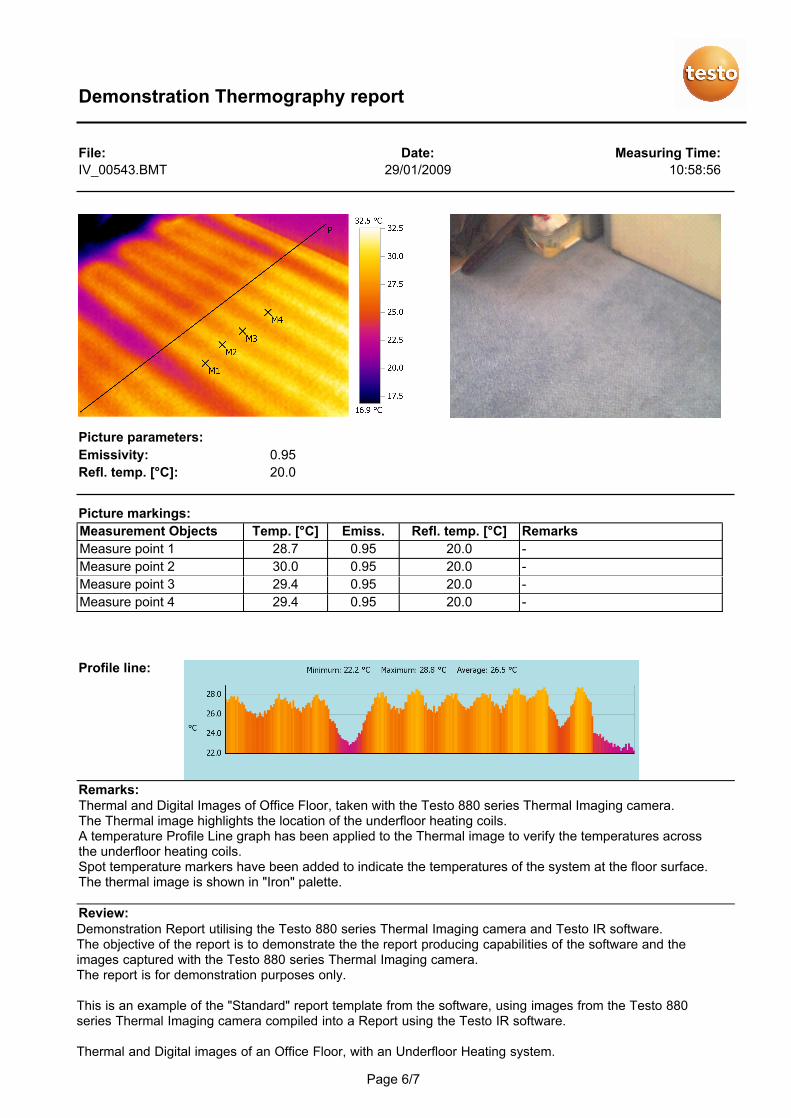
RemarksRefl. temp. [°C]Emiss.Temp. [°C]Measurement Objects
-20.00.9528.7Measure point 1
-20.00.9530.0Measure point 2
-20.00.9529.4Measure point 3
-20.00.9529.4Measure point 4
Profile line:
Thermal and Digital Images of Office Floor, taken with the Testo 880 series Thermal Imaging camera.The Thermal image highlights the location of the underfloor heating coils.A temperature Profile Line graph has been applied to the Thermal image to verify the temperatures acrossthe underfloor heating coils.Spot temperature markers have been added to indicate the temperatures of the system at the floor surface.The thermal image is shown in "Iron" palette.
Remarks:
Review:
6/7Page
Demonstration Thermography report
The Thermal images indicate the temperatures across the floor surface and verify the location and operation of the Underfloor Heating system.
Spot temperature measurements have been added to highlight the temperature variation.
Some of the Features of the camera/software have also been applied to the thermal images:
Auto Hot Spot Indicator, which automatically highlights the hottest point in the defined area.Temperature Profile Line Graph, shows the temperature variation across the office floor across the underfloor heating coils in graph form.
The thermal images have been presented in various palettes " Iron " and "Rainbow", from the selection of palettes available.The Thermal/Digital images are time and date stamped to verify the time and date when the images were taken.The report also stipulates the emissivity value relating to the thermal image.
Andy McGrath
,29/01/2009
7/7Page