underserved lending performance report: fy2015
TRANSCRIPT
Office of Economic Opportunity“Building Success in Underserved Markets”
Underserved Lending Performance Report: FY2015
U.S. Small Business AdministrationOffice of Economic Opportunity
OFN Conference and Annual MeetingNovember 2015

OEO Programs: FY15 Highlights
Community Advantage
• 61 (out of 100) CA Lenders madeat least 1 loan in 2015, a 35%increase in participation from FY14
• Loan Volume in FY15 increased by 83% over FY14
Office of Economic Opportunity “Building Success in Underserved Markets”2
Microloan Program ILP
Program ApprovedLoans
ApprovedDollars
AverageLoan Size
Microloan Program 3626 $51,023,262 $14,071
Intermediary Lending Pilot (ILP) Program 97 $7,796,834 $80,379
Community Advantage (CA) Pilot Program 828 $103,516,100 $125,019
Totals 4551 $162,336,196
• $34 million has been deployed to Intermediaries by end of FY15 and $38 million in loans were made to small businesses since inception (FY11)
• Program no longer has authority to add new program participants or loan additional capital*
Of 204 OEO Lenders, 143 Lenders made at least 5 loans
*Under Congressional Review
• 140 Microlenders made at least 1 microloan in 2015
• Microlenders closed loans at a rate of $1.51 for every $1.00 of SBA funds approved in FY15
• 7 new Microlenders approved in 2015

Top 25 OEO Lenders by Number of Loans, FY2015
Office of Economic Opportunity “Building Success in Underserved Markets”3
Lender OEO Programs# Loans Approved /Closed
$ Loan Approvals /Closed
1 Justine Petersen Housing & Reinvestment Corporation CA, Micro 368 $1,613,554 2 Business Center for New Americans Micro 266 $1,035,000 3 Economic and Community Development Institute Micro 218 $1,571,391 4 Finanta Micro 185 $1,624,400 5 LiftFund, Inc. CA, Micro 139 $6,676,688 6 Oregon Assoc. of Minority Entrepreneurs Credit Corp. Micro 131 $1,075,530 7 CDC Small Business Finance Corp. CA, Micro 122 $11,729,075 8 Valley Economic Development Corporation CA, Micro 122 $9,733,416 9 Accion East dba ACCION USA, Inc. Micro 105 $1,173,452 10 Rural Enterprise Assistance Proj‐Ctr for Rural Affairs Micro 97 $679,575 11 Flagship Enterprise Center, Inc. Micro 90 $2,950,002 12 Wisconsin Women's Business Initiative Corporation CA, Micro 88 $5,076,597 13 Renaissance Economic Development Corporation Micro 76 $1,662,695 14 Cooperative Business Assistance Corporation CA, Micro 73 $1,744,298 15 PeopleFund CA, Micro 68 $4,304,953 16 Community Ventures Corporation Micro 67 $420,820 17 Northeast Entrepreneur Fund, Inc. Micro 64 $672,068 18 OBDC Small Business Finance CA, Micro 63 $7,378,600 19 Trenton Regional Business Assistance Corp. CA, Micro 61 $5,190,567 20 ECDC Enterprise Development Group Micro 60 $1,313,422
21 Union County Economic Development Corporation CA, Micro 58 $1,604,294 22 Empire State Certified Develop CA, Micro 54 $7,635,900 23 North Carolina Minority Support Center CA 54 $6,031,400 24 BOC Capital Corporation Micro 51 $407,051 25 Mountain Bizcapital, Inc. CA 48 $964,750

Office of Economic Opportunity“Building Success in Underserved Markets”
Community Advantage Program
WHO ARE APPROVED CA LENDERS? FEBRUARY 2011 – September 30, 2015
4
100 CA Lenders approved nationwide 53 SBA Microlenders
41 SBA CDCs
68 Treasury-certified CDFIs
3 CA Lenders with “Nationwide” lending authority
38 Lenders authorized to sell on the Secondary Market
50 CA Lenders are tentatively eligible for delegated lending status, of these 10 have been granted full delegated status
1,757 CA Loans approved for $225 MM 83% of loans in urban areas
17% of loans in rural areas
Average loan size = $128,385 (and falling!!!)
Top Use of Proceeds = Inventory/ Working Capital (41%)
41 SBA CDCs
68 CDFIs
53 SBA Microlenders
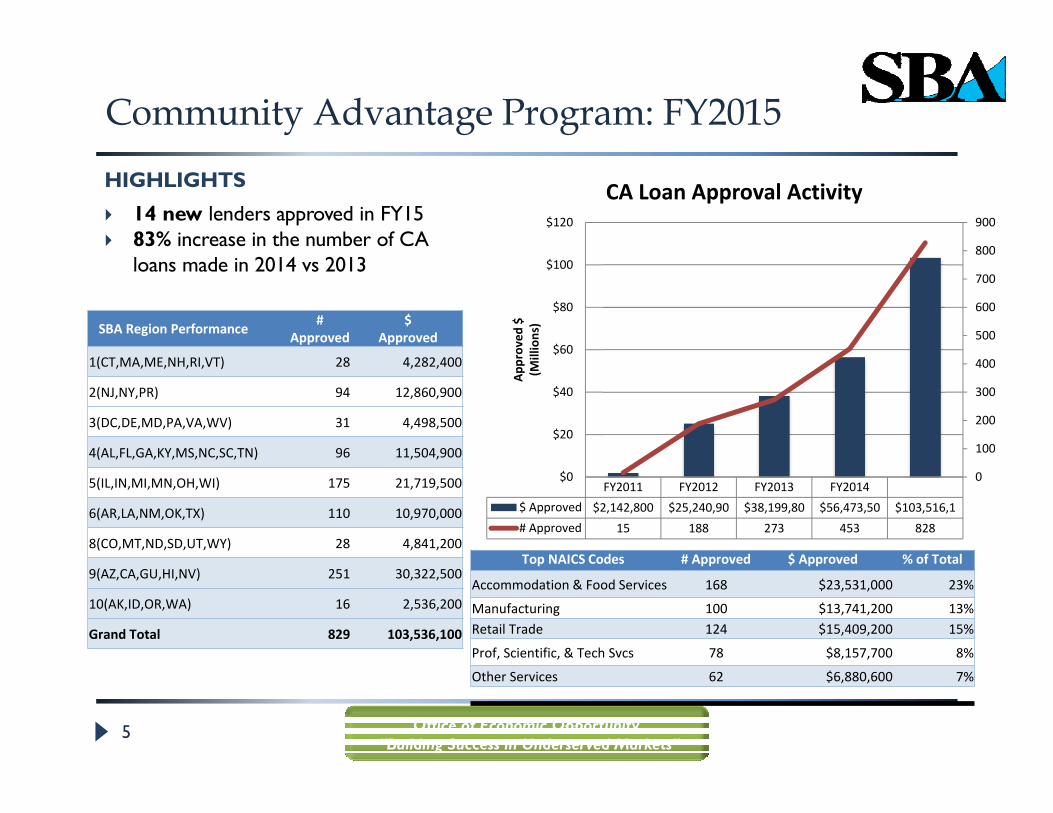
Community Advantage Program: FY2015HIGHLIGHTS
14 new lenders approved in FY15 83% increase in the number of CA
loans made in 2014 vs 2013
Office of Economic Opportunity “Building Success in Underserved Markets”
5
Top NAICS Codes # Approved $ Approved % of Total
Accommodation & Food Services 168 $23,531,000 23%
Manufacturing 100 $13,741,200 13%Retail Trade 124 $15,409,200 15%
Prof, Scientific, & Tech Svcs 78 $8,157,700 8%
Other Services 62 $6,880,600 7%
SBA Region Performance # Approved
$Approved
1(CT,MA,ME,NH,RI,VT) 28 4,282,400
2(NJ,NY,PR) 94 12,860,900
3(DC,DE,MD,PA,VA,WV) 31 4,498,500
4(AL,FL,GA,KY,MS,NC,SC,TN) 96 11,504,900
5(IL,IN,MI,MN,OH,WI) 175 21,719,500
6(AR,LA,NM,OK,TX) 110 10,970,000
8(CO,MT,ND,SD,UT,WY) 28 4,841,200
9(AZ,CA,GU,HI,NV) 251 30,322,500
10(AK,ID,OR,WA) 16 2,536,200
Grand Total 829 103,536,100
FY2011 FY2012 FY2013 FY2014$ Approved $2,142,800 $25,240,90 $38,199,80 $56,473,50 $103,516,1# Approved 15 188 273 453 828
0
100
200
300
400
500
600
700
800
900
$0
$20
$40
$60
$80
$100
$120
Approved
$(M
illions)
CA Loan Approval Activity

Office of Economic Opportunity “Building Success in Underserved Markets”
6
Community Advantage Program: FY2015
Top 10 CA Lenders by # Loans # Approved $ Approved
CDC Small Business Finance Corp. 93 $10,765,400
Valley Economic Development Corporation 65 $8,870,000
OBDC Small Business Finance 57 $7,108,600
LiftFund, Inc. 56 $6,004,200
Empire State Certified Develop 54 $7,635,900
North Carolina Minority Support Center 54 $6,031,400
PeopleFund 49 $4,004,800
Wisconsin Women's Business Initiative Corporation 46 $4,075,800
Growth Capital Corp. 41 $5,767,200
Trenton Regional Business Assistance Corp. 33 $4,347,000

Microloan Program
Since inception, Intermediaries loaned $721.9 million, to 59,304 small businesses; creating or retaining more than 211,749 jobs
Office of Economic Opportunity “Building Success in Underserved Markets”7
4,009 4,252
4,911
3,958 3,678
47 46
53 56
52
‐
10
20
30
40
50
60
‐
1,000
2,000
3,000
4,000
5,000
6,000
2011 2012 2013 2014 2015
$ Microloan
s Closed (M
illions)
# Microloan
s Closed
Microloan Activity: Loan Dollars vs Volume
# Microloans Closed $ Microloans Closed
0.0%
10.0%
20.0%
30.0%
40.0%
50.0%
Women AfricanAmericans
Hispanic Asian
% of Loans App
roved
Lending by Demographics, FY 2015
7a
CA
504
Micro
Microloan Final Rule – Loans to Associates on parole or probation now eligible

Microloan Program: FY2015
Office of Economic Opportunity “Building Success in Underserved Markets”
Top 10 Microlenders by # Loans # $ ApprovedJustine Petersen Housing & Reinvestment Corporation 367 $1,463,554
Business Center for New Americans 266 $1,035,000
Economic and Community Development Institute 218 $1,571,391
Finanta 185 $1,624,400
Oregon Assoc. of Minority Entrepreneurs Credit Corp. 131 $1,075,530
Accion East dba ACCION USA, Inc. 105 $1,173,452
Rural Enterprise Assistance Proj‐Ctr for Rural Affairs 97 $679,575
Flagship Enterprise Center, Inc. 83 $1,693,002
LiftFund, Inc. 83 $672,488
Renaissance Economic Development Corporation 76 $1,662,695
8

ILP Program: Overall Summary
• 36 Participating ILP Intermediaries
• Each Intermediary received a $1 million SBA Loan to make loans of $200,000 or less to eligible small businesses $34 million has been disbursed to
ILP Intermediaries $37 million has been deployed to
small businesses, thus far
• Program no longer has authority to add new program participants or loan additional capital*
* Under Congressional Review
ILP Intermediary Loan Activity
Year # ILP Loans $ ILP Loans
FY2011 1 $200,000
FY2012 94 $7,134,984
FY2013 139 $13,077,716
FY2014 102 $8,792,654
FY2015 97 $7,796,834TOTALS 336 $37,002,188
Relending requirement will ensure funds are continually revolved over the 20 year term of the SBA Loans
Office of Economic Opportunity “Building Success in Underserved Markets”9

PRIME
Eligible applicants: Non-profit microenterprise development organizations & Intermediaries with record of delivering services to disadvantaged entrepreneurs
Office of Economic Opportunity “Building Success in Underserved Markets”10
Track 1 – max grant $150,000
Training & TA to disadvantaged entrepreneurs
Track 2 – max grant $250,000
Training & TA to microenterprise development organizations (Capacity Building grant)
FY15: Awarded $5 million
FY16: TBD; Will post at
www.Grants.gov

Office of Economic Opportunity“Building Success in Underserved Markets”
LINC (Leveraging Information & Networks to access Capital)
11
Small Business Owner
Small Business Owner
Small Business Owner
LINC 20 Questions
Bank 1 Bank 2 CDC CDFI Micro-lender
The borrower enters basic business information into SBA’s online LINC tool…
…That information is passed through to SBA lenders

Office of Economic Opportunity“Building Success in Underserved Markets”
SWOT
12
• Simplicity Documentation SBA One
• Predictablilty – Extension Job #1
• Return- “No mission without Margin” Fees - Microloan Spread - CA
• Expansion Rule Revision - All CDFIs, multiple license, Co-ops Loan Participations Unique Brand – “Opportunity Networksm”
Network Conferences – Best Practices, Funder Leverage

Looking Ahead: FY 2016
• Policy Enhancements??? – CA 4.0
• Training series – Ex-prison population
• SBA One for Community Advantage
• LINC v 2.0 and beyond
• Monthly OEO Webinar Call – 4th
Wednesday of each month• [email protected]
Office of Economic Opportunity “Building Success in Underserved Markets”
13