understanding analysis reports in hp loadrunner...
TRANSCRIPT
Understanding Analysis Reports
In HP LoadRunner
>>>>>>>>>>>>>>>>>>>>>> www.softwaretestinggenius.com <<<<<<<<<<<<<<<<<<<<<<
Understanding Analysis Reports
Service Level Agreement (SLA) Summary Report Creating Reports
>>>>>>>>>>>>>>>>>>>>>> www.softwaretestinggenius.com <<<<<<<<<<<<<<<<<<<<<<
SLA (Service Level Agreement)
Depending on your defined goal, LoadRunner determines SLA statuses in one of the following ways:
SLA status determined at time intervals over a timeline. Analysis displays SLA statuses at set time intervals (for example, every 5 seconds) over a timeline within the run.
SLA status determined over the whole run. Analysis displays a single SLA status for the whole scenario run.
SLAs can be defined before running a scenario in the Controller, or after in Analysis itself.
>>>>>>>>>>>>>>>>>>>>>> www.softwaretestinggenius.com <<<<<<<<<<<<<<<<<<<<<<
SLA (Service Level Agreement)
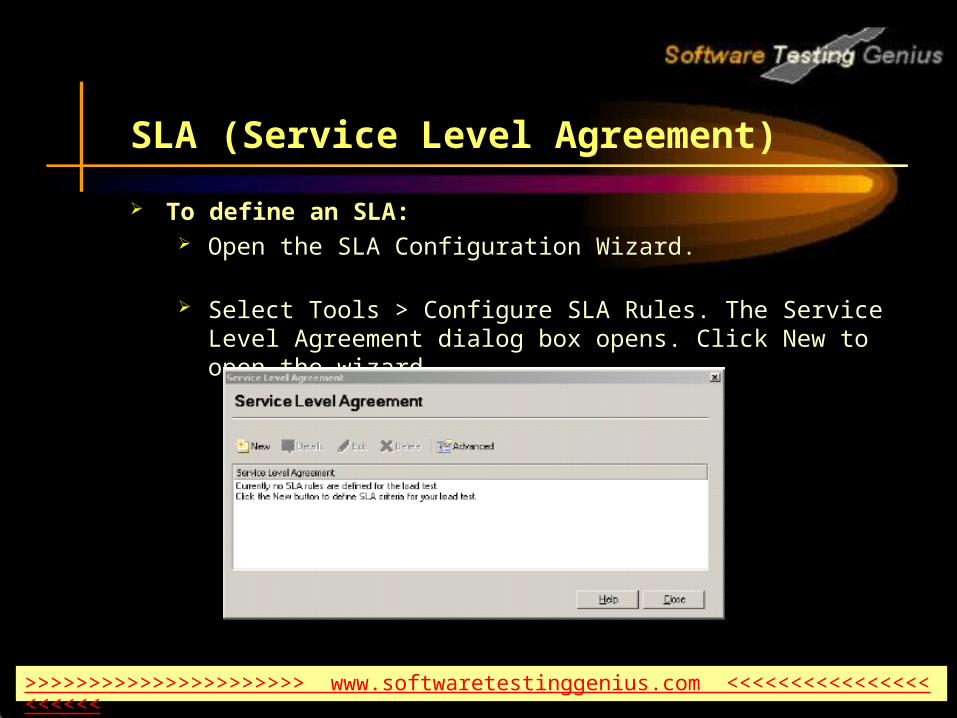
To define an SLA: Open the SLA Configuration Wizard.
Select Tools > Configure SLA Rules. The Service Level Agreement dialog box opens. Click New to open the wizard.
>>>>>>>>>>>>>>>>>>>>>> www.softwaretestinggenius.com <<<<<<<<<<<<<<<<<<<<<<
SLA (Service Level Agreement)
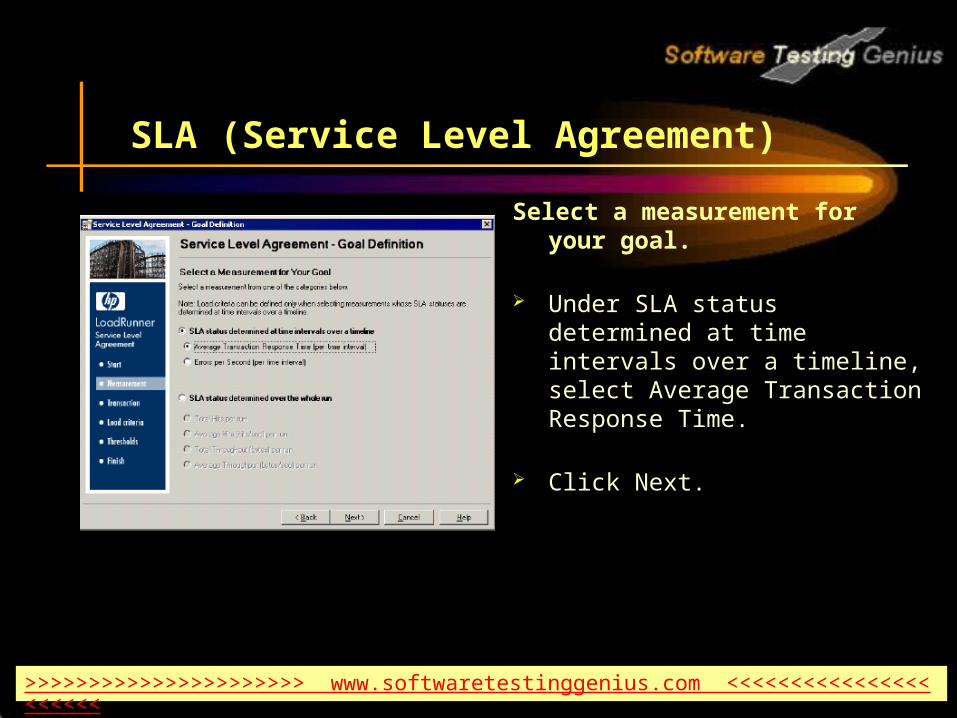
Select a measurement for your goal.
Under SLA status determined at time intervals over a timeline, select Average Transaction Response Time.
Click Next.
>>>>>>>>>>>>>>>>>>>>>> www.softwaretestinggenius.com <<<<<<<<<<<<<<<<<<<<<<
SLA (Service Level Agreement)
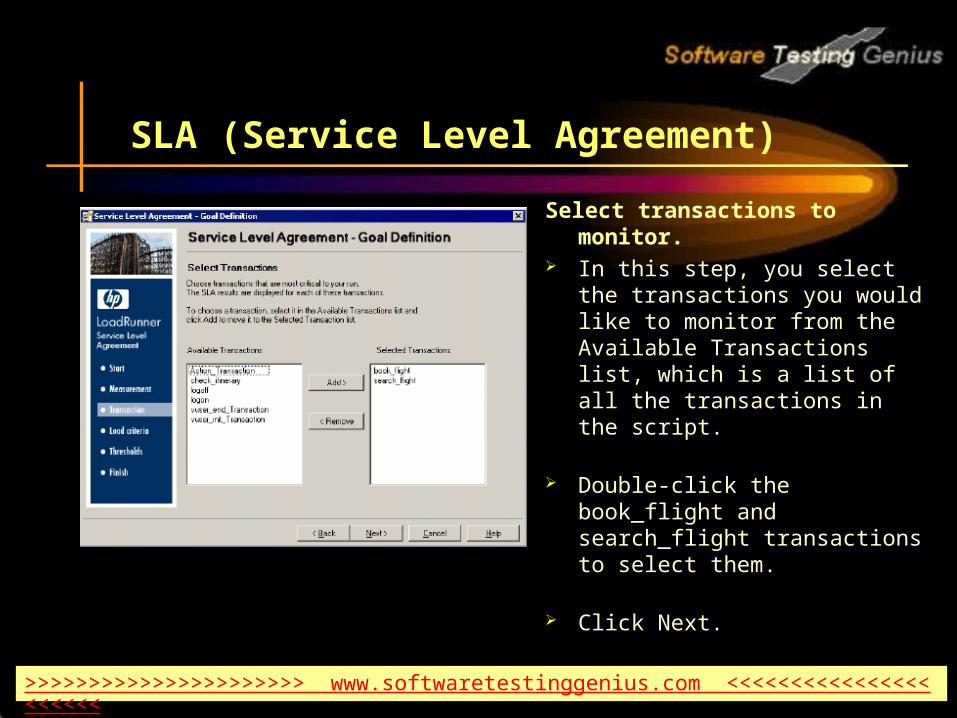
Select transactions to monitor. In this step, you select the
transactions you would like to monitor from the Available Transactions list, which is a list of all the transactions in the script.
Double-click the book_flight and search_flight transactions to select them.
Click Next.
>>>>>>>>>>>>>>>>>>>>>> www.softwaretestinggenius.com <<<<<<<<<<<<<<<<<<<<<<
SLA (Service Level Agreement)
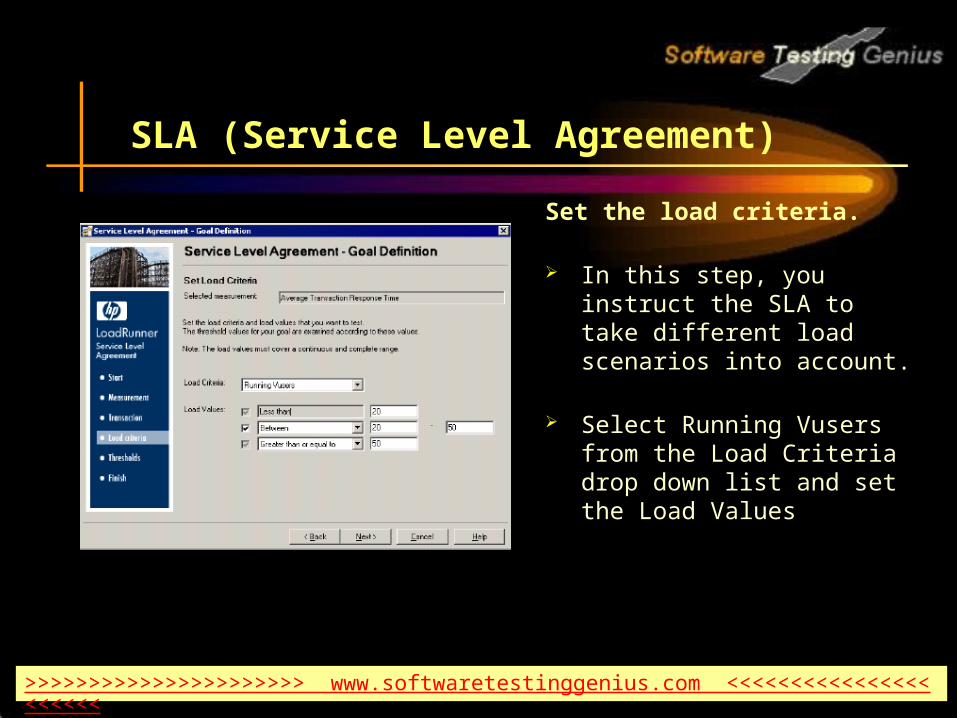
Set the load criteria.
In this step, you instruct the SLA to take different load scenarios into account.
Select Running Vusers from the Load Criteria drop down list and set the Load Values
>>>>>>>>>>>>>>>>>>>>>> www.softwaretestinggenius.com <<<<<<<<<<<<<<<<<<<<<<
SLA (Service Level Agreement)
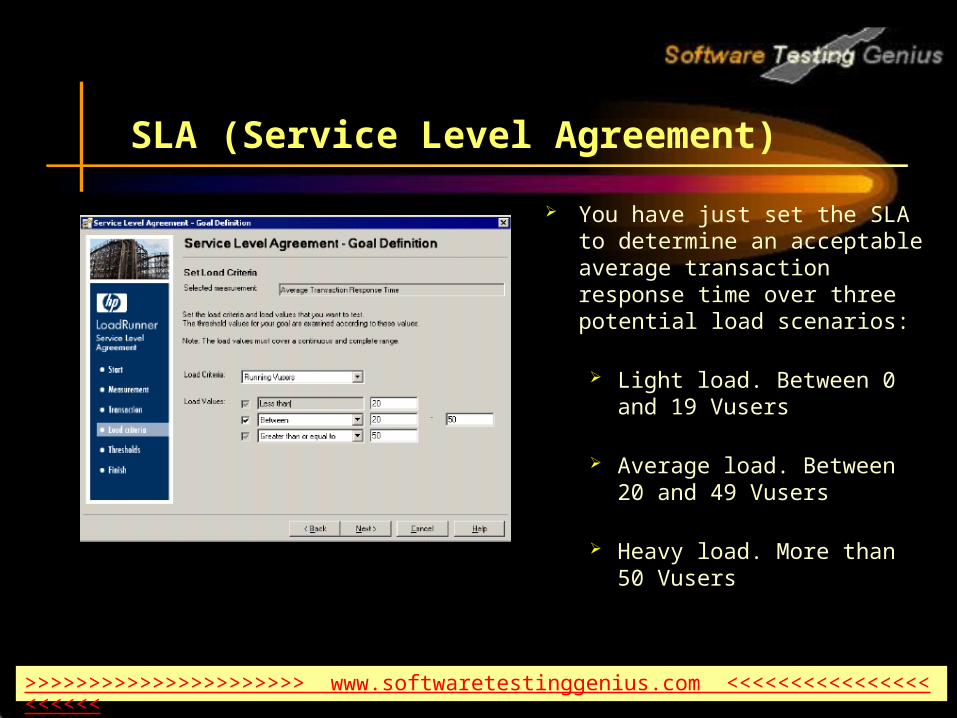
You have just set the SLA to determine an acceptable average transaction response time over three potential load scenarios:
Light load. Between 0 and 19 Vusers
Average load. Between 20 and 49 Vusers
Heavy load. More than 50 Vusers
>>>>>>>>>>>>>>>>>>>>>> www.softwaretestinggenius.com <<<<<<<<<<<<<<<<<<<<<<
SLA (Service Level Agreement)
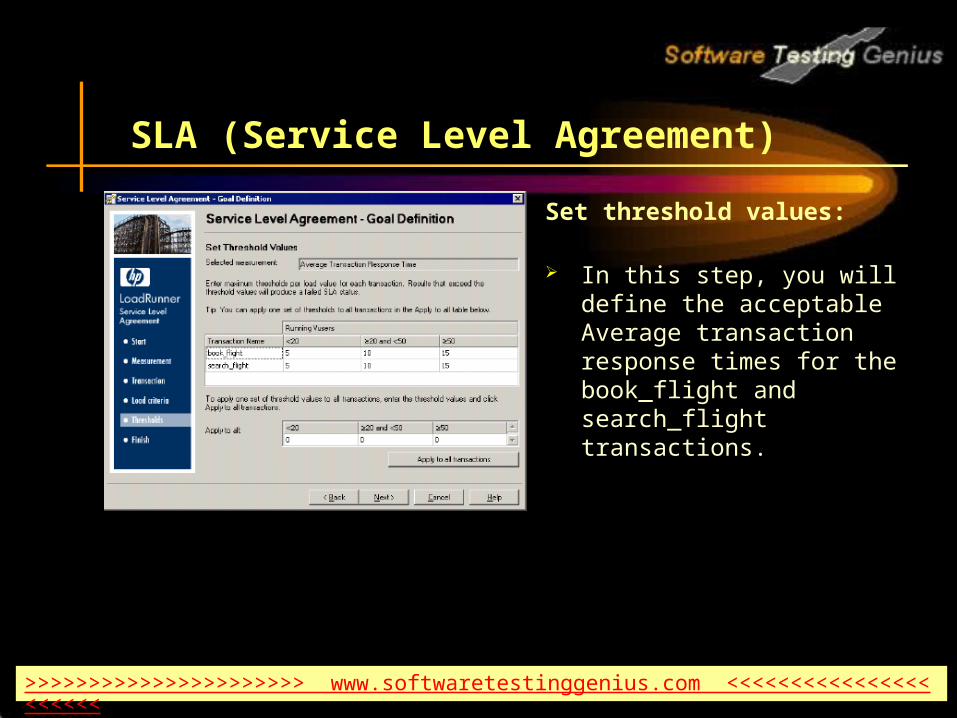
Set threshold values:
In this step, you will define the acceptable Average transaction response times for the book_flight and search_flight transactions.
>>>>>>>>>>>>>>>>>>>>>> www.softwaretestinggenius.com <<<<<<<<<<<<<<<<<<<<<<
SLA (Service Level Agreement)
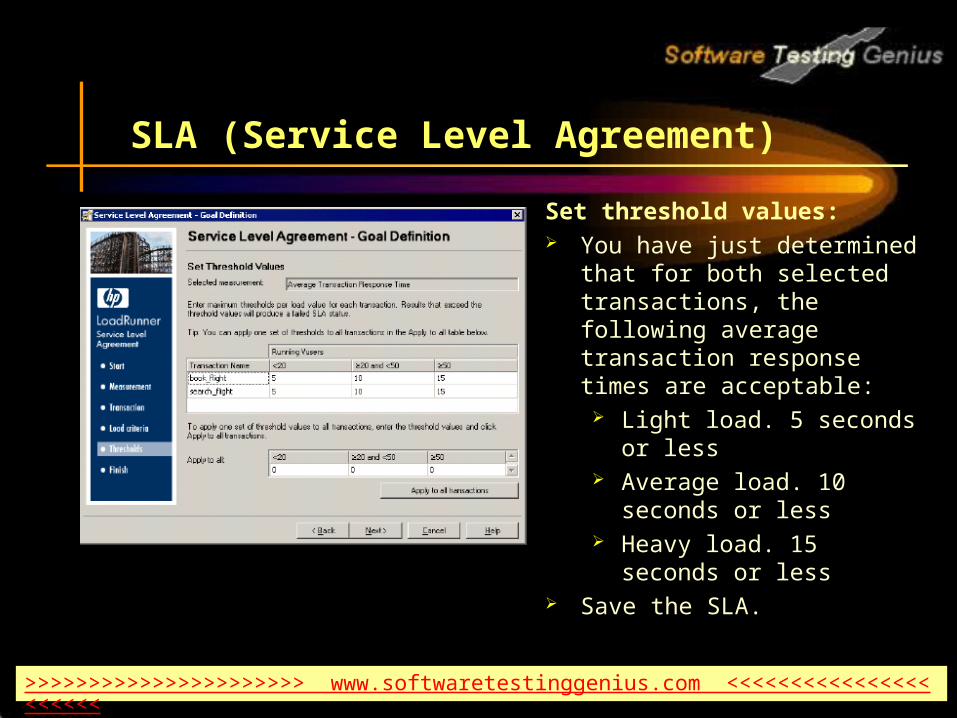
Set threshold values: You have just determined that
for both selected transactions, the following average transaction response times are acceptable: Light load. 5 seconds or
less Average load. 10 seconds
or less Heavy load. 15 seconds or
less Save the SLA.
>>>>>>>>>>>>>>>>>>>>>> www.softwaretestinggenius.com <<<<<<<<<<<<<<<<<<<<<<
Summary report
The Summary Report provides general information and statistics about the scenario run, as well as all relevant SLA information.
For example, what were the worst performing transactions in terms of defined SLAs, how specific transactions performed over set time intervals, and overall SLA statuses. You open the Summary report from the Session Explorer.
The report contains the following sections: Overall scenario statistics Worst performing transactions Time intervals where the SLA threshold exceeded Overall transaction performance
>>>>>>>>>>>>>>>>>>>>>> www.softwaretestinggenius.com <<<<<<<<<<<<<<<<<<<<<<
Summary report
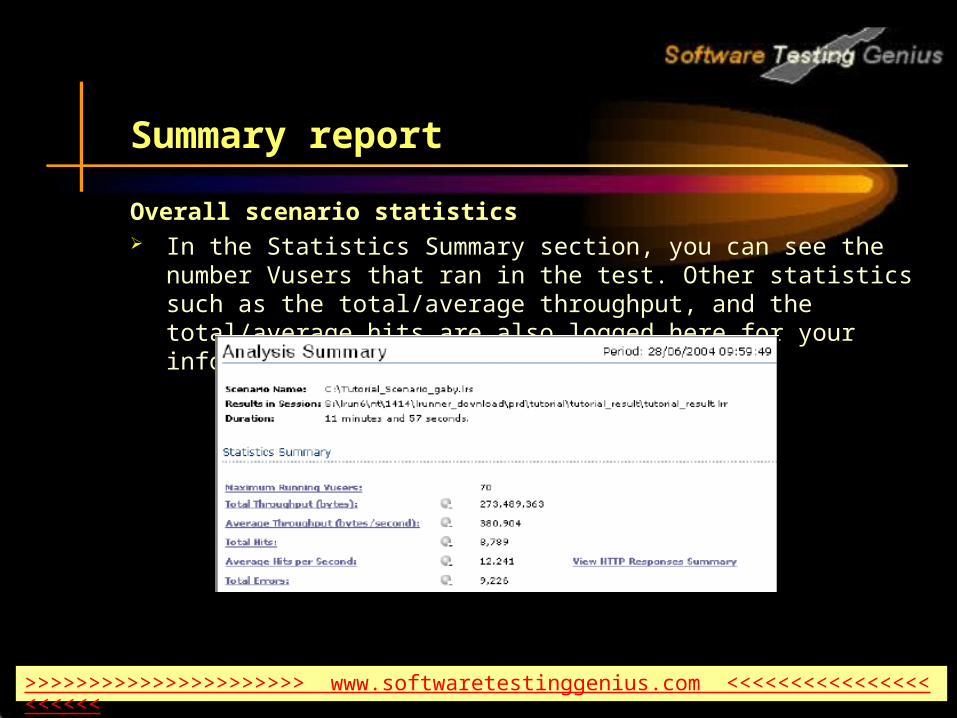
Overall scenario statistics In the Statistics Summary section, you can see the number Vusers that
ran in the test. Other statistics such as the total/average throughput, and the total/average hits are also logged here for your information.
>>>>>>>>>>>>>>>>>>>>>> www.softwaretestinggenius.com <<<<<<<<<<<<<<<<<<<<<<
Summary report
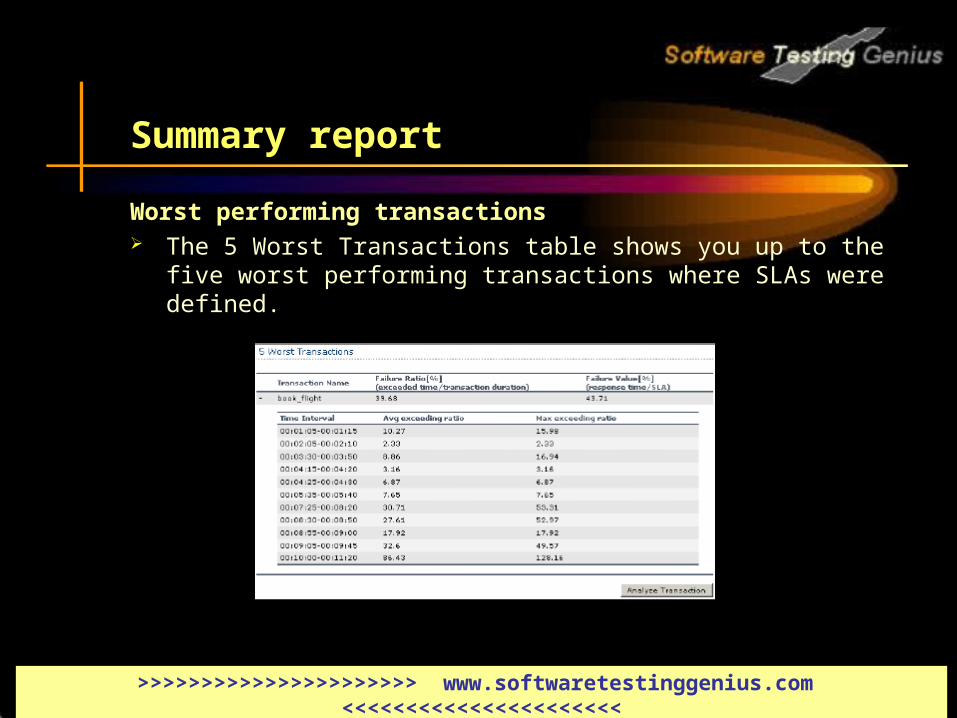
Worst performing transactions The 5 Worst Transactions table shows you up to the five worst
performing transactions where SLAs were defined.
>>>>>>>>>>>>>>>>>>>>>> www.softwaretestinggenius.com <<<<<<<<<<<<<<<<<<<<<<
Summary report
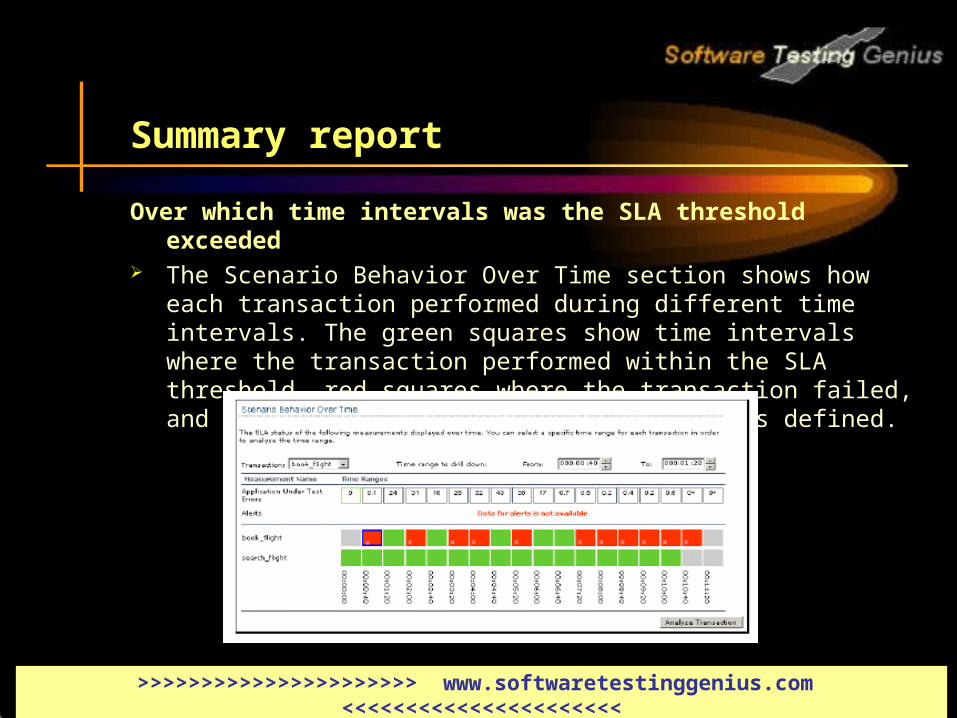
Over which time intervals was the SLA threshold exceeded The Scenario Behavior Over Time section shows how each transaction
performed during different time intervals. The green squares show time intervals where the transaction performed within the SLA threshold, red squares where the transaction failed, and grey squares where no relevant SLA was defined.
>>>>>>>>>>>>>>>>>>>>>> www.softwaretestinggenius.com <<<<<<<<<<<<<<<<<<<<<<
Summary report
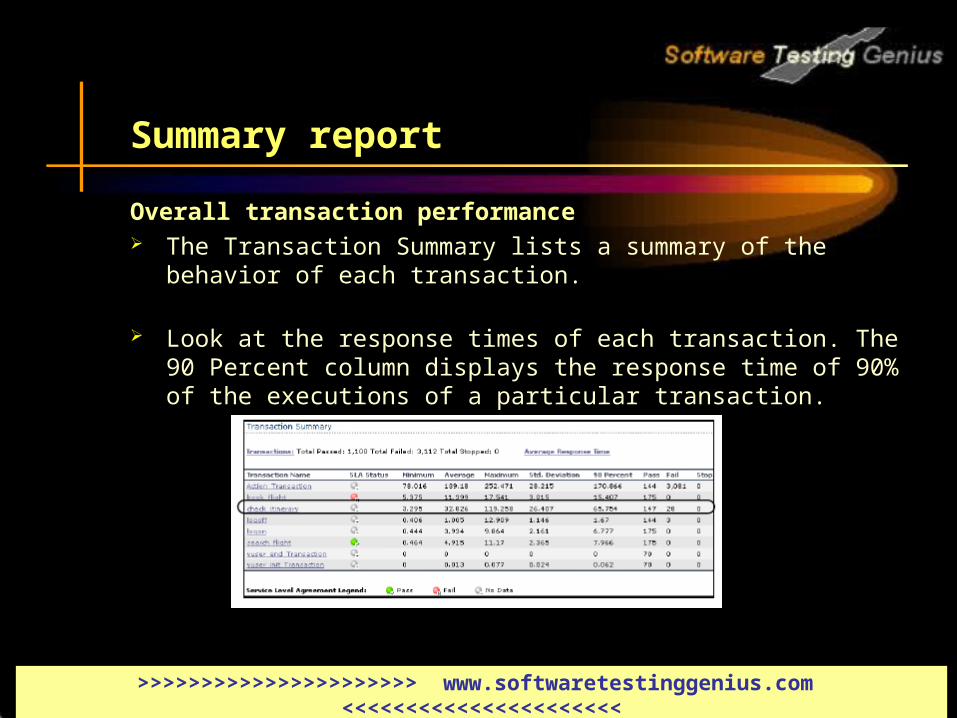
Overall transaction performance The Transaction Summary lists a summary of the behavior of each
transaction.
Look at the response times of each transaction. The 90 Percent column displays the response time of 90% of the executions of a particular transaction.
>>>>>>>>>>>>>>>>>>>>>> www.softwaretestinggenius.com <<<<<<<<<<<<<<<<<<<<<<
Creating Reports
You can publish the findings from your analysis session in an HTML or Microsoft Word report. The report is created using a designer template, and includes explanations and legends of the presented graphs and data.
HTML Reports The HTML report can be opened and viewed in any browser.
To create an HTML report: From the Reports menu, select HTML Report... Select a file name for your report, and the path where you want to
save it. Click Save.
Analysis creates the report and displays it in your Web browser.
>>>>>>>>>>>>>>>>>>>>>> www.softwaretestinggenius.com <<<<<<<<<<<<<<<<<<<<<<
Creating Reports
Microsoft Word Reports You can present your analysis session in a Microsoft Word report.
The Word report is more comprehensive than the HTML report, because you have the option to include general information about the scenario, measurement descriptions, and so on.
You can also format the report to include your company’s name and logo, and the author’s details.
Like any Microsoft Word file, the report is editable, so you can add further comments and findings after you have built the report.
>>>>>>>>>>>>>>>>>>>>>> www.softwaretestinggenius.com <<<<<<<<<<<<<<<<<<<<<<
Creating Reports
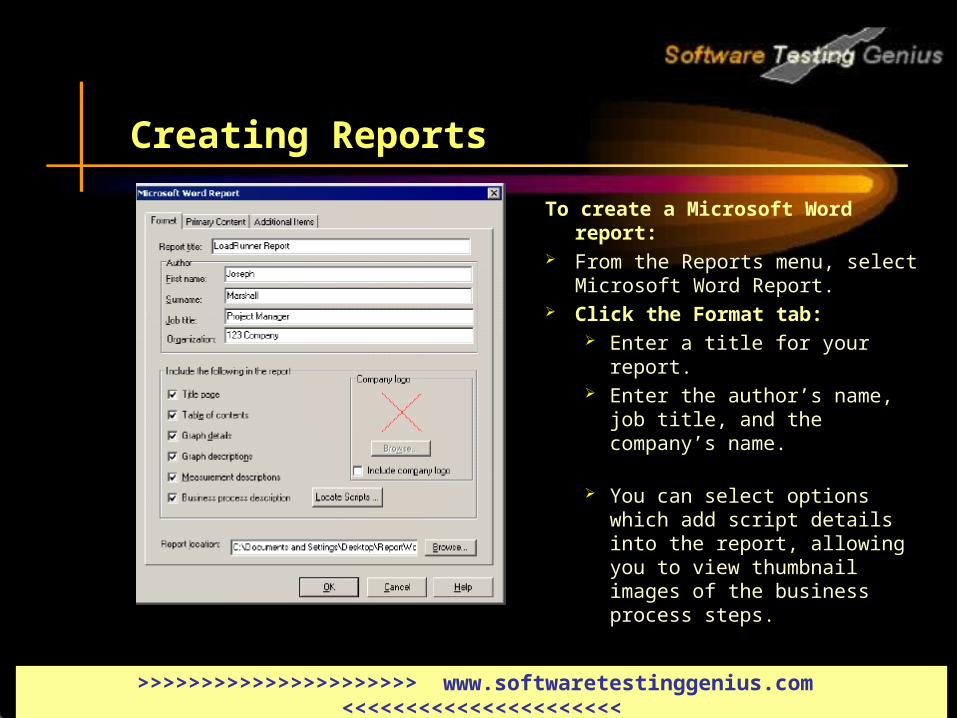
To create a Microsoft Word report:
From the Reports menu, select Microsoft Word Report.
Click the Format tab: Enter a title for your report. Enter the author’s name, job
title, and the company’s name.
You can select options which add script details into the report, allowing you to view thumbnail images of the business process steps.
>>>>>>>>>>>>>>>>>>>>>> www.softwaretestinggenius.com <<<<<<<<<<<<<<<<<<<<<<
Creating Reports
In the Company logo area, select Include company logo, and click Browse to find the logo file path. Note that this must be a .bmp file.
Enter a location to save your report.
Click the Primary Content tab.
Select which sections of your scenario run and analysis session you want to include in your report. By default, all sections listed, except for the Server Performance, are selected.
>>>>>>>>>>>>>>>>>>>>>> www.softwaretestinggenius.com <<<<<<<<<<<<<<<<<<<<<<

Creating Reports
Select Server performance. Click Edit. The Executive Summary dialog box opens, where you
type your objectives and conclusions.
In the Objectives box, type The objectives of the test scenario were to.…
In the Conclusions box, type The conclusions I reached are as follows:
Click OK to close the Executive Summary dialog box.
>>>>>>>>>>>>>>>>>>>>>> www.softwaretestinggenius.com <<<<<<<<<<<<<<<<<<<<<<
Thank You
>>>>>>>>>>>>>>>>>>>>>> www.softwaretestinggenius.com <<<<<<<<<<<<<<<<<<<<<<