understanding chinese economy - cbl international · year 2010 2020 2030 2033 2050 total ......
TRANSCRIPT
1
Understanding Chinese economy
Professor JIANWEI WU
TONGJI University 2014

2
Map of P.R. China
3 3
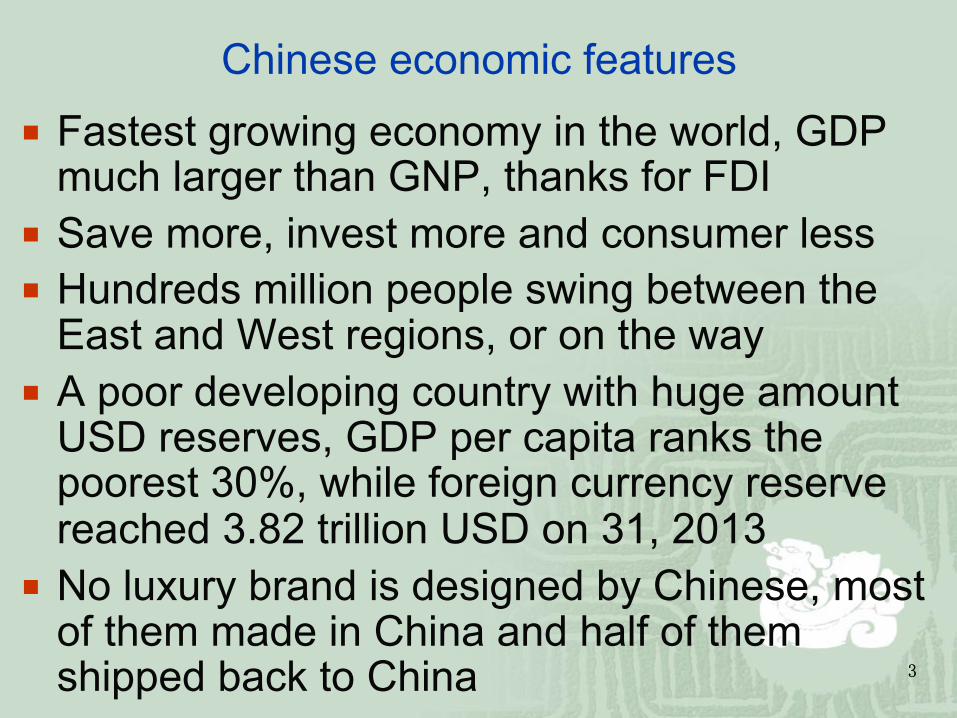
Chinese economic features
¡ Fastest growing economy in the world, GDP much larger than GNP, thanks for FDI
¡ Save more, invest more and consumer less ¡ Hundreds million people swing between the
East and West regions, or on the way ¡ A poor developing country with huge amount
USD reserves, GDP per capita ranks the poorest 30%, while foreign currency reserve reached 3.82 trillion USD on 31, 2013
¡ No luxury brand is designed by Chinese, most of them made in China and half of them shipped back to China

4 4
Chinese economic features
¡ One of the most polluted countries managed to produce solar and wind generators
¡ A socialist country trapped in monopoly industries, struggling to build market system
¡ GDP per capita is $6920 in 2013 ¡ Four wheels of the economy: cheap labor,
open door policy, reform, urbanization; energy driven: from high saving rate to high rate of investment
5 5
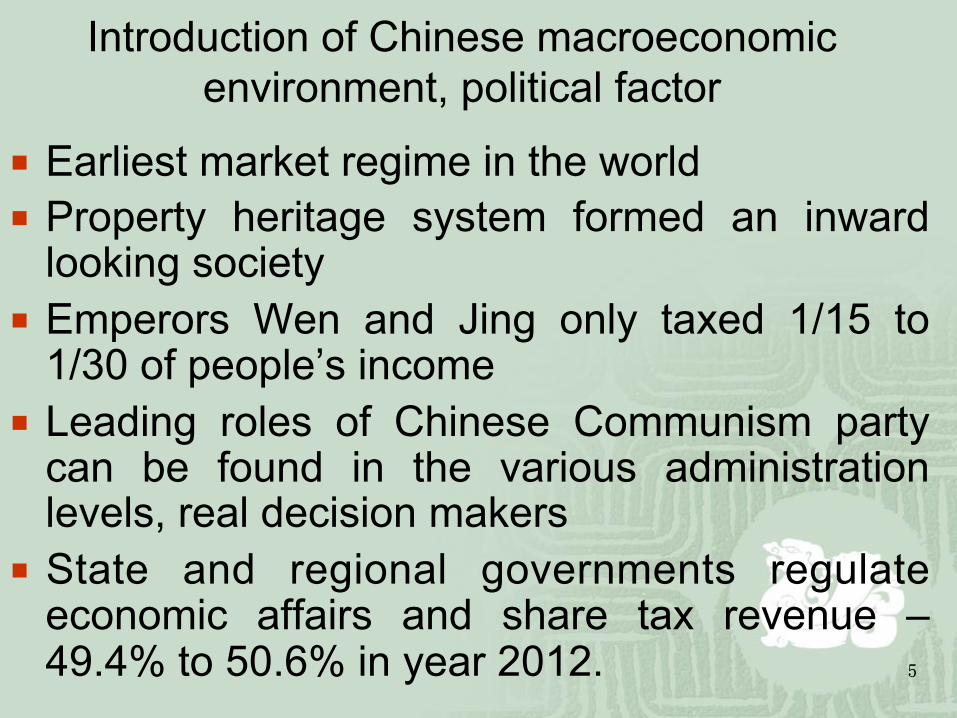
Introduction of Chinese macroeconomic environment, political factor
¡ Earliest market regime in the world ¡ Property heritage system formed an inward
looking society ¡ Emperors Wen and Jing only taxed 1/15 to
1/30 of people’s income ¡ Leading roles of Chinese Communism party
can be found in the various administration levels, real decision makers
¡ State and regional governments regulate economic affairs and share tax revenue – 49.4% to 50.6% in year 2012.
6
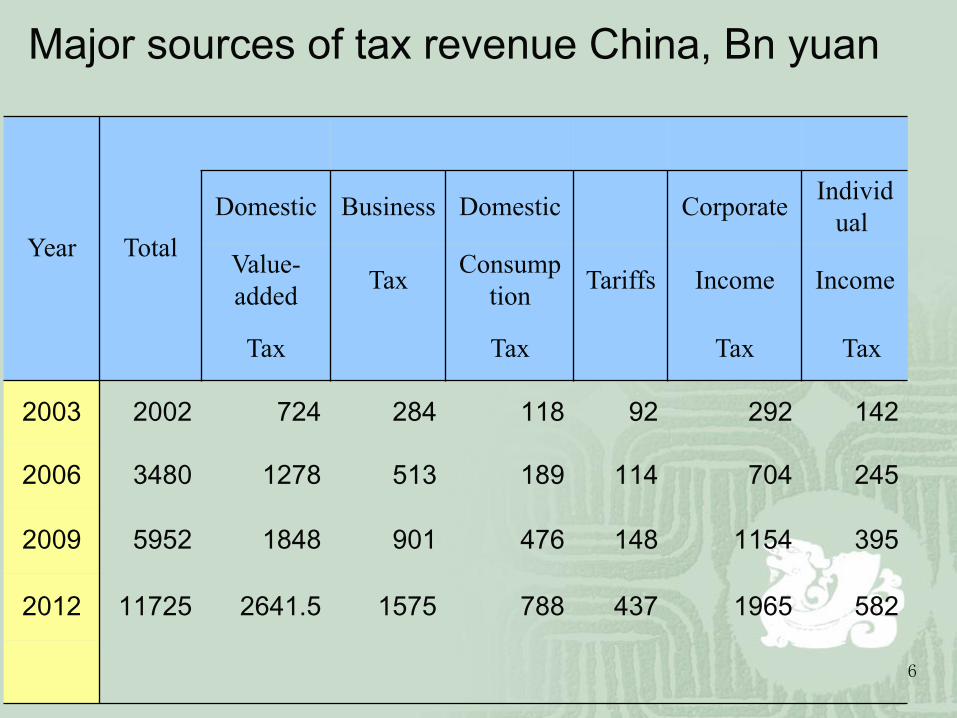
Major sources of tax revenue China, Bn yuan
Year Total
Domestic Business Domestic Corporate Individual
Value-added Tax Consump
tion Tariffs Income Income
Tax Tax Tax Tax
2003 2002 724 284 118 92 292 142
2006 3480 1278 513 189 114 704 245
2009 5952 1848 901 476 148 1154 395
2012 11725 2641.5 1575 788 437 1965 582

7
0
2
4
6
8
10
12
14
9 2K 1 2 3 4 5 6 7 8 9 10 11 12
Fiscal balance, trillion RMB
expenditure
revenue
8 8
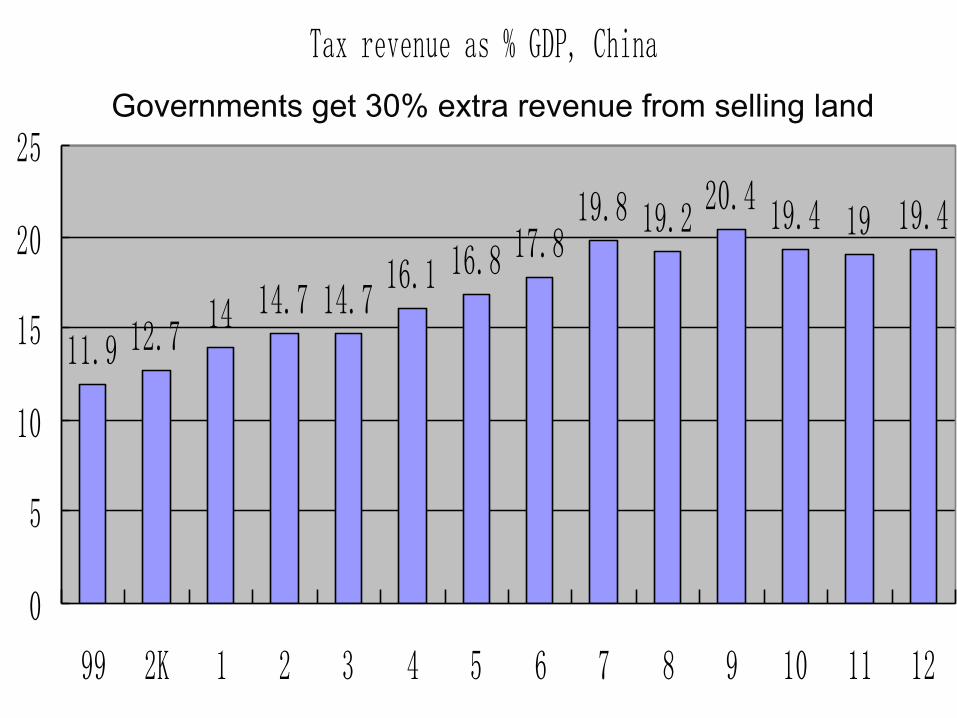
Extra 30% from selling land! Tax revenue as % GDP, China
11.9 12.714 14.7 14.7
16.1 16.8 17.819.8 19.2
20.4 19.4 19 19.4
0
5
10
15
20
25
99 2K 1 2 3 4 5 6 7 8 9 10 11 12
Governments get 30% extra revenue from selling land
9
Economic and social factor of urbanization and mega cities
¡ Economy of scale, scope, industrial cluster and economic networking
¡ High value added industry in CBD: finance, services and entertainment
¡ Face to face communication (dating and appointment), emotional needs, social networking
¡ Tank of skills and talents ¡ Employment and recruitment opportunities

10 10
Cardinal challenges and opportunities to modern Chinese economy are urbanization and employment
¡ Up to 53.7% of residents are categorized as city and town citizens and 46.3% as farmers, respectively in 2012. Hundred million youth migrates from inland China, particularly countryside to cities and coast areas, looking for jobs.
¡ More than 60% of the Chinese will be settled in urban area by year 2020. Therefore, there have to be enough jobs, shelters and infrastructure to accommodate new immigrates.
¡ Number of cities with one million or more population are 150 in China in 2010.

11
Labor force and employment
¡ Working forces (age between 15-64) was 644 million in 1980 and 941 million in the peak year 2011. Labor force shrink 3.5 million since 2012.
¡ The ratios of labor to total population are: 1980 64.4%; 2009 72.4%; 2030 67.4%; 2050 63%
12
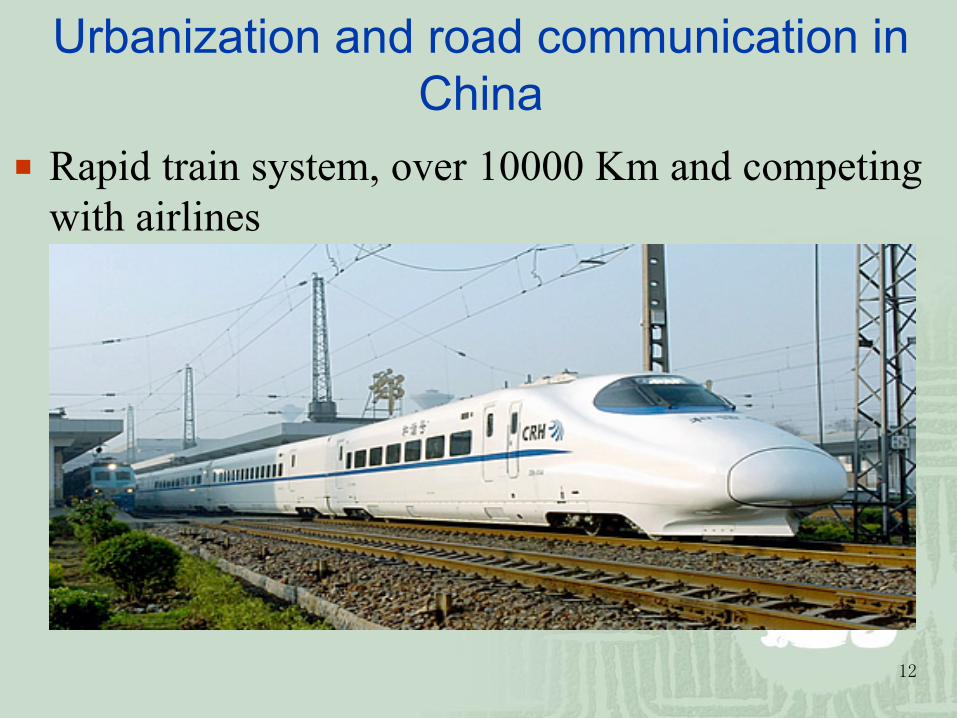
Urbanization and road communication in China
¡ Rapid train system, over 10000 Km and competing with airlines

13 13
Highway, China, Mn Km
1.35 1.41.7 1.77 1.81 1.87
3.35 3.46 3.58 3.73 3.86 4.01 4.11
00.5
11.5
2
2.53
3.54
4.5
9 2K 1 2 3 4 5 6 7 8 9 10 11
14
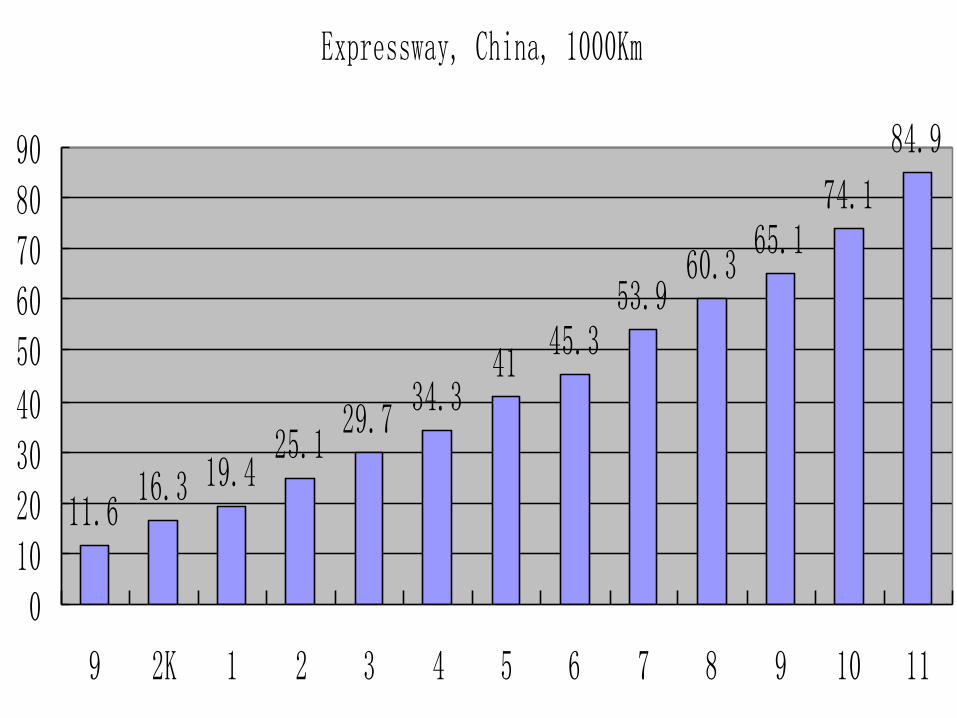
Expressway, China, 1000Km
11.616.3 19.4
25.129.7
34.341
45.353.9
60.365.1
74.1
84.9
010203040
5060708090
9 2K 1 2 3 4 5 6 7 8 9 10 11

15 15
(continued)
¡ The total turnover of cargos in harbors is 3.42 billion tons in 2006 and 9.47 billion tons in 2012.
¡ The national highway project “7918” will be
constructed based on the planning of Ministry of Transportation, namely 7 routes radiating centered in Beijing, 9 North-South and 18 East-West rotes cross mainland China, making total mileage of 85000 km. All 319 cities which have population more than 200,000 will be connected in year 2020.
16
0%
20%
40%
60%
80%
100%
1952 1960 1970 1980 1990 2000 2020
Urban Rural
Distribution of Chinese population

17
Total population mn and percentage of senior citizen in China
Year 1950 1960 1970 1980 1990 2000 Total Population 552 662 830 987 1,143 1,273
Population 65 + 2 3.5 4.1 4.9 5.8 7
Year 2010 2020 2030 2033 2050 Total Population 1,300 1,445 1,460 1,500 1,453
Population 65 + 8.7 12 16.2 21 23.1
18
Widening distribution of income between coastal and inland, urban and countryside
¡ The gaps of income between coast areas and inland China are huge and still enlarging. Gini coefficient was 0.28 in early 1980s, increasing to 0.38 in 1995, 0.458 in 2001 and over 0.47 in 2012.
¡ Social stability, comparison between China, India and Brazil (0.515 in year 2008)
¡ Disposable income per person in cities and towns were RMB8472 in 2003, 26955 in year 2013. By contrast, average net income of rural residents was only RMB 2622 in 2003; 8896 in year 2013 .
¡ Social welfare coverage is close to 100% but at very basic level
19
Everlasting unemployment issue ¡ Because of limited arable land, people ages
between 15 to 50 move to cities to find jobs. ¡ Left home ages and children, not only an
economic issue ¡ The hidden unemployment is a serious problem,
but it provides abundant supply of labor. ¡ Supply of employment posts in the near future
should come from the service sectors and near major cities.
¡ The development of Chinese industry has constraint of shortage of skilled labor
20 20
Minimum wage US$
Vietnam 2011 1002 Spain 2010 11426
Indonesia 2011 1027 US 2009 15080
Shanghai 2011 2430 Switzerland 2008 15457
Russia 2008 2812 France 2011 17701
Brazil 2012 4350 Australia 2011 20027
Chile 2010 5484 Denmark 23277

21 21
Employment in Chinese firms, %, 2011
18.6
1.7
59.1
67.6
SOE Collective Corporation FDI Self

22
Profit distribution in Chinese industry, %, 2006
10.3
27.6
62.1
SOE
FDI
others
Profit distribution in Chinese industry, %, 2011
5.8
25.2
69
SOE
FDI
others

23 0
2
4
6
8
10
12
14
16
78 9 0 1 2 3 4 5 6 7 8 9 0 1 2 3 4 5 6 7 8 9 2K 1 2 3 4 5 6 7 8 9 10 11 12 13
Compound growth rate, GDP, %
24
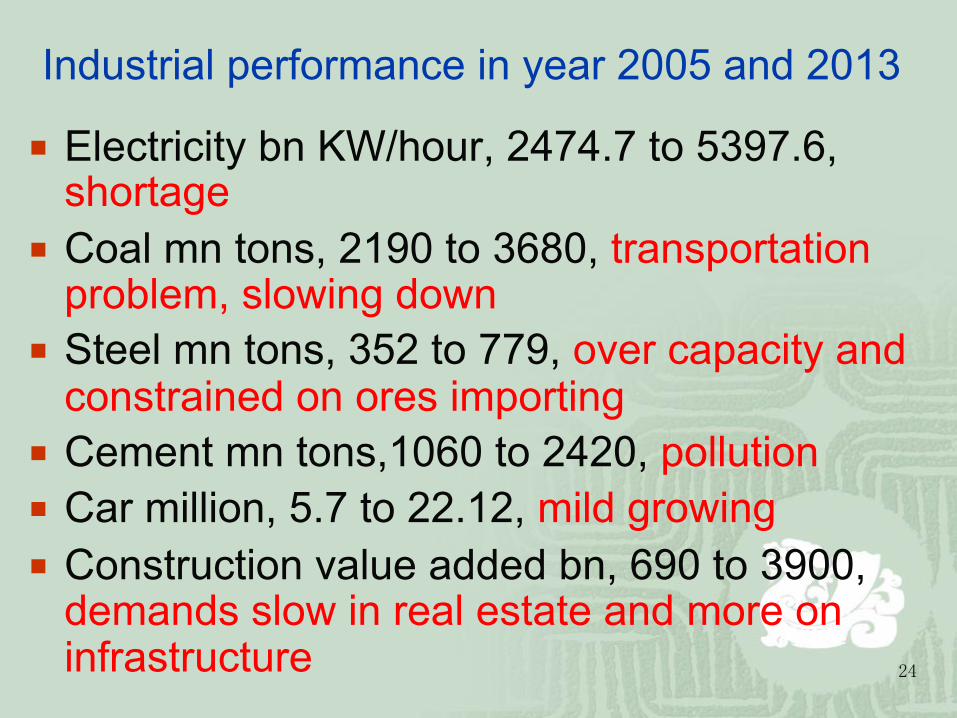
Industrial performance in year 2005 and 2013
¡ Electricity bn KW/hour, 2474.7 to 5397.6, shortage
¡ Coal mn tons, 2190 to 3680, transportation problem, slowing down
¡ Steel mn tons, 352 to 779, over capacity and constrained on ores importing
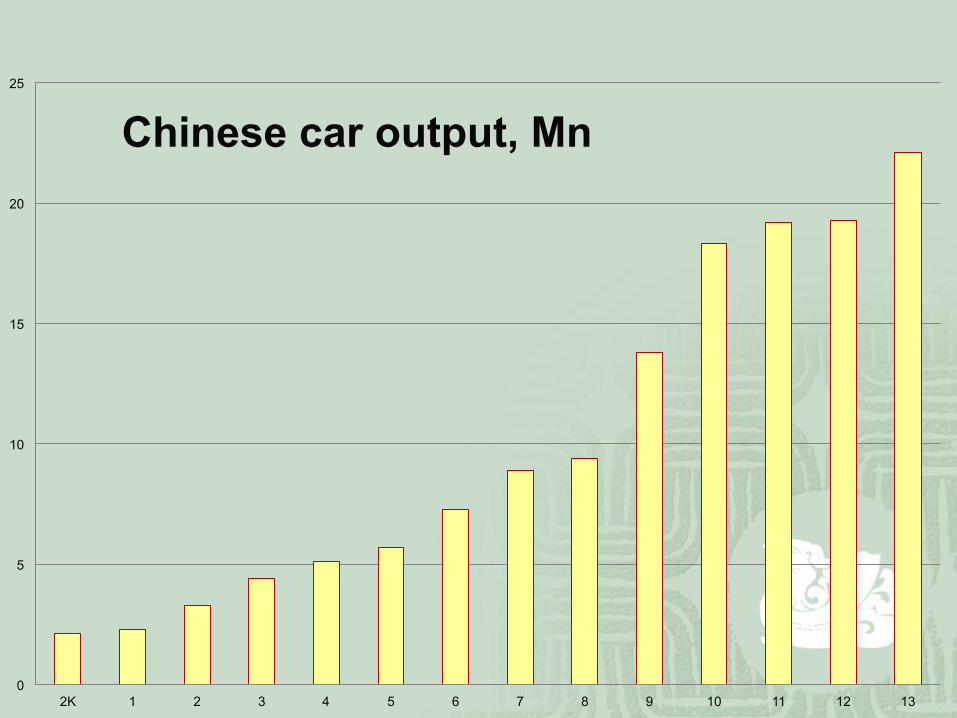
¡ Cement mn tons,1060 to 2420, pollution ¡ Car million, 5.7 to 22.12, mild growing ¡ Construction value added bn, 690 to 3900,
demands slow in real estate and more on infrastructure
25
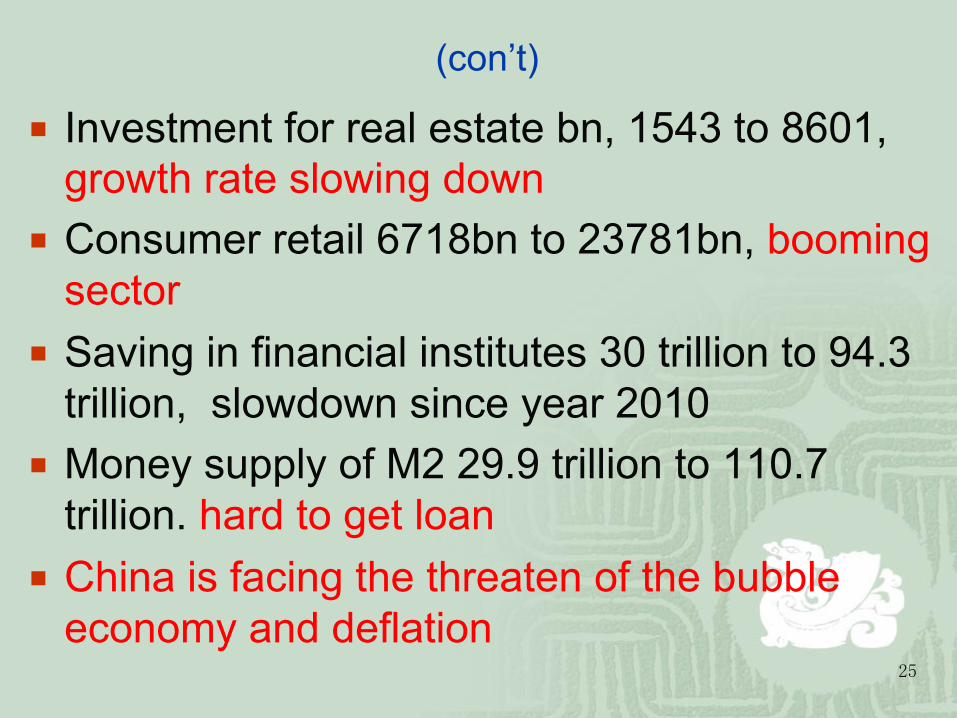
(con’t)
¡ Investment for real estate bn, 1543 to 8601, growth rate slowing down
¡ Consumer retail 6718bn to 23781bn, booming sector
¡ Saving in financial institutes 30 trillion to 94.3 trillion, slowdown since year 2010
¡ Money supply of M2 29.9 trillion to 110.7 trillion. hard to get loan
¡ China is facing the threaten of the bubble economy and deflation

26 26
GDP in 2011, where does fuel come from? ¡ GDP = C + I + G + (X – M)=49.1(C+G)+48.3(I)+2.6X ¡ High level of saving in banks, liquidation mismatch
problem, SME is hunger for loan, loan for the poor (Shanghai miracle in the 1920s and Bangladesh country banks)
¡ Insufficient development of financial market, bond and other security markets
¡ Less enthusiasm of consumption ¡ Overheating of regional government investment and
expenditure ¡ Underground economy ¡ Surging in foreign currency reserve, over export and
flowing in speculative money ¡ Price index and interest rate
27 27
29
Continuous growth of Chinese economy
¡ Divergent interests of central government versus regional governments, increasing gaps of development
¡ Potential of the service industry: the road from secondary position to leading sector of GDP; value of emotion and information, from GE to IBM, from physical manufactures to the new economy
¡ Resurging of commodity economy, materials and agriculture and economic products
¡ Further opening up industrial sectors to private and foreign investors
¡ Why do we need a ever growing model, pollution also cost 10% of GDP

30
31
A long way from OEM to ODM and self-owned intellectual property
¡ The cost of intellectual property, barriers for catching up economies, overwhelming patent applications from the overseas
¡ Emerging of ODM in the coast regions ¡ Insufficient input on R & D, case of the
Chinese pharmaceutical industry ¡ Lessons learned from pattern of development
in South American
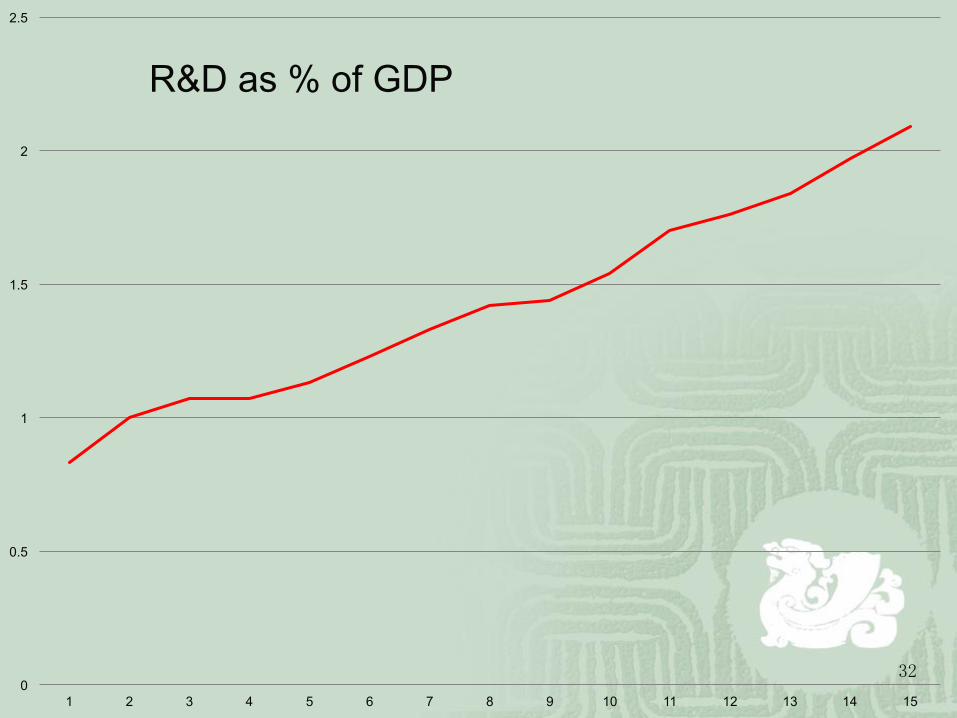
32 0
0.5
1
1.5
2
2.5
1 2 3 4 5 6 7 8 9 10 11 12 13 14 15
R&D as % of GDP

33
¡ Can growth of Chinese economy rest on soaring prices of raw materials in the global markets?
¡ Sustainability of resource-based model in China
¡ Who enjoys large stake of economic fruits: China, MNCs, developed countries, resource-rich nations?
¡ Political, environment and financial risks and challenge for Chinese firms through mining in the overseas
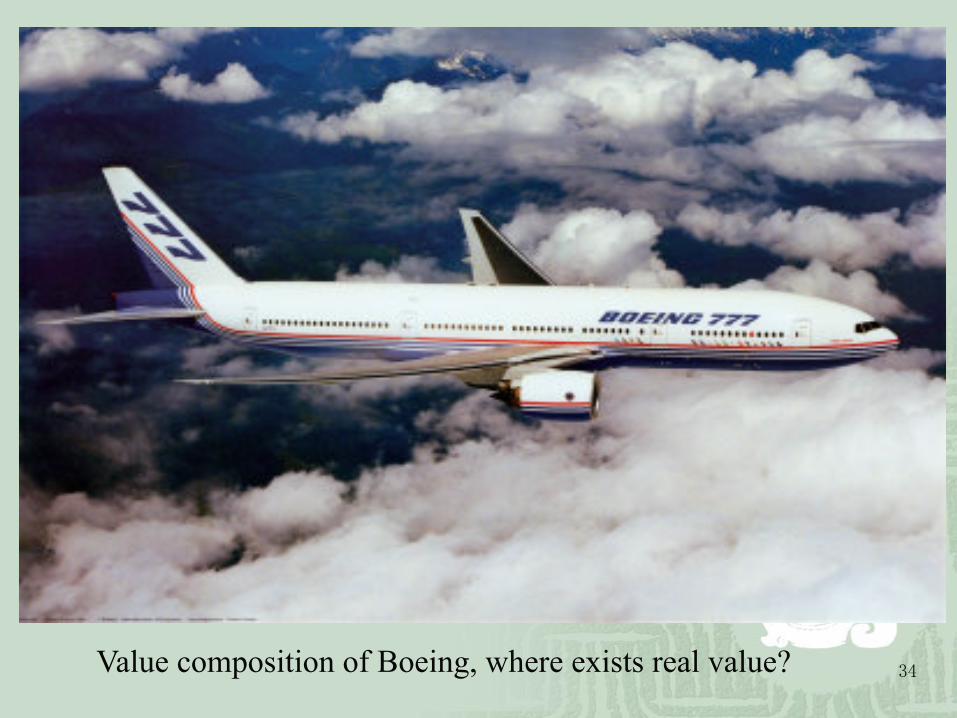
34 Value composition of Boeing, where exists real value?
35
Global value chain and ladders
¡ Material supplied in resource rich countries ¡ Processing nations ¡ Assembly basis ¡ Call centers ¡ Logistic and harbors ¡ Trading centers ¡ Financial centers, monetary markets: gold,
currency issue and circulation, FX market
36
Global value chain and ladders
¡ R & D centers ¡ Information processing centers: software,
media, culture products ¡ Design centers ¡ Industrial code and standards: visa group ¡ International organization ¡ Value circle, environment friendly
production
37 0
0.5
1
1.5
2
2.5
3
3.5
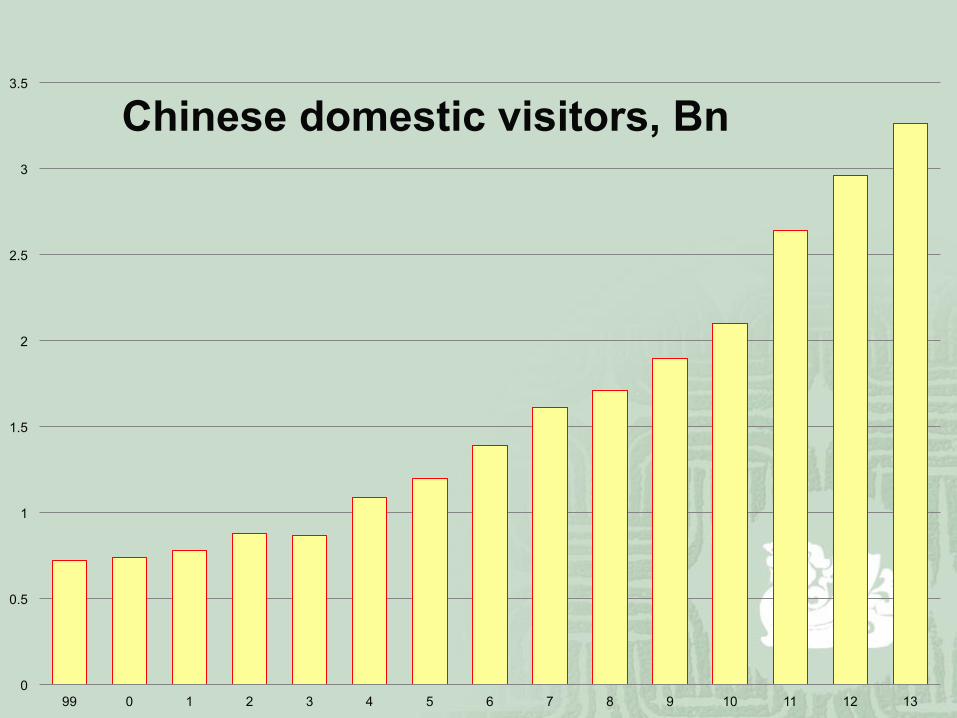
99 0 1 2 3 4 5 6 7 8 9 10 11 12 13
Chinese domestic visitors, Bn
38
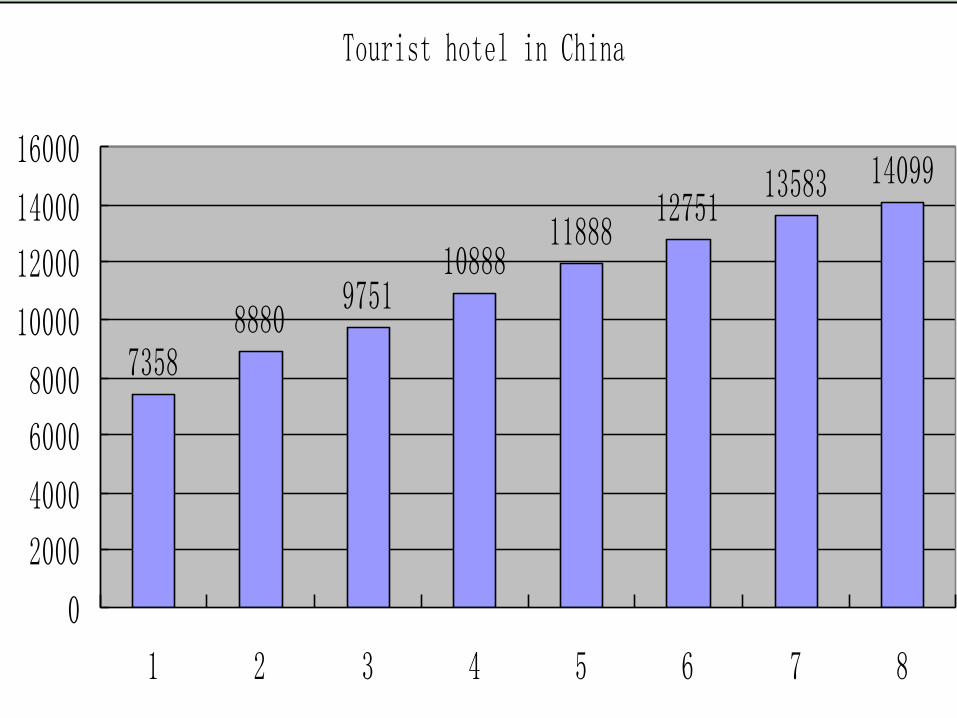
Tourist hotel in China
73588880
975110888
1188812751
13583 14099
0
2000
4000
6000
8000
10000
12000
14000
16000
1 2 3 4 5 6 7 8

39
Chinese energy industry
¡ Choosing a right industry is the key of business success in emerging economies
¡ The energy industry in China: bottleneck or business opportunities
¡ What business opportunities can you observe from the growing demand for energy supply in China: investment for shares listed in the major stock markets, consulting, technology transfer, trading in oil, environment protection?

40 40
Composition of Chinese energy consumption,%
Coal Crude Oil Natural Gas Others
1978 70.3 23.7 2.9 3.1
1995 75.3 16.6 1.9 6.2
2005 77.6 12.0 3.0 7.4
2011 77.8 9.1 4.3 8.8

41 41
China Petroleum Balance Sheet, Mn tons
1990 1995 2000 2005 2010
Item
Output 138.3 150.1 163.0 181.4 203.0
Imports 7.6 36.7 97.5 171.6 294.4
Exports (-) 31.1 24.5 21.7 28.9 40.8
42 0
5
10
15
20
25
2K 1 2 3 4 5 6 7 8 9 10 11 12 13
Chinese car output, Mn
43 43
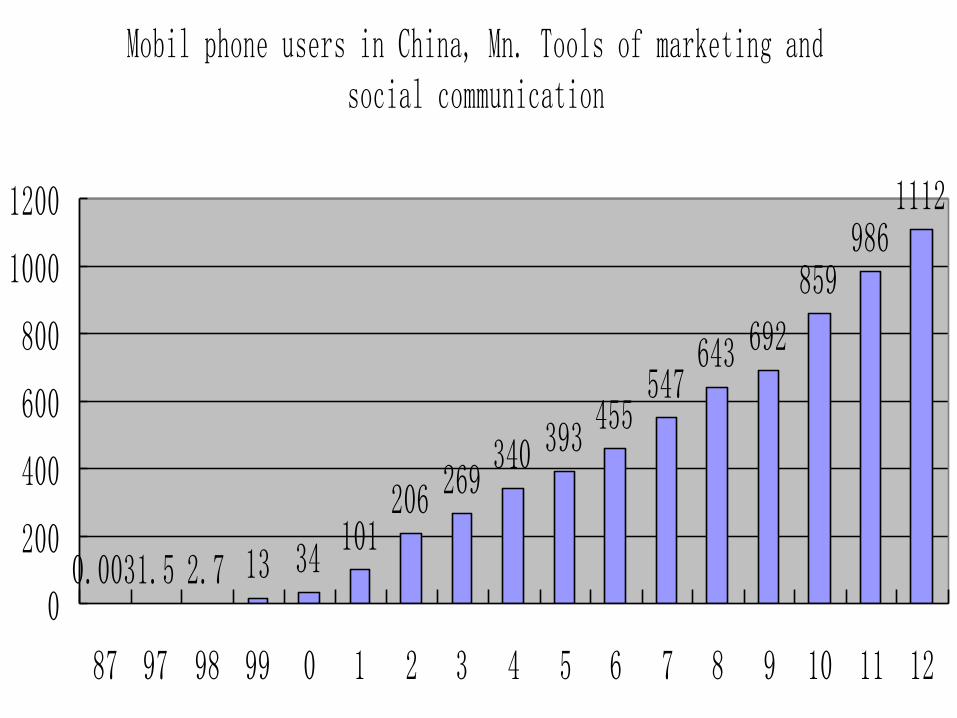
Mobil phone users in China, Mn. Tools of marketing andsocial communication
0.0031.5 2.7 13 34101
206 269340 393
455547
643 692
859986
1112
0
200
400
600
800
1000
1200
87 97 98 99 0 1 2 3 4 5 6 7 8 9 10 11 12
44
The rapid development of automobile industry,
acceleration of urbanization Cars manufactures have been growing
dramatically ¡ Causing sever problem of traffic congestion. ¡ Lifestyle changing and urban spending ¡ Limited space of parking space in residential
blocks and CBD ¡ Vehicle purchase, tariff and toll gates,
experience in Sydney
45 45
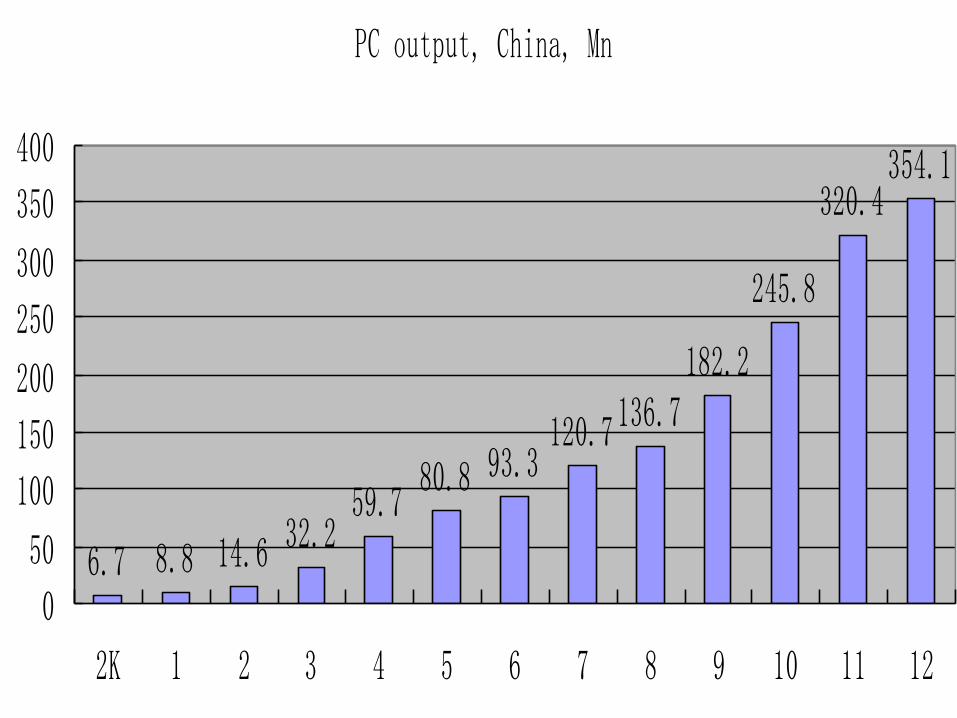
PC output, China, Mn
6.7 8.8 14.6 32.259.7
80.8 93.3120.7 136.7
182.2
245.8
320.4354.1
0
50
100
150
200
250
300
350
400
2K 1 2 3 4 5 6 7 8 9 10 11 12
46
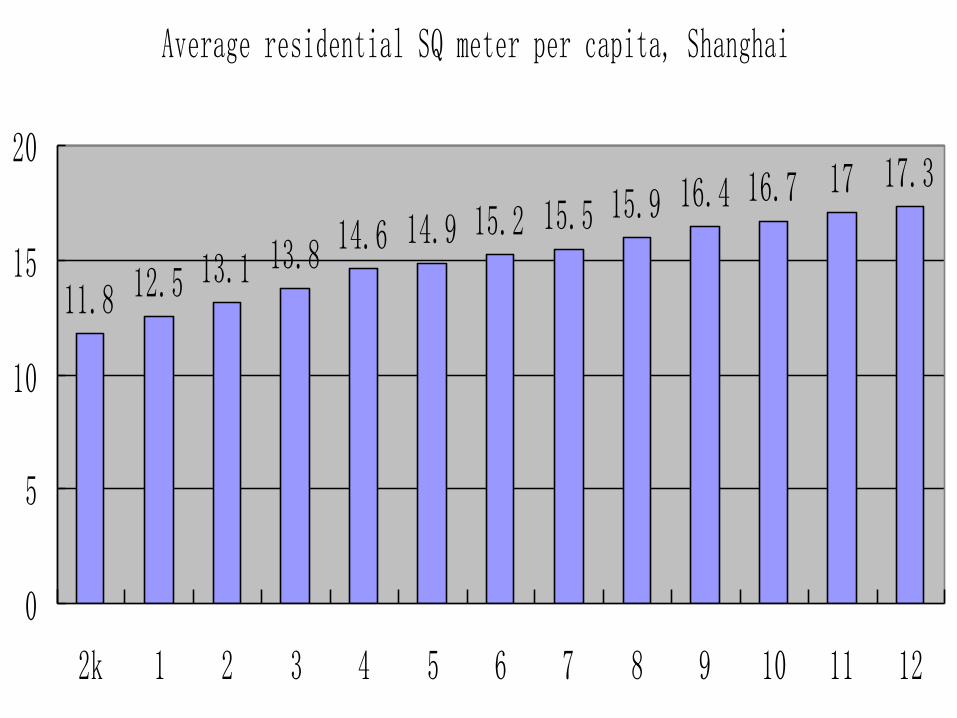
Average residential SQ meter per capita, Shanghai
11.8 12.5 13.1 13.8 14.6 14.9 15.2 15.5 15.9 16.4 16.7 17 17.3
0
5
10
15
20
2k 1 2 3 4 5 6 7 8 9 10 11 12

47 47
Housing price and income ratio in Shanghai Shanghai housing
3326 3659 4007 49806386 6698 7039 8253
13411 14106
22282 22432 21412
14.1 14.2 15.1 16.7 19.1 18 17 17.5
25 24.5
3531
26.6
0
5000
10000
15000
20000
25000
2k 1 2 3 4 5 6 7 8 9 10 11 12
0510152025303540
price per SQ meter set housing price/year family disposable income
Price per SQ meter: Inner circle 55518; middle 29281; out circle 16541
48 48
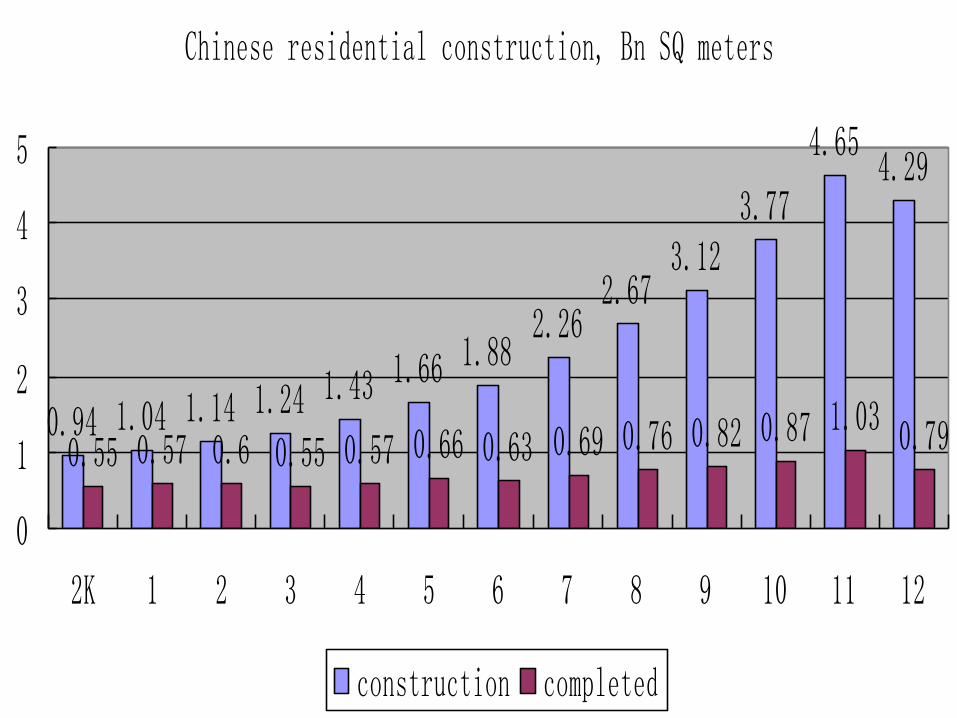
Chinese residential construction, Bn SQ meters
0.94 1.04 1.14 1.24 1.43 1.66 1.882.26
2.673.12
3.77
4.654.29
0.55 0.57 0.6 0.55 0.57 0.66 0.63 0.69 0.76 0.82 0.87 1.03 0.79
0
1
2
3
4
5
2K 1 2 3 4 5 6 7 8 9 10 11 12
construction completed
49 49
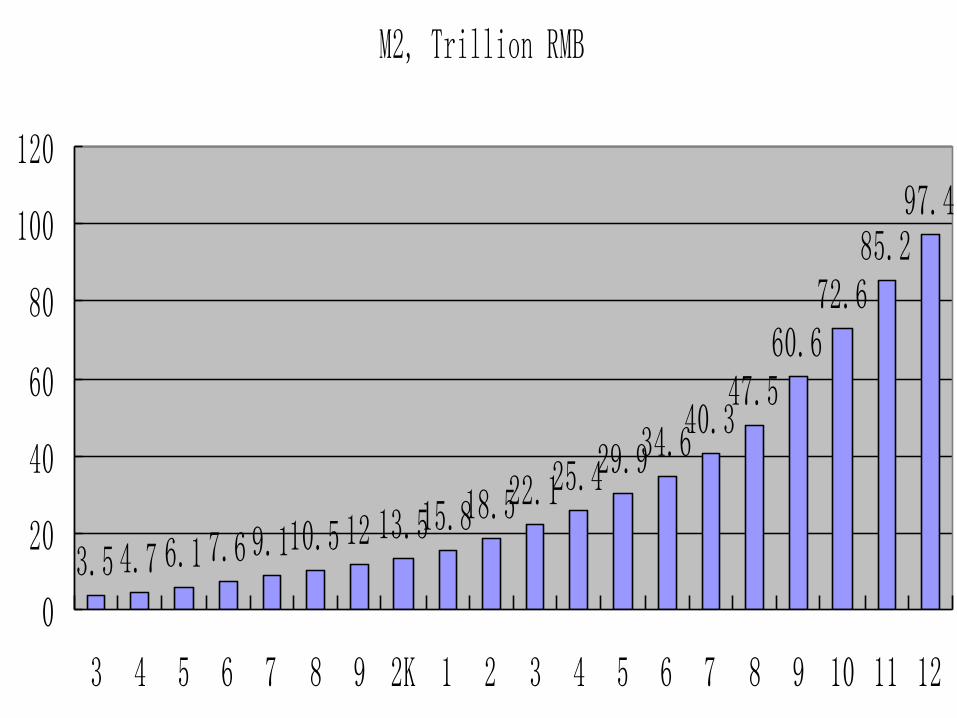
M2, Trillion RMB
3.5 4.7 6.1 7.6 9.110.512 13.515.818.5
22.125.429.934.6
40.347.5
60.672.6
85.297.4
0
20
40
60
80
100
120
3 4 5 6 7 8 9 2K 1 2 3 4 5 6 7 8 9 10 11 12

50
Annual Compound growth rate of M2, %
37.334.4
29.625.2
19.6
14.814.712.2
17.616.919.6
14.917.6
15.716.717.8
27.6
19.717.3
14.4
0
5
10
15
20
25
30
35
40
3 4 5 6 7 8 9 2K 1 2 3 4 5 6 7 8 9 10 11 12
51
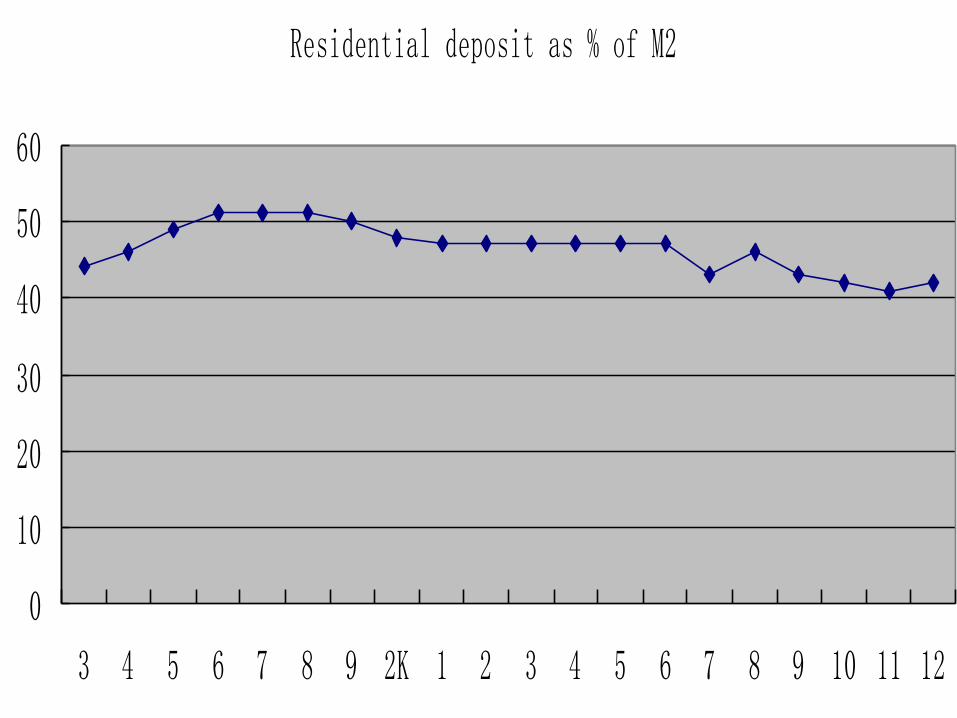
Residential deposit as % of M2
0
10
20
30
40
50
60
3 4 5 6 7 8 9 2K 1 2 3 4 5 6 7 8 9 10 11 12
52 52
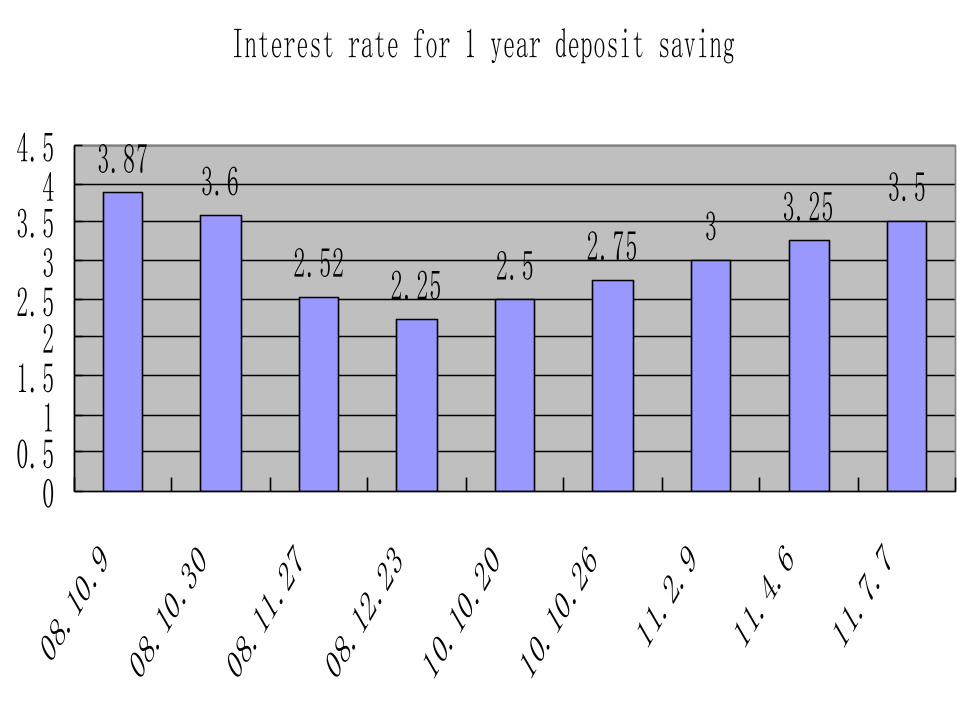
Interest rate for 1 year deposit saving
3.873.6
2.522.25 2.5 2.75 3 3.25 3.5
00.5
11.5
22.5
33.5
44.5
08.10.9
08.10.30
08.11.27
08.12.23
10.10.20
10.10.26
11.2.9
11.4.6
11.7.7
53
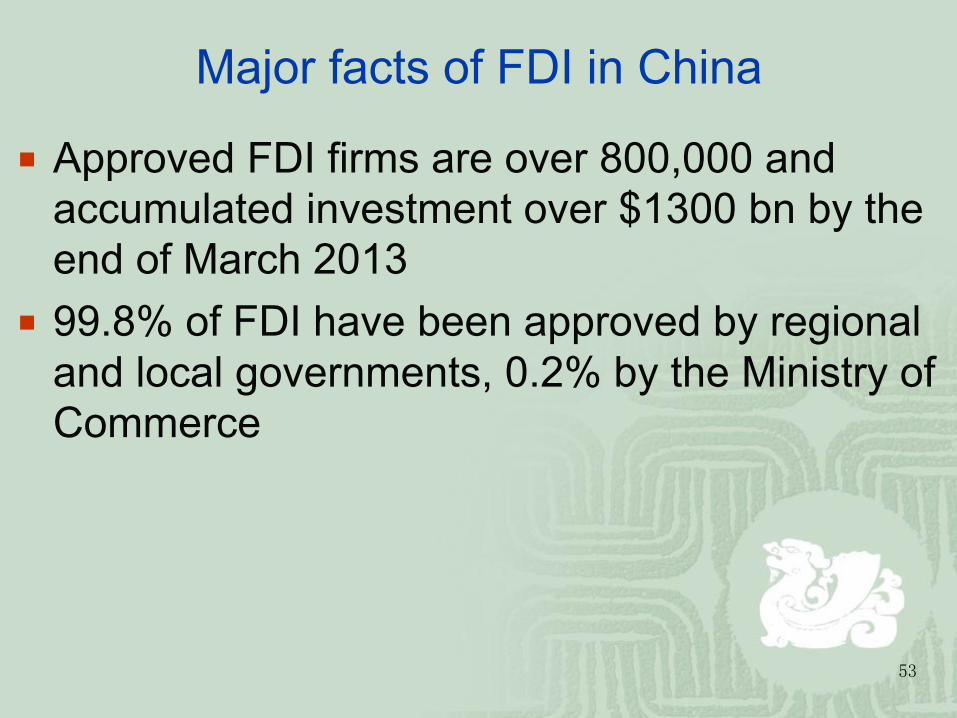
Major facts of FDI in China
¡ Approved FDI firms are over 800,000 and accumulated investment over $1300 bn by the end of March 2013
¡ 99.8% of FDI have been approved by regional and local governments, 0.2% by the Ministry of Commerce

54 54
Inflow FDI in China, projects
010000200003000040000
5000060000700008000090000
91 92 93 94 95 96 97 98 99 2k 1 2 3 4 5 6 7 8 9 10 11 12
55 55
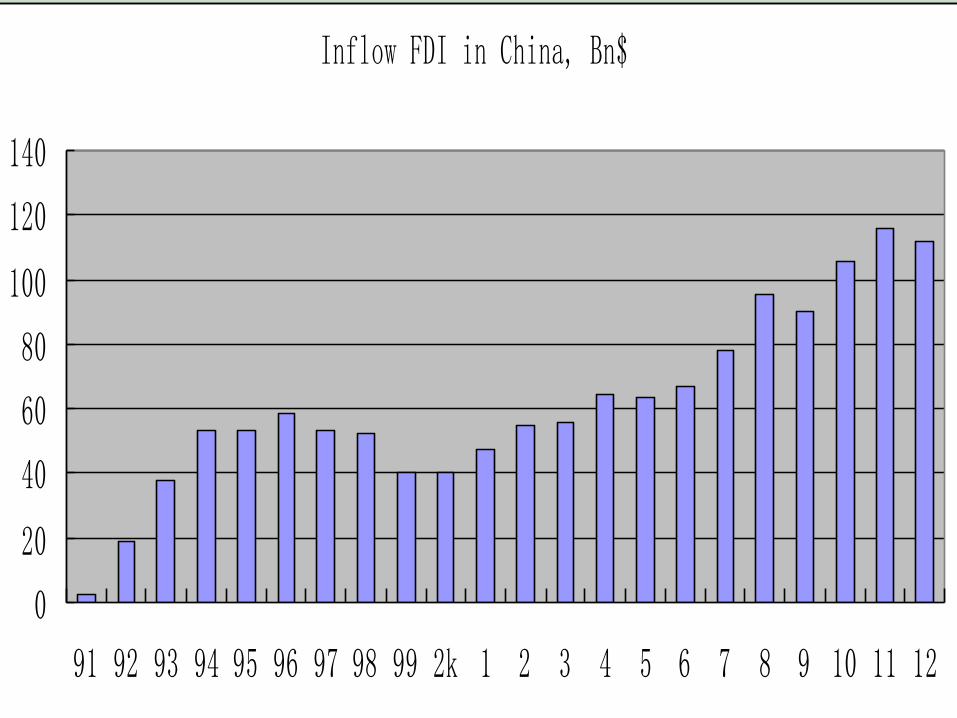
Inflow FDI in China, Bn$
0
20
40
60
80
100
120
140
91 92 93 94 95 96 97 98 99 2k 1 2 3 4 5 6 7 8 9 10 11 12
56 56
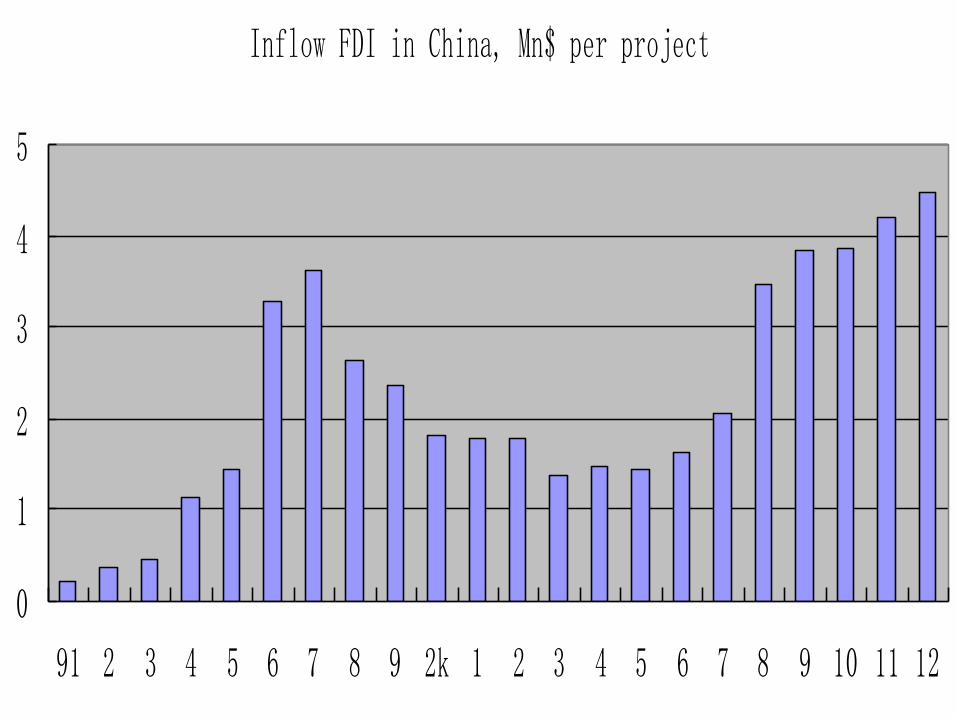
Inflow FDI in China, Mn$ per project
0
1
2
3
4
5
91 2 3 4 5 6 7 8 9 2k 1 2 3 4 5 6 7 8 9 10 11 12

57
Chinese FX reserves and the end of year in 100 million US$ and growth rate
58 58
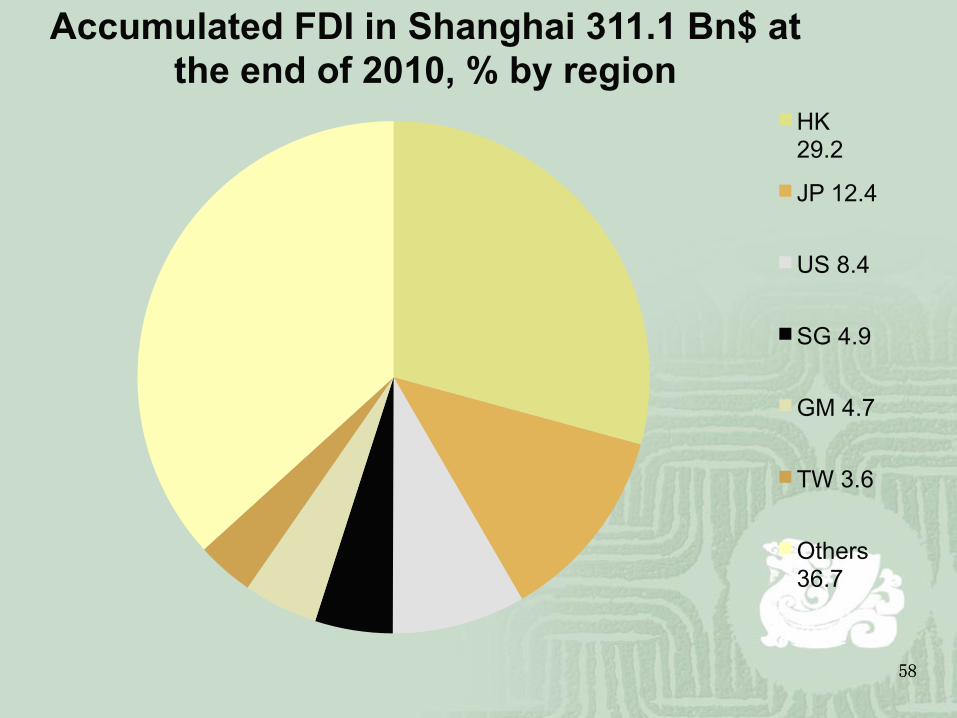
Accumulated FDI in Shanghai 311.1 Bn$ at the end of 2010, % by region
HK 29.2
JP 12.4
US 8.4
SG 4.9
GM 4.7
TW 3.6
Others 36.7
59 59
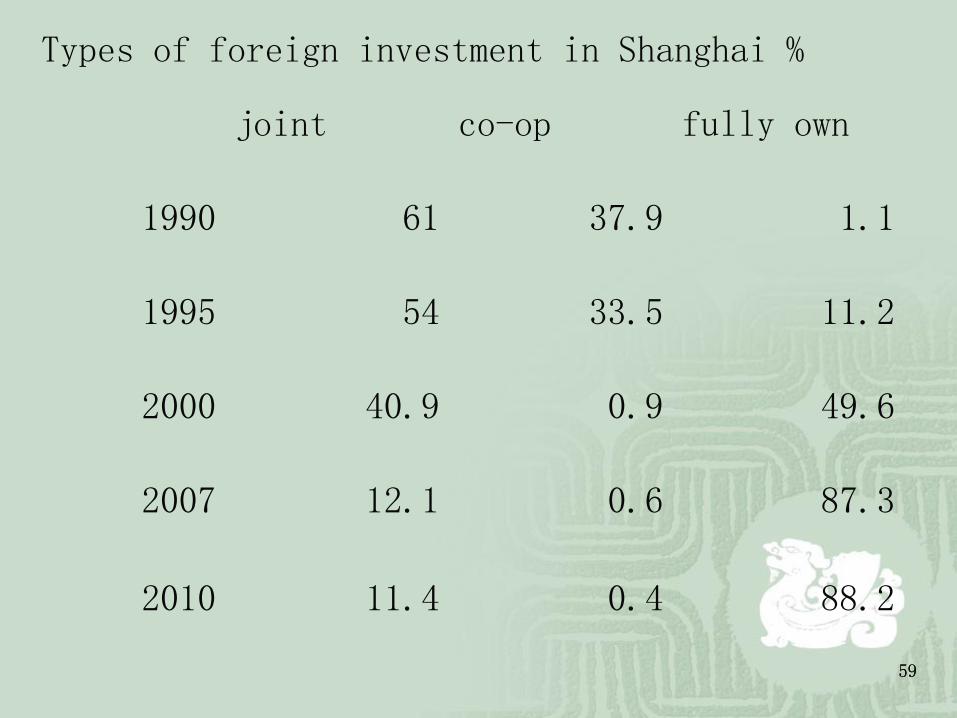
Types of foreign investment in Shanghai %
joint co-op fully own
1990 61 37.9 1.1
1995 54 33.5 11.2
2000 40.9 0.9 49.6
2007 12.1 0.6 87.3
2010 11.4 0.4 88.2
60 60
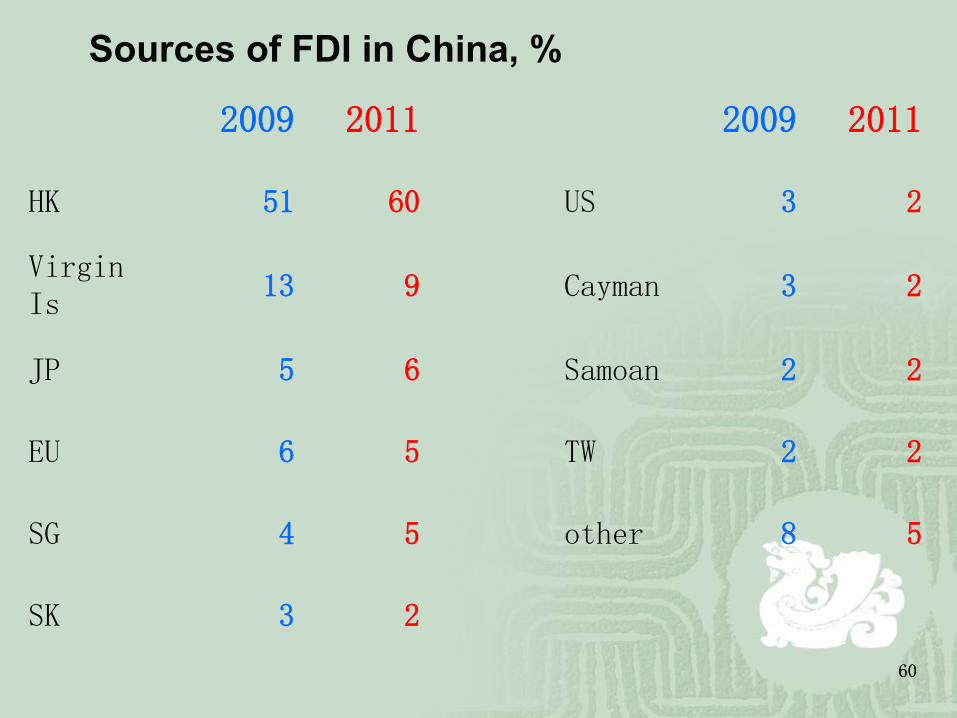
2009 2011 2009 2011
HK 51 60 US 3 2
Virgin Is 13 9 Cayman 3 2
JP 5 6 Samoan 2 2
EU 6 5 TW 2 2
SG 4 5 other 8 5
SK 3 2
Sources of FDI in China, %

61 61
2006 2011 2006 2011
Manufacturing 63.6 44.9 R&D,
technical serv
0.8 2.1
Real estate 13.1 23.2 Utility 2 1.8
Wholesale & retail 2.8 7.3 Agriculture 1 1.7
Leasing & business 6.7 7.2 Service Household 0.8 1.6
Transportation 3.1 2.8 Financial intermed <0.1 1.6
IT 1.7 2.3 Others 5.4 3.5
FDI in China by sectors, %

0
10
20
30
40
50
60
70
80
90
100
3 4 5 6 7 8 9 10 11 12 13
Chinese outbound FDI, Bn $
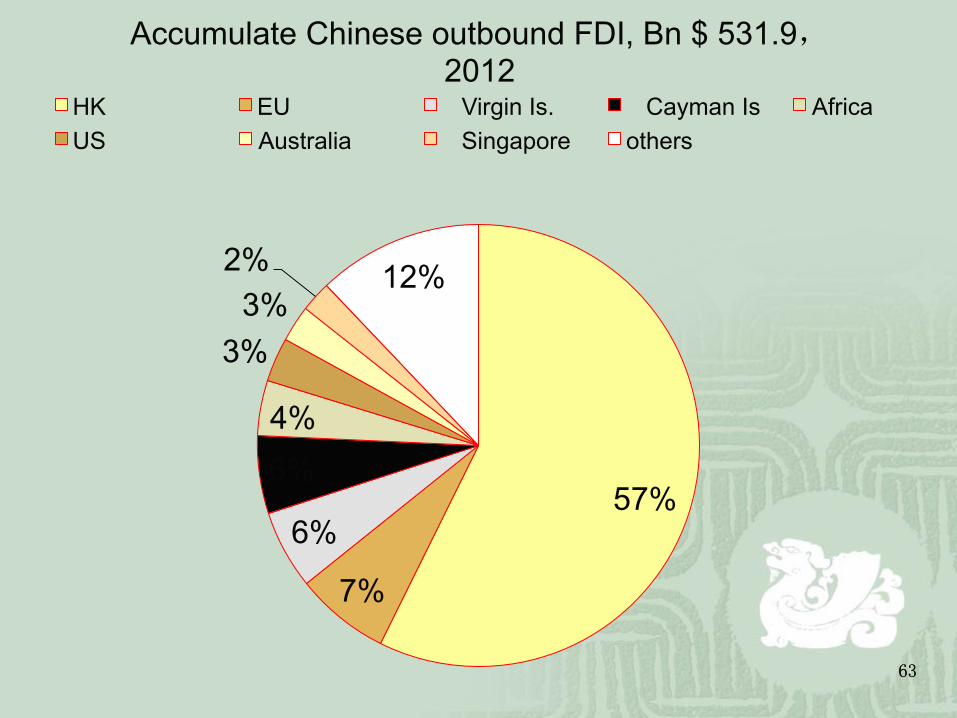
63 63
57%
7%
6%
6% 4%
3% 3%
2% 12%
Accumulate Chinese outbound FDI, Bn $ 531.9, 2012
HK EU Virgin Is. Cayman Is Africa US Australia Singapore others

64
Flood in hot money
¡ Overseas mutual funds: strategic moves ¡ Appreciation of RMB: pro and con, but
inevitable, case of investment of water business
¡ High margin of interests between loan and saving account: 3.0% in year 2012
¡ Business reaction: speculation, gamble and investment
¡ Firm’s decision: going to abroad?
65
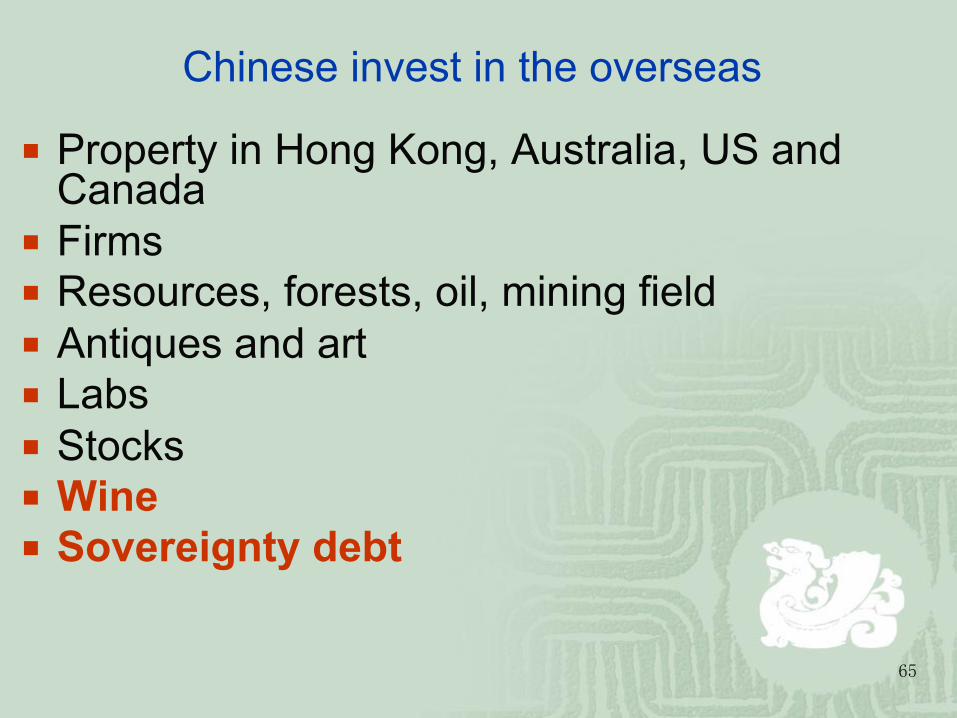
Chinese invest in the overseas
¡ Property in Hong Kong, Australia, US and Canada
¡ Firms ¡ Resources, forests, oil, mining field ¡ Antiques and art ¡ Labs ¡ Stocks ¡ Wine ¡ Sovereignty debt

66 0
500
1000
1500
2000
2500
8 9 90 1 2 3 4 5 6 7 8 9 2K 1 2 3 4 5 6 7 8 9 10 11 12 13
Chinese foreign trade, Bn$
expotrs imports

67 -50
0
50
100
150
200
250
300
350
8 9 90 1 2 3 4 5 6 7 8 9 2K 1 2 3 4 5 6 7 8 9 10 11 12 13
Chinese foreign trade, balance, Bn $
68
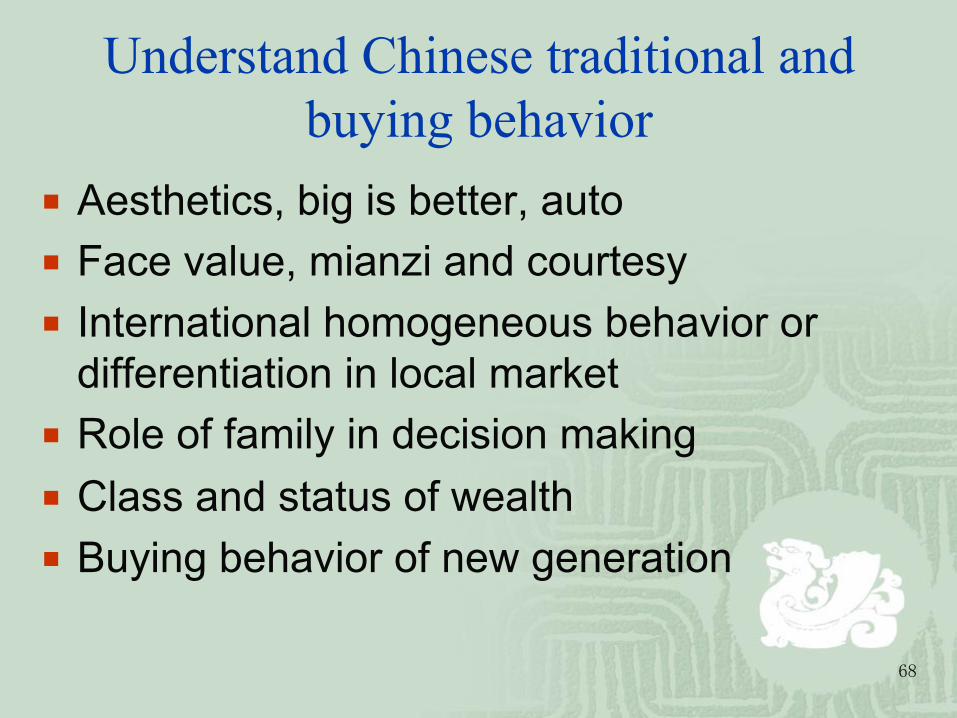
Understand Chinese traditional and buying behavior
¡ Aesthetics, big is better, auto ¡ Face value, mianzi and courtesy ¡ International homogeneous behavior or
differentiation in local market ¡ Role of family in decision making ¡ Class and status of wealth ¡ Buying behavior of new generation
69
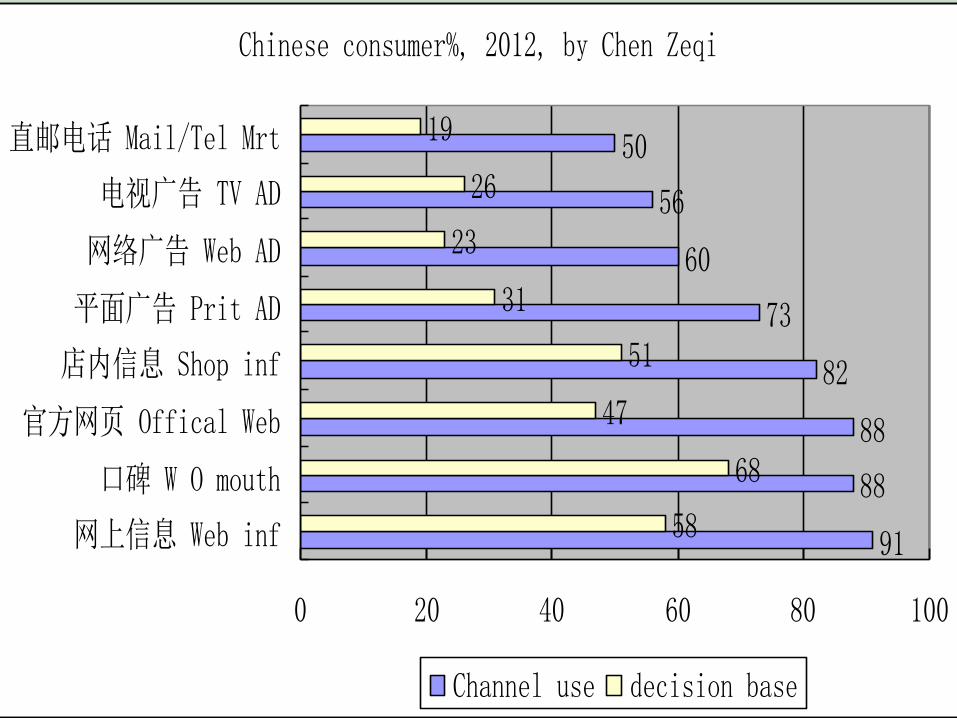
Chinese consumer%, 2012, by Chen Zeqi
91
88
88
82
73
60
56
50
58
68
47
51
31
23
26
19
0 20 40 60 80 100
网上信息 Web inf
口碑 W O mouth
官方网页 Offical Web
店内信息 Shop inf
平面广告 Prit AD
网络广告 Web AD
电视广告 TV AD
直邮电话 Mail/Tel Mrt
Channel use decision base
70 70
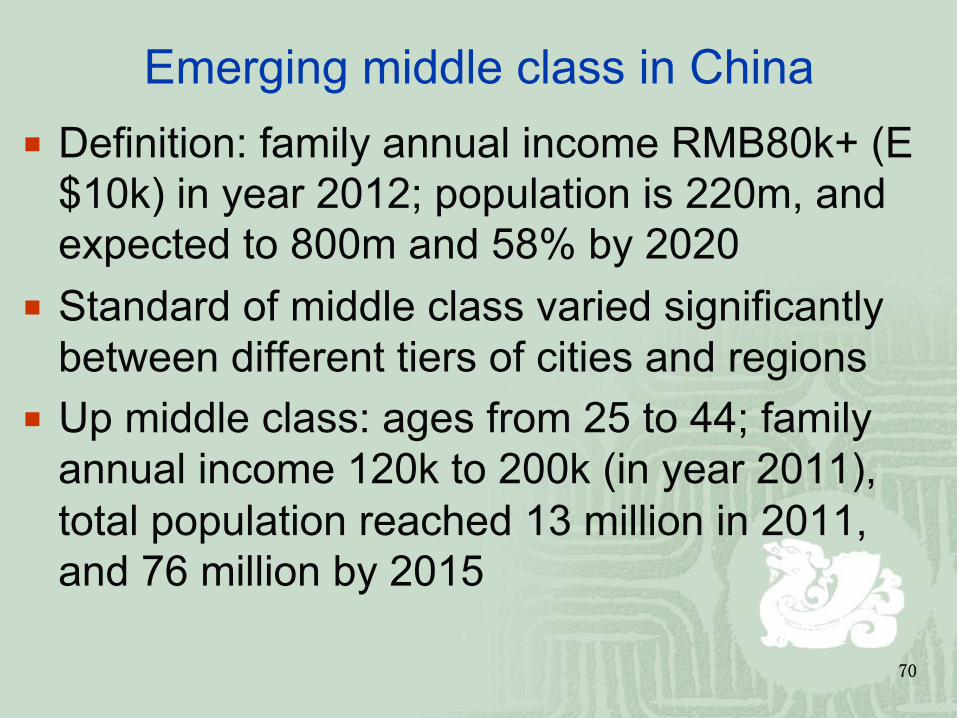
Emerging middle class in China ¡ Definition: family annual income RMB80k+ (E
$10k) in year 2012; population is 220m, and expected to 800m and 58% by 2020
¡ Standard of middle class varied significantly between different tiers of cities and regions
¡ Up middle class: ages from 25 to 44; family annual income 120k to 200k (in year 2011), total population reached 13 million in 2011, and 76 million by 2015
71 71
Emerging affluent class and lower middle class in China
¡ Affluent class: family assets for investment annual income is more than 6 million, total population is 2.7 million in year 2012. Their average assets is 50 million, spend 1.5 million in consumption, and average age is 39.
¡ Their demand for banking services are tour, health services and children education.
¡ Population of family assets more than 100 million is estimated 63500.
72 72
Emerging middle class in China ¡ Lower middle class – ignorable consumers: family
annual income 30k to 60k, total population is over 300 million in 2010 and 500 million by 2020
¡ Very fragile to social security, less covered by social welfare, then hesitate to spend money
¡ China is the third largest consumer market, 9% of the world market share; will be the second largest market and 14% in 2015 and 22% in 2020
¡ Residents are willing to consume more in small and medium size cities than in large cities

73
Social class and their income in Shanghai in 2014
¡ Current wages and salaries of employees working in enterprises are as follows (in RMB per month per person):
¡ Senior management personnel 50k and more, ¡ Ordinary management personnel 8k-50k, ¡ Skilled labor 6k-20k ¡ Ordinary labor 1.82k-6k ¡ Social average 4.8k per person
74 74
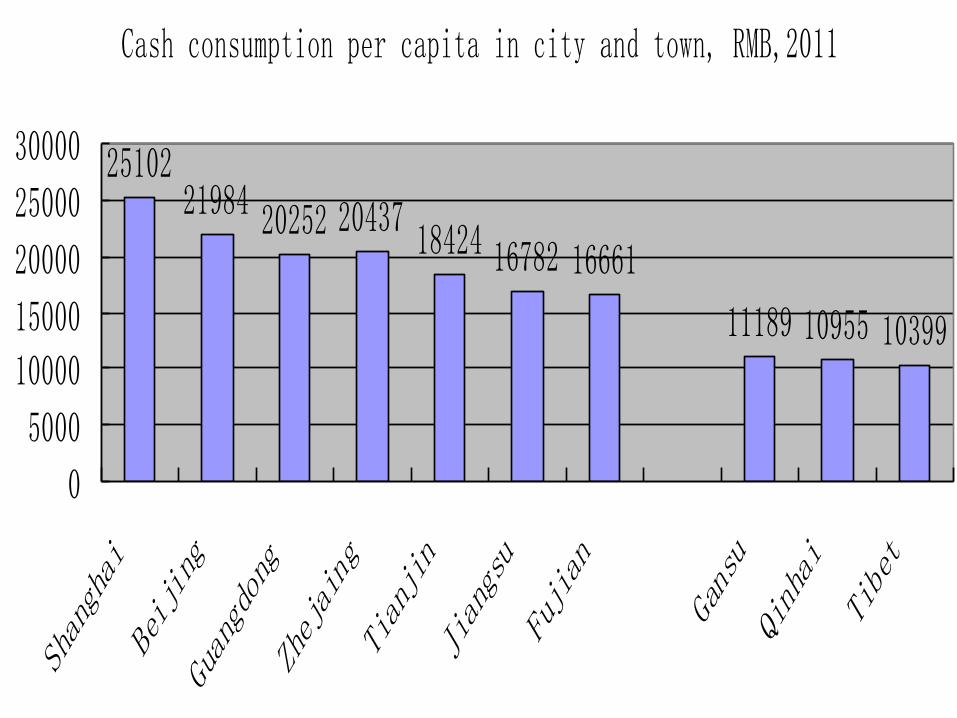
Cash consumption per capita in city and town, RMB,2011
2510221984 20252 20437
18424 16782 16661
11189 10955 10399
0
5000
10000
15000
20000
25000
30000
Shanghai
Beijing
Guangdong
Zhejaing
Tianjin
Jiangsu
Fujian
Gansu
Qinhai
Tibet
75 75
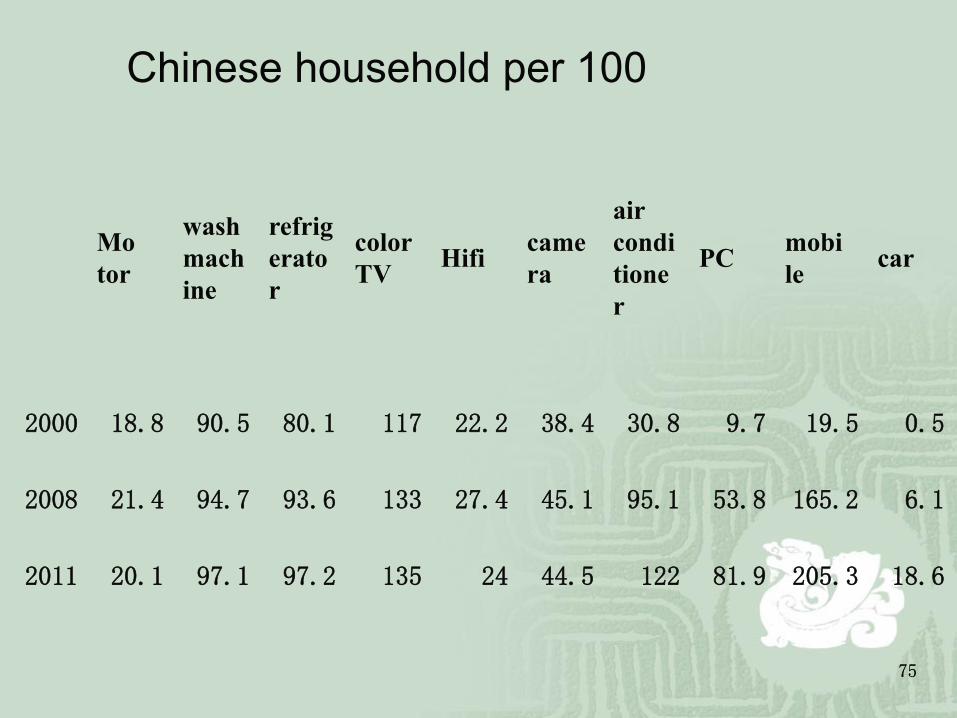
Mo tor
wash machine
refrigerator
color TV Hifi came
ra
air conditioner
PC mobi le car
2000 18.8 90.5 80.1 117 22.2 38.4 30.8 9.7 19.5 0.5
2008 21.4 94.7 93.6 133 27.4 45.1 95.1 53.8 165.2 6.1
2011 20.1 97.1 97.2 135 24 44.5 122 81.9 205.3 18.6
Chinese household per 100
76
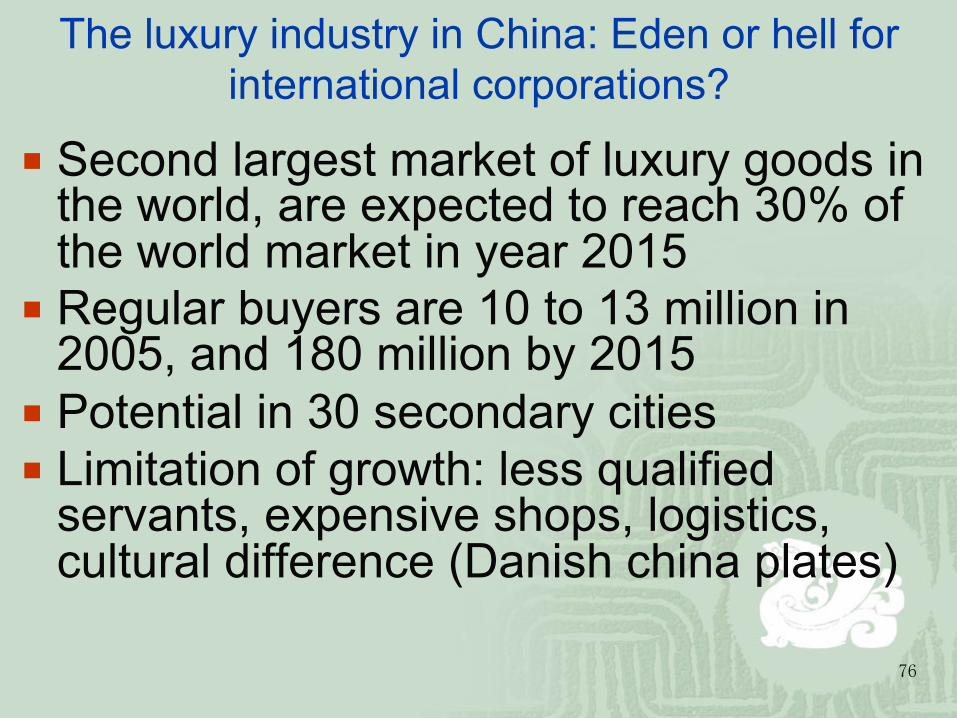
The luxury industry in China: Eden or hell for international corporations?
¡ Second largest market of luxury goods in the world, are expected to reach 30% of the world market in year 2015
¡ Regular buyers are 10 to 13 million in 2005, and 180 million by 2015
¡ Potential in 30 secondary cities ¡ Limitation of growth: less qualified
servants, expensive shops, logistics, cultural difference (Danish china plates)
77
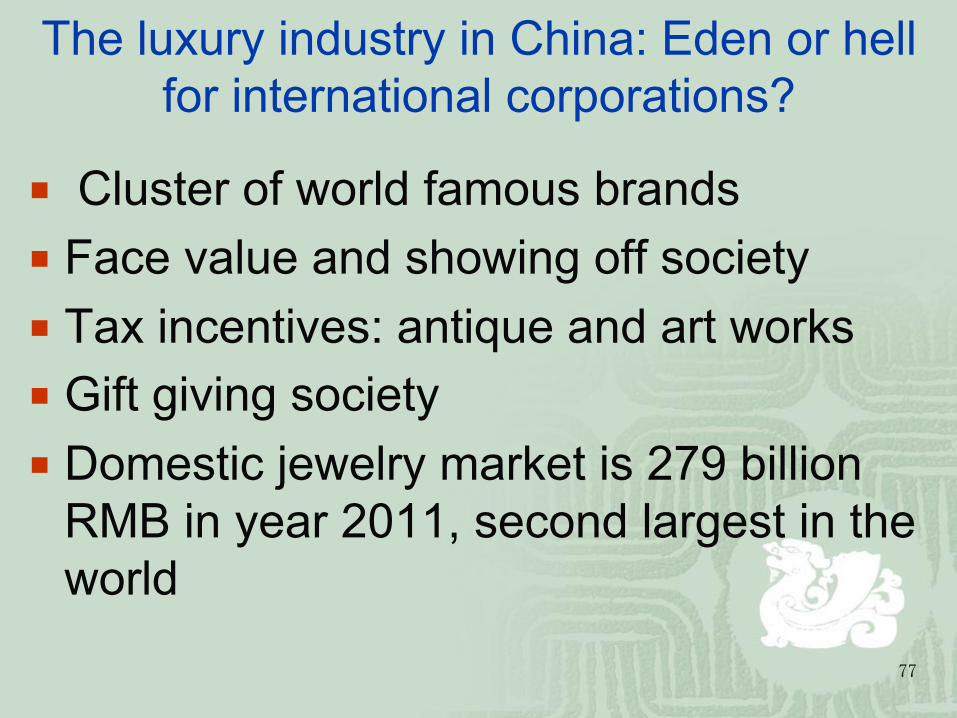
The luxury industry in China: Eden or hell for international corporations?
¡ Cluster of world famous brands ¡ Face value and showing off society ¡ Tax incentives: antique and art works ¡ Gift giving society ¡ Domestic jewelry market is 279 billion
RMB in year 2011, second largest in the world
78
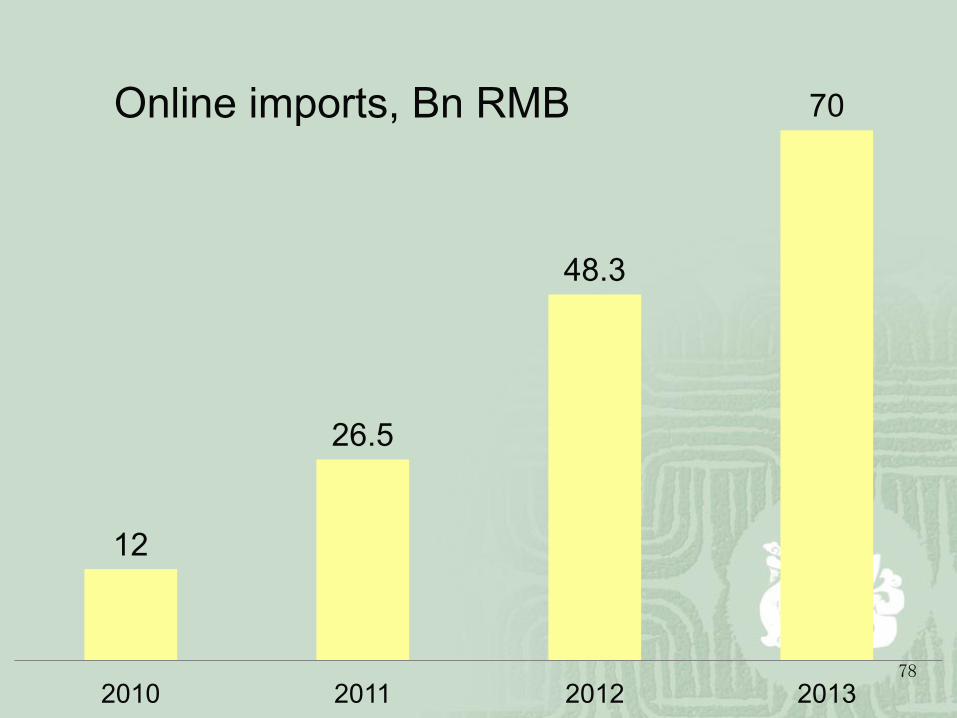
12
26.5
48.3
70
2010 2011 2012 2013
Online imports, Bn RMB
79
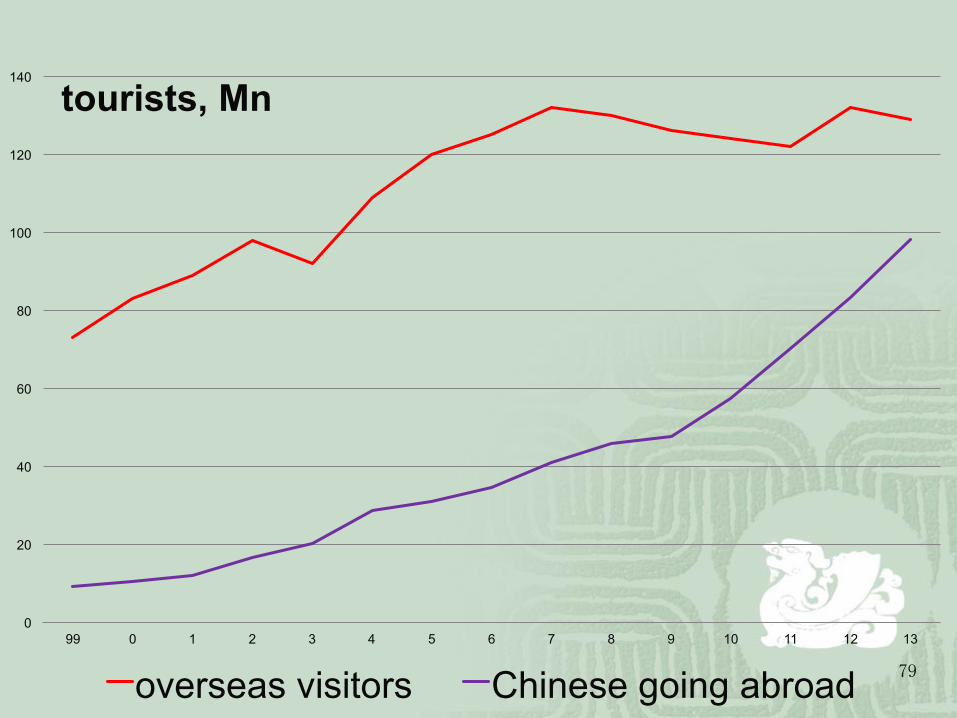
0
20
40
60
80
100
120
140
99 0 1 2 3 4 5 6 7 8 9 10 11 12 13
tourists, Mn
overseas visitors Chinese going abroad

80 80
Consumption by tourists in the overseas in year 2012, billion $
Chinese 102(72.6 in 2011), German 83.8(85.9 in 2011), American 83.7, British 52.3, Russia 42.8
The World Tourism Organization (UNWTO/OMT)
81
Law of ownership of land ¡ Ownership of land by the State is not affected by the
transfer of land use rights for valuable consideration. ¡ Unless otherwise stated in the grant contract, or
disallowed for planning reasons, the term may be extended on application by the grantee; the land use right may be assigned or mortgaged by the grantee, as well as inherited.
82
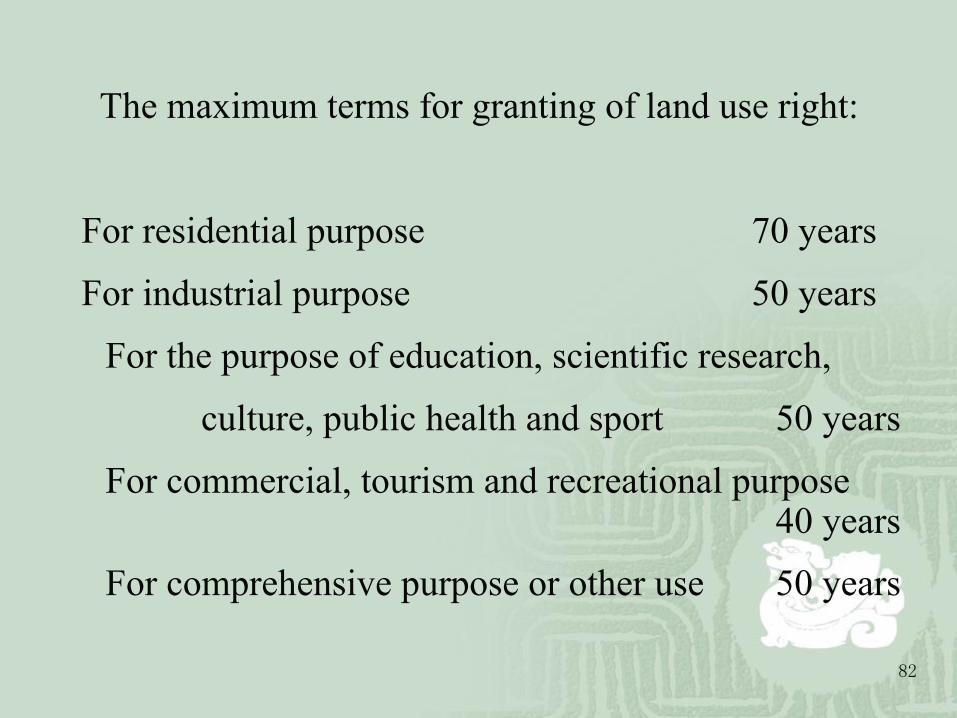
The maximum terms for granting of land use right:
For residential purpose 70 years
For industrial purpose 50 years
For the purpose of education, scientific research,
culture, public health and sport 50 years
For commercial, tourism and recreational purpose 40 years
For comprehensive purpose or other use 50 years

83
Sum up ¡ Cultural communication skills, face value and social
contacts ¡ Talent personnel and high turnover ¡ Regional differences, potential in rural areas ¡ Availability of infrastructure ¡ Emerging industries ¡ Increasing labor costs ¡ Opportunities in luxury industries, examples ¡ Branding orientation ¡ From OEM to OBM