understanding economics chapter 10 inflation and unemployment copyright © 2005 by mcgraw-hill...
Post on 21-Dec-2015
213 views
TRANSCRIPT

Understanding Economics
Chapter 10Inflation and Unemployment
Copyright © 2005 by McGraw-Hill Ryerson Limited. All rights reserved.
3rd editionby Mark Lovewell, Khoa Nguyen and Brennan Thompson

Copyright © 2005 by McGraw-Hill Ryerson Limited. All rights reserved.
Learning Objectives
In this chapter you will:1. learn about inflation, how it is measured,
and its effect on nominal and real incomes
2. examine the official unemployment rate, the different types of unemployment, and the definition of full employment

Copyright © 2005 by McGraw-Hill Ryerson Limited. All rights reserved.
The Consumer Price Index
The consumer price index (CPI)• is the most common measure of inflation• monitors price changes in a
representative “shopping basket” of consumer products
• includes quantities in a shopping basket determined in a base year
• compares prices in the current year with those in the base year

Copyright © 2005 by McGraw-Hill Ryerson Limited. All rights reserved.
Simple Consumer Price IndexFigure 10.1, Page 223
Prices QuantityConsumedper Month
Expenditureper Month
Weights
$20
$30
$50
$20 ÷ $50 = 0.4$40 ÷ $50 = 0.6
1030
$2.00
$1.00
Hamburgers
Milkshakes
Results of 2003 Survey
Prices 2004 Price 2003 Quantity
$2.20 x 10 = $22.00
$1.05 x 30 = $31.50
$53.50
$2.20
$1.05
Hamburgers
Milkshakes
Prices in 2004

Copyright © 2005 by McGraw-Hill Ryerson Limited. All rights reserved.
Consumer Price Index Weights (1992)Figure 10.2, Page 224
Food 18.0%
Shelter 27.9%Household operationsand furnishings 10.0%
Clothing and footwear 6.6%
Transportation 18.3%
Health and personal care 4.3%
Recreation, education,and reading 10.4% Alcoholic beverages and
tobacco products 4.5%

Copyright © 2005 by McGraw-Hill Ryerson Limited. All rights reserved.
Nominal Versus Real Income
Nominal income is expressed in current dollars
Real income• is expressed in base-year dollars• equals nominal income divided by CPI
(expressed in hundredths)

Copyright © 2005 by McGraw-Hill Ryerson Limited. All rights reserved.
The Limitations of the CPI
The CPI does not take full account of• consumer differences, since it is based on
the consumption patterns of an average household
• changes in spending patterns since it uses base-year quantities
• improvements in product quality

Copyright © 2005 by McGraw-Hill Ryerson Limited. All rights reserved.
The GDP Deflator
The GDP deflator• indicates price changes for all products
appearing in GDP• includes quantities that change each year• compares prices in the current year with
those in a reference year
Copyright © 2005 by McGraw-Hill Ryerson Limited. All rights reserved.
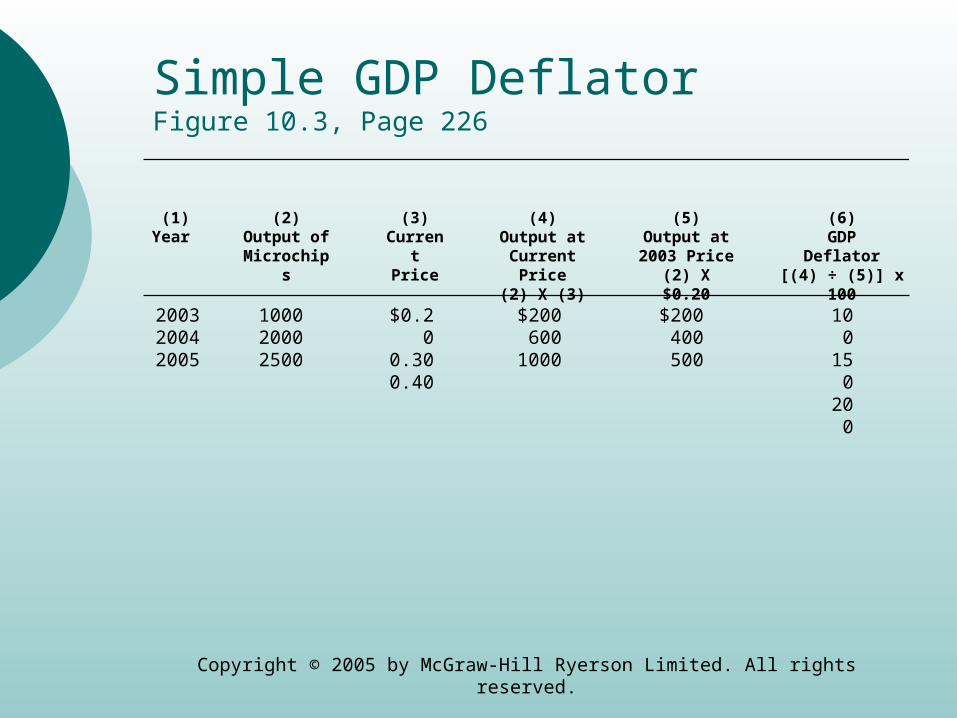
Simple GDP DeflatorFigure 10.3, Page 226
(1)Year
(2)Output ofMicrochip
s
(3)Curren
tPrice
(4)Output atCurrent
Price(2) X (3)
$0.20
0.300.40
$200600
1000
100020002500
200320042005
(5)Output at2003 Price
(2) X $0.20$200400500
(6)GDP
Deflator[(4) ÷ (5)] x 100
100
150
200

Copyright © 2005 by McGraw-Hill Ryerson Limited. All rights reserved.
Finding Real Gross Domestic ProductFigure 10.4, Page 227
(1)Year
(2)Nominal GDP
(current $ billions)
(3)GDP Deflator(1997 = 100)
92.68100.0
0107.4
8
$ 700
.5882.7
1154.9
199219972002
(4)Real GDP
(1997 $ billions)[(2) ÷ (3)] x 100
$ 755.
8882.7
1074.5
Copyright © 2005 by McGraw-Hill Ryerson Limited. All rights reserved.
Nominal Versus Real GDP
Nominal GDP• is expressed in current dollars
Real GDP• is expressed in reference-year dollars• equals nominal GDP divided by the GDP
deflator (expressed in hundredths)

Copyright © 2005 by McGraw-Hill Ryerson Limited. All rights reserved.
The Inflation RateFigure 10.5, Page 228

Copyright © 2005 by McGraw-Hill Ryerson Limited. All rights reserved.
Inflation’s Effects (a)
Inflation redistributes purchasing power in arbitrary ways because of various types of indexation• full indexation (nominal income rises at
the inflation rate)• partial indexation (nominal income rises
at less than the inflation rate)• fixed incomes (nominal income stays
constant)

Copyright © 2005 by McGraw-Hill Ryerson Limited. All rights reserved.
Inflation’s Effects (b)
Inflation can also redistribute purchasing power between borrowers and lenders• borrowers win if actual inflation >
anticipated inflation• lenders win if actual inflation <
anticipated inflation• borrowers and lenders are unaffected if
actual inflation = anticipated inflation

Copyright © 2005 by McGraw-Hill Ryerson Limited. All rights reserved.
The Labour Force Survey (a)
The labour force survey tracks a randomly selected sample of Canadian households
The survey measures• the labour force population, which
includes Canadians 15 years of age or over, with specific exclusions
• the labour force, which includes all those who either have a job or are actively seeking employment

Copyright © 2005 by McGraw-Hill Ryerson Limited. All rights reserved.
The Labour Force Survey (b)
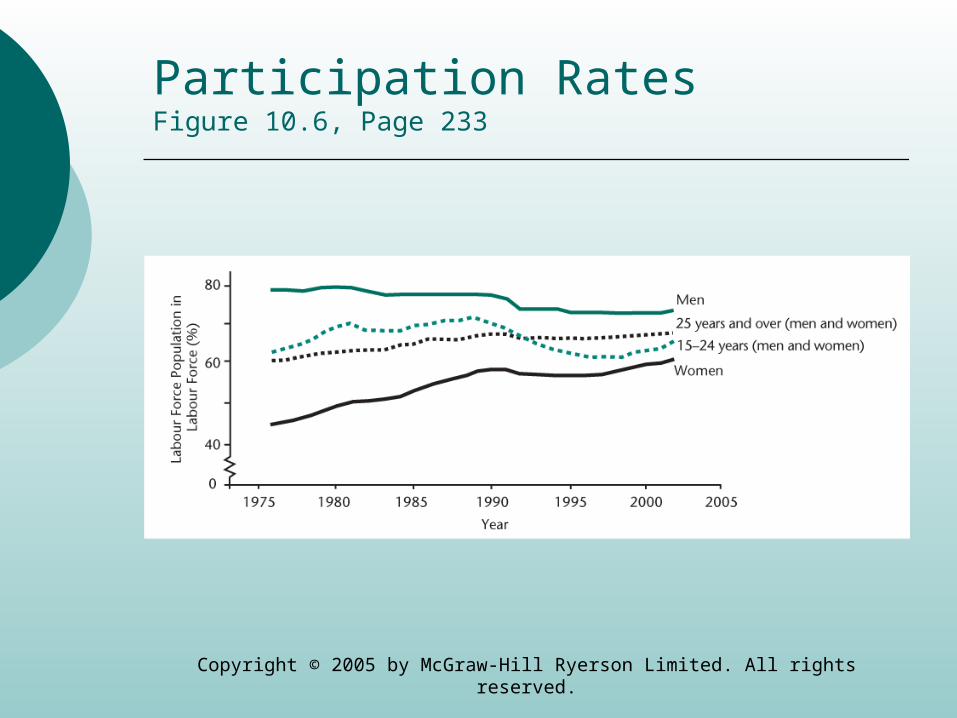
The survey also measures• the participation rate, which is the
percentage of the labour force population that makes up the labour force
• the official unemployment rate, which is the number of unemployed people in the labour force as a percentage of the entire labour force
Copyright © 2005 by McGraw-Hill Ryerson Limited. All rights reserved.
Participation RatesFigure 10.6, Page 233

Copyright © 2005 by McGraw-Hill Ryerson Limited. All rights reserved.
The Canadian Labour Force (2002)Figure 10.7, Page 233
Participation rate = labour force
labour force populationx 100 = 16 689 400
24 945 100x 100 = 66.9%
Unemployment rate (%)= Unemployed in labour force
labour forcex 100 = 1 277 600
16 689 400x 100 = 7.7%

Copyright © 2005 by McGraw-Hill Ryerson Limited. All rights reserved.
Drawbacks of the Official Unemployment Rate
There are three main drawbacks of the official unemployment rate• it does not include underemployed
workers who are underutilized either as part-time workers or by working at jobs not appropriate to their skills or education
• it excludes discouraged workers who are unemployed and have given up looking for work
• it may depend on dishonest responses

Copyright © 2005 by McGraw-Hill Ryerson Limited. All rights reserved.
Types of Unemployment
There are four types of unemployment• frictional unemployment is due to being
temporarily between jobs or looking for a first job
• structural unemployment is due to a mismatch between people and jobs
• cyclical unemployment is due to fluctuations in output and spending
• seasonal unemployment is due to the seasonal nature of some occupations and industries

Copyright © 2005 by McGraw-Hill Ryerson Limited. All rights reserved.
Full Employment
Full employment• is the highest reasonable expectation of
employment for the economy as a whole• is defined in terms of the natural
unemployment rate, which includes frictional and at least some structural unemployment
• in Canada is presently associated with an unemployment rate between 6% and 7%

Copyright © 2005 by McGraw-Hill Ryerson Limited. All rights reserved.
The Unemployment RateFigure 10.8, Page 235

Copyright © 2005 by McGraw-Hill Ryerson Limited. All rights reserved.
The Rise in the Natural Unemployment Rate
In recent decades Canada’s estimated natural unemployment rate rose because of several main trends• structural change, with shrinking
manufacturing and expanding services• past reforms to unemployment insurance
(some of which have been reversed)• higher minimum wages in many
provinces

Copyright © 2005 by McGraw-Hill Ryerson Limited. All rights reserved.
Unemployment Rates by Province, Gender, and Age (2002) Figure 10.9, Page 237
16.9
7.1
12.1
10.4
8.69.7
5.2 5.7 5.3
8.5
7.18.1
13.6
6.4
Province Gender Age
Une
mpl
oym
ent
rate
(%
)
New PE
I
NS
NB
Que
Ont
Man
Sas
k
Alta BC
Wom
en
Men
15-2
4
25+
5
10
15

Copyright © 2005 by McGraw-Hill Ryerson Limited. All rights reserved.
The Costs of Unemployment
High unemployment hurts individuals and the Canadian economy as a whole
The cost of unemployment for the entire economy can be measured by the difference between actual real output and potential output which is the real output associated with full employment

Copyright © 2005 by McGraw-Hill Ryerson Limited. All rights reserved.
Okun’s Law
According to Okun’s Law for every % point that the unemployment rate exceeds the natural unemployment rate, the gap between potential output and real output is 2.5%
Copyright © 2005 by McGraw-Hill Ryerson Limited. All rights reserved.
Boom Bust & Echo (a)
David Foot suggests that our ages can give us insights into our economic futures• the baby boom generation (born between
1947 and 1966) which includes Generation X (born between 1960 and 1966)
• the baby bust generation (born between 1967 and 1979)
• the baby boom echo (born between 1980 and 1995) which includes Generation X-II (born between 1990 and 1995)

Copyright © 2005 by McGraw-Hill Ryerson Limited. All rights reserved.
Boom Bust & Echo (b)
According to Foot• economic conditions are easiest for the
baby bust generation and the first parts of the baby boom generation and baby boom echo
• economic conditions are hardest for Generation X and Generation X-II

Copyright © 2005 by McGraw-Hill Ryerson Limited. All rights reserved.
Canada’s Population Pyramids, 1998Figure A, Page 244
Population in thousands
300 250 200 150 100 50 0 50 100 150 200 250 3000
10
20
30
40
50
60
70
80
90
Ag
e
Male Female

Understanding Economics
Chapter 10The End
Copyright © 2005 by McGraw-Hill Ryerson Limited. All rights reserved.
3rd editionby Mark Lovewell, Khoa Nguyen and Brennan Thompson