understanding fingerprint biometrics this instance, the algorithm extracts identifying points, known...
TRANSCRIPT

TECHNICAL SPECIFICATIONS
Understanding Fingerprint Biometrics
A brief look at fingerprints, how they are processed and how the accuracy of a biometric
system is measured.
©iPulse Systems
7/1/2014

Understanding Fingerprint Biometrics v1.3a
© 2014, iPulse Systems Page 1 of 14
CONTENTS
Document History ................................................................................................................................................... 2
Fingerprints: A brief overview ................................................................................................................................ 3
Basic Patterns ..................................................................................................................................................... 3
Minutiae ............................................................................................................................................................. 3
Common minutia points ................................................................................................................................. 4
The fingerprint enrollment process ........................................................................................................................ 5
Image Enhancement ........................................................................................................................................... 6
Image analysis ..................................................................................................................................................... 6
Binary processing ................................................................................................................................................ 6
Thinning .............................................................................................................................................................. 7
Ridge reconstruction .......................................................................................................................................... 7
Minutiae extraction ........................................................................................................................................... 8
Measuring performance on biometric systems ...................................................................................................... 9
Core metrics...................................................................................................................................................... 10
False Rejection Rate (FRR) ............................................................................................................................ 10
False Acceptance Rate (FAR) ........................................................................................................................ 10
Equal Error Rate (EER) .................................................................................................................................. 10
How to deal with false acceptances ..................................................................................................................... 10
What’s going on? .............................................................................................................................................. 10
So why does that happen? ............................................................................................................................... 10
How do I fix it? .................................................................................................................................................. 11
Increase the Identification Security Level ..................................................................................................... 11
Re-enroll People who experience difficulty using the System ..................................................................... 11
Training ......................................................................................................................................................... 12
I did that and it still doesn’t work ..................................................................................................................... 12
Certification Authorities ....................................................................................................................................... 12
The MINEX Certification ................................................................................................................................... 12
Comparing FRR / FAR ratings on fingerprint, facial and voice biometrics ........................................................ 13
1:1 Matching vs 1:N Matching .............................................................................................................................. 13
1:N (One-to-Many) matching ........................................................................................................................... 13
Benefits ......................................................................................................................................................... 13
Drawbacks .................................................................................................................................................... 13
1:1 (One-to-One) matching .............................................................................................................................. 14
Benefits ......................................................................................................................................................... 14
Drawbacks .................................................................................................................................................... 14

Understanding Fingerprint Biometrics v1.3a
© 2014, iPulse Systems Page 2 of 14
Multi-Factor Authentication ............................................................................................................................. 14
DOCUMENT HISTORY
A list of all changes made to this document since its inception.
Document Version
Date modified Modified by Changes
1.0 2014-03-04 K Potgieter Document creation
1.1 2014-07-03 F van Loggerenberg Changes to fingerprint overview & enrollment
1.2 2014-07-03 G Chalmers Layout and pagination
1.3 2015-06-24 K Potgieter, F van Loggerenberg
Added section on dealing with false accceptances
1.3a 2015-06-26 F van Loggerenberg Additional info included in training section, removed sections that weren’t applicable
Understanding Fingerprint Biometrics v1.3a
© 2014, iPulse Systems Page 3 of 14
FINGERPRINTS: A BRIEF OVERVIEW
Biometric data is extracted from the captured fingerprints using an algorithm unique to each device
manufacturer. An algorithm is a step-by-step procedure for calculations, used for data processing and
automated reasoning.
In this instance, the algorithm extracts identifying points, known as minutiae, from the image of a person’s
fingerprint. These points, based on the patterns found on the fingerprint, are mapped as a series of data points
called a minutiae string. A biometric template is constructed from at least two minutiae strings, and this what
gets stored for later use in a database or on a device.
BASIC PATTERNS
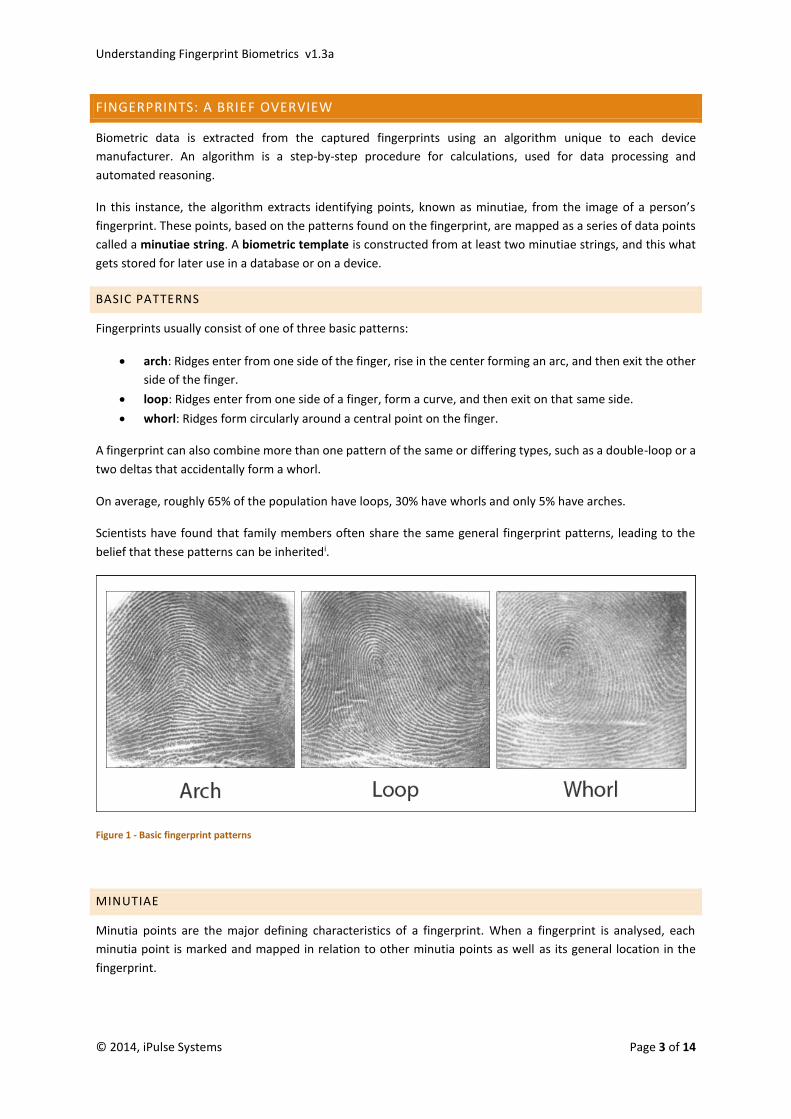
Fingerprints usually consist of one of three basic patterns:
arch: Ridges enter from one side of the finger, rise in the center forming an arc, and then exit the other
side of the finger.
loop: Ridges enter from one side of a finger, form a curve, and then exit on that same side.
whorl: Ridges form circularly around a central point on the finger.
A fingerprint can also combine more than one pattern of the same or differing types, such as a double-loop or a
two deltas that accidentally form a whorl.
On average, roughly 65% of the population have loops, 30% have whorls and only 5% have arches.
Scientists have found that family members often share the same general fingerprint patterns, leading to the
belief that these patterns can be inheritedi.
Figure 1 - Basic fingerprint patterns
MINUTIAE
Minutia points are the major defining characteristics of a fingerprint. When a fingerprint is analysed, each
minutia point is marked and mapped in relation to other minutia points as well as its general location in the
fingerprint.
Understanding Fingerprint Biometrics v1.3a
© 2014, iPulse Systems Page 4 of 14
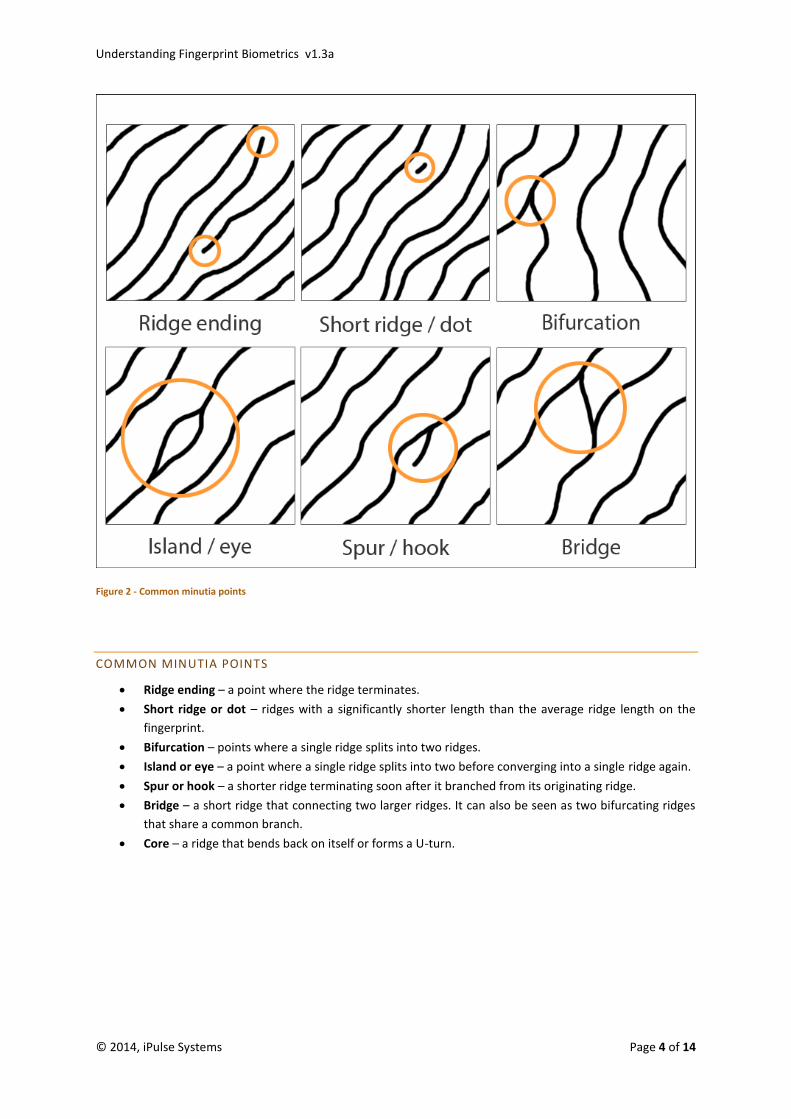
Figure 2 - Common minutia points
COMMON MINUTIA POINTS
Ridge ending – a point where the ridge terminates.
Short ridge or dot – ridges with a significantly shorter length than the average ridge length on the
fingerprint.
Bifurcation – points where a single ridge splits into two ridges.
Island or eye – a point where a single ridge splits into two before converging into a single ridge again.
Spur or hook – a shorter ridge terminating soon after it branched from its originating ridge.
Bridge – a short ridge that connecting two larger ridges. It can also be seen as two bifurcating ridges
that share a common branch.
Core – a ridge that bends back on itself or forms a U-turn.

Understanding Fingerprint Biometrics v1.3a
© 2014, iPulse Systems Page 5 of 14
THE FINGERPRINT ENROLLMENT PROCESS
Now that we understand the identifying features in fingerprints, let’s take a look at what happens behind the
scenes when a biometric template is constructed.
Note: iPulse makes use of SecuGen’s optical sensor technology. For the purposes of this document, explanations
are based on the use of these particular devices.
Before we can proceed, we need a digital image of the fingerprint. When a finger is placed on the biometric
scanner’s touch plate, a visible light, commonly red, is shined on the fingerprint through a clear prism. The
reflected light from the fingerprint is picked up by the optical sensor (an optical biometric device is, essentially,
a highly-specialised digital camera) in the device and a digital image is created.
Image enhancement
Image analysis
Binary processing
Thinning
Ridge reconstruction
Minutiae extraction

Understanding Fingerprint Biometrics v1.3a
© 2014, iPulse Systems Page 6 of 14
IMAGE ENHANCEMENT
Before we can analyse the image, we need to clean it up a little: reduce noise, sharpen and enhance the
difference between ridges and valleys in the image, optimize the contrast and generally improve the image
quality as much as we can.
IMAGE ANALYSIS
Using the enhanced image, we move to analysis. In this step, we select the background region to mark smeared
or smudged regions which shouldn’t be used as part of the template. Once those have been isolated, we split
the image into blocks and determine their direction.
BINARY PROCESSING
Analysis complete, we carefully convert the image to binary. To do this, the grayscale image is converted to a
black and white image. Once in black and white, the image can be digitized into ones and zeroes, as shown in
the images below.
Figure 3 - Base image Figure 4 - Enhanced image
Figure 5 - Analysed image with
background and smudges removed,
blocked and block directions applied

Understanding Fingerprint Biometrics v1.3a
© 2014, iPulse Systems Page 7 of 14
THINNING
Digitizing complete, the image is cleaned some more. All ridges are thinned down until they are no more than a
single pixel wide. This allows much easier identification of the overall shape of the print.
RIDGE RECONSTRUCTION
Now that we’ve got the image in its most basic format, we can start a process known as Ridge Reconstruction.
During this process, we eliminate a number of interferences like spurious fusions – multiple joining points - and
air bubbles and islands – little ovals in the print lines – before we rejoin any cuts that have occurred and remove
remaining fake ends.
The image on the right shows an example of a reconstructed image:
Figure 6 - Enhanced image Figure 7 - Digitised image
Figure 8 - Digitised image Figure 9 - Thinned image
Understanding Fingerprint Biometrics v1.3a
© 2014, iPulse Systems Page 8 of 14
MINUTIAE EXTRACTION
A highly complex mathematical formula, part of what differentiates each manufacturer’s algorithm from others,
is used to classify fusions and endings, their directions and relative locations to each other. When the algorithm
has mapped all these points, it builds the final template: the minutiae string that uniquely identifies this
fingerprint. To the eye, this looks like nothing more than a long string of random numbers.
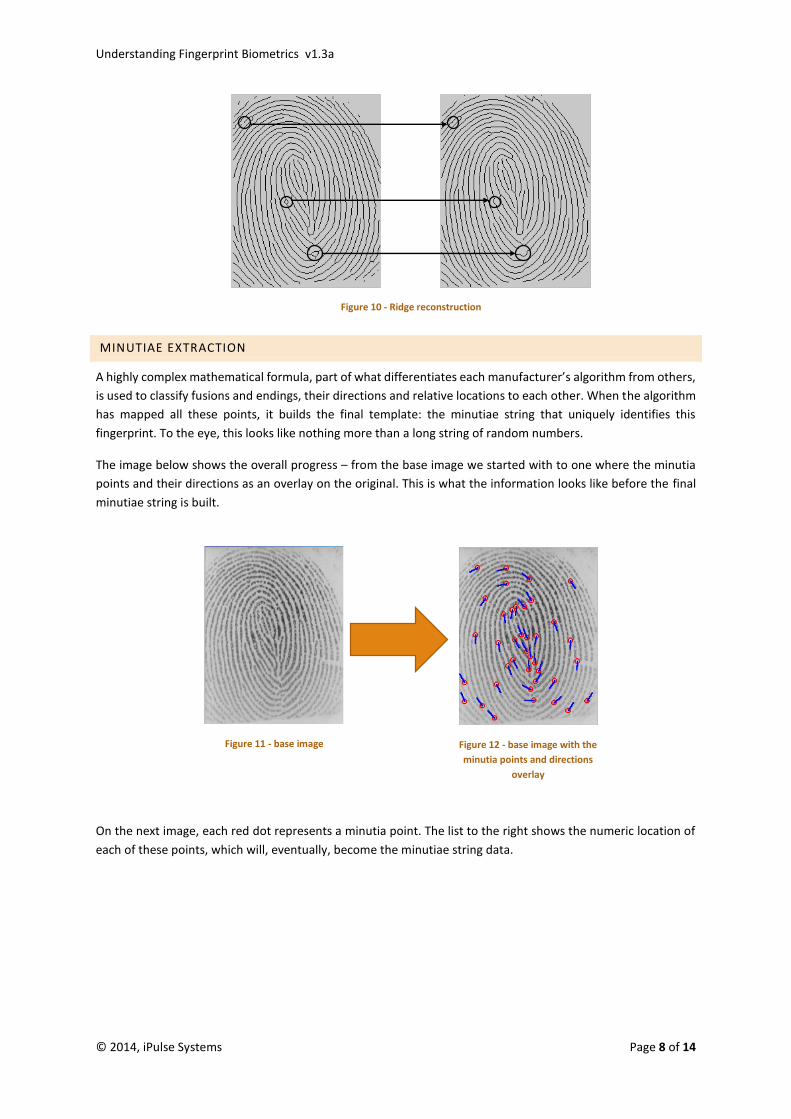
The image below shows the overall progress – from the base image we started with to one where the minutia
points and their directions as an overlay on the original. This is what the information looks like before the final
minutiae string is built.
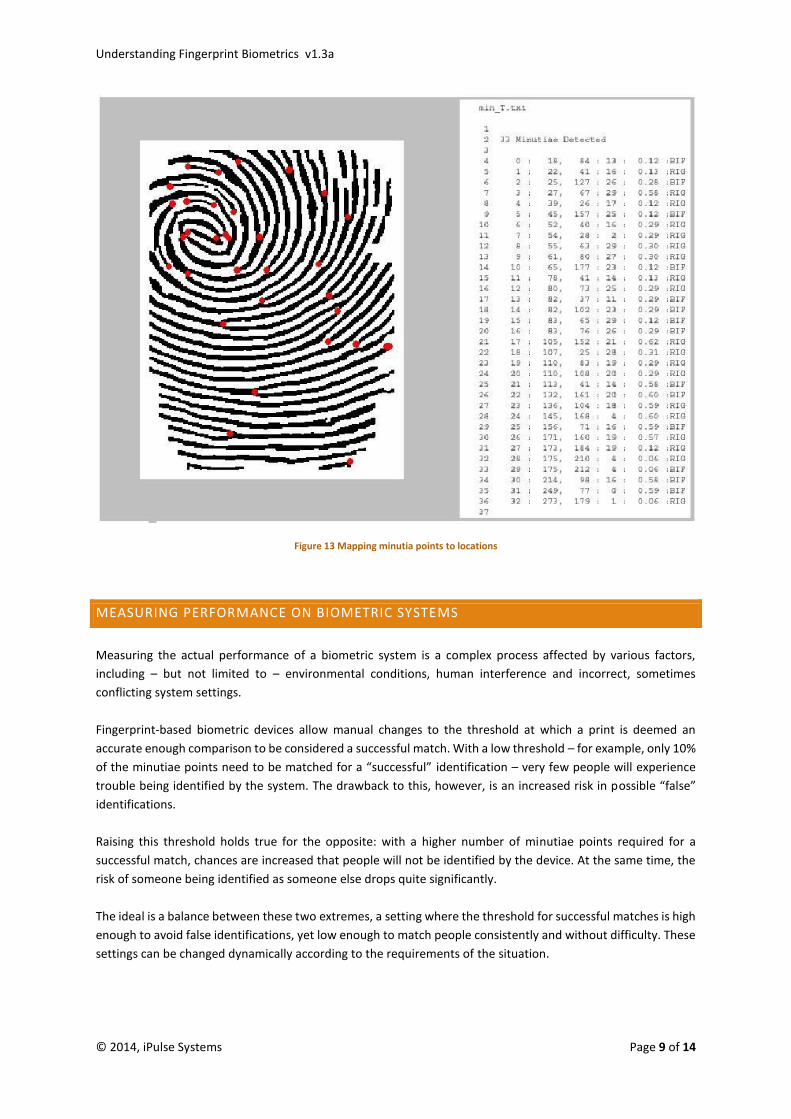
On the next image, each red dot represents a minutia point. The list to the right shows the numeric location of
each of these points, which will, eventually, become the minutiae string data.
Figure 10 - Ridge reconstruction
Figure 11 - base image Figure 12 - base image with the
minutia points and directions
overlay
Understanding Fingerprint Biometrics v1.3a
© 2014, iPulse Systems Page 9 of 14
Figure 13 Mapping minutia points to locations
MEASURING PERFORMANCE ON BIOMETRIC SYSTEMS
Measuring the actual performance of a biometric system is a complex process affected by various factors,
including – but not limited to – environmental conditions, human interference and incorrect, sometimes
conflicting system settings.
Fingerprint-based biometric devices allow manual changes to the threshold at which a print is deemed an
accurate enough comparison to be considered a successful match. With a low threshold – for example, only 10%
of the minutiae points need to be matched for a “successful” identification – very few people will experience
trouble being identified by the system. The drawback to this, however, is an increased risk in possible “false”
identifications.
Raising this threshold holds true for the opposite: with a higher number of minutiae points required for a
successful match, chances are increased that people will not be identified by the device. At the same time, the
risk of someone being identified as someone else drops quite significantly.
The ideal is a balance between these two extremes, a setting where the threshold for successful matches is high
enough to avoid false identifications, yet low enough to match people consistently and without difficulty. These
settings can be changed dynamically according to the requirements of the situation.

Understanding Fingerprint Biometrics v1.3a
© 2014, iPulse Systems Page 10 of 14
CORE METRICS
In general, three core metrics are used to determine the performance of a biometric system.
FALSE REJECTION RATE (FRR)
Also referred to as False Non-Match Rate (FNMR), this indicates the probability that the system will fail to detect
a match between the input pattern and a matching stored template. It measures the percentage of valid inputs
that are incorrectly rejected.
FALSE ACCEPTANCE RATE (FAR)
Also referred to as False Matching Rate (FMR), this indicates the probability that the system will incorrectly
match the input pattern to a stored non-matching template. It measures the percentage of invalid inputs which
are incorrectly accepted.
EQUAL ERROR RATE (EER)
Also referred to as Crossover Error Rate (CER), this indicates the rate at which both false acceptances (FAR) and
false rejections (FRR) errors are equal; i.e. for each false acceptance there will be one false rejection. The EER is
a quick way to compare different biometric systems – the system with the lowest EER score is the most accurate.
HOW TO DEAL WITH FALSE ACCEPTANCES
What to do when your biometric system identifies people incorrectly.
WHAT’S GOING ON?
First off, don’t panic – all this means is that there’s some work to be done to make sure that you’ve captured
clear, high-quality fingerprints for the people experiencing the problem.
Typically, you’ll find that the person being identified as someone else is, in an estimated 95% of investigated
cases, always incorrectly identified as the same person. John Smith is always identified as Jane Smith, for
example, and it’s highly likely that Jane will be identified as John at some point.
This is more likely to happen at new installations where the users aren’t familiar with the system yet. Over time,
the effectiveness of your system will increase as users become more practiced in finger placement and general
use.
SO WHY DOES THAT HAPPEN?
This is usually a combination of some level of similarity between the prints, poor fingerprint images captured
during enrolment and a lack of familiarity with the system.
Ensuring that a proper fingerprint was captured during enrolment is one of the most important tasks you can
perform and, going forwards, will be the determining factor in how well your system performs.
This initial print is the baseline against which all future comparisons will be done. If this first print is of poor
quality it doesn’t matter if the person’s prints are near perfect when the person uses a reader: if you’re
comparing against a bad image, your results won’t be up to par.

Understanding Fingerprint Biometrics v1.3a
© 2014, iPulse Systems Page 11 of 14
HOW DO I FIX IT?
There are three primary actions we’ll look at to resolve this: The first is a reader configuration item to increase
the number of matching points required before a print is successfully identified, the second is the re-enrolment
of anyone who experiences difficulty using the system and finally, training.
Before proceeding, make notes of the people who have been identified as someone else and also note who
they’ve been identified as. We’ll need this information soon.
We’ll start with increasing the reader’s Security Level setting for Identification.
INCREASE THE IDENTIFICATION SECURITY LEVEL
Readers have nine levels of security – three settings in three categories each:
– Low: low, lower, lowest
– Normal: below normal, normal, above normal
– High: high, higher, highest
Each level has a different requirement in terms of the minimum number of matching minutiae points it needs
to find during a print comparison in order to consider it a successful match.
It is generally recommended that sites use below normal or higher settings for verification (1:1 matching)
purposes and above normal or high settings for identification (1:N matching) purposes.
Higher tiers require more matching minutiae points before a print is considered a match, whereas lower tiers
require fewer. When deciding which levels to use it is important to consider the impact:
– Higher levels are more prone to denying access when fingers are placed incorrectly (or due to other
personal and environmental factors that affect print quality)
– Higher levels are significantly less susceptible to false identifications.
– Lower levels are more susceptible to false acceptances.
– Lower levels are more forgiving of poor prints when fingers are placed incorrectly (or due to other
personal and environmental factors that affect print quality)
So, we’ll raise the security level slightly – one or two notches is usually sufficient, unless the reader is currently
configured for low-tier accuracy.
Be aware that changing this setting will, for some people, make it more difficult to use the system and that’s
okay – it’s what we want.
RE-ENROLL PEOPLE WHO EXPERIENCE DIFFICULTY USING THE SYSTEM
The raised security level will highlight people whose enrolment quality isn’t entirely up to scratch or who, for
other reasons, would have difficulty using the system. It should also cause a sharp decline in false acceptances.
Make a point of notifying your users where and to whom they should report if they have problems being
identified on the readers – anyone with low-quality prints will experience trouble and they should be re-enrolled.
Using the list of people who experienced false acceptances, start by re-enrolling both parties. Take special care
to have the print quality as high as possible – it’s a more important metric than image quality. With the prints
updated, have these two people clock on a reader several times and observe the results. Has there been an
improvement? Are they being identified correctly?

Understanding Fingerprint Biometrics v1.3a
© 2014, iPulse Systems Page 12 of 14
TRAINING
When enrolling people and especially later, when testing, keep an eye on how people place their fingers on the
readers. Spend some time training each person who has reported experiencing difficulty using the system,
making sure that they aren’t sliding their fingers over the sensor or placing it too high, too low, to the sides or
at an angle.
Ensure that users place their fingers flat on the sensor’s surface. If you look at your own prints, you’ll see that
the majority of detail is roughly in the center of the underside of your fingertip. The part with the most detail
should be as close to the center of the fingerprint sensor as possible.
If you’re having trouble with this, practice using a USB enrolment device connected to the software so you can
see what the sensor sees – where is the most detail? How does it feel when my finger is placed at the best
possible position? Now try replicate that feeling on the reader.
Environmental factors such as temperature can also have an effect and users should be made aware of this. If a
user’s fingers are cold and they’re having trouble using the device, have them warm their fingers a bit. In some
cases, just breathing on them (as though cleaning your sunglasses) is enough to get a positive match.
I DID THAT AND IT STILL DOESN’T WORK
If you’ve gone through the process of raising the security level, re-enrolling people and testing the changes and
you’re still experiencing problems, please contact your installation partner or have them escalate the matter to
iPulse so that we can arrange an expert to investigate the problem, provide training if required and help you get
everything running smoothly.
CERTIFICATION AUTHORITIES
The first two metrics (FRR and FAR) are usually published by the International Biometrics Group (IBG), a for-
profit biometric industry organisation that performs these tests. There are, however, several deficiencies and
shortcomings in the IBG tests, the most crucial of which is that all tests are performed in laboratory conditions
with a relatively small sample database.
The American National Institute of Standards and Technologies (NIST) is the only internationally well-
respected, neutral third party that performs independent tests on fingerprint capture devices. This organisation
uses a standard database of images and standardised procedures on fingerprint-based biometric devices to
determine the FAR, FRR and EER rates, bestowing a Minutiae Interoperability Exchange or MINEX certification
based on performance.
THE MINEX CERTIFICATION
The MINEX certification exists to
Provide measurements of performance and interoperability of core template encoding and matching capabilities to users, vendors and interested parties.
Establish compliance for template encoders and matchers for the United States Government's Personal Identity Verification (PIV) program.
The Secugen sensors and algorithms used in all iPulse biometric devices are rated as follows:

Understanding Fingerprint Biometrics v1.3a
© 2014, iPulse Systems Page 13 of 14
IBG: FAR 0%, FRR 0% NIST: EER of 0.0042 and certified MINEX compliant
COMPARING FRR / FAR RATINGS ON FINGERPRINT, FACIAL AND VOICE BIOMETRICS
There are always questions relating to the different biometrics available - fingerprints, facial, voice etc. – and
how they compare. Different studies have been conducted with a focus on the FRR and FAR rates. The table
below indicates the outcomes of some of these studies.
1:1 MATCHING VS 1:N MATCHING
The manner in which a match is obtained can make a large difference to the perceived performance of a
biometric system.
1:N (ONE-TO-MANY) MATCHING
One-to-Many matching is another name for the process of identifying an unknown person from a provided
biometric credential like a fingerprint. Once the person has placed his/her finger on a sensor, the provided
biometric sample is matched against each stored biometric template on the device / in the database.
If no such template matches the sample, no data is returned. If a matching template was found, the identity
linked to it will be returned.
BENEFITS
Simple to use – a biometric sample is all that is required.
DRAWBACKS
Can be slow – depends on number of templates to match against and the efficiency of the algorithm
used.
Higher chance of false rejections and false acceptances
Only a single factor on which authentication will be based.
Understanding Fingerprint Biometrics v1.3a
© 2014, iPulse Systems Page 14 of 14
1:1 (ONE-TO-ONE) MATCHING
One-to-One matching is another way of referring to the process of verifying that the provided biometric sample
matches a single, specified identity. Because we know which identity we’re looking for, we don’t need to match
against every stored biometric – we take the provided sample and compare it directly to the biometrics linked
to the specified identity. The result will be the acceptance or refusal of the identity claim.
The term ‘verification’ was defined in a previous draft of the Harmonized Biometric Vocabulary document as a
‘one-to-one process of comparing a submitted biometric sample (…) against the biometric reference template
(…) of a single enrolee (…) whose identity is being claimed, to determine whether it matches the enrolee’s
template’. Contrast with identification (…)”.
BENEFITS
One-to-One matches are much faster than One-to-Many matches.
Because we know which biometric template the provided sample needs to match, we can lower the
matching threshold to allow a better chance of a match being detected.
Significantly lower chance of false acceptances and false rejections.
Multi-factor authentication offers better security with each additional factor.
DRAWBACKS
The person may forget or lose a card
The person may forget a PIN code
MULTI-FACTOR AUTHENTICATION
Multi-factor authentication (MFA) is an approach to authentication which requires the presentation of two or
more authentication factors of the following kind:
A knowledge factor: something only the user knows, like a PIN or password.
A possession factor: something the user has, like an ID card or NFC tag.
An inherence factor: something the user is, a biometric characteristic such as a fingerprint.
A one-to-one matching system based on multi-factor authentication significantly increases the security of your
system while lowering false acceptance and rejection rates. Presenting a smart card to a device capable of
reading it, for instance, immediately satisfies the possession factor and tells the system exactly which identity
we wish to confirm. By placing a finger on the biometric reader, the inherence factor is met and a 1:1 match can
be done. We now have two levels on which we can authenticate the person’s identity:
Has the person presented a recognized card?
Does the fingerprint match the identity linked to the card?
i Langenburg, Glenn (January 24, 2005). "Are one's fingerprints similar to those of his or her parents in any discernable way?". Scientific American. Retrieved 28 August 2010.