understanding historical pattern tendencies - igmarkets.com.au fileautochartist has alerted us to...
TRANSCRIPT

Understanding historical pattern tendencies
IG MarketsUnderstanding historical pattern tendencies 01
Chart patterns are one of - if not the oldest - methods of chart and price analysis traders use. In fact, the popularity of chart patterns continues to rise and that’s for one reason: they work.
As powerful an analysis tool as chart pattern analysis is, it can often be a very time consuming and subjective task. That’s really where tools like Autochartist become a valuable asset to any trader. However, one of the challenges traders face is how to utilise any tool effectively, and chart patterns are no exception. Simply identifying chart patterns is not enough - although it certainly is the first step.
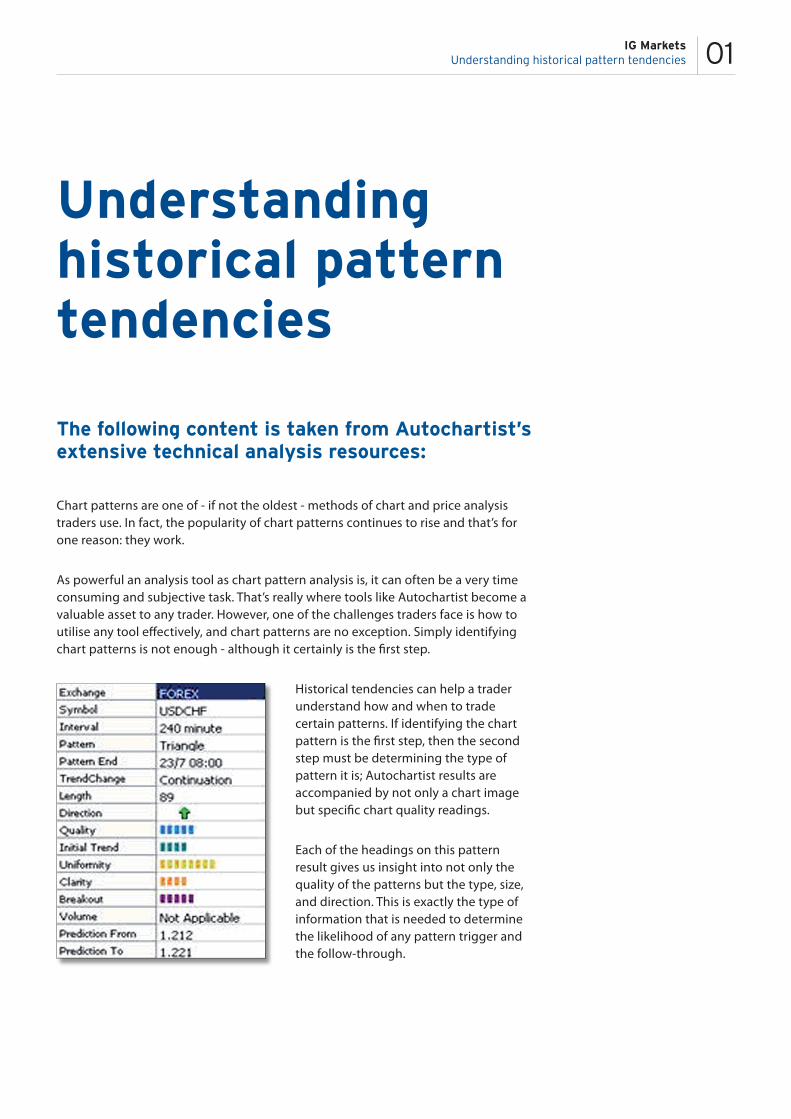
Historical tendencies can help a trader understand how and when to trade certain patterns. If identifying the chart pattern is the first step, then the second step must be determining the type of pattern it is; Autochartist results are accompanied by not only a chart image but specific chart quality readings.
Each of the headings on this pattern result gives us insight into not only the quality of the patterns but the type, size, and direction. This is exactly the type of information that is needed to determine the likelihood of any pattern trigger and the follow-through.
Understandinghistorical patterntendencies
The following content is taken from Autochartist’s extensive technical analysis resources:
IG MarketsUnderstanding historical pattern tendencies 02
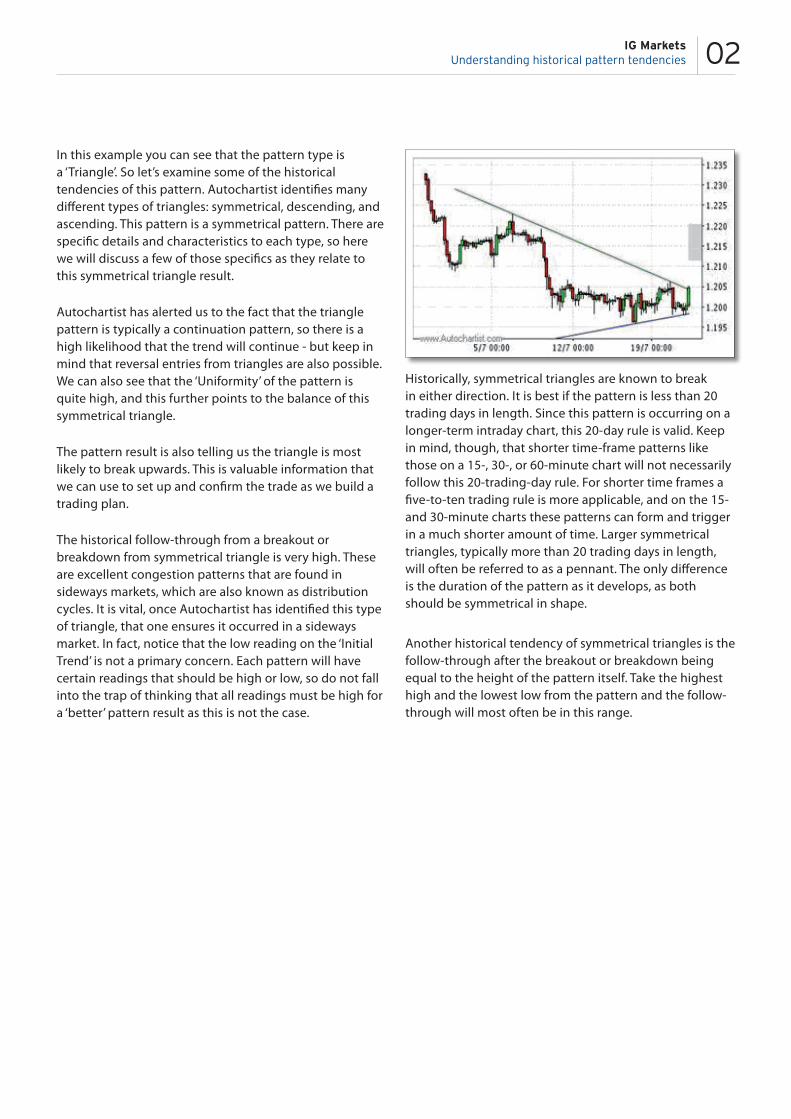
In this example you can see that the pattern type is a ‘Triangle’. So let’s examine some of the historical tendencies of this pattern. Autochartist identifies many different types of triangles: symmetrical, descending, and ascending. This pattern is a symmetrical pattern. There are specific details and characteristics to each type, so here we will discuss a few of those specifics as they relate to this symmetrical triangle result.
Autochartist has alerted us to the fact that the triangle pattern is typically a continuation pattern, so there is a high likelihood that the trend will continue - but keep in mind that reversal entries from triangles are also possible. We can also see that the ‘Uniformity’ of the pattern is quite high, and this further points to the balance of this symmetrical triangle.
The pattern result is also telling us the triangle is most likely to break upwards. This is valuable information that we can use to set up and confirm the trade as we build a trading plan.
The historical follow-through from a breakout or breakdown from symmetrical triangle is very high. These are excellent congestion patterns that are found in sideways markets, which are also known as distribution cycles. It is vital, once Autochartist has identified this type of triangle, that one ensures it occurred in a sideways market. In fact, notice that the low reading on the ‘Initial Trend’ is not a primary concern. Each pattern will have certain readings that should be high or low, so do not fall into the trap of thinking that all readings must be high for a ‘better’ pattern result as this is not the case.
Historically, symmetrical triangles are known to break in either direction. It is best if the pattern is less than 20 trading days in length. Since this pattern is occurring on a longer-term intraday chart, this 20-day rule is valid. Keep in mind, though, that shorter time-frame patterns like those on a 15-, 30-, or 60-minute chart will not necessarily follow this 20-trading-day rule. For shorter time frames a five-to-ten trading rule is more applicable, and on the 15- and 30-minute charts these patterns can form and trigger in a much shorter amount of time. Larger symmetrical triangles, typically more than 20 trading days in length, will often be referred to as a pennant. The only difference is the duration of the pattern as it develops, as both should be symmetrical in shape.
Another historical tendency of symmetrical triangles is the follow-through after the breakout or breakdown being equal to the height of the pattern itself. Take the highest high and the lowest low from the pattern and the follow-through will most often be in this range.