understanding inertial and frequency response of wind power plants
TRANSCRIPT

NREL is a national laboratory of the U.S. Department of Energy, Office of Energy Efficiency & Renewable Energy, operated by the Alliance for Sustainable Energy, LLC.
Contract No. DE-AC36-08GO28308
Understanding Inertial and Frequency Response of Wind Power Plants Preprint E. Muljadi, V. Gevorgian, and M. Singh National Renewable Energy Laboratory
S. Santoso University of Texas – Austin
To be presented at the IEEE Symposium on Power Electronics and Machines in Wind Applications Denver, Colorado July 16-18, 2012
Conference Paper NREL/CP-5500-55335 July 2012

NOTICE
The submitted manuscript has been offered by an employee of the Alliance for Sustainable Energy, LLC (Alliance), a contractor of the US Government under Contract No. DE-AC36-08GO28308. Accordingly, the US Government and Alliance retain a nonexclusive royalty-free license to publish or reproduce the published form of this contribution, or allow others to do so, for US Government purposes.
This report was prepared as an account of work sponsored by an agency of the United States government. Neither the United States government nor any agency thereof, nor any of their employees, makes any warranty, express or implied, or assumes any legal liability or responsibility for the accuracy, completeness, or usefulness of any information, apparatus, product, or process disclosed, or represents that its use would not infringe privately owned rights. Reference herein to any specific commercial product, process, or service by trade name, trademark, manufacturer, or otherwise does not necessarily constitute or imply its endorsement, recommendation, or favoring by the United States government or any agency thereof. The views and opinions of authors expressed herein do not necessarily state or reflect those of the United States government or any agency thereof.
Available electronically at http://www.osti.gov/bridge
Available for a processing fee to U.S. Department of Energy and its contractors, in paper, from:
U.S. Department of Energy Office of Scientific and Technical Information P.O. Box 62 Oak Ridge, TN 37831-0062 phone: 865.576.8401 fax: 865.576.5728 email: mailto:[email protected]
Available for sale to the public, in paper, from:
U.S. Department of Commerce National Technical Information Service 5285 Port Royal Road Springfield, VA 22161 phone: 800.553.6847 fax: 703.605.6900 email: [email protected] online ordering: http://www.ntis.gov/help/ordermethods.aspx
Cover Photos: (left to right) PIX 16416, PIX 17423, PIX 16560, PIX 17613, PIX 17436, PIX 17721
Printed on paper containing at least 50% wastepaper, including 10% post consumer waste.
1
Understanding Inertial and Frequency Response of Wind Power Plants
E. Muljadi, Fellow, IEEE, V. Gevorgian, Member, IEEE, M. Singh, Member, IEEE, and S. Santoso, Senior Member, IEEE
Abstract—The objective of this paper is to analyze and
quantify the inertia and frequency responses of wind power plants with different wind turbine technologies (particularly those of fixed speed, variable slip with rotor-resistance controls, and variable speed with vector controls). The fundamental theory, the operating range, and the modifications needed for the wind turbine to contribute to the inertial and primary frequency response during the frequency drop will be presented in this paper. We will demonstrate practical approaches to allow variable slip and speed wind turbines to contribute inertia to the host power system grid. The approaches are based on the inclusion of frequency error and the rate of change of frequency signals in the torque control loop and pitch control actions for wind speeds below and above its rated value. Detailed simulation models in the time domain will be conducted to demonstrate the efficacy of the approaches.
Index Terms—wind turbine, inertial response, governor response, frequency response
I. NOMENCLATURE WTG – wind turbine generator ROCOF – rate of change of frequency DFIG – double-fed induction generator H – inertia constant(s) AGC – automatic generation control PFR – primary frequency response
II. INTRODUCTION HE differences among turbine types are mostly based on the electrical generation parts (generator, power converter,
and control algorithm) of the turbines. The strategies used to control the prime mover are generally similar. Mechanical brakes and blade pitch control are commonly used to avoid runaway conditions and keep the stresses on the mechanical components of the wind turbine generator (WTG) within the operating range of the design tolerance. The pitch angle of the blades is usually controlled during high wind speeds to keep the aerodynamic power within limits; thus, the output power and rotor speed can be kept within boundary limits.
Many modern wind plants have the ability to control active power output in response to grid frequency in ways that are important to overall grid performance [1].
M. Singh (email: [email protected]), V. Gevorgian (email:
[email protected]), and E. Muljadi (email: [email protected]) are with the National Renewable Energy Laboratory, Golden, CO 80401 USA.
S. Santoso (e-mail: [email protected]) is with the Department of Electrical Engineering, University of Texas, Austin, TX 78712 USA.
In the first few seconds following the loss of a large power plant, the grid frequency starts to drop. These initial frequency dynamics are dominated by the inertial response of the generators that remain online. The synchronous generators release their stored kinetic energy into the grid, reducing the initial rate of change of frequency (ROCOF) and allowing slower governor actions to catch up and contribute to frequency stabilization. A performance similar to conventional generators can be achieved with a wind power plant by utilizing a controlled inertial response [2].
Increased variable wind generation will have many impacts on the primary frequency control actions of the power system. In [3], the lower system inertia was identified as one such impact because it would increase the requirements for primary frequency control reserves to arrest frequency at the same nadir following the sudden loss of generation.
The U.S. research community has begun to document frequency response implications for various independent system operators (ISOs). A recent study for California ISO [4] examined cases with high levels of wind and solar generation. It found that reduction in system inertia because of higher levels of renewable generation will not have a significant impact on frequency response when compared with governor action. However, fast transient frequency support using controlled inertial response from wind power will help increase the underfrequency load-shedding margin and avoid load shedding because of low frequencies. This study [4] demonstrated that the benefits of these responses can be several times greater per megawatt (MW) than was observed for governor response in the synchronous fleet.
An excellent state-of-the-art review of inertia by wind power was conducted in [5]. It demonstrated that many ISOs and regional transmission operators in different countries began recognizing the value of inertial response by wind power and its importance for system reliability. In particular, Red Eléctria de España (Spain), Hydro Quebec (Canada), Electric Reliability Council of Texas, and others in Ireland and Denmark are in different stages of implementing wind inertia requirements in their operations [5], [6].
The combined inertial response of a wind power plant will depend on the electrical characteristics of its individual wind turbines. Constant-speed wind turbines have different inertial response than synchronous generators; however, they do not intrinsically decrease the power system inertia because of their electromechanical characteristics. On the other hand, the rotating mass of variable-speed wind turbines is decoupled from the grid frequency and does not inherently exhibit an inertial response unless controlled for that specific purpose.
T

2
An example study of inertial response impact on the Ireland grid from both fixed and variable-speed wind turbines was conducted in [7]. Similar work that looked into inertia comparison between fixed- and variable-speed WTGs was conducted earlier in [7]. The group of authors in [9] explained the importance of the inertial response by wind power and developed different inertial control strategies.
Fig. 1 illustrates the four types of WTGs, starting with Type 1 (fixed speed–induction generator) through Type 4 (variable speed–full-conversion system). Types 1 through 3 are based on an induction generator; they require a gearbox to match the generator speed (high-speed shaft) to the turbine speed (low-speed shaft). Type 4 may be with or without a gearbox, depending on the type of the generator.
Fig. 1: Different types of WTGs
The specific topologies shown in Fig. 1 are: • Type 1: Induction generator–fixed speed • Type 2: Wound-rotor induction generator with
adjustable external rotor resistance–variable slip • Type 3: Double-fed induction generators (DFIG)–
variable speed • Type 4: Full converter system with permanent
magnet synchronous generator—variable speed, direct drive
This paper details the specific aspects of inertial response by fixed- and variable-speed wind generation, highlights dynamic simulation results, and discusses the potential impact of wind inertial response on power system operation. The results of
this work provide a better understanding of the differences in the nature of inertial response by wind power from the perspectives of wind turbine electrical topologies.
III. RESPONSES OF DIFFERENT TYPES OF WTGS TO A
FREQUENCY DECLINE
The additional power from kinetic energy that a wind turbine can release onto the grid depends on the initial wind rotor speed. The change in rotor kinetic energy because of a decline in revolutions per minute (rpm) (transition from speed
to speed ) can be calculated as: ∆ 2 ∆ ∆ [Joule] (1)
Where is wind rotor inertia [ · ], and ∆ is change in rotor speed. The power released can be estimated as: ∆ ∆∆ [watt] (2)
As follows from the above equations, the magnitude of ∆ depends on initial speed ( , drop in speed (∆ , and duration of the drop ∆ . The dependence of ∆ on the rpm drop calculated for ∆ 15 s for a typical 1.5-MW variable-speed wind turbine is shown in Fig. 2.
Fig. 2: Example dependence of ΔP on rpm decline
As shown in Fig. 2, the 1.5-MW wind turbine is capable of releasing up to 200 kilowatts (kW) from inertia during 15 seconds (s) when the wind rotors slow down by 5 rpm from the initial speed. With appropriate controls, this turbine inertia can be “connected” directly to the grid. This short-term capability of injecting additional power into the grid makes it possible for wind power plants to participate in providing inertial response until the primary frequency control reserve of the power system is activated. For this purpose, the interactions of wind turbines in wind power plants and the frequency-control coordination among them needs to be studied and modeled.
It is important to note that the inertial response of the conventional generators is dependent on their physical mass, and the physics of the synchronous machine, and cannot be

3
changed. In the case of wind turbines, the inertial response can be tuned to improve power system performance during the initial decline of the frequency after loss of generation.
The main limiting factors for inertial response from wind turbines are the extra heat due to additional power generation and stress on mechanical components. The duration of inertial response is not long enough to generate thermal losses high enough to become a risk factor in the generator winding. The power electronic converters of WTGs usually have around 10% headroom because of their MVA ratings. Detailed studies are needed on the impacts of the mechanical components of each wind turbine type to ensure the overall lowest impact on component life.
A. Type 1 and Type 2 WTGs
Type 1 and Type 2 WTGs are directly connected to the grid. They are capable of contributing to the release of kinetic energy stored in their rotating parts (blades, gearbox, generator, etc.). Consider the graph shown in Fig. 3. The wind turbine is rated at 1.5 MW, the wind speed is at its rated level (10.8 m/s), and the wind turbine is operating at its rated operating point A, the crossing point between the aerodynamic power (Paero) and the generator output (Pgen).
Fig. 3: Illustration of kinetic energy transfer
during a frequency decline for Type 1 and Type 2 WTGs
For Type 1 WTGs, when there is a sudden drop in the frequency by 1%, the rotor speed does not change instantaneously because of the inertia of the turbines. However, the generator power-speed characteristic moves to the left; thus, the operating point moves from Point A to Point B instantaneously. As a result, there is a difference between the aerodynamic power and the generated power (Paero < Pgen). The rotational speed decreases until there is a new balanced operating condition at Point C (Paero = Pgen). The time it takes to move from B to C depends on the size of the inertia of the generator and the blades and the difference between Pgen and Paero. In the process of traveling from Point B to Point C, the kinetic energy within the turbine is transferred to the grid to help arrest the frequency decline. The size of the kinetic
energy transfer can be approximated from the inertia and the rotor speeds (H, rpmA, and rpmC). There is a negligible difference in aerodynamic power caused by the frequency drop.
For Type 2 WTGs, when there is a sudden drop in the frequency by 1%, the generator power-speed characteristic moves to the left. However, the output generation Pgen is kept at its rated value because the external rotor resistance will control the output power at rated; thus, the operating point will move from Point A to Point C instead of to Point B. If the operating frequency returns to normal, the operating point will move back to Point A.
1) Simulating a frequency decline
To simulate a frequency drop, an example of a simplified power system network is presented in Fig. 4. Different generation mixes and system inertias were used during simulations. The system consists of a synchronous generator, wind power plant, and various loads. To simulate a frequency decline, a generator is switched off, creating a sudden drop in frequency, before the governor control of the synchronous generator stabilizes the frequency at a steady-state value. Then the frequency is driven back to its normal value by the automatic generation control (AGC).
Fig. 4: Simplified governor-based model of a power system
The simplified governor-based models of a generator shown in Fig. 4 were based on speed-governing systems represented in [9] and were developed using Matlab/Simulink. The wind rotor power curves are modeled using Cp curves and scaled H constants given in [9]. A single wind turbine representation was used for the wind power plant model. 2) Operation with large inertia grid In this illustration, a large Type 1 WTG of 2 MW is used. If the inertia available in the grid is large, the drop in frequency is not large when a large load is applied to the power system. For example, as shown in Fig. 5, the nadir drops down to 59.82 hertz (Hz). As the frequency drops, the output power of the WTG increases from 1.94 MW to 1.98 MW. The inertial energy released is delivered at a peak power value of 400 kW
A
B
C+
RPMARPMC
A
B
C+
RPMARPMC
4
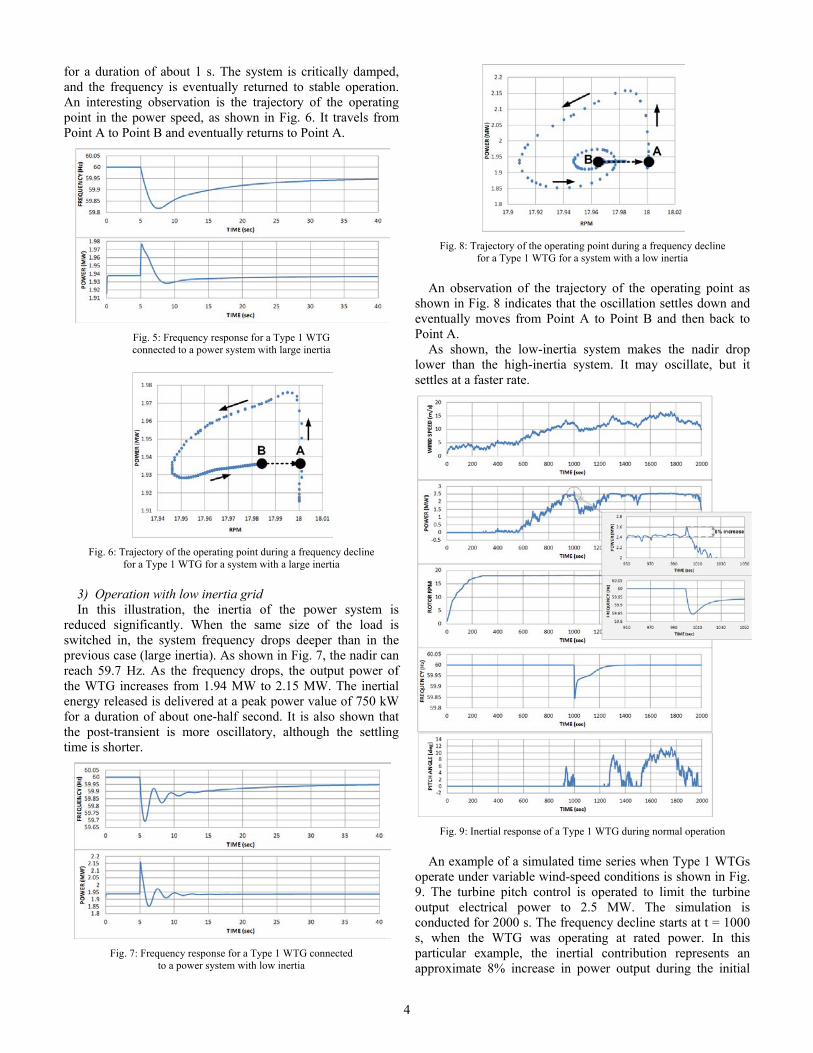
for a duration of about 1 s. The system is critically damped, and the frequency is eventually returned to stable operation. An interesting observation is the trajectory of the operating point in the power speed, as shown in Fig. 6. It travels from Point A to Point B and eventually returns to Point A.
Fig. 5: Frequency response for a Type 1 WTG connected to a power system with large inertia
Fig. 6: Trajectory of the operating point during a frequency decline
for a Type 1 WTG for a system with a large inertia
3) Operation with low inertia grid In this illustration, the inertia of the power system is
reduced significantly. When the same size of the load is switched in, the system frequency drops deeper than in the previous case (large inertia). As shown in Fig. 7, the nadir can reach 59.7 Hz. As the frequency drops, the output power of the WTG increases from 1.94 MW to 2.15 MW. The inertial energy released is delivered at a peak power value of 750 kW for a duration of about one-half second. It is also shown that the post-transient is more oscillatory, although the settling time is shorter.
Fig. 7: Frequency response for a Type 1 WTG connected
to a power system with low inertia
Fig. 8: Trajectory of the operating point during a frequency decline
for a Type 1 WTG for a system with a low inertia
An observation of the trajectory of the operating point as shown in Fig. 8 indicates that the oscillation settles down and eventually moves from Point A to Point B and then back to Point A.
As shown, the low-inertia system makes the nadir drop lower than the high-inertia system. It may oscillate, but it settles at a faster rate.
Fig. 9: Inertial response of a Type 1 WTG during normal operation
An example of a simulated time series when Type 1 WTGs operate under variable wind-speed conditions is shown in Fig. 9. The turbine pitch control is operated to limit the turbine output electrical power to 2.5 MW. The simulation is conducted for 2000 s. The frequency decline starts at t = 1000 s, when the WTG was operating at rated power. In this particular example, the inertial contribution represents an approximate 8% increase in power output during the initial
5
stages of grid frequency decline. This number will vary depending on the initial ROCOF after large generator drops in a power system, as shown in Fig. 4.
According to [9], commercial fixed-speed wind turbines rated more than 1 MW have values of H = 3–5 s. Some fixed-speed WTGs have dual-speed operations that can be achieved with two winding induction generators. The value of H in this case must be calculated based on the MVA ratings of each winding.
B. Type 3 and Type 4 WTGs The Type 3 and Type 4 WTGs are variable-speed WTGs.
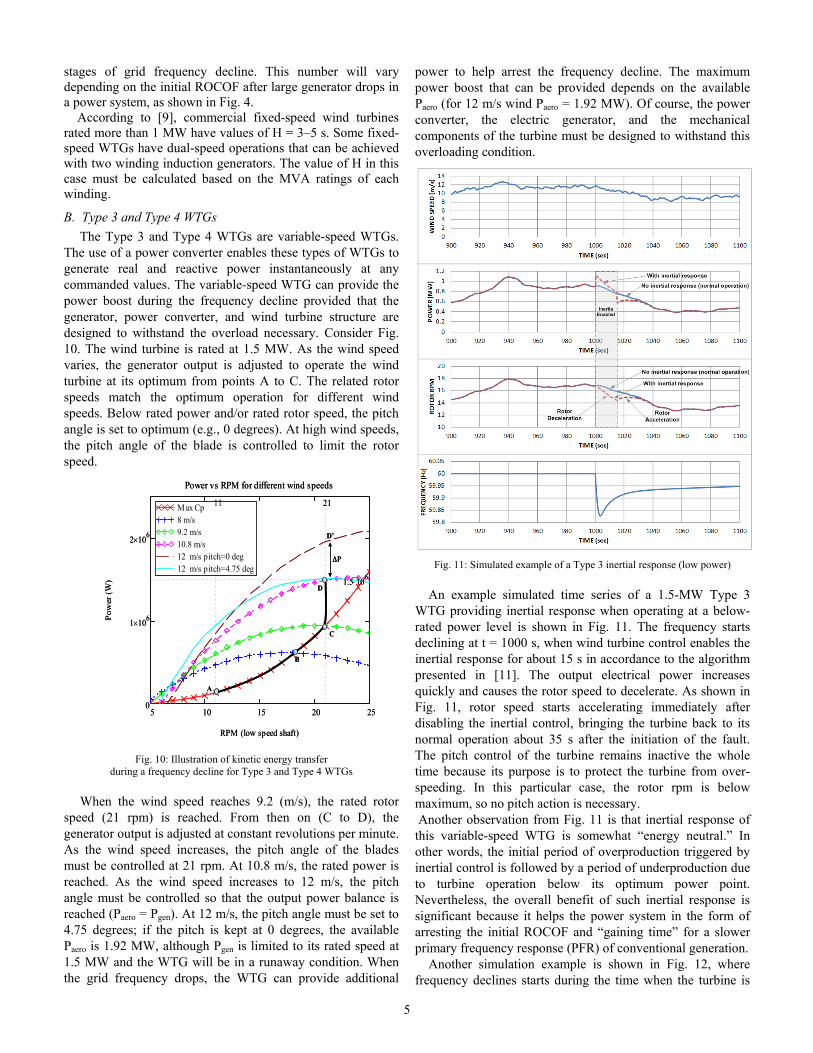
The use of a power converter enables these types of WTGs to generate real and reactive power instantaneously at any commanded values. The variable-speed WTG can provide the power boost during the frequency decline provided that the generator, power converter, and wind turbine structure are designed to withstand the overload necessary. Consider Fig. 10. The wind turbine is rated at 1.5 MW. As the wind speed varies, the generator output is adjusted to operate the wind turbine at its optimum from points A to C. The related rotor speeds match the optimum operation for different wind speeds. Below rated power and/or rated rotor speed, the pitch angle is set to optimum (e.g., 0 degrees). At high wind speeds, the pitch angle of the blade is controlled to limit the rotor speed.
Fig. 10: Illustration of kinetic energy transfer
during a frequency decline for Type 3 and Type 4 WTGs
When the wind speed reaches 9.2 (m/s), the rated rotor speed (21 rpm) is reached. From then on (C to D), the generator output is adjusted at constant revolutions per minute. As the wind speed increases, the pitch angle of the blades must be controlled at 21 rpm. At 10.8 m/s, the rated power is reached. As the wind speed increases to 12 m/s, the pitch angle must be controlled so that the output power balance is reached (Paero = Pgen). At 12 m/s, the pitch angle must be set to 4.75 degrees; if the pitch is kept at 0 degrees, the available Paero is 1.92 MW, although Pgen is limited to its rated speed at 1.5 MW and the WTG will be in a runaway condition. When the grid frequency drops, the WTG can provide additional
power to help arrest the frequency decline. The maximum power boost that can be provided depends on the available Paero (for 12 m/s wind Paero = 1.92 MW). Of course, the power converter, the electric generator, and the mechanical components of the turbine must be designed to withstand this overloading condition.
Fig. 11: Simulated example of a Type 3 inertial response (low power)
An example simulated time series of a 1.5-MW Type 3 WTG providing inertial response when operating at a below-rated power level is shown in Fig. 11. The frequency starts declining at t = 1000 s, when wind turbine control enables the inertial response for about 15 s in accordance to the algorithm presented in [11]. The output electrical power increases quickly and causes the rotor speed to decelerate. As shown in Fig. 11, rotor speed starts accelerating immediately after disabling the inertial control, bringing the turbine back to its normal operation about 35 s after the initiation of the fault. The pitch control of the turbine remains inactive the whole time because its purpose is to protect the turbine from over-speeding. In this particular case, the rotor rpm is below maximum, so no pitch action is necessary. Another observation from Fig. 11 is that inertial response of this variable-speed WTG is somewhat “energy neutral.” In other words, the initial period of overproduction triggered by inertial control is followed by a period of underproduction due to turbine operation below its optimum power point. Nevertheless, the overall benefit of such inertial response is significant because it helps the power system in the form of arresting the initial ROCOF and “gaining time” for a slower primary frequency response (PFR) of conventional generation.
Another simulation example is shown in Fig. 12, where frequency declines starts during the time when the turbine is
5 10 15 20 250
1 106×
2 106×
Max Cp8 m/s9.2 m/s10.8 m/s12 m/s pitch=0 deg12 m/s pitch=4.75 deg
Power vs RPM for different wind speeds
RPM (low speed shaft)
Pow
er (W
) 1.5 106⋅
11 21
A
B
C
D
D’
∆P
5 10 15 20 250
1 106×
2 106×
Max Cp8 m/s9.2 m/s10.8 m/s12 m/s pitch=0 deg12 m/s pitch=4.75 deg
Power vs RPM for different wind speeds
RPM (low speed shaft)
Pow
er (W
) 1.5 106⋅
11 21
A
B
C
D
D’
∆P

6
operating at rated power. In this case, the inertial control is enabled at t = 1600 s, followed by similar dynamics as in the previous case. However, the return to normal operation at the pre-disturbance level is faster than in the previous case because of more favorable conditions (i.e., the wind speed is above rated, so there is power available from wind to provide incremental electric power). The pitch control would have been active in normal operation, as shown in Fig. 12. However, during the time when inertial control is enabled, the pitch control disables itself because of turbine deceleration to lower rotational speeds.
Unlike conventional synchronous generators, the controlled inertial response from variable-speed WTGs is dependent on the initial pre-disturbance conditions. The changing wind conditions and initial revolutions per minute are going to have a significant impact on controlled inertial response.
Fig. 12: Simulated example of a Type 3 inertial response (rated power)
The majority of grid-connected WTGs in power systems throughout the world are variable-speed, so enabling controls to provide an emulated inertial response in case of frequency disturbances can become an essential service to the grid, helping improve minimum frequencies. Such controls are commercially available from some wind turbine manufacturers. Ultimately, grid codes may be modified to include forms of inertial response from wind turbines depending on given utility needs.
IV. COMBINING INERTIAL AND PRIMARY FREQUENCY RESPONSE
In the above examples, the variable-speed WTG was operated at the maximum power when the fault occurred. If the wind plant is also providing a governor response to low-frequency events, then the initial operation would be below the maximum power (curtailed operation) to provide primary reserves. In this case, there is more headroom for additional power increase when both inertial and governor controls are combined. The long-term curtailed operation of wind power has economic impacts on energy production; however, if market structures are developed, wind power can be incentivized to provide such primary reserves.
The dynamic impact of wind power in the frequency control of a power system requires a detailed modeling study of an entire interconnection for different wind penetration and contingency scenarios. In this paper, we use a simplified approach to analyze the grid frequency fluctuations for a system with high levels of wind power penetration similar to one shown in Fig. 4. Type 3 wind turbines (DFIG wind turbines) are used in this model with both inertial and droop controls. The frequency response of such power systems will depend on many factors, including types and characteristics of conventional generation, their droop settings, the level of wind power penetration, etc. All conventional generation was set to operate with 5% droop and 0.036 Hz dead band. The wind turbines were set to operate with 5% spinning reserve. (The active power set point is 5% below available wind power at any given wind speed.) A simulated wind-speed time series and 1% random load variability was fed to the model. A simple AGC function was implemented in the model to drive the system frequency to nominal value.
Fig. 13: Frequency response to generator loss with wind power
different control functions (5% wind penetration)
Fig. 14: Frequency response to generator loss with wind power
different control functions (20% wind penetration)
7
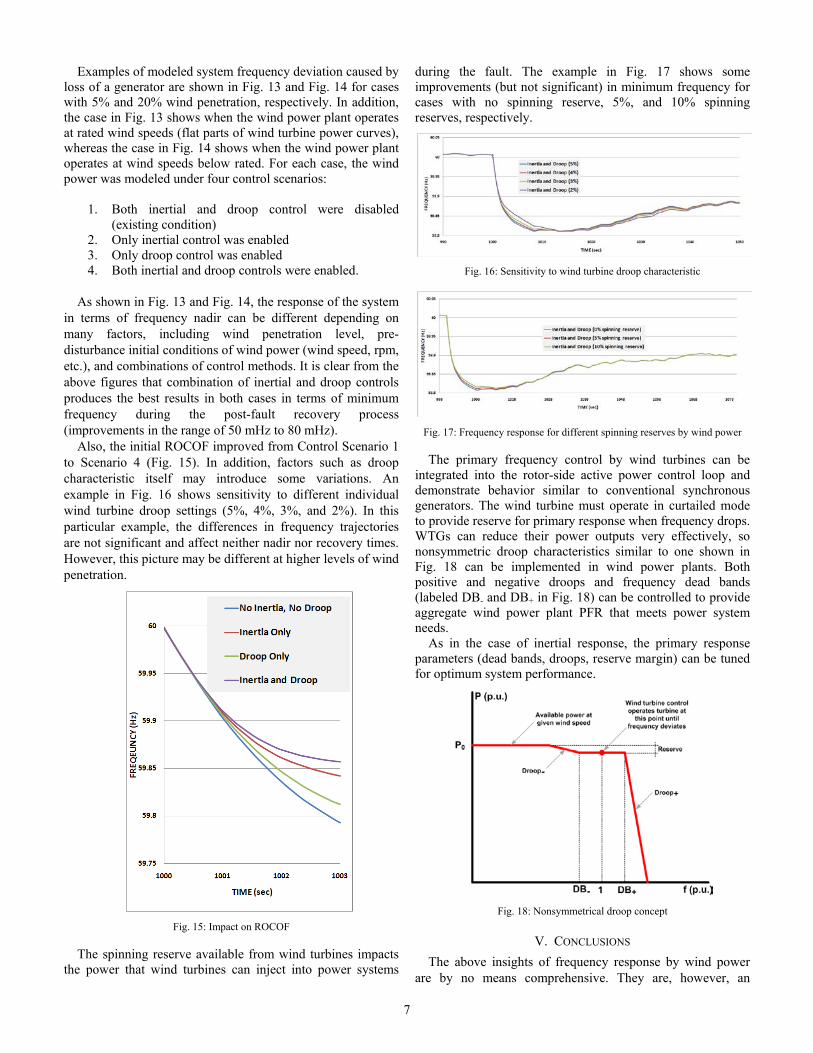
Examples of modeled system frequency deviation caused by loss of a generator are shown in Fig. 13 and Fig. 14 for cases with 5% and 20% wind penetration, respectively. In addition, the case in Fig. 13 shows when the wind power plant operates at rated wind speeds (flat parts of wind turbine power curves), whereas the case in Fig. 14 shows when the wind power plant operates at wind speeds below rated. For each case, the wind power was modeled under four control scenarios:
1. Both inertial and droop control were disabled (existing condition)
2. Only inertial control was enabled 3. Only droop control was enabled 4. Both inertial and droop controls were enabled.
As shown in Fig. 13 and Fig. 14, the response of the system
in terms of frequency nadir can be different depending on many factors, including wind penetration level, pre-disturbance initial conditions of wind power (wind speed, rpm, etc.), and combinations of control methods. It is clear from the above figures that combination of inertial and droop controls produces the best results in both cases in terms of minimum frequency during the post-fault recovery process (improvements in the range of 50 mHz to 80 mHz).
Also, the initial ROCOF improved from Control Scenario 1 to Scenario 4 (Fig. 15). In addition, factors such as droop characteristic itself may introduce some variations. An example in Fig. 16 shows sensitivity to different individual wind turbine droop settings (5%, 4%, 3%, and 2%). In this particular example, the differences in frequency trajectories are not significant and affect neither nadir nor recovery times. However, this picture may be different at higher levels of wind penetration.
Fig. 15: Impact on ROCOF
The spinning reserve available from wind turbines impacts the power that wind turbines can inject into power systems
during the fault. The example in Fig. 17 shows some improvements (but not significant) in minimum frequency for cases with no spinning reserve, 5%, and 10% spinning reserves, respectively.
Fig. 16: Sensitivity to wind turbine droop characteristic
Fig. 17: Frequency response for different spinning reserves by wind power
The primary frequency control by wind turbines can be integrated into the rotor-side active power control loop and demonstrate behavior similar to conventional synchronous generators. The wind turbine must operate in curtailed mode to provide reserve for primary response when frequency drops. WTGs can reduce their power outputs very effectively, so nonsymmetric droop characteristics similar to one shown in Fig. 18 can be implemented in wind power plants. Both positive and negative droops and frequency dead bands (labeled DB- and DB+ in Fig. 18) can be controlled to provide aggregate wind power plant PFR that meets power system needs.
As in the case of inertial response, the primary response parameters (dead bands, droops, reserve margin) can be tuned for optimum system performance.
Fig. 18: Nonsymmetrical droop concept
V. CONCLUSIONS The above insights of frequency response by wind power
are by no means comprehensive. They are, however, an

8
attempt to provide additional contributions to ongoing industry-wide discussions of the topic. Differences in inertial response between fixed- and variable-speed wind turbines have been discussed. The inertial response from fixed-speed wind turbines is a physical characteristic that cannot be controlled. Special controls must be implemented for variable-speed WTGs to provide inertial response.
Many factors and constraints (both technical and economic) affect the operation of a power system with high levels of wind generation. The depth of frequency excursions followed by generation loss can be improved by inertial and/or governor-like controls of variable-speed WTGs.
In many restructured power systems throughout the world, ancillary service markets have been developed to incentivize technologies to provide the services ancillary to energy provision to support power system reliability. However, few ancillary service markets include a market that explicitly incentivizes the provision of PFR. Wind power may be an economic choice for providing inertial and PFR services in the presence of such markets. Inertial and PFR responses by wind power are controls that can be tuned to provide optimum performance and maximum reliability to the power system and can become a source of additional control flexibility for power system operators.
VI. ACKNOWLEDGMENT This work was supported by the U.S. Department of Energy under Contract No. DE-AC36-08-GO28308 with the National Renewable Energy Laboratory.
VII. REFERENCES [1] N. Miller, K. Clark, M. Cardinal, and R. Delmerico, “Grid-friendly wind
plant controls: GE WindCONTROL—Functionality and field tests,” presented at European Wind Energy Conf., Brussels, Belgium, 2008.
[2] N. W. Miller, K. Clark, and M. Shao, “Impact of frequency responsive wind plant controls on grid performance,” presented at 9th International Workshop on Large-Scale Integration of Wind Power, Quebec, Canada, Oct. 18–19, 2010.
[3] J. Eto et al., “Use of frequency response metrics to access the planning and operating requirements for reliable integration of variable renewable generation,” Ernest Orlando Lawrence Berkley National report, LBNL-4142E, Dec. 2010.
[4] N. Miller, M. Shao, and S. Venataraman, “California ISO: Frequency response study,” Final draft, Nov 9, 2011. Available at http://www.uwig.org/Report-FrequencyResponseStudy.pdf
[5] P. W. Christensen and G. T. Tarnowski,“Inertia of wind power plants—State-of-the-art review, year 2011,” presented at 10th International Workshop on Large-Scale of Wind Power, Aarhus, Denmark, Oct 25–26, 2011.
[6] S. Sharma, S. H. Huang, and N.D.R. Sarma, “System inertial frequency response estimation and impact of renewable resources in ERCOT interconnection,” in IEEE Power and Energy Society General Meeting Proc., July 24–29, 2011, pp. 1–6.
[7] L. Ruttlege and D. Flynn, “System-wide inertial response from fixed-speed and variable-speed wind turbines,” in IEEE Power and Energy Society General Meeting Proc., July 24–29, 2011, pp. 1–7.
[8] L. Holdsworth, J. B. Ekanayake, and N. Jenkins, “Power system frequency response from fixed-speed and doubly fed induction-generator-based wind turbines,” Wind Energy, 7(1):21–35, 2004.
[9] J. Morren, J. Pierik, and S.W.H. de Haan, Inertial response of variable speed wind turbines. Electric Power Systems Research, vol. 76, no. 11, pp. 980–987, 2006.
[10] P. Kundur, Power System Stability and Control. New York: McGraw-Hill Professional, 1994.
[11] K. Clark, N. Miller, and J. J. Sanches-Gasca, “Modeling of GE wind turbine generators for grid studies, Version 4.2,” June 24, 2008.
VIII. BIOGRAPHIES
Eduard Muljadi (M’82, SM’94, F’10) received his Ph.D. in electrical engineering from the University of Wisconsin at Madison. From 1988 to 1992, he taught at California State University at Fresno. In June 1992, he joined the National Renewable Energy Laboratory in Golden, Colorado. His research interests are in the fields of electric machines, power electronics, and power systems, with an emphasis on
renewable energy applications. He is a member of Eta Kappa Nu and Sigma X, and a fellow of the Institute of Electrical and Electronics Engineers (IEEE). He is involved in the activities of the IEEE Industry Application Society (IAS), Power Electronics Society, and Power and Energy Society (PES), and an editor of the IEEE Transactions on Energy Conversion.
Dr. Muljadi is a member of various committees of the IAS, as well as a member of the Working Group on Renewable Technologies and the Task Force on Dynamic Performance of Wind Power Generation, both of the PES. He holds two patents in power conversion for renewable energy.
Vahan Gevorgian (M’97) graduated from the Yerevan Polytechnic Institute in Armenia in 1986. During his studies, he concentrated on electrical machines. His thesis research dealt with doubly fed induction generators for standalone power systems. He obtained his Ph.D. in electrical engineering from the State Engineering University of Armenia in 1993. His dissertation was devoted to a modeling of electrical transients in large WTGs.
Dr. Gevorgian is a research engineer at the National Wind Technology Center of the National Renewable Energy Laboratory in Golden, Colorado. His research interests include modeling and testing of various applications of wind generation in power systems.
Mohit Singh (M’11) received his M.S. and Ph.D. in electrical engineering from the University of Texas at Austin in 2007 and 2011, respectively. His research thesis focused on dynamic modeling of WTGs.
Dr. Singh is a postdoctoral research engineer at the National Renewable Energy Laboratory in Golden, Colorado. His research interests include modeling and testing of various applications of WTGs and other
renewable energy resources. He is member of IEEE and is involved in the activities of the IEEE PES.
Surya Santoso (M’96, SM’02) received his M.S.E. and Ph.D. degrees in electrical and computer engineering from the University of Texas at Austin in 1994 and 1996, respectively. From 1997 to 2003 he was a consulting engineer with Electrotek Concepts in Knoxville, Tennessee. Dr. Santoso is an associate professor in the Department of Electrical and Computer Engineering at the same university. His research interests include power quality, power systems, and
wind power.