understanding investors in the unlisted, unrated debenture...
TRANSCRIPT

REPORT 126
Understanding investors in the unlisted, unrated debenture (UUD) market
April 2008
About this report
This report summarises the findings of research conducted for ASIC about Australian investors in unlisted unrated debentures, including who invests and what motivates or influences them when they are considering investing.

REPORT 126: Understanding investors in the unlisted unrated debenture (UUD) market
© Australian Securities and Investments Commission April 2008 Page 2
About ASIC regulatory documents
In administering legislation ASIC issues the following types of regulatory documents.
Consultation papers: seek feedback from stakeholders on matters ASIC is considering, such as proposed relief or proposed regulatory guidance.
Regulatory guides: give guidance to regulated entities by: explaining when and how ASIC will exercise specific powers under
legislation (primarily the Corporations Act) explaining how ASIC interprets the law describing the principles underlying ASIC’s approach giving practical guidance (e.g. describing the steps of a process such
as applying for a licence or giving practical examples of how regulated entities may decide to meet their obligations).
Information sheets: provide concise guidance on a specific process or compliance issue or an overview of detailed guidance.
Reports: describe ASIC compliance or relief activity or the results of a research project.
Acknowledgements
ASIC would like to thank the investors who gave up their time to participate in this research and tell us about their investment experiences and opinions. The information they provided was very valuable and will help ASIC help investors now and into the future.
REPORT 126: Understanding investors in the unlisted unrated debenture (UUD) market
© Australian Securities and Investments Commission April 2008 Page 3
Contents Executive summary.......................................................................................4
About this research..................................................................................4 What is an unlisted, unrated debenture?.................................................4 Types of investors....................................................................................5 Investment factors ...................................................................................6
A About this research .............................................................................10 Research sample...................................................................................10 Research limitations ..............................................................................10 Figures and tables in this report ............................................................11
B Types of investors ...............................................................................12 Description of investor types..................................................................12 Investor types by investor group............................................................12 Demographic differences between investor types.................................13 Differences between ACR and Fincorp investors..................................14
C Investment factors...............................................................................15 Attraction to/satisfaction with the investment.........................................15 Information and advice sources.............................................................21 Investment understanding .....................................................................24 Investor engagement .............................................................................28
Key terms .....................................................................................................29

REPORT 126: Understanding investors in the unlisted unrated debenture (UUD) market
© Australian Securities and Investments Commission April 2008 Page 4
Executive summary
About this research
This research was commissioned by the Australian Securities and Investments Commission (ASIC) as part of its ‘Three Point Plan’ for unlisted, unrated debentures (UUDs).1 ASIC hoped to gain a better understanding and profile of UUD investors and, in particular, investors in Australian Capital Reserve Ltd (Administrators Appointed) (ACR) and Fincorp Investments Ltd (Administrators Appointed) (Fincorp), both of which went into administration in May 2007.
The research was conducted by brandmanagement Pty Limited (brandmanagement), in consultation with ASIC, between October 2007 and March 2008. The key aim of the research was to examine and understand how and why investors in ACR and Fincorp had made their investment decision. It was envisaged this understanding would maximise the effectiveness of ASIC’s regulatory responses to advertising, disclosure and, in particular, investor education.
To provide context to the experiences, characteristics and profile of ACR/Fincorp investors, the research compared three key groups of investors:
people who had invested in ACR and/or Fincorp (ACR/Fincorp investors)
people who had investments in UUDs at the time of the research (Active UUD investors)2
general investors (General investors).3
The research included a qualitative stage (3 focus groups and 12 in-depth interviews) followed by a quantitative stage (1,142 online and phone questionnaires).
What is an unlisted, unrated debenture?
A debenture is essentially an undertaking given by a company to repay money lent to it by an investor and, usually, also includes a promise to pay interest in relation to that loan. Debentures are different to deposits with an authorised deposit taking institution (e.g. a bank). They are also different from other investments such as shares in a company and units in a managed investment scheme.
Debentures are mostly issued to investors under a prospectus to fund a range of business activities (e.g. provision of finance and loans, property-related activities, investments, general operations).
1 See ASIC Consultation Paper 89 Unlisted, unrated debentures—improving disclosure for retail investors issued August 2007 at www.asic.gov.au/cp. 2 The quantitative sample of Active UUD investors covered 355 separate investments by 280 individuals across 27 different debenture issuers. 3 Depending on the stage of research, this involved either those with general fixed interest investments or those with any type of investment (e.g. shares, investment property) and over $50,000 to invest.
REPORT 126: Understanding investors in the unlisted unrated debenture (UUD) market
© Australian Securities and Investments Commission April 2008 Page 5
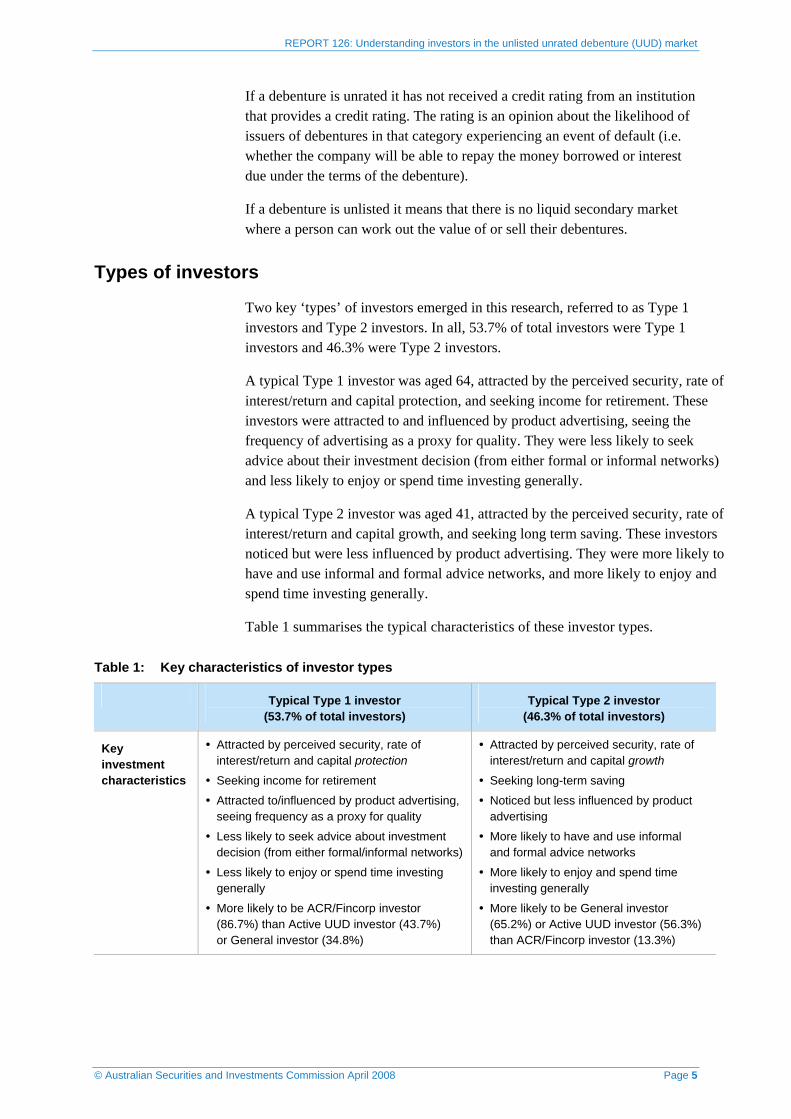
If a debenture is unrated it has not received a credit rating from an institution that provides a credit rating. The rating is an opinion about the likelihood of issuers of debentures in that category experiencing an event of default (i.e. whether the company will be able to repay the money borrowed or interest due under the terms of the debenture).
If a debenture is unlisted it means that there is no liquid secondary market where a person can work out the value of or sell their debentures.
Types of investors
Two key ‘types’ of investors emerged in this research, referred to as Type 1 investors and Type 2 investors. In all, 53.7% of total investors were Type 1 investors and 46.3% were Type 2 investors.
A typical Type 1 investor was aged 64, attracted by the perceived security, rate of interest/return and capital protection, and seeking income for retirement. These investors were attracted to and influenced by product advertising, seeing the frequency of advertising as a proxy for quality. They were less likely to seek advice about their investment decision (from either formal or informal networks) and less likely to enjoy or spend time investing generally.
A typical Type 2 investor was aged 41, attracted by the perceived security, rate of interest/return and capital growth, and seeking long term saving. These investors noticed but were less influenced by product advertising. They were more likely to have and use informal and formal advice networks, and more likely to enjoy and spend time investing generally.
Table 1 summarises the typical characteristics of these investor types.
Table 1: Key characteristics of investor types
Typical Type 1 investor (53.7% of total investors)
Typical Type 2 investor (46.3% of total investors)
Key investment characteristics
Attracted by perceived security, rate of interest/return and capital protection
Seeking income for retirement
Attracted to/influenced by product advertising, seeing frequency as a proxy for quality
Less likely to seek advice about investment decision (from either formal/informal networks)
Less likely to enjoy or spend time investing generally
More likely to be ACR/Fincorp investor (86.7%) than Active UUD investor (43.7%) or General investor (34.8%)
Attracted by perceived security, rate of interest/return and capital growth
Seeking long-term saving
Noticed but less influenced by product advertising
More likely to have and use informal and formal advice networks
More likely to enjoy and spend time investing generally
More likely to be General investor (65.2%) or Active UUD investor (56.3%) than ACR/Fincorp investor (13.3%)
REPORT 126: Understanding investors in the unlisted unrated debenture (UUD) market
© Australian Securities and Investments Commission April 2008 Page 6
Typical Type 1 investor (53.7% of total investors)
Typical Type 2 investor (46.3% of total investors)
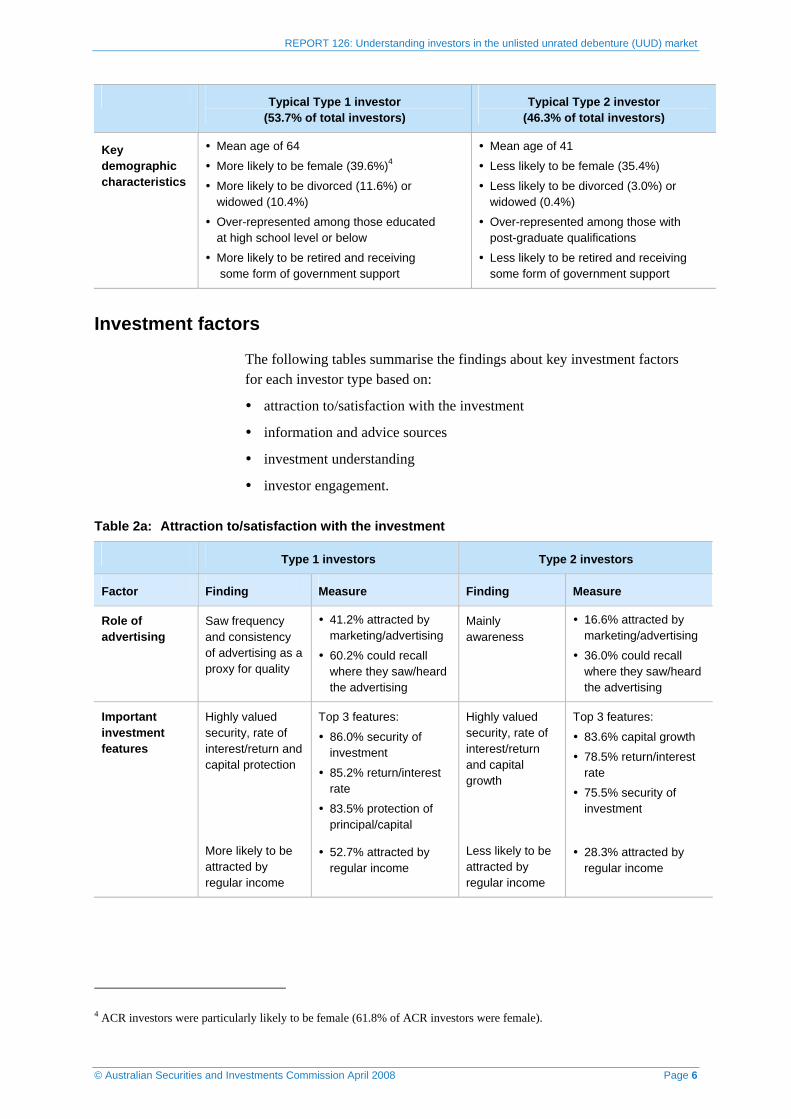
Key demographic characteristics
Mean age of 64
More likely to be female (39.6%)4
More likely to be divorced (11.6%) or widowed (10.4%)
Over-represented among those educated at high school level or below
More likely to be retired and receiving some form of government support
Mean age of 41
Less likely to be female (35.4%)
Less likely to be divorced (3.0%) or widowed (0.4%)
Over-represented among those with post-graduate qualifications
Less likely to be retired and receiving some form of government support
Investment factors
The following tables summarise the findings about key investment factors for each investor type based on:
attraction to/satisfaction with the investment
information and advice sources
investment understanding
investor engagement.
Table 2a: Attraction to/satisfaction with the investment
Type 1 investors Type 2 investors
Factor Finding Measure Finding Measure
Role of advertising
Saw frequency and consistency of advertising as a proxy for quality
41.2% attracted by marketing/advertising
60.2% could recall where they saw/heard the advertising
Mainly awareness
16.6% attracted by marketing/advertising
36.0% could recall where they saw/heard the advertising
Important investment features
Highly valued security, rate of interest/return and capital protection
Top 3 features:
86.0% security of investment
85.2% return/interest rate
83.5% protection of principal/capital
Highly valued security, rate of interest/return and capital growth
Top 3 features:
83.6% capital growth
78.5% return/interest rate
75.5% security of investment
More likely to be attracted by regular income
52.7% attracted by regular income
Less likely to be attracted by regular income
28.3% attracted by regular income
4 ACR investors were particularly likely to be female (61.8% of ACR investors were female).

REPORT 126: Understanding investors in the unlisted unrated debenture (UUD) market
© Australian Securities and Investments Commission April 2008 Page 7
Type 1 investors Type 2 investors
Factor Finding Measure Finding Measure
Main reason for investing5
To provide income for retirement
47.6% income for retirement
16.5% long term saving
8.2% parking the cash for further investment
3.6% play money
To provide long term saving
21.1% income for retirement
31.1% long term saving
11.2% parking the cash for further investment
3.6% play money
Tend to be older 64 average age Tend to be younger
41 average age Life stage drivers
More likely to have experienced significant event before investing6
55.1% no significant event
10.9% sold a property investment
10.8% retired
2.8% became employed (or self-employed)
Less likely to have experienced significant event before investing7
72.0% no significant event
4.2% sold a property investment
0.4% retired
4.5% became employed (or self-employed)
Diversification8 Low levels of diversification
Average proportion of total investments invested 31.5%9
15.5% investing more than 75% of their total investments
69.0% had 3 or less investments
11.6% main reason for investing was ‘to diversify my portfolio’
Low to medium levels of diversification
Average proportion of total investments invested 26.8%10
10.8% investing more than 75% of their total investments
60.2% had 3 or less investments
13.9% main reason for investing was ‘to diversify my portfolio’
More likely to roll over
58.6% rolled over Less likely to roll over
43.4% rolled over Roll over of investment
Main roll over drivers were performance and rate
Reasons for roll over:
83.1% happy with performance
61.2% offering a good rate of return
22.7% convenience
3.6% lack of alternatives
Main roll over drivers were performance and rate
Reasons for roll over:
70.9% happy with performance
44.1% offering a good rate of return
31.8% convenience
11.8% lack of alternatives
5 The percentages in this item are sourced from different questions and therefore do not add to 100%. 6 These percentages include only some of the events from the life stage/event question therefore do not add to 100%. 7 As above. 8 The percentages in this item are sourced from different questions and therefore do not add to 100%. 9 For ACR/Fincorp and Active UUD investors this investment refers to their UUD investment and for General investors this refers to their largest investment. 10 As above.

REPORT 126: Understanding investors in the unlisted unrated debenture (UUD) market
© Australian Securities and Investments Commission April 2008 Page 8
Table 2b: Information and advice sources
Type 1 investors Type 2 investors
Factor Finding Measure Finding Measure
Self-directed vs advice seeking
Heavy reliance on advertising
#1 investment influence for specific investment:
56.3% advertising
Typical information sources used when investing generally:
25.8% print advertising
21.7% TV advertising
9.1% radio advertising
Less reliance on advertising
#1 investment influence for specific investment:
25.9% advertising
Typical information sources used when investing generally:
25.4% print advertising
10.0% TV advertising
5.3% radio advertising
Less likely to seek advice either formally or socially11
#1 investment influence for specific investment:
18.1% adviser
7.8% associates
Typical information sources used when investing generally
34.9% professional financial advisers
18.9% family/ friends/work colleagues
More likely to use a paid adviser or social network as part of their decision making12
#1 investment influence for specific investment:
29.9% adviser
19.8% associates
Typical information sources used when investing generally
43.0% professional financial advisers
36.9% family/ friends/ work colleagues
Trust for the company
Trusted the company and tended to pass trust to company representatives13
81.1% attracted by reputation of the company involved
Trust for the company and company representatives less important
73.8% attracted by reputation of the company involved
11 The percentages in this item are sourced from different questions therefore do not add to 100%. These percentages also exclude a number of other information/advice sources. 12 As above. 13 The qualitative research indicated that people visited by salespeople in their home tended to pass trust to these salespeople.

REPORT 126: Understanding investors in the unlisted unrated debenture (UUD) market
© Australian Securities and Investments Commission April 2008 Page 9
Table 2c: Investment understanding
Type 1 investors Type 2 investors
Factor Finding Measure Finding Measure
Low understanding of UUD
Some did not understand they were investing in a UUD
Qualitative findings revealed that understanding of this type of investment was very low
Some did not understand they were investing in a UUD
Qualitative findings revealed that understanding of this type of investment was low
Prospectus Perceived to be relatively well understood
Some did not read prospectus
Average investor self-rated their understanding of the prospectus 6.7 out of 10
Perceived to be relatively well understood
Some did not read prospectus
Average investor self-rated their understanding of the prospectus 7.0 out of 10
Perception of security/risk14
Little awareness of risk
52.4% rated their UUD investment ‘no risk at all’ or ‘very low risk’
Some awareness of risk
36.9% rated their UUD investment ‘no risk at all’ or ‘very low risk’
Comparable to a bank15
In some cases the UUD investment was compared against bank products
52.0% of those that made a product comparison did so with a bank product
In some cases the UUD investment was compared against bank products
27.0% of those that made a product comparison did so with a bank product
Table 2d: Investor engagement
Type 1 investors Type 2 investors
Factor Finding Measure Finding Measure
Less likely to enjoy investing16
47.3% enjoy investing
More likely to enjoy investing17
61.1% enjoy investing
Level of enjoyment in/ time spent on investing
More likely to spend no time on investing
No. of hours per week on investing:
32.5% none
38.3% 1–3 hrs
11.8% 4–7 hrs
7.8% 8–11 hrs
5.7% 20+ hrs
Less likely to spend no time on investing
No. of hours per week on investing:
17.3% none
49.6% 1–3 hrs
15.8% 4–7 hrs
9.2% 8–11hrs
4.1% 20+ hrs
14 These percentages are for ACR/Fincorp and Active UUD investors only. General investors were excluded from this analysis because they held a range of investment types. 15 As above. 16 This was calculated from a 10 point rating scale. Scores of seven or greater indicate enjoyment. 17 As above.

REPORT 126: Understanding investors in the unlisted unrated debenture (UUD) market
© Australian Securities and Investments Commission April 2008 Page 10
A About this research
Key points
The research was conducted by brandmanagement, in consultation with ASIC, between October 2007 and March 2008.
The key aim of the research was to examine and understand how and why investors in ACR and Fincorp had made their investment decision.
Research sample
The qualitative stage comprised 3 focus groups and 12 in-depth interviews. The quantitative stage comprised 1,142 online/phone questionnaires. Across all investor groups the quantitative sample is sufficiently robust to ensure a +/- 5% error in all fields with a 95% confidence.
Table 3: Sample information
Investor group Qualitative stage Quantitative stage
ACR/Fincorp 1 focus group and 12 in-depth interviews 368 online/phone questionnaires
Active UUD 1 focus group 280 online/phone questionnaires18
General 1 focus group 494 online/phone questionnaires19
An additional 3 focus groups were conducted to test ASIC’s investor education messages and materials. The feedback collected in these focus groups will be used to inform ASIC’s investor education work in this area and more broadly.
Research limitations
Limitations in this particular research include:
in the qualitative stage of the research, more ‘knowledgeable’ focus group participants may have influenced the group’s consensus views on particular investment concepts
as with all research that relies on people’s recollection of events, some of the material might be impacted by hindsight bias.
18 The quantitative sample of Active UUD investors covered 355 separate investments by 280 individuals across 27 different debenture issuers. While more than 380 Active UUD investors were initially recruited to participate in this stage, their availability to answer the questionnaire in the required time period appeared to be impacted by their demographic status (i.e. this group tended to have a higher proportion of employed and/or younger family status investors). However, the proportionately smaller sample size does not affect the validity of the data. 19 General investors with total investments valued at $50,000 or less (excluding their home) were filtered out of the research and the sample of 494 does not include them. This is because the qualitative findings suggested that investors with less than $50,000 to invest were less well matched to the ACR/Fincorp and Active UUD investors, who tended to have larger amounts of money to invest.

REPORT 126: Understanding investors in the unlisted unrated debenture (UUD) market
© Australian Securities and Investments Commission April 2008 Page 11
Figures and tables in this report
In some figures and tables in this report the sample numbers do not add up to the total sample size (i.e. 1,142) and the percentages do not add up to 100%. This is due to a range of reasons, including multiple responses (i.e. where a respondent is allowed to choose more than one option) and/or missing cases (e.g. question is not relevant to all respondents).

REPORT 126: Understanding investors in the unlisted unrated debenture (UUD) market
© Australian Securities and Investments Commission April 2008 Page 12
B Types of investors
Key points
The qualitative and quantitative stages of the research revealed two key ‘types’ of investors, referred to as Type 1 (53.7%) and Type 2 (46.3%).
ACR/Fincorp investors were more likely to be Type 1 investors, while General and Active UUD investors were more likely to be Type 2 investors.
Description of investor types
A typical Type 1 investor was aged 64, attracted by the perceived security, rate of interest/return and capital protection, and seeking income for retirement. These investors were attracted to and influenced by product advertising, seeing the frequency of advertising as a proxy for quality. They were less likely to seek advice about their investment decision (from either formal or informal networks) and less likely to enjoy or spend time investing generally.
A typical Type 2 investor was aged 41, attracted by the perceived security, rate of interest/return and capital growth, and seeking long term saving. These investors noticed but were less influenced by product advertising. They were more likely to have and use informal and formal advice networks, and more likely to enjoy and spend time investing generally.
Investor types by investor group
ACR/Fincorp investors (86.7%) were much more likely to be Type 1 investors than the other investor groups (Active UUD: 43.7%, General: 34.8%). General (65.2%) and Active UUD (56.3%) investors were more likely to be Type 2 investors. Only 13.3% of ACR/Fincorp investors were classified as Type 2 investors.
Figure 1: Investor types by investor group
86.7
43.7
34.8
13.3
56.3
65.2
0
20
40
60
80
100
ACR/Fincorp Active General
%
Type 1Type 2
ACR/Fincorp=368,Active=279,General=494, Missing case=1, p<0.05

REPORT 126: Understanding investors in the unlisted unrated debenture (UUD) market
© Australian Securities and Investments Commission April 2008 Page 13
Demographic differences between investor types Demographically, the key difference between Type 1 and Type 2 investors was age, which in turn reflected differences in employment status, amount of income and source of income. In addition, Type 1 investors appeared to be more likely to be female and more likely to be divorced or widowed.
While both investor types were most likely to be educated at diploma/degree level, Type 1 investors were over-represented among those educated at high school level or below and Type 2 investors were over-represented among those with post-graduate qualifications.
Table 4: Demographics by investor type
Demographics Type 1 Type 2
Average (mean) age 64 41
Min age 46 26 Age
Max age 82 54
Female 39.6% 35.4% Gender
Male 60.4% 64.6%
Never married 5.1% 14.0%
Married 65.1% 67.6%
De facto 4.9% 12.0%
Separated 2.3% 1.7%
Divorced 11.6% 3.0%
Widowed 10.4% 0.4%
Marital status
Other 0.7% 1.3%
Primary school 1.6% 0.0%
Some secondary school/Technical college 9.0% 1.7%
Intermediate, Form 4, Year 10 17.0% 2.1%
Apprenticeship 2.8% 1.1%
5th form, Leaving, Year 11 7.8% 2.7%
Finished technical college 8.3% 4.4%
Finished secondary school 6.4% 6.1%
Some university 4.7% 8.7%
Diploma or degree 26.4% 39.8%
Education
Post graduate qualifications 16.0% 33.4%
Full-time employed 26.9% 80.5%
Part-time employed 14.8% 11.4%
Semi-retired 4.1% 1.5%
Retired 49.1% 2.1%
Home duties 3.6% 2.8%
Still studying 0.0% 0.8%
Employment status
Looking for work 1.5% 0.9%

REPORT 126: Understanding investors in the unlisted unrated debenture (UUD) market
© Australian Securities and Investments Commission April 2008 Page 14
Demographics Type 1 Type 2
$1–$52,000 49.8% 9.2%
$52,001–$104,000 23.8% 22.4%
$104,001–$250,000 21.1% 57.1%
Annual household income
$250,001 or more 5.1% 11.2%
Age and disability support payment 25.4% 2.8%
Unemployment, education and sickness benefit 0.7% 0.4%
Government support
Other government pensions and benefits 16.0% 3.6%
Differences between ACR and Fincorp investors
Although the majority of ACR and Fincorp investors in this research were comparable and more likely to be Type 1 investors, there were a few subtle differences between investors in ACR and Fincorp, including:
ACR investors were more likely to be female.
Fincorp investors were slightly more likely to have invested in four or more other types of investments than ACR investors (i.e. other than UUDs).
ACR investors were slightly more likely to spend less, or no, time per week on investments compared to Fincorp investors.
When asked about the important features of their investment, ACR investors were slightly more responsive to capital growth, investment term, customer service, and investment in property than Fincorp investors.

REPORT 126: Understanding investors in the unlisted unrated debenture (UUD) market
© Australian Securities and Investments Commission April 2008 Page 15
C Investment factors
Key points
This section summarises the findings about key investment factors for each investor type based on:
• attraction to/satisfaction with the investment
• information and advice sources
• investment understanding
• investor engagement.
Attraction to/satisfaction with the investment
The role of advertising
Essentially, Type 1 investors used the frequency and placement of the advertisements as a proxy for quality. In all, 85.3% of ACR/Fincorp investors (compared to 20.1% of Active UUD investors) could recall where they saw/heard the advertising, with 39.4% stating newspapers, 20.3% TV and 19.4% radio. Some investors (6.4%) specifically noted that they were influenced by spokespeople:
I thought, there was some famous guy who was coming on the ad, I can’t remember who it was…I looked at him and I said, ‘if this company is not a good company, why would that man be there’…[I thought] if this company [is] not a good company then this man wouldn’t be putting his name to it and standing there, and speaking for the company. (Male, ACR, In-depth interview, NSW)20
Important investment features
Overall, the return/interest rate (82.0%) and perception of low risk (including security (81.2%) and protection of capital (76.4%)) were important factors for all investors but were particularly important for ACR/Fincorp investors. As Figure 2 shows, ACR/Fincorp investors were much more likely than other investors to value investment term (79.9%), regular income (79.1%), customer service (78.4%), investment in property (73.4%), trustee (70.9%) and marketing and advertising (61.8%).
20 Verbatim quotations from investors are indicated in this report by italics. In some cases the comments have been altered slightly for sense. In one case geographical information (i.e. state) was altered to reflect the state in which the investor resided at the time of the investment. Square brackets are used to indicate paraphrasing.

REPORT 126: Understanding investors in the unlisted unrated debenture (UUD) market
© Australian Securities and Investments Commission April 2008 Page 16
Figure 2: Important investment features
0 10 20 30 40 50 60 70 80 90 100
Marketing and advertising
Capital growth
Trustee
Fees
Investment in property
Customer service
Regular income
Reputation of company involved
Investment term
Protection of principal/capital
Security of investment
Return/Interest rate
%
ACR/FincorpActiveGeneral
ACR/Fincorp = 251-365, Active = 221-269, General = 336-480 (sample range over 12 measures), p<0.05
Main reason for investing
When asked for their main reason for investing, 35.3% of total investors nominated income for retirement. Again, as Figure 3 shows, this was particularly important for ACR/Fincorp investors (48.6%).
Figure 3: Main reason for investing
2.44.9
48.6
17.9
5.48.2
12.58.2
3.9
28.025.8
14.7 13.6
5.74.5 2.4
29.625.9
9.7
15.412.6
0
10
20
30
40
50
60
No particularreason
Play money forholidays or
hobby pursuits
Income forretirement
Long termsaving
Parking thecash for further
investment
To diversify myportfolio
Other
%
ACR/FincorpActiveGeneral
ACR/Fincorp=368,Active=279,General=494
Life stage drivers
In keeping with their age profile, Type 1 investors were more likely to be retired (49.1%) than Type 2 investors (2.1%) and more likely to be receiving Government pensions. ACR/Fincorp investors were 10 times as likely to be
REPORT 126: Understanding investors in the unlisted unrated debenture (UUD) market
© Australian Securities and Investments Commission April 2008 Page 17
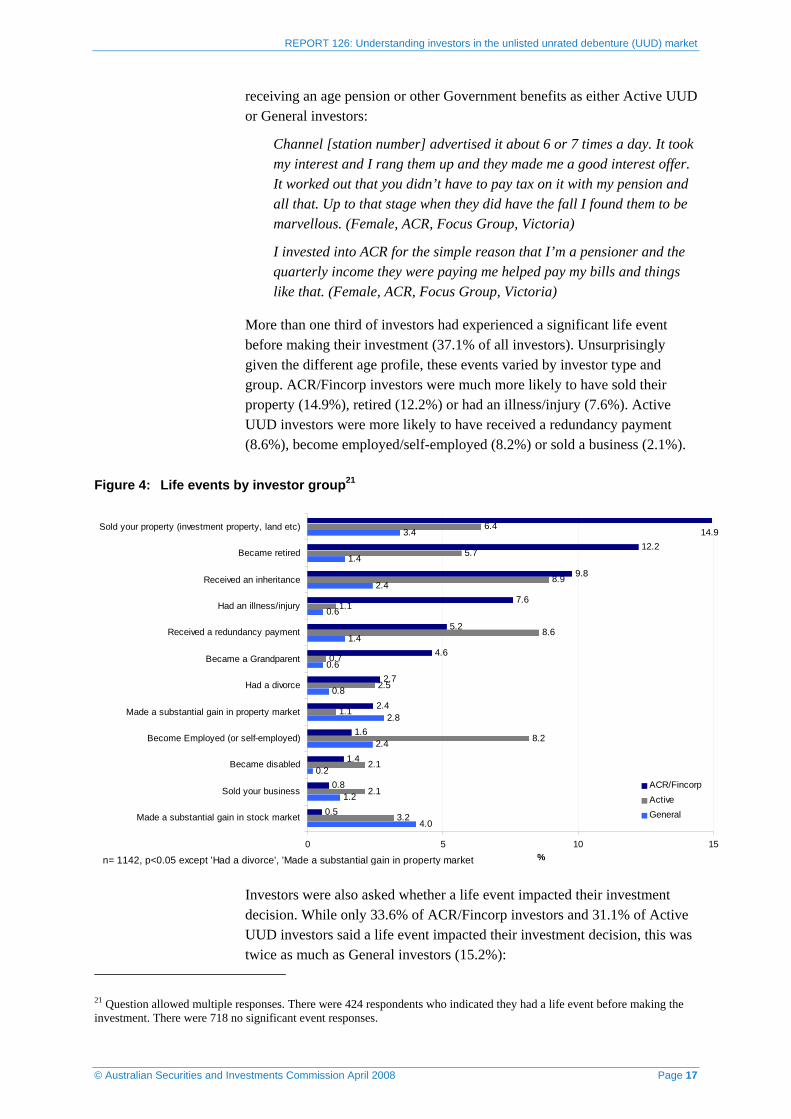
receiving an age pension or other Government benefits as either Active UUD or General investors:
Channel [station number] advertised it about 6 or 7 times a day. It took my interest and I rang them up and they made me a good interest offer. It worked out that you didn’t have to pay tax on it with my pension and all that. Up to that stage when they did have the fall I found them to be marvellous. (Female, ACR, Focus Group, Victoria)
I invested into ACR for the simple reason that I’m a pensioner and the quarterly income they were paying me helped pay my bills and things like that. (Female, ACR, Focus Group, Victoria)
More than one third of investors had experienced a significant life event before making their investment (37.1% of all investors). Unsurprisingly given the different age profile, these events varied by investor type and group. ACR/Fincorp investors were much more likely to have sold their property (14.9%), retired (12.2%) or had an illness/injury (7.6%). Active UUD investors were more likely to have received a redundancy payment (8.6%), become employed/self-employed (8.2%) or sold a business (2.1%).
Figure 4: Life events by investor group21
4.0
1.2
0.2
2.4
2.8
0.8
0.6
1.4
0.6
2.4
1.4
3.4
3.2
2.1
2.1
8.2
1.1
2.5
0.7
8.6
1.1
8.9
5.7
6.4
0.5
0.8
1.4
1.6
2.4
2.7
4.6
5.2
7.6
9.8
12.214.9
0 5 10 15
Made a substantial gain in stock market
Sold your business
Became disabled
Become Employed (or self-employed)
Made a substantial gain in property market
Had a divorce
Became a Grandparent
Received a redundancy payment
Had an illness/injury
Received an inheritance
Became retired
Sold your property (investment property, land etc)
%
ACR/FincorpActiveGeneral
n= 1142, p<0.05 except 'Had a divorce', 'Made a substantial gain in property market
Investors were also asked whether a life event impacted their investment decision. While only 33.6% of ACR/Fincorp investors and 31.1% of Active UUD investors said a life event impacted their investment decision, this was twice as much as General investors (15.2%):
21 Question allowed multiple responses. There were 424 respondents who indicated they had a life event before making the investment. There were 718 no significant event responses.

REPORT 126: Understanding investors in the unlisted unrated debenture (UUD) market
© Australian Securities and Investments Commission April 2008 Page 18
I was retrenched… four and a half years ago, and retrenchment and superannuation monies went off into various funds [including ACR and Fincorp]. (Couple, ACR and Fincorp, In-depth interview, Victoria)
I had a work injury in 2002 that prevented me from working…I got a settlement in 2005 and unfortunately not being able to work it is not going to last forever you know, so I had to invest it and get an income off it. So I looked around. I asked for a prospectus to be sent out from ACR to look at what they were offering and then the salesman rang me up quite a few times actually. (Male, ACR, In-depth interview, WA)
Diversification
Diversification was a key investment driver for only 12.6% of investors and both Type 1 and Type 2 investors appeared to practise relatively low levels of diversification.22 Several measures were used to understand investors’ level of diversification:
investors’ main reason for investing (i.e. ‘To diversify my portfolio’: see Figure 3)
proportion of each investor’s total investments held in the UUD (or, in the case of General investors, the largest investment held)
the number of different types of investments held by each investor.
Proportion of investment held in one place
Most investors across the sample invested less than 25% of their total investments in their UUD (or largest) investment. ACR/Fincorp investors were more likely to have invested more than 75% of their total investments in their UUD investment compared to other investor groups.
Figure 5: Proportion of total investments invested in one place23
55.3
17.2
5.2
22.3
70.7
15.2
6.8 7.2
65.6
15.68.8 9.8
0
10
20
30
40
50
60
70
80
0% to 25% 26% to 50% 51% to 75% 76% to 100%
%
ACR/FincorpActive General
ACR/Fincorp=367, Active=263, General=480
22 This is consistent with other brandmanagement research, the High Net Worth Report, published in 2007, which shows that diversification becomes apparent after investment portfolios reach more than $1 million in value. 23 For ACR/Fincorp and Active UUD investors this investment refers to their UUD investment and for General investors this refers to their largest investment.

REPORT 126: Understanding investors in the unlisted unrated debenture (UUD) market
© Australian Securities and Investments Commission April 2008 Page 19
ACR investors less likely to diversify
ACR investors demonstrated less diversification than Fincorp and all other investor groups, with an average of 44.2% of their investments held in ACR. Fincorp investors held on average 25.1% of their investments in Fincorp, which was similar to the average investment proportion figures for Active UUD investors (23.9%) and General investors (25.9%).
ACR female investors less likely to diversify
In this research 61.8% of ACR investors were female, while 45.0% of Fincorp investors were female and 37.7% of total investors were female. Female ACR investors were less likely to diversify than their male ACR counterparts, with an average of 47.5% of their total investments held in ACR compared to an average of 39.2% for males.
There were no significant gender differences for Fincorp and Active UUD investors. However, some gender differences appeared for General investors (females held an average of 31.0% of their total investments in their largest investment compared to only 24.1% for male General investors).
Number of investment types held
While most investors across the sample held up to three investment types, Type 2 investors were more likely to have more (39.8% compared to 31.0%).
Figure 6: Number of investment types held
69.0
27.2
3.8
60.2
38.1
1.70
10
20
30
40
50
60
70
80
0 to 3 4 to 6 7 or more
%
Type 1Type 2
Type 1=613, Type 2=528
Understanding of ‘diversification’
In both the qualitative and quantitative stages of the research, investors were asked to comment on the terms ‘diversification’ and ‘asset allocation’.24
Most investors felt they understood the importance and meaning of ‘diversification’, but some were unable to describe it clearly or accurately. Others understood it, but actively chose not to practice it. In the quantitative stage of the research, about a quarter of ACR/Fincorp investors said they did
24 In this case the qualitative findings were sourced from a separate part of the research involving additional focus groups in which investors tested ASIC’s draft investor guide.
REPORT 126: Understanding investors in the unlisted unrated debenture (UUD) market
© Australian Securities and Investments Commission April 2008 Page 20
not understand the meaning of the term ‘diversification’. This compared to 10% of Active UUD investors, and only 5% of General investors, the vast majority of whom understood the term, albeit to differing degrees.
Understanding of the term ‘asset allocation’ was lower than understanding of ‘diversification’ and there was confusion between the two. The quantitative stage revealed that understanding of ‘asset allocation’ was lowest among ACR/Fincorp investors, with many admitting they were not sure what it meant.
Roll over of investment
A person investing in debentures may do so for a set period of time. The term ‘roll over’ is used to describe where an investment is renewed past the initial maturity date of the investment.
Thirty-six percent of total investors said they did not have a roll over facility. Of those who had the facility, 53.2% rolled over.25 Type 1 investors were more likely to have rolled over their investment than Type 2 investors (58.6% compared to 43.4%).
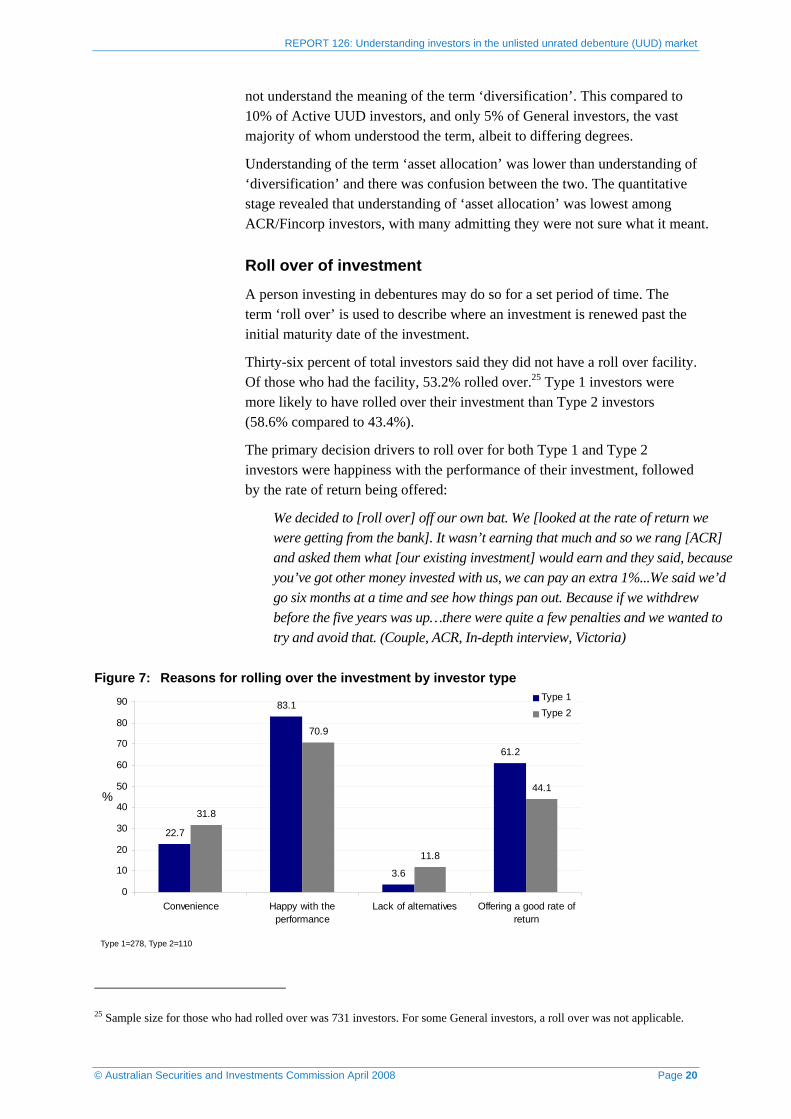
The primary decision drivers to roll over for both Type 1 and Type 2 investors were happiness with the performance of their investment, followed by the rate of return being offered:
We decided to [roll over] off our own bat. We [looked at the rate of return we were getting from the bank]. It wasn’t earning that much and so we rang [ACR] and asked them what [our existing investment] would earn and they said, because you’ve got other money invested with us, we can pay an extra 1%...We said we’d go six months at a time and see how things pan out. Because if we withdrew before the five years was up…there were quite a few penalties and we wanted to try and avoid that. (Couple, ACR, In-depth interview, Victoria)
Figure 7: Reasons for rolling over the investment by investor type
22.7
83.1
3.6
61.2
31.8
70.9
11.8
44.1
0
10
20
30
40
50
60
70
80
90
Convenience Happy with theperformance
Lack of alternatives Offering a good rate ofreturn
%
Type 1Type 2
Type 1=278, Type 2=110
25 Sample size for those who had rolled over was 731 investors. For some General investors, a roll over was not applicable.
REPORT 126: Understanding investors in the unlisted unrated debenture (UUD) market
© Australian Securities and Investments Commission April 2008 Page 21
Of those who chose not to roll over the investment (46.8% of investors with a roll over facility), most attributed this to the investment not yet coming to term (59.4% of total investors). For some General investors a roll over was not applicable to the type of investment they had. Less than 5% of investors attributed their decision to not roll over to concerns about investment risk (4.7%):
No I didn’t want to go in and out. I was there for a year and then I think it was probably two weeks after I put it in and I thought I’ll just get this year done and that’s it. I’ve talked to a friend of mine and he said with these sort of things the rates go up and down like yo-yos so don’t commit yourself. Worst case scenario is you lose a bit off the top if you don’t go for the full five year, or two year or whatever is available...A year at a time I was going to figure everything out and just reassess everything. (Male, Fincorp, Focus Group, Victoria)
Information and advice sources
Self-directed vs advice seeking
A strong finding to emerge from the qualitative research was that Type 1 investors tended not to seek the advice of others when making their investment decision. In part this was because, unlike Type 2 investors, these investors tended not to have networks of friends, family or others who regularly invest or discuss investing. Other reasons included:
belief that the decision was simple and relatively risk free and therefore didn’t require third party assistance
perception that the sales representative adequately satisfied all their questions/concerns
deep-seated mistrust of paid advice.
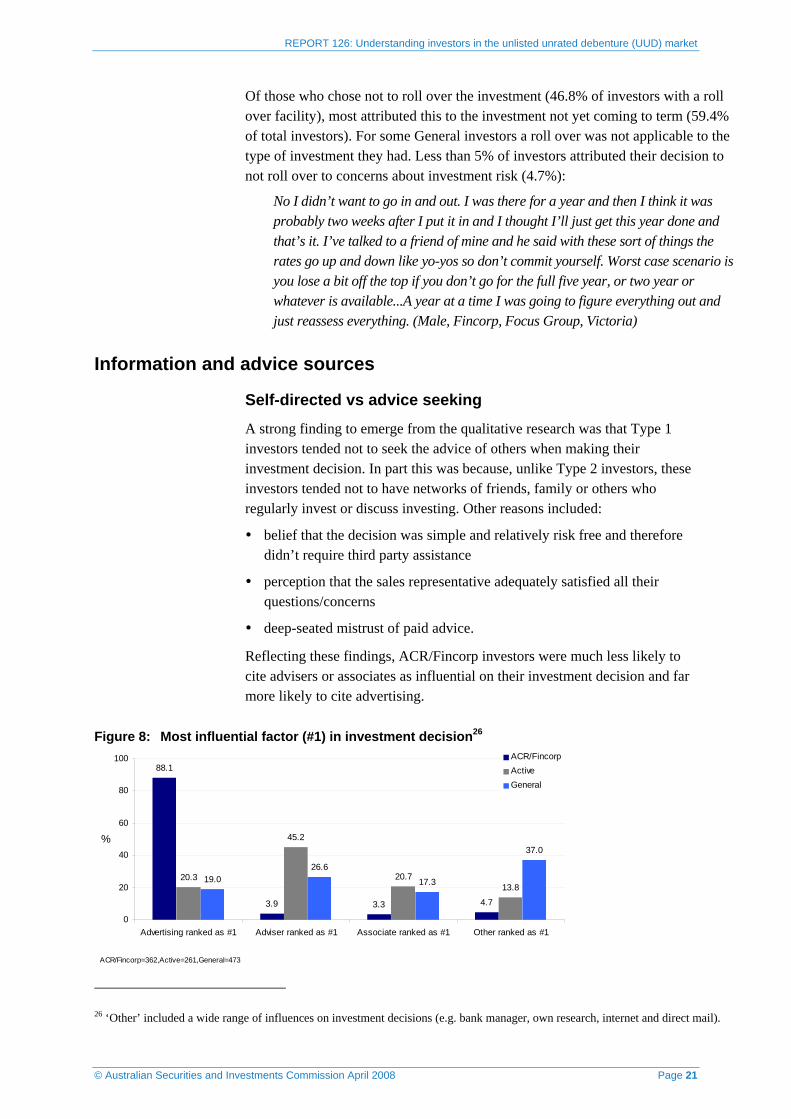
Reflecting these findings, ACR/Fincorp investors were much less likely to cite advisers or associates as influential on their investment decision and far more likely to cite advertising.
Figure 8: Most influential factor (#1) in investment decision26
88.1
3.9 3.3 4.7
20.3
45.2
20.713.8
19.026.6
17.3
37.0
0
20
40
60
80
100
Advertising ranked as #1 Adviser ranked as #1 Associate ranked as #1 Other ranked as #1
%
ACR/FincorpActiveGeneral
ACR/Fincorp=362,Active=261,General=473
26 ‘Other’ included a wide range of influences on investment decisions (e.g. bank manager, own research, internet and direct mail).
REPORT 126: Understanding investors in the unlisted unrated debenture (UUD) market
© Australian Securities and Investments Commission April 2008 Page 22
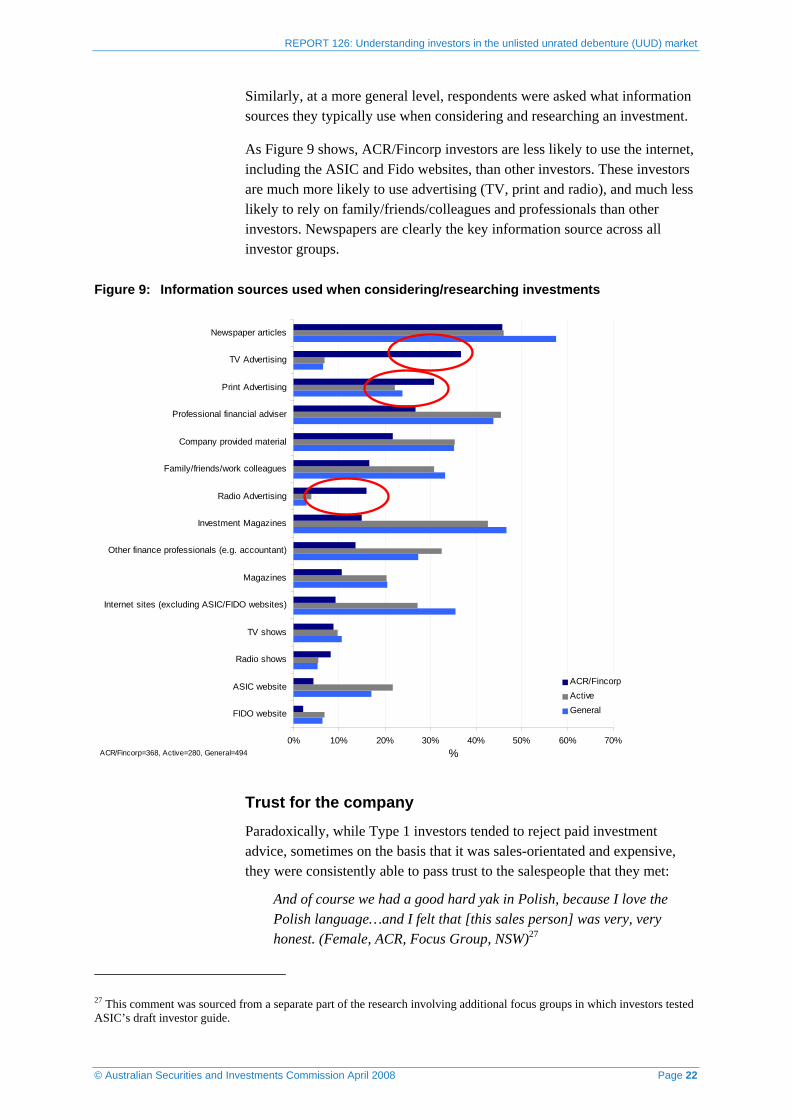
Similarly, at a more general level, respondents were asked what information sources they typically use when considering and researching an investment.
As Figure 9 shows, ACR/Fincorp investors are less likely to use the internet, including the ASIC and Fido websites, than other investors. These investors are much more likely to use advertising (TV, print and radio), and much less likely to rely on family/friends/colleagues and professionals than other investors. Newspapers are clearly the key information source across all investor groups.
Figure 9: Information sources used when considering/researching investments
0% 10% 20% 30% 40% 50% 60% 70%
FIDO website
ASIC website
Radio shows
TV shows
Internet sites (excluding ASIC/FIDO websites)
Magazines
Other finance professionals (e.g. accountant)
Investment Magazines
Radio Advertising
Family/friends/work colleagues
Company provided material
Professional financial adviser
Print Advertising
TV Advertising
Newspaper articles
%
ACR/FincorpActiveGeneral
ACR/Fincorp=368, Active=280, General=494
Trust for the company
Paradoxically, while Type 1 investors tended to reject paid investment advice, sometimes on the basis that it was sales-orientated and expensive, they were consistently able to pass trust to the salespeople that they met:
And of course we had a good hard yak in Polish, because I love the Polish language…and I felt that [this sales person] was very, very honest. (Female, ACR, Focus Group, NSW)27
27 This comment was sourced from a separate part of the research involving additional focus groups in which investors tested ASIC’s draft investor guide.

REPORT 126: Understanding investors in the unlisted unrated debenture (UUD) market
© Australian Securities and Investments Commission April 2008 Page 23
Yes. I saw the ad on the TV and I just called up the company and then she said, ‘oh I will get somebody to call you back.’ So I said, ‘Ok’ and gave her my number and then this guy called me back and I said to him, ‘look I have X amount of money and I would like to put it somewhere, and I have seen your ad on the TV’ I said, ‘but I don’t know the first thing about whether your company is good or you know, safe or…’ and he said, ‘oh our company is really safe’ and all that. I said, ‘are you sure?’ (Female, ACR, In-depth interview, WA)
I think it depends on the salesmanship, because he convinced me the money was safe...and he gave me a prospectus and he convinced me, that’s it. (Female, ACR, In-depth interview, NSW)
Females were more responsive than males to all investment features presented and particularly responsive to marketing and advertising (40.6% females, 23.6% males) and customer service (68.8% females, 50.2% males): see Figure 10. The trustee was also important, and may have conferred faith in the company/investment.
Figure 10: Important investment features by gender
40.6
49.1
57.6
65.1
68.8
70.1
73.8
77.6
81.0
84.0
86.5
86.9
23.6
35.3
43.6
50.5
50.2
56.2
62.5
76.5
75.8
72.0
79.5
77.7
0 10 20 30 40 50 60 70 80 90 100
Marketing and advertising
Trustee
Investment in property
Regular income
Customer service
Investment term
Fees
Capital growth
Reputation of company involved
Protection of principal/capital
Return/Interest rate
Security of investment
%
MaleFemale
Male=516-692, Female=291-421
%

REPORT 126: Understanding investors in the unlisted unrated debenture (UUD) market
© Australian Securities and Investments Commission April 2008 Page 24
Type 1 investors were also more likely to consider brand important when making investment decisions more generally: see Figure 11.
Figure 11: How important is brand name when making an investment decision?
6.0
3.95.4
4.2
14.5
8.0
17.1
20.4
5.5
14.8
5.54.0
6.85.7
16.715.2
21.6
14.4
4.2
5.9
0
5
10
15
20
25
1 (veryunimportant)
2 3 4 5 6 7 8 9 10 (veryimportant)
%
Type 1 Type 2
Type 1=613, Type 2=527
Credit ratings
It is worth noting that when testing investors’ responses to key investment terms in the consumer testing phase of this research, some investors were suspicious about ratings provided by rating agencies.28 These investors questioned the independence of the information and, in some cases, the system used to rate investments:
Who rates them who? They only get rated if they pay for it? (Male, ACR, Focus Group, NSW)
Well, how often are they done…once a year or a quarter[?] (Male, ACR, Focus Group, NSW)
Investment understanding
Low understanding of UUD
Many UUD investors in this research, regardless of investor type (Type 1, Type 2) or group (ACR/Fincorp, Active UUD) did not have a complete understanding of the product they had invested in. Some, including those with Active UUDs, did not realise they were investing in a debenture:
[At the time I invested I would have described it as] a managed fund with fixed interest for a certain period of time (3-5 years), where the
28 This information was sourced from a separate part of the research involving additional focus groups in which investors tested ASIC’s draft investor guide.

REPORT 126: Understanding investors in the unlisted unrated debenture (UUD) market
© Australian Securities and Investments Commission April 2008 Page 25
company guarantees to return all of my money even in the event of their collapse, as there are certain third parties, which make sure it’s done correctly. (Male, ACR, Questionnaire Response, Victoria)
According to the prospectus I was investing in property to be developed. (Male, ACR, Focus Group, Victoria)
In the quantitative stage of the research, ACR/Fincorp and Active UUD investors were asked to describe their investment in their own words. While all of the ACR/Fincorp investors attempted the question, the majority of the responses were about the failure of ACR/Fincorp rather than an attempt to define the investment. Most of the Active UUD investors attempted this question (229 of 280 investors) but responses were varied, with the majority describing them as a fixed interest investment. Only four of these investors used the word ‘debenture’.
Finally, only 3.6% of Active UUD investors surveyed selected ‘debenture’ from a list when asked to identify which investments they currently had.
Prospectuses
Investors who said they had received the prospectus (71.6%) rated their understanding of the prospectus as medium to high (the average Type 1 investor rated their level of understanding 6.7 out of 10 and the average Type 2 investor rated their level of understanding 7.0 out of 10).
For investors who considered prospectuses, most found nothing that worried or dissuaded them from investing. The prospectus and its contents were not a barrier to deciding to invest:
So I saw about it on television and I probably rang up and they sent me a prospectus…I studied that for a while and, as I say, it looked quite good and they had sufficient sort of assets and the liabilities were all sort of within check. Then I rang them up and [I asked] some questions that I had and it was always about the security…then he told me about the investments that they make and the returns and I could have invested for, I think it was, one year, two years, three years…five years and, of course, as the time went on, the interest rate would [get] bigger or better. (Male, ACR, In-depth interview, WA)
Throughout this research, and across comparisons groups, there were investors who chose not to read the prospectus or ignored the information in it. Reasons for this varied. Some felt they didn’t/wouldn’t understand it, some had already made their decision, some relied on other factors (e.g. assurances from the salesperson) and others were wary about the validity of the document:
At that time it seemed quite secure to me, because of [there being] so many advertisements on TV and the fact that in the prospectus he pointed out how many millions they’d already got…I’ve got to say I don’t read the prospectus. I make a decision before I read the

REPORT 126: Understanding investors in the unlisted unrated debenture (UUD) market
© Australian Securities and Investments Commission April 2008 Page 26
prospectus; it’s probably naive of me…But even the prospectus can be full of lies anyway, like in this case, it’s only a piece of paper with all this information. Even if you read it they can tell lies as well. (Female, ACR, In-depth interview, NSW)
Perception of security/risk
As noted earlier (see Figure 2), many investors valued investment security (81.2% total investors) and protection of capital (76.4% total investors).
Type 1 investors associated lower levels of risk with their investment than Type 2 investors: see Figure 12.
Figure 12: At the time you made this investment how much risk did you associate with it?29
24.3
28.1
20.422.7
3.60.9
13.6
23.3
28.2 27.2
5.8
1.9
0
5
10
15
20
25
30
35
40
No risk at all Very low risk Low risk Medium risk High risk Very high risk
%
Type 1Type 2
Type 1=441, Type 2=206
In addition, only 17.4% of ACR/Fincorp investors associated some capital loss with this type of investment at the time they invested and even fewer associated total capital loss (8.4%).
Many Type 1 investors were confused as to what they were investing in— mistaking their investment for something as secure as a term deposit in some cases:
Sounds amazing now. Doesn’t that sound like a term deposit to you, you just put it away and you don’t think about it and it pays interest, you were thinking about it like a term deposit? (Female, ACR, In-depth interview, NSW)
In the quantitative stage investors were asked to rank a series of investments from most risky to least risky.
29 These percentages are for ACR/Fincorp and Active UUD investors only. General investors were excluded from this analysis because they held a range of investment types.

REPORT 126: Understanding investors in the unlisted unrated debenture (UUD) market
© Australian Securities and Investments Commission April 2008 Page 27
As Figure 13 shows, Type 1 and Type 2 investors both believed an emerging markets fund was the riskiest investment overall, followed by a debenture in property development. However, Type 1 investors were more likely than Type 2 investors to consider an investment property risky.
Figure 13: Ranking investments by perceived level of risk: comparing rank #1 (most risky)
3.4 3.0
28.1
8.5 6.4
50.6
4.5 2.5
27.1
4.3 6.4
55.1
0
10
20
30
40
50
60
A term depositwith major bank
ranked as #1
An AustralianGovernment bond
ranked as #1
A debenture inproperty
developmentranked as #1
An investmentproperty ranked
as #1
Shares in a bluechip Australian
Company rankedas #1
An emergingmarkets fundranked as #1
%
Type 1Type 2
Type 1=597, Type 2=512
In the quantitative stage investors were asked to describe ‘risk/reward’ in their own words. Approximately half of the ACR/Fincorp investors either reported that they didn’t know what this meant or didn’t attempt an answer. This compared to only 10% for the Active UUD investors and 6% for General investors.
Comparable to a bank
In the qualitative stage investors tended to indicate that ACR/Fincorp investments in particular (but not exclusively) were being compared to bank products and rates. This trend was confirmed in the quantitative stage in which 55.4% of ACR/Fincorp investors who had made a product comparison judged the investment against a bank, compared to 39.5% of Active UUD investors:30
I call risk, 10, 12, 14, 16%. I don’t call 8% a big risk. That’s why I invested with them, because I thought it was a steady company and they weren’t offering any big money, just a little bit [more than] a bank. (Male, ACR, Focus Group, NSW)
There isn’t that warning space anymore. Some of the youngest debentures are offering 8%. You can get 7.2-7.5% from banks. It doesn’t seem to be an extra high risk. It seems to be a very small bit of extra money. The perception is that it’s safer than it actually is. (Male, Active UUD, Focus Group, Victoria)
30 The sample size for those who made a product comparison was 289 investors.
REPORT 126: Understanding investors in the unlisted unrated debenture (UUD) market
© Australian Securities and Investments Commission April 2008 Page 28
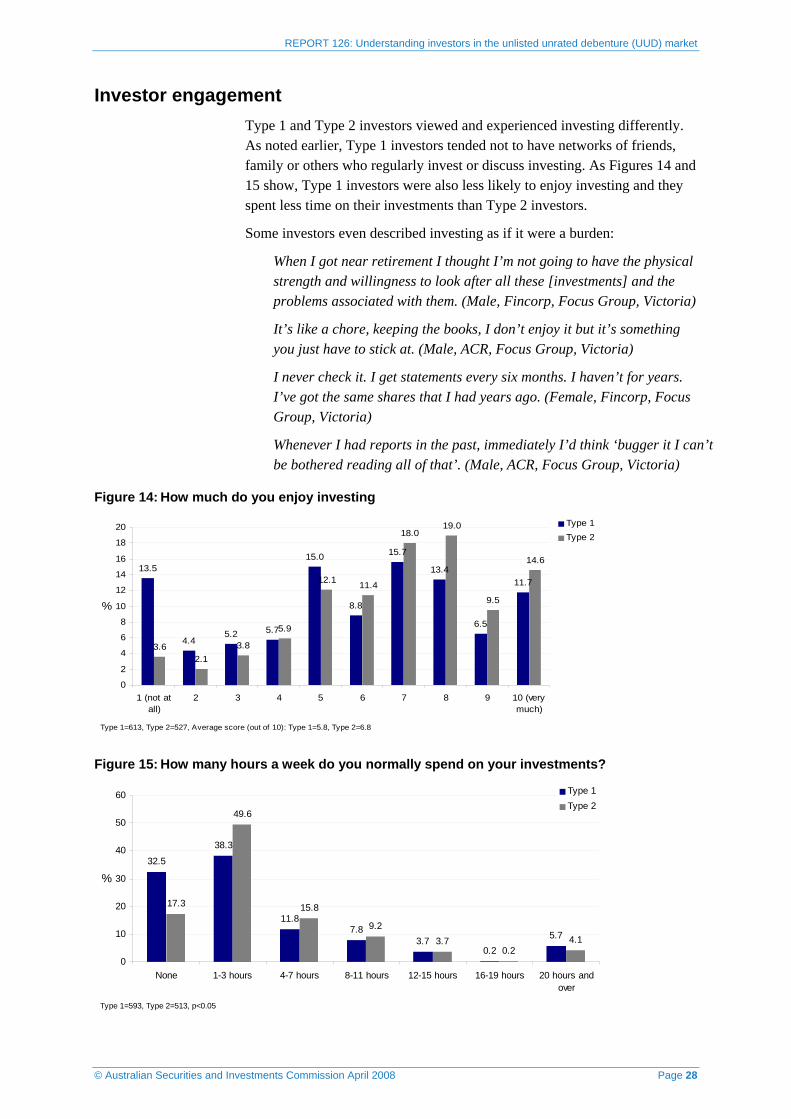
Investor engagement Type 1 and Type 2 investors viewed and experienced investing differently. As noted earlier, Type 1 investors tended not to have networks of friends, family or others who regularly invest or discuss investing. As Figures 14 and 15 show, Type 1 investors were also less likely to enjoy investing and they spent less time on their investments than Type 2 investors.
Some investors even described investing as if it were a burden:
When I got near retirement I thought I’m not going to have the physical strength and willingness to look after all these [investments] and the problems associated with them. (Male, Fincorp, Focus Group, Victoria)
It’s like a chore, keeping the books, I don’t enjoy it but it’s something you just have to stick at. (Male, ACR, Focus Group, Victoria)
I never check it. I get statements every six months. I haven’t for years. I’ve got the same shares that I had years ago. (Female, Fincorp, Focus Group, Victoria)
Whenever I had reports in the past, immediately I’d think ‘bugger it I can’t be bothered reading all of that’. (Male, ACR, Focus Group, Victoria)
Figure 14: How much do you enjoy investing
13.5
4.45.2 5.7
15.0
8.8
15.7
13.4
6.5
11.7
3.62.1
3.8
5.9
12.1 11.4
18.019.0
9.5
14.6
0
2
4
6
8
10
12
14
16
18
20
1 (not atall)
2 3 4 5 6 7 8 9 10 (verymuch)
%
Type 1Type 2
Type 1=613, Type 2=527, Average score (out of 10): Type 1=5.8, Type 2=6.8
Figure 15: How many hours a week do you normally spend on your investments?
32.5
38.3
11.87.8
3.70.2
5.7
17.3
49.6
15.8
9.23.7
0.24.1
0
10
20
30
40
50
60
None 1-3 hours 4-7 hours 8-11 hours 12-15 hours 16-19 hours 20 hours andover
%
Type 1Type 2
Type 1=593, Type 2=513, p<0.05
REPORT 126: Understanding investors in the unlisted unrated debenture (UUD) market
© Australian Securities and Investments Commission April 2008 Page 29
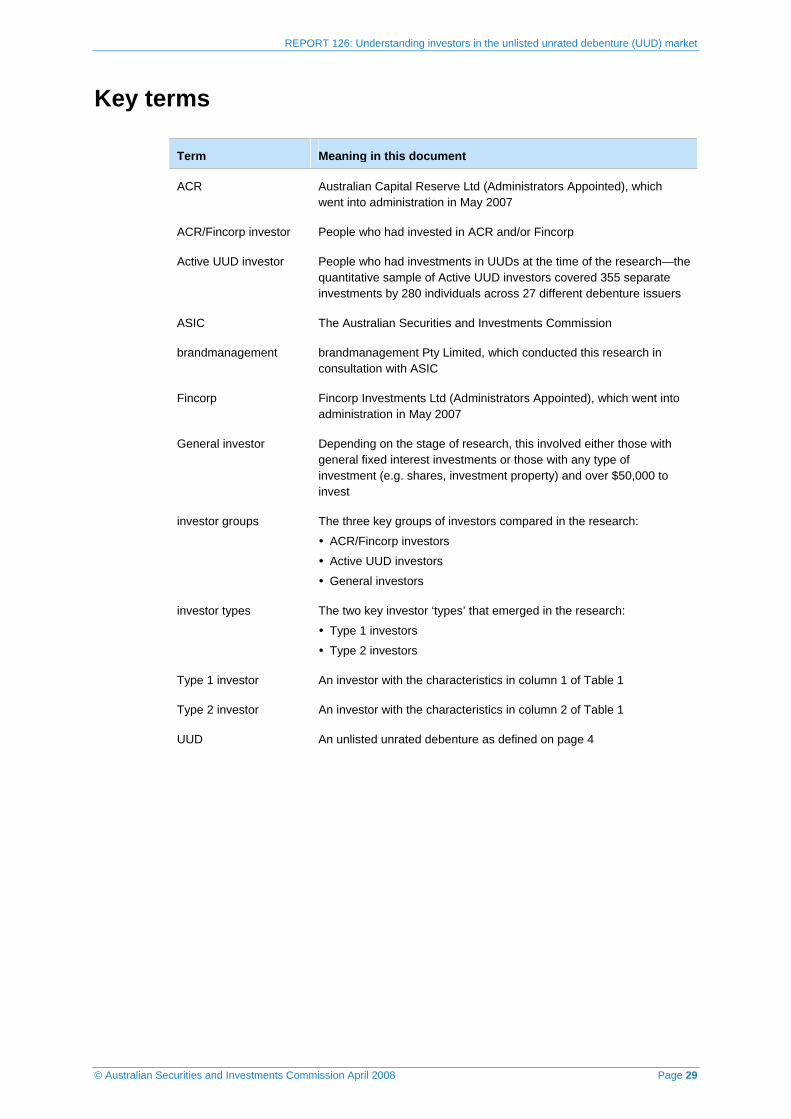
Key terms
Term Meaning in this document
ACR Australian Capital Reserve Ltd (Administrators Appointed), which went into administration in May 2007
ACR/Fincorp investor People who had invested in ACR and/or Fincorp
Active UUD investor People who had investments in UUDs at the time of the research—the quantitative sample of Active UUD investors covered 355 separate investments by 280 individuals across 27 different debenture issuers
ASIC The Australian Securities and Investments Commission
brandmanagement brandmanagement Pty Limited, which conducted this research in consultation with ASIC
Fincorp Fincorp Investments Ltd (Administrators Appointed), which went into administration in May 2007
General investor Depending on the stage of research, this involved either those with general fixed interest investments or those with any type of investment (e.g. shares, investment property) and over $50,000 to invest
investor groups The three key groups of investors compared in the research:
ACR/Fincorp investors
Active UUD investors
General investors
investor types The two key investor ‘types’ that emerged in the research:
Type 1 investors
Type 2 investors
Type 1 investor An investor with the characteristics in column 1 of Table 1
Type 2 investor An investor with the characteristics in column 2 of Table 1
UUD An unlisted unrated debenture as defined on page 4