understanding low cycle fatigue behavior of alloy … · understanding low cycle fatigue behavior...
TRANSCRIPT
metals
Article
Understanding Low Cycle Fatigue Behavior ofAlloy 617 Base Metal and Weldments at 900 ˝C
Rando Tungga Dewa 1, Seon Jin Kim 1,*, Woo Gon Kim 2 and Eung Seon Kim 2
1 Department of Mechanical Design Engineering, Pukyong National University, Busan 608-739, Korea;[email protected]
2 Korea Atomic Energy Research Institute (KAERI), Daejeon 305-353, Korea; [email protected] (W.G.K.);[email protected] (E.S.K.)
* Correspondence: [email protected]; Tel.: +82-51-629-6163; Fax: +82-51-629-6150
Academic Editor: Filippo BertoReceived: 4 July 2016; Accepted: 26 July 2016; Published: 2 August 2016
Abstract: In order to better understand the high temperature low cycle fatigue behavior of Alloy617 weldments, this work focuses on the comparative study of the low cycle fatigue behavior ofAlloy 617 base metal and weldments, made from automated gas tungsten arc welding with Alloy617 filler wire. Low cycle fatigue tests were carried out by a series of fully reversed strain-controls(strain ratio, Rε = ´1), i.e., 0.6%, 0.9%, 1.2% and 1.5% at a high temperature of 900 ˝C and a constantstrain rate of 10´3/s. At all the testing conditions, the weldment specimens showed lower fatiguelives compared with the base metal due to their microstructural heterogeneities. The effect of veryhigh temperature deformation behavior regarding cyclic stress response varied as a complex functionof material property and total strain range. The Alloy 617 base weldments showed some cyclichardening as a function of total strain range. However, the Alloy 617 base metal showed some cyclicsoftening induced by solute drag creep during low cycle fatigue. An analysis of the low cycle fatiguedata based on a Coffin-Manson relationship was carried out. Fracture surface characterizations wereperformed on selected fractured specimens using standard metallographic techniques.
Keywords: Alloy 617; very high temperature gas-cooled reactor (VHTR); gas tungsten arc welding(GTAW); weldments; low cycle fatigue (LCF); fatigue life; fracture surface characterization
1. Introduction
The Next Generation Nuclear Plant (NGNP) being developed in the Republic of Korea is theVery High Temperature gas-cooled Reactor (VHTR). The VHTR merges the diversities of the baselinedesign to allow eventual operation at gas outlet temperatures up to 950 ˝C. In the VHTR, some ofthe major components such as the reactor internals, the reactor pressure vessel, the piping, the hotgas ducts (HGD), and the intermediate heat exchangers (IHX) are classified as key components,with helium as a primary and secondary coolant. The IHX performs the main purpose in theoperation of the NGNP, transferring heat from the primary reactor helium to an active workingfluid at a lower temperature. Leading materials of potential concern include nickel-base Alloy 800H,Alloy 617, Alloy 230, and Hastelloy X for the high temperature components. In the high temperaturedesign, creep and fatigue resistance, oxidation resistance, and phase stability need to be satisfied [1,2].Alloy 617, a nickel-base super alloy, is a leading candidate material for a VHTR because of its excellenthigh-temperature mechanical properties, formability, and weldability. Alloy 617 is strengthened bysolid solution hardening precipitates provided by the alloy chemical compositions of chromium,cobalt, and molybdenum, which are required for high temperature strength [3]. In Alloy 617, the hightemperature oxidation resistance is derived from the high nickel and chromium content. In addition,grain boundary strengthening takes place during the solidification process, with the aid of carbide
Metals 2016, 6, 178; doi:10.3390/met6080178 www.mdpi.com/journal/metals
Metals 2016, 6, 178 2 of 13
precipitates. Primary carbides, M6C, have a complex structure and they precipitate in a relativelyhigh temperature process. A more complex secondary carbide, M23C6, is suspected and mainly growsalong the grain boundary. These carbide precipitates are known to have a high content of chromium.They diffuse and form a depleted zone of a Cr-rich oxide layer on the outer surface, namely Cr2O3 [4].Consequently, the Alloy 617 is expected to provide good thermal stability for components of powergenerating plants with a high temperature strength up to 950 ˝C [5]. The IHX have to be joined topiping or other components by welding technique. Very high temperature deformation is expected tobe a predominant failure mechanism of the IHX, and thus, weldments used in its fabrication experiencevarying cyclic deformation and are a key element of all designs [6,7].
In an actual high temperature design evaluation, however, fatigue and creep damage are usuallymore critical than other design parameters. In this circumstance, the low cycle fatigue (LCF) loadingsrepresent a predominant failure mode from the temperature gradient induced thermal strain duringoperation as well as in the startups and shutdowns and in power transients or with temperature changeof the flowing coolant having a low loading rate [5–8]. Because of these shortcomings, significantconsideration of LCF behavior is needed in the design and life assessment of such componentsworking in high temperature conditions. The welded section material could be considerably affectedby the welding process which is responsible for heterogeneities. As such, the weldments are criticalconsiderations in the engineering design because they are the weakest links in the components andmay have some original defects. Experience with nickel alloy weldments in structural applicationssuggests that most cases of high temperature fatigue failures occur at the weldments or in the heataffected zone (HAZ) [6]. Although Alloy 617 has many superior properties, numerous researchershave reported that the fatigue life varies widely at high temperature and it is generally found that theweldment specimens have a lower fatigue life compared to the base metal, although only limited datawere available on the weldments material [5–11]. A draft Code Case was developed to qualify theAlloy 617 for nuclear service; the need for fatigue data, such as the influence of strain ranges, strain rate,and temperature at thermally induced strain rates in the IHX parent material and weldments materialis necessary to predict the lifetime of the reactor components. However, the behavior of Alloy 617weldments is not yet fully understood, and there remains a need for further experiments; a lot of dataneeds to be supplemented at very high temperatures due to the variability in the fatigue responseof the element parts of the weldments (i.e., weld, HAZ, and base metal) to confirm the suitability ofa baseline draft Code Case [6].
The aim of this work focuses on the understanding of the LCF behavior of Alloy 617 base metaland weldments, made from an automated gas tungsten arc welding (GTAW) process with Alloy 617filler wire. LCF tests have been carried out through a series of fully reversed strain-controls (strainratio, Rε = ´1) regarding to the four different total strain ranges, i.e., 0.6%, 0.9%, 1.2% and 1.5% ata high temperature of 900 ˝C in an air environment, in accordance with the ASTM Standard E606.The effect of very high temperature deformation behavior of Alloy 617 base metal and weldmentspecimens is comparatively investigated as a function of total strain range. The plastic deformationregarding stress response was reflected as damage accumulation in the structural material, and it couldbe correlated to the fatigue life of the material. An evaluation of LCF behavior data was performedusing the well-known relationship based on a Coffin-Manson relationship, and the material constantswere also determined. The LCF fracture surface microstructures were characterized on selectedfractured specimens, and thus, the microstructural changes under various conditions are also reportedquantitatively using standard metallographic techniques.
2. Materials and Experiments
A commercial grade Alloy 617 is approved for non-nuclear construction in the ASME Code.Thus the composition (wt %) of the Alloy 617 used for material chosen in this study is 53.11Ni, 22.2Cr,12.3Co, 9.5Mo, 1.06Al, 0.08C, 0.949Fe, 0.4Ti, 0.084Si, 0.029Mn, 0.027Cu, 0.003P, <0.002S, and <0.002B.The initial microstructure analysis of Alloy 617 was revealed in a previous study [2,6]. Alloy 617 has
Metals 2016, 6, 178 3 of 13
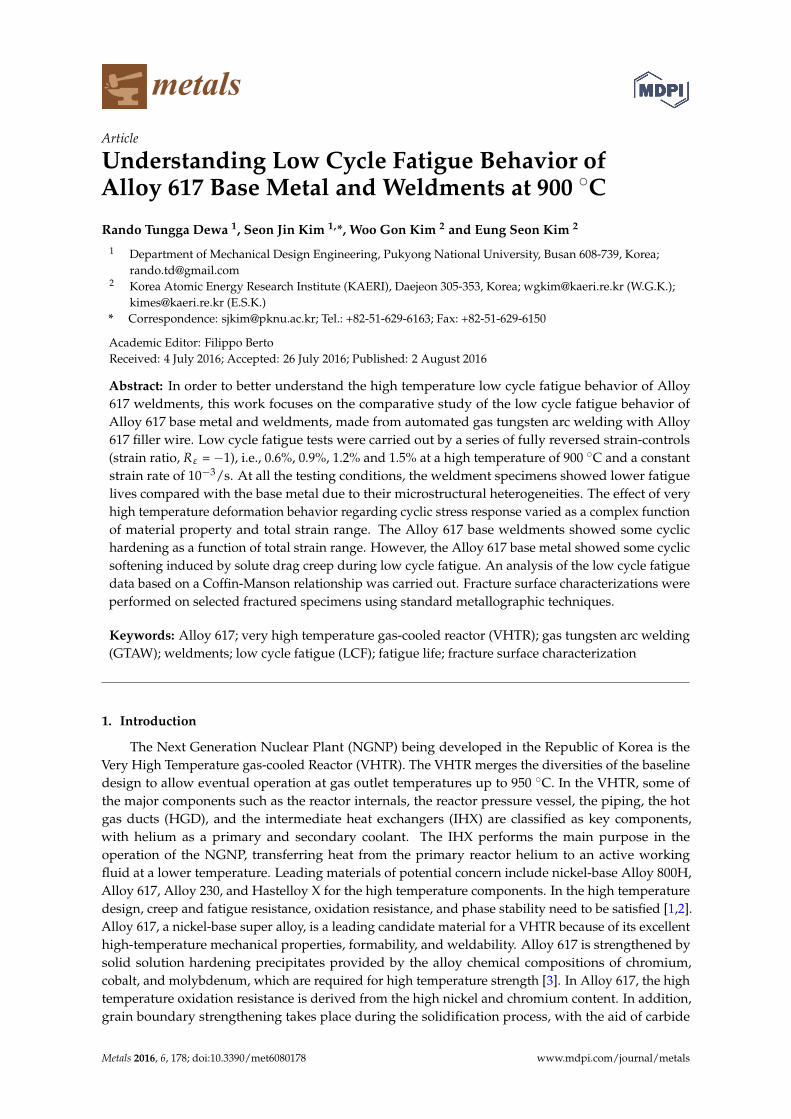
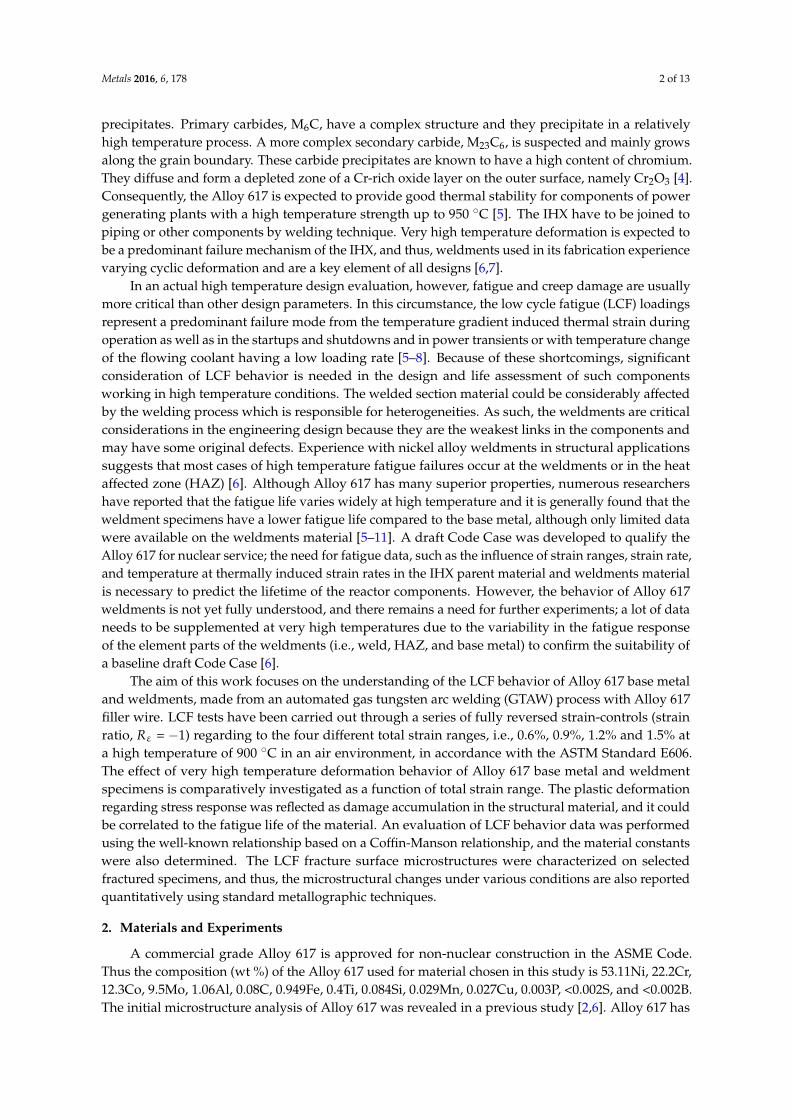
a fully austenitic face centred cubic (fcc) structure which maintains superior mechanical propertiesat high temperature. The fcc matrix, known as, γ, mainly consists of nickel, cobalt, iron, chromium,and molybdenum. Figure 1 shows the microstructure of the cross-section of a weld, the HAZ, and thebase region. However, the microstructure of the base metal with well-uniformed equiaxed grains isapproximately 100 µm in diameter. The weld region is comprised of austenitic large columnar grainswith a dendritic structure due to solidification during the welding process. As such, the HAZ of theweld was formed by carbide dissolution and a small amount of grain growth. Cylindrical specimenswith 6.0 mm in diameter in the reduced section with a parallel length of 18 mm and gauge lengthof 12 mm were used for the LCF test specimens. Low stress grinding and polishing were appliedin the final machining to avoid the formation of notches. LCF weldment specimens were machinedfrom weld pad in the transverse direction to the welding direction. Alloy 617 filler wire was usedwith a diameter of 2.4 mm. After the welding process, the soundness of the weldments was qualifiedthrough an ultrasonic test (UT), a tensile test, and a bending test. The bending testing results coincidewell with ASME specifications, which means the micro-crack is within 3.2 mm. It was also observedthat the weldments exhibited acceptable ductility. Nevertheless, the soundness of the weldments givesno indication of welding defects. The shape of the weld pad has a single V-groove with an angle of80˝ and 10 mm root gap from a 25 mm thick rolled plate. Figure 2 shows the shape and dimensionof the weld pad configuration and the schematic of weldment specimens used in this investigation.The gauge section of the weldment specimen mainly covers the weld and HAZ materials only.
Metals 2016, 6, 178 3 of 13
617 has a fully austenitic face centred cubic (fcc) structure which maintains superior mechanical
properties at high temperature. The fcc matrix, known as, γ, mainly consists of nickel, cobalt, iron,
chromium, and molybdenum. Figure 1 shows the microstructure of the cross‐section of a weld, the
HAZ, and the base region. However, the microstructure of the base metal with well‐uniformed
equiaxed grains is approximately 100 μm in diameter. The weld region is comprised of austenitic
large columnar grains with a dendritic structure due to solidification during the welding process. As
such, the HAZ of the weld was formed by carbide dissolution and a small amount of grain growth.
Cylindrical specimens with 6.0 mm in diameter in the reduced section with a parallel length of 18
mm and gauge length of 12 mm were used for the LCF test specimens. Low stress grinding and
polishing were applied in the final machining to avoid the formation of notches. LCF weldment
specimens were machined from weld pad in the transverse direction to the welding direction. Alloy
617 filler wire was used with a diameter of 2.4 mm. After the welding process, the soundness of the
weldments was qualified through an ultrasonic test (UT), a tensile test, and a bending test. The
bending testing results coincide well with ASME specifications, which means the micro‐crack is
within 3.2 mm. It was also observed that the weldments exhibited acceptable ductility. Nevertheless,
the soundness of the weldments gives no indication of welding defects. The shape of the weld pad
has a single V‐groove with an angle of 80° and 10 mm root gap from a 25 mm thick rolled plate.
Figure 2 shows the shape and dimension of the weld pad configuration and the schematic of
weldment specimens used in this investigation. The gauge section of the weldment specimen mainly
covers the weld and HAZ materials only.
Figure 1. Microstructure of the cross‐section of Weld‐Heat affected zone (HAZ)‐Base region.
(a) (b)
Figure 2. (a) The weld pad configuration; (b) The schematic of shape and dimension of the weldment
specimen (all dimensions are in millimeters).
A closed loop 100 kN servo hydraulic testing machine (MTS 370 Landmark, Eden Prairie, MN,
USA) was used and equipped with a tube furnace for heating the specimens of Alloy 617 base metal
and weldment in dry air, which ensured that the temperature remained within ±2 °C of the nominal
temperature throughout the test. The specimen was held at a target temperature with zero load for
about 30 min to allow temperatures to stabilize before the commencement of the test. A full‐scale
Figure 1. Microstructure of the cross-section of Weld-Heat affected zone (HAZ)-Base region.
Metals 2016, 6, 178 3 of 13
617 has a fully austenitic face centred cubic (fcc) structure which maintains superior mechanical
properties at high temperature. The fcc matrix, known as, γ, mainly consists of nickel, cobalt, iron,
chromium, and molybdenum. Figure 1 shows the microstructure of the cross‐section of a weld, the
HAZ, and the base region. However, the microstructure of the base metal with well‐uniformed
equiaxed grains is approximately 100 μm in diameter. The weld region is comprised of austenitic
large columnar grains with a dendritic structure due to solidification during the welding process. As
such, the HAZ of the weld was formed by carbide dissolution and a small amount of grain growth.
Cylindrical specimens with 6.0 mm in diameter in the reduced section with a parallel length of 18
mm and gauge length of 12 mm were used for the LCF test specimens. Low stress grinding and
polishing were applied in the final machining to avoid the formation of notches. LCF weldment
specimens were machined from weld pad in the transverse direction to the welding direction. Alloy
617 filler wire was used with a diameter of 2.4 mm. After the welding process, the soundness of the
weldments was qualified through an ultrasonic test (UT), a tensile test, and a bending test. The
bending testing results coincide well with ASME specifications, which means the micro‐crack is
within 3.2 mm. It was also observed that the weldments exhibited acceptable ductility. Nevertheless,
the soundness of the weldments gives no indication of welding defects. The shape of the weld pad
has a single V‐groove with an angle of 80° and 10 mm root gap from a 25 mm thick rolled plate.
Figure 2 shows the shape and dimension of the weld pad configuration and the schematic of
weldment specimens used in this investigation. The gauge section of the weldment specimen mainly
covers the weld and HAZ materials only.
Figure 1. Microstructure of the cross‐section of Weld‐Heat affected zone (HAZ)‐Base region.
(a) (b)
Figure 2. (a) The weld pad configuration; (b) The schematic of shape and dimension of the weldment
specimen (all dimensions are in millimeters).
A closed loop 100 kN servo hydraulic testing machine (MTS 370 Landmark, Eden Prairie, MN,
USA) was used and equipped with a tube furnace for heating the specimens of Alloy 617 base metal
and weldment in dry air, which ensured that the temperature remained within ±2 °C of the nominal
temperature throughout the test. The specimen was held at a target temperature with zero load for
about 30 min to allow temperatures to stabilize before the commencement of the test. A full‐scale
Figure 2. (a) The weld pad configuration; (b) The schematic of shape and dimension of the weldmentspecimen (all dimensions are in millimeters).
A closed loop 100 kN servo hydraulic testing machine (MTS 370 Landmark, Eden Prairie, MN,USA) was used and equipped with a tube furnace for heating the specimens of Alloy 617 basemetal and weldment in dry air, which ensured that the temperature remained within ˘2 ˝C of thenominal temperature throughout the test. The specimen was held at a target temperature with
Metals 2016, 6, 178 4 of 13
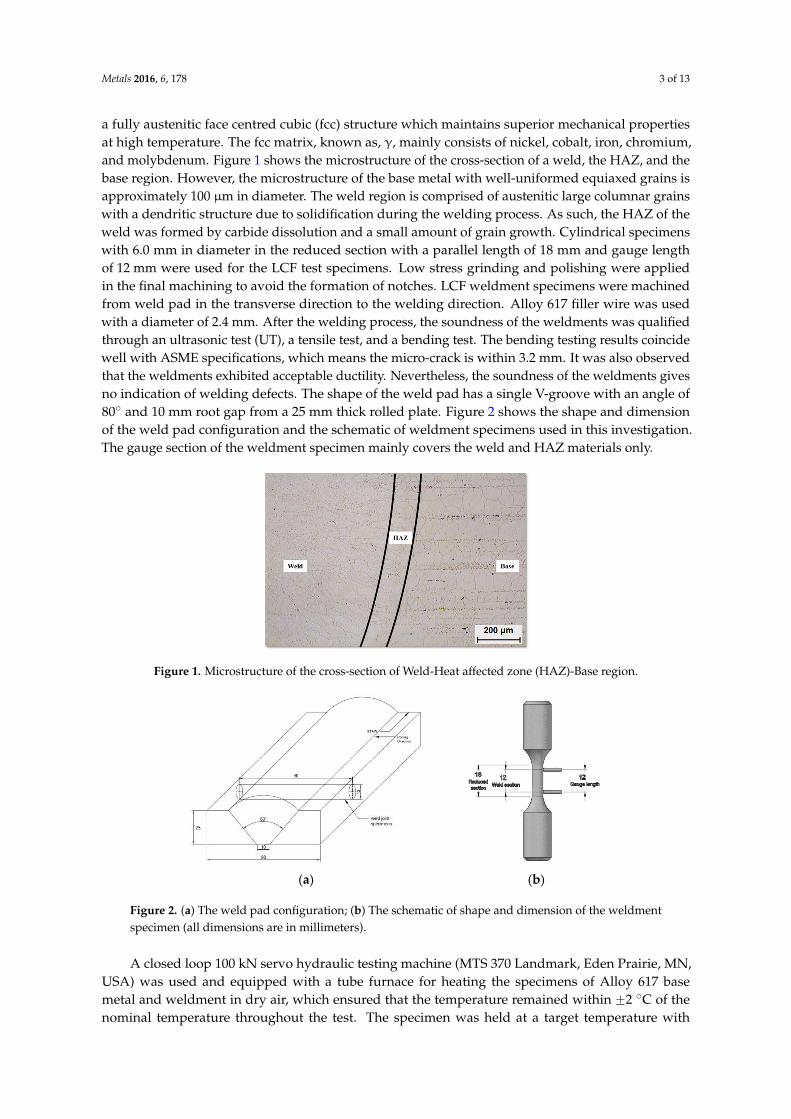
zero load for about 30 min to allow temperatures to stabilize before the commencement of the test.A full-scale photograph of the LCF testing apparatus is shown in Figure 3. We performed fullyreversed (strain ratio, Rε = ´1) axial strain controlled LCF tests of Alloy 617 base metal and weldmentspecimens at 900 ˝C regarding to the four different total strain ranges, i.e., 0.6%, 0.9%, 1.2% and1.5%. A triangular waveform and a constant strain rate of 10´3/s were applied. The failure criterionwas defined by the number of cycles which means a 20% reduction in the stress ratio (peak tensileover compressive stress ratio). In order to examine the LCF fracture morphologies, we characterizedthe post-fracture analysis of the selected specimens which split into two pieces in the preliminaryobservation using standard metallographic techniques. The fatigue specimens, cut around crackinitiation sites, were chemical-polished with a mixed solution of ethanol, hydrochloric acid, and copperII chloride. The characterization was carried out using a scanning electron microscopy (SEM HitachJEOL JSM 5610, JEOL Ltd., Tokyo, Japan) along with an energy dispersive X-ray (EDX, INCA Energy,Oxford Instruments Analytical, Halifax Road, UK) facility to determine the position of the crackinitiation site as well as an optical microscope (OM JP/GX51, Olympus Corp., Tokyo, Japan) to providean explanation of the LCF failure mechanism.
Metals 2016, 6, 178 4 of 13
photograph of the LCF testing apparatus is shown in Figure 3. We performed fully reversed (strain
ratio, Rε = −1) axial strain controlled LCF tests of Alloy 617 base metal and weldment specimens at
900°C regarding to the four different total strain ranges, i.e., 0.6%, 0.9%, 1.2% and 1.5%. A triangular
waveform and a constant strain rate of 10−3/s were applied. The failure criterion was defined by the
number of cycles which means a 20% reduction in the stress ratio (peak tensile over compressive
stress ratio). In order to examine the LCF fracture morphologies, we characterized the post‐fracture
analysis of the selected specimens which split into two pieces in the preliminary observation using
standard metallographic techniques. The fatigue specimens, cut around crack initiation sites, were
chemical‐polished with a mixed solution of ethanol, hydrochloric acid, and copper II chloride. The
characterization was carried out using a scanning electron microscopy (SEM Hitach JEOL JSM 5610,
JEOL Ltd., Tokyo, Japan) along with an energy dispersive X‐ray (EDX, INCA Energy, Oxford
Instruments Analytical, Halifax Road, UK) facility to determine the position of the crack initiation
site as well as an optical microscope (OM JP/GX51, Olympus Corp., Tokyo, Japan) to provide an
explanation of the LCF failure mechanism.
(a) (b)
Figure 3. (a) Full‐scale view of the low cycle fatigue (LCF) testing apparatus; (b) Photograph of the
view port during LCF testing.
3. Results and Analysis
3.1. Fatigue Life and Cyclic Stress Response Behavior
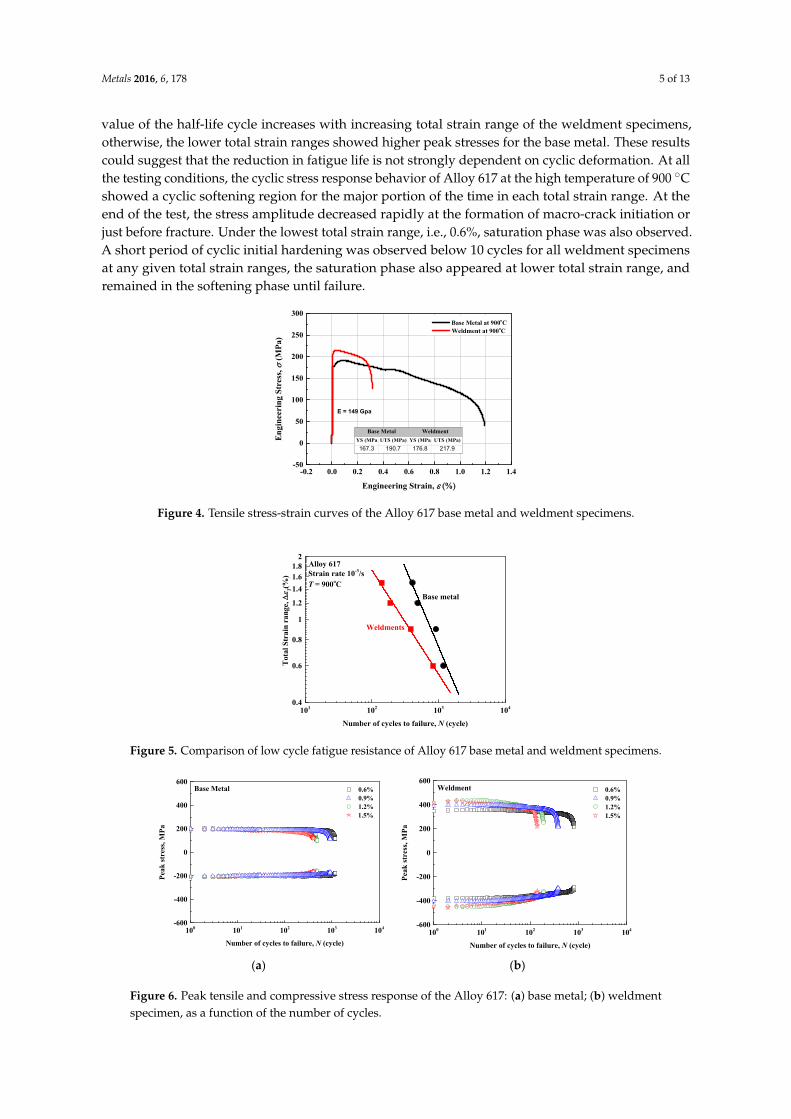
Figure 4 shows the tensile test results of the Alloy 617 base metal and weldment specimens.
Alloy 617 base metal and weldment specimens showed different characteristics of mechanical
properties as microstructural differences: As revealed in the previous study [2], the hardness value
of the HAZ and weldments had a higher value due to the austenitic phase with fine equiaxed
dendrites. It is noticeable that the Young’s modulus was similar for the Alloy 617 base metal and
weldment specimens, while the strength of the weldments was higher than the base metal, but with
a lower percentage of elongation. The higher strength of the weldment specimens could be
attributed to the austenitic nickel‐chromium morphology with a dendritic structure, and formation
of precipitates of the weldments in the solidification grain boundaries [4].
Figure 3. (a) Full-scale view of the low cycle fatigue (LCF) testing apparatus; (b) Photograph of theview port during LCF testing.
3. Results and Analysis
3.1. Fatigue Life and Cyclic Stress Response Behavior
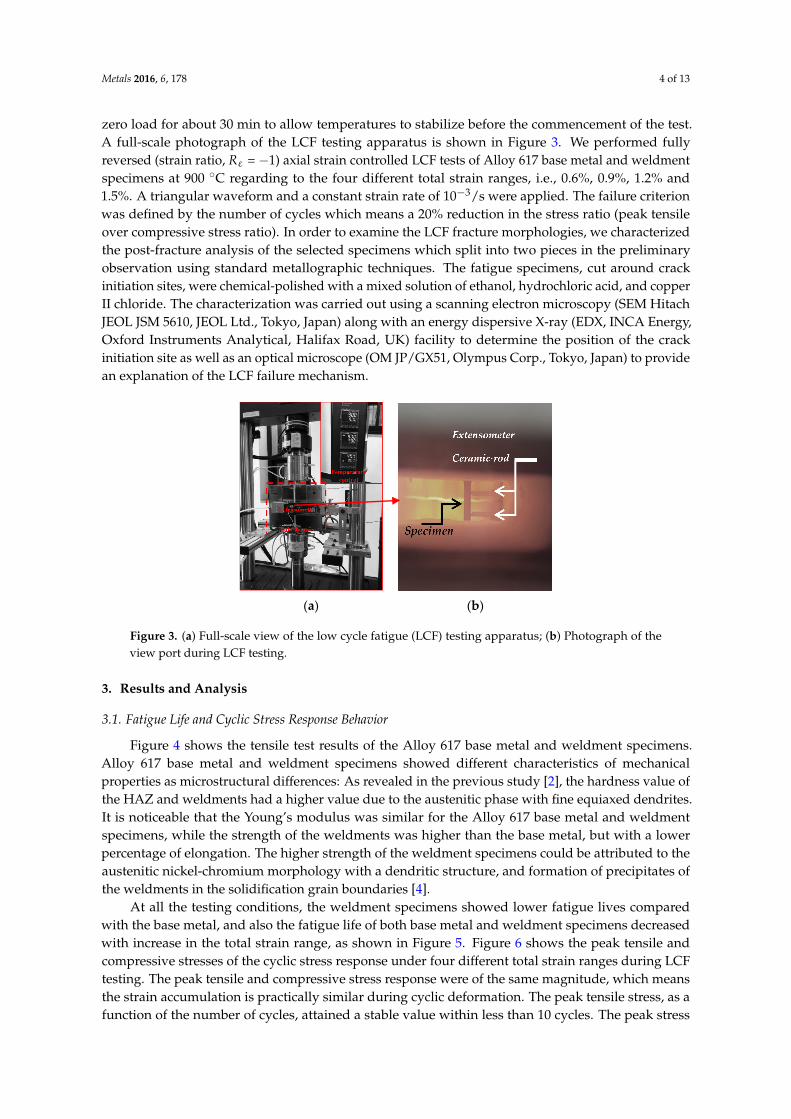
Figure 4 shows the tensile test results of the Alloy 617 base metal and weldment specimens.Alloy 617 base metal and weldment specimens showed different characteristics of mechanicalproperties as microstructural differences: As revealed in the previous study [2], the hardness value ofthe HAZ and weldments had a higher value due to the austenitic phase with fine equiaxed dendrites.It is noticeable that the Young’s modulus was similar for the Alloy 617 base metal and weldmentspecimens, while the strength of the weldments was higher than the base metal, but with a lowerpercentage of elongation. The higher strength of the weldment specimens could be attributed to theaustenitic nickel-chromium morphology with a dendritic structure, and formation of precipitates ofthe weldments in the solidification grain boundaries [4].
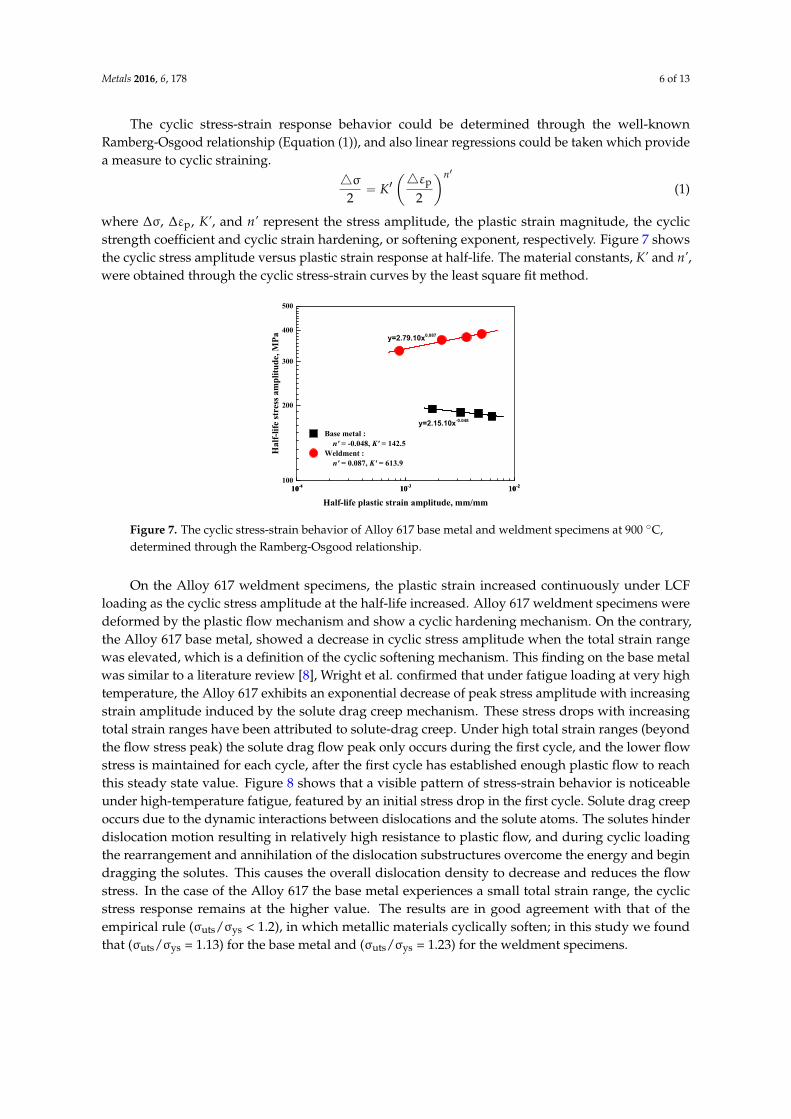
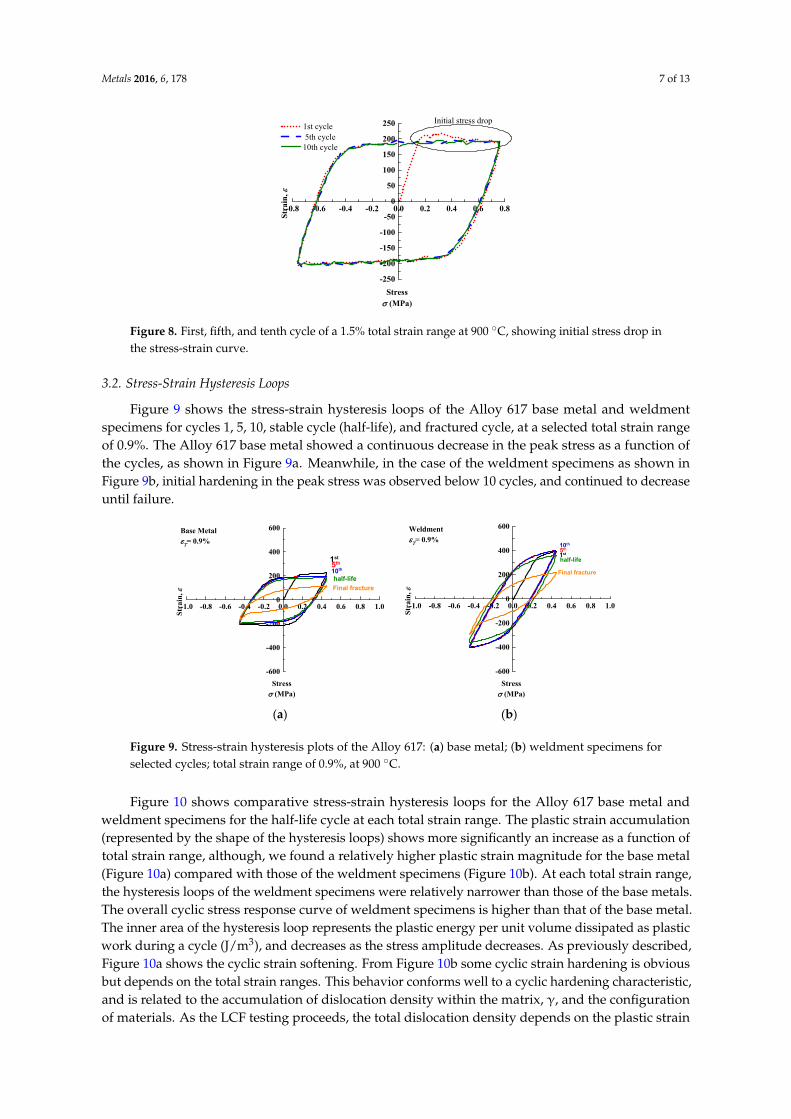
At all the testing conditions, the weldment specimens showed lower fatigue lives comparedwith the base metal, and also the fatigue life of both base metal and weldment specimens decreasedwith increase in the total strain range, as shown in Figure 5. Figure 6 shows the peak tensile andcompressive stresses of the cyclic stress response under four different total strain ranges during LCFtesting. The peak tensile and compressive stress response were of the same magnitude, which meansthe strain accumulation is practically similar during cyclic deformation. The peak tensile stress, as afunction of the number of cycles, attained a stable value within less than 10 cycles. The peak stress
Metals 2016, 6, 178 5 of 13
value of the half-life cycle increases with increasing total strain range of the weldment specimens,otherwise, the lower total strain ranges showed higher peak stresses for the base metal. These resultscould suggest that the reduction in fatigue life is not strongly dependent on cyclic deformation. At allthe testing conditions, the cyclic stress response behavior of Alloy 617 at the high temperature of 900 ˝Cshowed a cyclic softening region for the major portion of the time in each total strain range. At theend of the test, the stress amplitude decreased rapidly at the formation of macro-crack initiation orjust before fracture. Under the lowest total strain range, i.e., 0.6%, saturation phase was also observed.A short period of cyclic initial hardening was observed below 10 cycles for all weldment specimensat any given total strain ranges, the saturation phase also appeared at lower total strain range, andremained in the softening phase until failure.
Metals 2016, 6, 178 5 of 13
-0.2 0.0 0.2 0.4 0.6 0.8 1.0 1.2 1.4-50
0
50
100
150
200
250
300
Weldment at 900oC Base Metal at 900oC
En
gin
eeri
ng
Str
ess,
(M
Pa)
Engineering Strain,
E = 149 Gpa
Base Metal Weldment
YS (MPa UTS (MPa) YS (MPa UTS (MPa)
167.3 190.7 176.8 217.9
Figure 4. Tensile stress‐strain curves of the Alloy 617 base metal and weldment specimens.
At all the testing conditions, the weldment specimens showed lower fatigue lives compared
with the base metal, and also the fatigue life of both base metal and weldment specimens decreased
with increase in the total strain range, as shown in Figure 5. Figure 6 shows the peak tensile and
compressive stresses of the cyclic stress response under four different total strain ranges during LCF
testing. The peak tensile and compressive stress response were of the same magnitude, which means
the strain accumulation is practically similar during cyclic deformation. The peak tensile stress, as a
function of the number of cycles, attained a stable value within less than 10 cycles. The peak stress
value of the half‐life cycle increases with increasing total strain range of the weldment specimens,
otherwise, the lower total strain ranges showed higher peak stresses for the base metal. These results
could suggest that the reduction in fatigue life is not strongly dependent on cyclic deformation. At
all the testing conditions, the cyclic stress response behavior of Alloy 617 at the high temperature of
900 °C showed a cyclic softening region for the major portion of the time in each total strain range.
At the end of the test, the stress amplitude decreased rapidly at the formation of macro‐crack
initiation or just before fracture. Under the lowest total strain range, i.e., 0.6%, saturation phase was
also observed. A short period of cyclic initial hardening was observed below 10 cycles for all
weldment specimens at any given total strain ranges, the saturation phase also appeared at lower
total strain range, and remained in the softening phase until failure.
101 102 103 1040.4
0.6
0.8
1
1.2
1.4
1.61.8
2
Base metal
Tot
al S
trai
n ra
nge,
(%)
Number of cycles to failure, N (cycle)
Strain rate 10-3/sT = 900oC
Alloy 617
Weldments
Figure 5. Comparison of low cycle fatigue resistance of Alloy 617 base metal and weldment
specimens.
Figure 4. Tensile stress-strain curves of the Alloy 617 base metal and weldment specimens.
Metals 2016, 6, 178 5 of 13
-0.2 0.0 0.2 0.4 0.6 0.8 1.0 1.2 1.4-50
0
50
100
150
200
250
300
Weldment at 900oC Base Metal at 900oC
En
gin
eeri
ng
Str
ess,
(M
Pa)
Engineering Strain,
E = 149 Gpa
Base Metal Weldment
YS (MPa UTS (MPa) YS (MPa UTS (MPa)
167.3 190.7 176.8 217.9
Figure 4. Tensile stress‐strain curves of the Alloy 617 base metal and weldment specimens.
At all the testing conditions, the weldment specimens showed lower fatigue lives compared
with the base metal, and also the fatigue life of both base metal and weldment specimens decreased
with increase in the total strain range, as shown in Figure 5. Figure 6 shows the peak tensile and
compressive stresses of the cyclic stress response under four different total strain ranges during LCF
testing. The peak tensile and compressive stress response were of the same magnitude, which means
the strain accumulation is practically similar during cyclic deformation. The peak tensile stress, as a
function of the number of cycles, attained a stable value within less than 10 cycles. The peak stress
value of the half‐life cycle increases with increasing total strain range of the weldment specimens,
otherwise, the lower total strain ranges showed higher peak stresses for the base metal. These results
could suggest that the reduction in fatigue life is not strongly dependent on cyclic deformation. At
all the testing conditions, the cyclic stress response behavior of Alloy 617 at the high temperature of
900 °C showed a cyclic softening region for the major portion of the time in each total strain range.
At the end of the test, the stress amplitude decreased rapidly at the formation of macro‐crack
initiation or just before fracture. Under the lowest total strain range, i.e., 0.6%, saturation phase was
also observed. A short period of cyclic initial hardening was observed below 10 cycles for all
weldment specimens at any given total strain ranges, the saturation phase also appeared at lower
total strain range, and remained in the softening phase until failure.
101 102 103 1040.4
0.6
0.8
1
1.2
1.4
1.61.8
2
Base metal
Tot
al S
trai
n ra
nge,
(%)
Number of cycles to failure, N (cycle)
Strain rate 10-3/sT = 900oC
Alloy 617
Weldments
Figure 5. Comparison of low cycle fatigue resistance of Alloy 617 base metal and weldment
specimens.
Figure 5. Comparison of low cycle fatigue resistance of Alloy 617 base metal and weldment specimens.Metals 2016, 6, 178 6 of 13
100 101 102 103 104-600
-400
-200
0
200
400
600
Base Metal
Pea
k st
ress
, MP
a
Number of cycles to failure, N (cycle)
0.6% 0.9% 1.2% 1.5%
100 101 102 103 104-600
-400
-200
0
200
400
600
Weldment
Pea
k st
ress
, MP
a
Number of cycles to failure, N (cycle)
0.6% 0.9% 1.2% 1.5%
(a) (b)
Figure 6. Peak tensile and compressive stress response of the Alloy 617: (a) base metal; (b) weldment
specimen, as a function of the number of cycles.
The cyclic stress‐strain response behavior could be determined through the well‐known
Ramberg‐Osgood relationship (Equation 1), and also linear regressions could be taken which
provide a measure to cyclic straining.
ʹ
pεσ
ʹ2 2
n
K
(1)
where Δσ, Δεp, K’, and n’ represent the stress amplitude, the plastic strain magnitude, the cyclic
strength coefficient and cyclic strain hardening, or softening exponent, respectively. Figure 7 shows
the cyclic stress amplitude versus plastic strain response at half‐life. The material constants, K’ and
n’, were obtained through the cyclic stress‐strain curves by the least square fit method.
10-4 10-3 10-210-4 10-3 10-2100
200
300
400
500
y=2.79.10x0.087
y=2.15.10x-0.048
Base metal :n' = -0.048, K' = 142.5
Weldment :n' = 0.087, K' = 613.9
Hal
f-lif
e st
ress
am
plit
ude
, MP
a
Half-life plastic strain amplitude, mm/mm
Figure 7. The cyclic stress‐strain behavior of Alloy 617 base metal and weldment specimens at 900
°C, determined through the Ramberg‐Osgood relationship.
On the Alloy 617 weldment specimens, the plastic strain increased continuously under LCF
loading as the cyclic stress amplitude at the half‐life increased. Alloy 617 weldment specimens were
deformed by the plastic flow mechanism and show a cyclic hardening mechanism. On the contrary,
the Alloy 617 base metal, showed a decrease in cyclic stress amplitude when the total strain range
was elevated, which is a definition of the cyclic softening mechanism. This finding on the base metal
was similar to a literature review [8], Wright et al. confirmed that under fatigue loading at very high
temperature, the Alloy 617 exhibits an exponential decrease of peak stress amplitude with increasing
strain amplitude induced by the solute drag creep mechanism. These stress drops with increasing
total strain ranges have been attributed to solute‐drag creep. Under high total strain ranges (beyond
the flow stress peak) the solute drag flow peak only occurs during the first cycle, and the lower flow
Figure 6. Peak tensile and compressive stress response of the Alloy 617: (a) base metal; (b) weldmentspecimen, as a function of the number of cycles.
Metals 2016, 6, 178 6 of 13
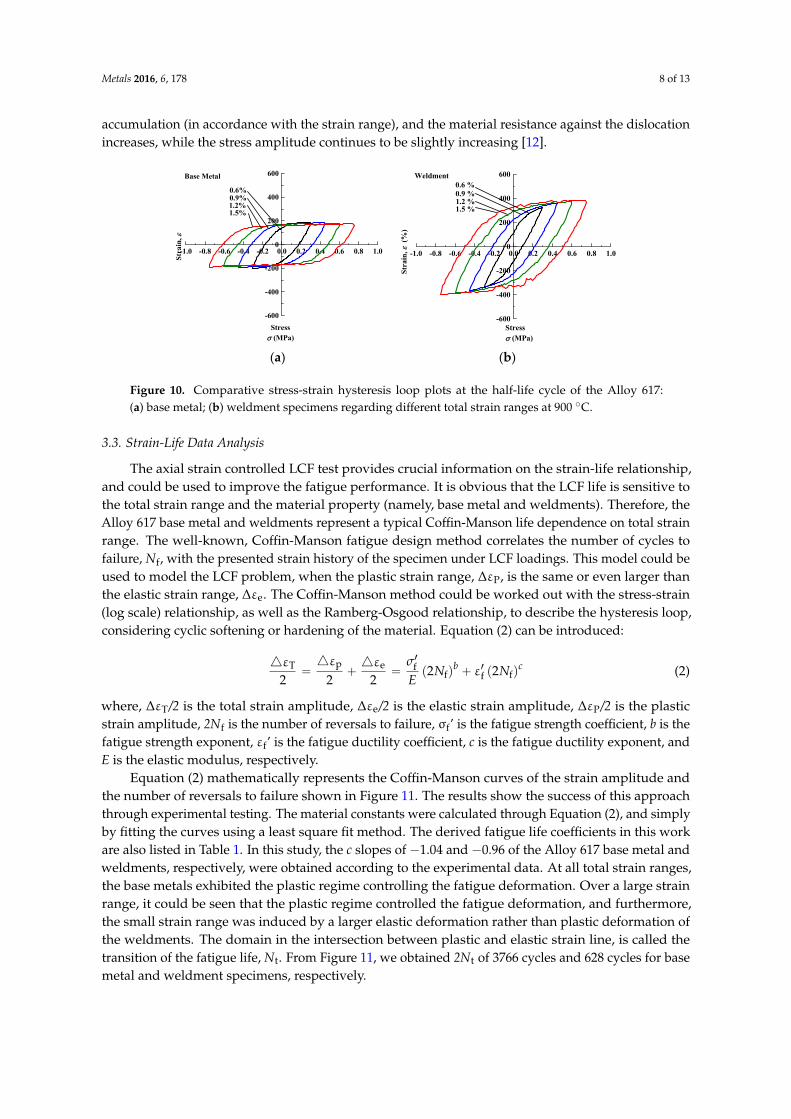
The cyclic stress-strain response behavior could be determined through the well-knownRamberg-Osgood relationship (Equation (1)), and also linear regressions could be taken which providea measure to cyclic straining.
4σ2“ K1
ˆ4εp
2
˙n1
(1)
where ∆σ, ∆εp, K’, and n’ represent the stress amplitude, the plastic strain magnitude, the cyclicstrength coefficient and cyclic strain hardening, or softening exponent, respectively. Figure 7 showsthe cyclic stress amplitude versus plastic strain response at half-life. The material constants, K’ and n’,were obtained through the cyclic stress-strain curves by the least square fit method.
Metals 2016, 6, 178 6 of 13
100 101 102 103 104-600
-400
-200
0
200
400
600
Base Metal
Pea
k st
ress
, MP
a
Number of cycles to failure, N (cycle)
0.6% 0.9% 1.2% 1.5%
100 101 102 103 104-600
-400
-200
0
200
400
600
Weldment
Pea
k st
ress
, MP
a
Number of cycles to failure, N (cycle)
0.6% 0.9% 1.2% 1.5%
(a) (b)
Figure 6. Peak tensile and compressive stress response of the Alloy 617: (a) base metal; (b) weldment
specimen, as a function of the number of cycles.
The cyclic stress‐strain response behavior could be determined through the well‐known
Ramberg‐Osgood relationship (Equation 1), and also linear regressions could be taken which
provide a measure to cyclic straining.
ʹ
pεσ
ʹ2 2
n
K
(1)
where Δσ, Δεp, K’, and n’ represent the stress amplitude, the plastic strain magnitude, the cyclic
strength coefficient and cyclic strain hardening, or softening exponent, respectively. Figure 7 shows
the cyclic stress amplitude versus plastic strain response at half‐life. The material constants, K’ and
n’, were obtained through the cyclic stress‐strain curves by the least square fit method.
10-4 10-3 10-210-4 10-3 10-2100
200
300
400
500
y=2.79.10x0.087
y=2.15.10x-0.048
Base metal :n' = -0.048, K' = 142.5
Weldment :n' = 0.087, K' = 613.9
Hal
f-lif
e st
ress
am
plit
ude
, MP
a
Half-life plastic strain amplitude, mm/mm
Figure 7. The cyclic stress‐strain behavior of Alloy 617 base metal and weldment specimens at 900
°C, determined through the Ramberg‐Osgood relationship.
On the Alloy 617 weldment specimens, the plastic strain increased continuously under LCF
loading as the cyclic stress amplitude at the half‐life increased. Alloy 617 weldment specimens were
deformed by the plastic flow mechanism and show a cyclic hardening mechanism. On the contrary,
the Alloy 617 base metal, showed a decrease in cyclic stress amplitude when the total strain range
was elevated, which is a definition of the cyclic softening mechanism. This finding on the base metal
was similar to a literature review [8], Wright et al. confirmed that under fatigue loading at very high
temperature, the Alloy 617 exhibits an exponential decrease of peak stress amplitude with increasing
strain amplitude induced by the solute drag creep mechanism. These stress drops with increasing
total strain ranges have been attributed to solute‐drag creep. Under high total strain ranges (beyond
the flow stress peak) the solute drag flow peak only occurs during the first cycle, and the lower flow
Figure 7. The cyclic stress-strain behavior of Alloy 617 base metal and weldment specimens at 900 ˝C,determined through the Ramberg-Osgood relationship.
On the Alloy 617 weldment specimens, the plastic strain increased continuously under LCFloading as the cyclic stress amplitude at the half-life increased. Alloy 617 weldment specimens weredeformed by the plastic flow mechanism and show a cyclic hardening mechanism. On the contrary,the Alloy 617 base metal, showed a decrease in cyclic stress amplitude when the total strain rangewas elevated, which is a definition of the cyclic softening mechanism. This finding on the base metalwas similar to a literature review [8], Wright et al. confirmed that under fatigue loading at very hightemperature, the Alloy 617 exhibits an exponential decrease of peak stress amplitude with increasingstrain amplitude induced by the solute drag creep mechanism. These stress drops with increasingtotal strain ranges have been attributed to solute-drag creep. Under high total strain ranges (beyondthe flow stress peak) the solute drag flow peak only occurs during the first cycle, and the lower flowstress is maintained for each cycle, after the first cycle has established enough plastic flow to reachthis steady state value. Figure 8 shows that a visible pattern of stress-strain behavior is noticeableunder high-temperature fatigue, featured by an initial stress drop in the first cycle. Solute drag creepoccurs due to the dynamic interactions between dislocations and the solute atoms. The solutes hinderdislocation motion resulting in relatively high resistance to plastic flow, and during cyclic loadingthe rearrangement and annihilation of the dislocation substructures overcome the energy and begindragging the solutes. This causes the overall dislocation density to decrease and reduces the flowstress. In the case of the Alloy 617 the base metal experiences a small total strain range, the cyclicstress response remains at the higher value. The results are in good agreement with that of theempirical rule (σuts/σys < 1.2), in which metallic materials cyclically soften; in this study we foundthat (σuts/σys = 1.13) for the base metal and (σuts/σys = 1.23) for the weldment specimens.
Metals 2016, 6, 178 7 of 13
Metals 2016, 6, 178 7 of 13
stress is maintained for each cycle, after the first cycle has established enough plastic flow to reach
this steady state value. Figure 8 shows that a visible pattern of stress‐strain behavior is noticeable
under high‐temperature fatigue, featured by an initial stress drop in the first cycle. Solute drag creep
occurs due to the dynamic interactions between dislocations and the solute atoms. The solutes
hinder dislocation motion resulting in relatively high resistance to plastic flow, and during cyclic
loading the rearrangement and annihilation of the dislocation substructures overcome the energy
and begin dragging the solutes. This causes the overall dislocation density to decrease and reduces
the flow stress. In the case of the Alloy 617 the base metal experiences a small total strain range, the
cyclic stress response remains at the higher value. The results are in good agreement with that of the
empirical rule (σuts/σys < 1.2), in which metallic materials cyclically soften; in this study we found that
(σuts/σys = 1.13) for the base metal and (σuts/σys = 1.23) for the weldment specimens.
-0.8 -0.6 -0.4 -0.2 0.0 0.2 0.4 0.6 0.8
-250
-200
-150
-100
-50
0
50
100
150
200
250 1st cycle 5th cycle 10th cycle
Str
ain
,
Stress (MPa)
Initial stress drop
Figure 8. First, fifth, and tenth cycle of a 1.5% total strain range at 900 °C, showing initial stress drop
in the stress‐strain curve.
3.2. Stress‐Strain Hysteresis Loops
Figure 9 shows the stress‐strain hysteresis loops of the Alloy 617 base metal and weldment
specimens for cycles 1, 5, 10, stable cycle (half‐life), and fractured cycle, at a selected total strain
range of 0.9%. The Alloy 617 base metal showed a continuous decrease in the peak stress as a
function of the cycles, as shown in Figure 9a. Meanwhile, in the case of the weldment specimens as
shown in Figure 9b, initial hardening in the peak stress was observed below 10 cycles, and continued
to decrease until failure.
-1.0 -0.8 -0.6 -0.4 -0.2 0.0 0.2 0.4 0.6 0.8 1.0
-600
-400
-200
0
200
400
600
Final fracture
half-life
5th
10th
1st
Str
ain
,
Base Metal= 0.9%
Stress (MPa)
-1.0 -0.8 -0.6 -0.4 -0.2 0.0 0.2 0.4 0.6 0.8 1.0
-600
-400
-200
0
200
400
600
Final fracture
half-life
10th
5th
Str
ain
,
Weldment= 0.9%
Stress (MPa)
1st
(a) (b)
Figure 9. Stress‐strain hysteresis plots of the Alloy 617: (a) base metal; (b) weldment specimens for
selected cycles; total strain range of 0.9%, at 900 °C.
Figure 10 shows comparative stress‐strain hysteresis loops for the Alloy 617 base metal and
weldment specimens for the half‐life cycle at each total strain range. The plastic strain accumulation
(represented by the shape of the hysteresis loops) shows more significantly an increase as a function
Figure 8. First, fifth, and tenth cycle of a 1.5% total strain range at 900 ˝C, showing initial stress drop inthe stress-strain curve.
3.2. Stress-Strain Hysteresis Loops
Figure 9 shows the stress-strain hysteresis loops of the Alloy 617 base metal and weldmentspecimens for cycles 1, 5, 10, stable cycle (half-life), and fractured cycle, at a selected total strain rangeof 0.9%. The Alloy 617 base metal showed a continuous decrease in the peak stress as a function ofthe cycles, as shown in Figure 9a. Meanwhile, in the case of the weldment specimens as shown inFigure 9b, initial hardening in the peak stress was observed below 10 cycles, and continued to decreaseuntil failure.
Metals 2016, 6, 178 7 of 13
stress is maintained for each cycle, after the first cycle has established enough plastic flow to reach
this steady state value. Figure 8 shows that a visible pattern of stress‐strain behavior is noticeable
under high‐temperature fatigue, featured by an initial stress drop in the first cycle. Solute drag creep
occurs due to the dynamic interactions between dislocations and the solute atoms. The solutes
hinder dislocation motion resulting in relatively high resistance to plastic flow, and during cyclic
loading the rearrangement and annihilation of the dislocation substructures overcome the energy
and begin dragging the solutes. This causes the overall dislocation density to decrease and reduces
the flow stress. In the case of the Alloy 617 the base metal experiences a small total strain range, the
cyclic stress response remains at the higher value. The results are in good agreement with that of the
empirical rule (σuts/σys < 1.2), in which metallic materials cyclically soften; in this study we found that
(σuts/σys = 1.13) for the base metal and (σuts/σys = 1.23) for the weldment specimens.
-0.8 -0.6 -0.4 -0.2 0.0 0.2 0.4 0.6 0.8
-250
-200
-150
-100
-50
0
50
100
150
200
250 1st cycle 5th cycle 10th cycle
Str
ain
,
Stress (MPa)
Initial stress drop
Figure 8. First, fifth, and tenth cycle of a 1.5% total strain range at 900 °C, showing initial stress drop
in the stress‐strain curve.
3.2. Stress‐Strain Hysteresis Loops
Figure 9 shows the stress‐strain hysteresis loops of the Alloy 617 base metal and weldment
specimens for cycles 1, 5, 10, stable cycle (half‐life), and fractured cycle, at a selected total strain
range of 0.9%. The Alloy 617 base metal showed a continuous decrease in the peak stress as a
function of the cycles, as shown in Figure 9a. Meanwhile, in the case of the weldment specimens as
shown in Figure 9b, initial hardening in the peak stress was observed below 10 cycles, and continued
to decrease until failure.
-1.0 -0.8 -0.6 -0.4 -0.2 0.0 0.2 0.4 0.6 0.8 1.0
-600
-400
-200
0
200
400
600
Final fracture
half-life
5th
10th
1st
Str
ain
,
Base Metal= 0.9%
Stress (MPa)
-1.0 -0.8 -0.6 -0.4 -0.2 0.0 0.2 0.4 0.6 0.8 1.0
-600
-400
-200
0
200
400
600
Final fracture
half-life
10th
5th
Str
ain
,
Weldment= 0.9%
Stress (MPa)
1st
(a) (b)
Figure 9. Stress‐strain hysteresis plots of the Alloy 617: (a) base metal; (b) weldment specimens for
selected cycles; total strain range of 0.9%, at 900 °C.
Figure 10 shows comparative stress‐strain hysteresis loops for the Alloy 617 base metal and
weldment specimens for the half‐life cycle at each total strain range. The plastic strain accumulation
(represented by the shape of the hysteresis loops) shows more significantly an increase as a function
Figure 9. Stress-strain hysteresis plots of the Alloy 617: (a) base metal; (b) weldment specimens forselected cycles; total strain range of 0.9%, at 900 ˝C.
Figure 10 shows comparative stress-strain hysteresis loops for the Alloy 617 base metal andweldment specimens for the half-life cycle at each total strain range. The plastic strain accumulation(represented by the shape of the hysteresis loops) shows more significantly an increase as a function oftotal strain range, although, we found a relatively higher plastic strain magnitude for the base metal(Figure 10a) compared with those of the weldment specimens (Figure 10b). At each total strain range,the hysteresis loops of the weldment specimens were relatively narrower than those of the base metals.The overall cyclic stress response curve of weldment specimens is higher than that of the base metal.The inner area of the hysteresis loop represents the plastic energy per unit volume dissipated as plasticwork during a cycle (J/m3), and decreases as the stress amplitude decreases. As previously described,Figure 10a shows the cyclic strain softening. From Figure 10b some cyclic strain hardening is obviousbut depends on the total strain ranges. This behavior conforms well to a cyclic hardening characteristic,and is related to the accumulation of dislocation density within the matrix, γ, and the configurationof materials. As the LCF testing proceeds, the total dislocation density depends on the plastic strain
Metals 2016, 6, 178 8 of 13
accumulation (in accordance with the strain range), and the material resistance against the dislocationincreases, while the stress amplitude continues to be slightly increasing [12].
Metals 2016, 6, 178 8 of 13
of total strain range, although, we found a relatively higher plastic strain magnitude for the base
metal (Figure 10a) compared with those of the weldment specimens (Figure 10b). At each total strain
range, the hysteresis loops of the weldment specimens were relatively narrower than those of the
base metals. The overall cyclic stress response curve of weldment specimens is higher than that of
the base metal. The inner area of the hysteresis loop represents the plastic energy per unit volume
dissipated as plastic work during a cycle (J/m3), and decreases as the stress amplitude decreases. As
previously described, Figure 10a shows the cyclic strain softening. From Figure 10b some cyclic
strain hardening is obvious but depends on the total strain ranges. This behavior conforms well to a
cyclic hardening characteristic, and is related to the accumulation of dislocation density within the
matrix, γ, and the configuration of materials. As the LCF testing proceeds, the total dislocation
density depends on the plastic strain accumulation (in accordance with the strain range), and the
material resistance against the dislocation increases, while the stress amplitude continues to be
slightly increasing [12].
-1.0 -0.8 -0.6 -0.4 -0.2 0.0 0.2 0.4 0.6 0.8 1.0
-600
-400
-200
0
200
400
600
1.5%
Str
ain
,
Base Metal
Stress (MPa)
0.9%1.2%
0.6%
-1.0 -0.8 -0.6 -0.4 -0.2 0.0 0.2 0.4 0.6 0.8 1.0
-600
-400
-200
0
200
400
600
1.5 %1.2 %0.9 %0.6 %
Str
ain
, (
%)
Stress (MPa)
Weldment
(a) (b)
Figure 10. Comparative stress‐strain hysteresis loop plots at the half‐life cycle of the Alloy 617:
(a) base metal; (b) weldment specimens regarding different total strain ranges at 900 °C.
3.3. Strain‐Life Data Analysis
The axial strain controlled LCF test provides crucial information on the strain‐life relationship,
and could be used to improve the fatigue performance. It is obvious that the LCF life is sensitive to
the total strain range and the material property (namely, base metal and weldments). Therefore, the
Alloy 617 base metal and weldments represent a typical Coffin‐Manson life dependence on total
strain range. The well‐known, Coffin‐Manson fatigue design method correlates the number of cycles
to failure, Nf, with the presented strain history of the specimen under LCF loadings. This model
could be used to model the LCF problem, when the plastic strain range, ΔεP, is the same or even
larger than the elastic strain range, Δεe. The Coffin‐Manson method could be worked out with the
stress‐strain (log scale) relationship, as well as the Ramberg‐Osgood relationship, to describe the
hysteresis loop, considering cyclic softening or hardening of the material. Equation (2) can be
introduced:
p eT ff f f
ε εε ʹ2 ε ʹ 2
2 2 2
b cN N
E
(2)
where, ΔεT/2 is the total strain amplitude, Δεe/2 is the elastic strain amplitude, ΔεP/2 is the plastic
strain amplitude, 2Nf is the number of reversals to failure, σf’ is the fatigue strength coefficient, b is
the fatigue strength exponent, εf’ is the fatigue ductility coefficient, c is the fatigue ductility
exponent, and E is the elastic modulus, respectively.
Equation (2) mathematically represents the Coffin‐Manson curves of the strain amplitude and
the number of reversals to failure shown in Figure 11. The results show the success of this approach
through experimental testing. The material constants were calculated through Equation (2), and
simply by fitting the curves using a least square fit method. The derived fatigue life coefficients in
Figure 10. Comparative stress-strain hysteresis loop plots at the half-life cycle of the Alloy 617:(a) base metal; (b) weldment specimens regarding different total strain ranges at 900 ˝C.
3.3. Strain-Life Data Analysis
The axial strain controlled LCF test provides crucial information on the strain-life relationship,and could be used to improve the fatigue performance. It is obvious that the LCF life is sensitive tothe total strain range and the material property (namely, base metal and weldments). Therefore, theAlloy 617 base metal and weldments represent a typical Coffin-Manson life dependence on total strainrange. The well-known, Coffin-Manson fatigue design method correlates the number of cycles tofailure, Nf, with the presented strain history of the specimen under LCF loadings. This model could beused to model the LCF problem, when the plastic strain range, ∆εP, is the same or even larger thanthe elastic strain range, ∆εe. The Coffin-Manson method could be worked out with the stress-strain(log scale) relationship, as well as the Ramberg-Osgood relationship, to describe the hysteresis loop,considering cyclic softening or hardening of the material. Equation (2) can be introduced:
4εT
2“
4εp
2`
4εe
2“
σ1fEp2Nfq
b` ε1f p2Nfq
c (2)
where, ∆εT/2 is the total strain amplitude, ∆εe/2 is the elastic strain amplitude, ∆εP/2 is the plasticstrain amplitude, 2Nf is the number of reversals to failure, σf’ is the fatigue strength coefficient, b is thefatigue strength exponent, εf’ is the fatigue ductility coefficient, c is the fatigue ductility exponent, andE is the elastic modulus, respectively.
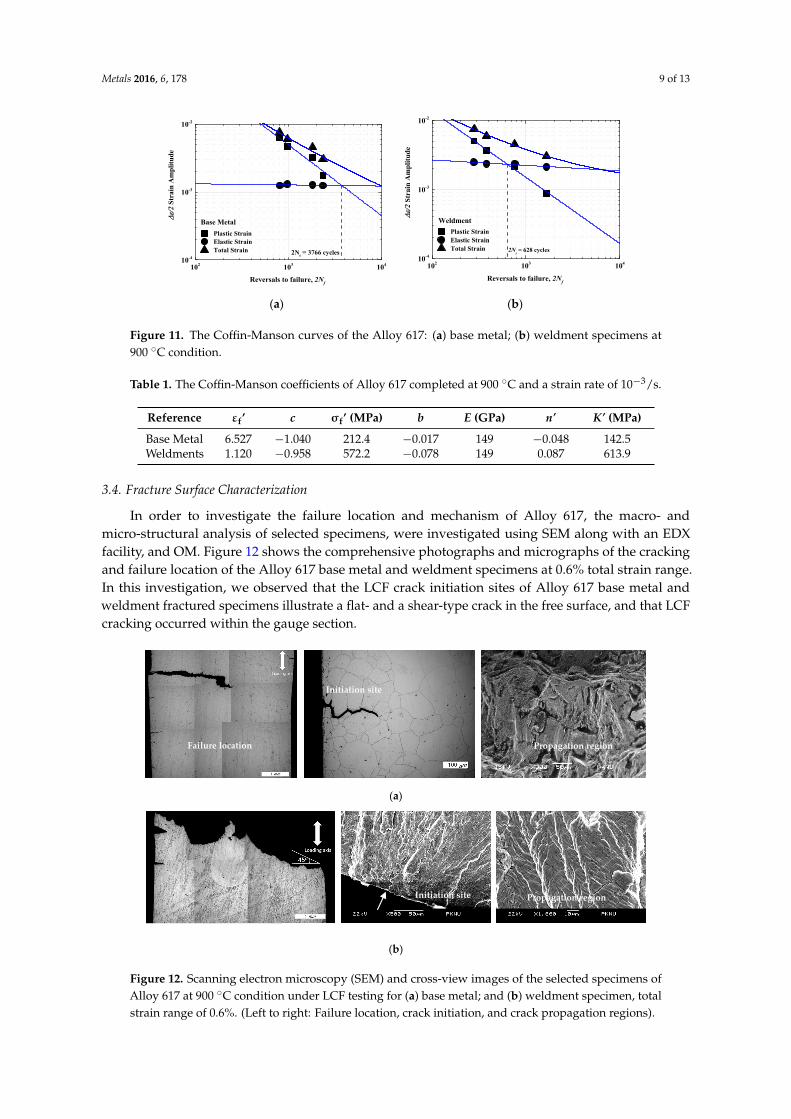
Equation (2) mathematically represents the Coffin-Manson curves of the strain amplitude andthe number of reversals to failure shown in Figure 11. The results show the success of this approachthrough experimental testing. The material constants were calculated through Equation (2), and simplyby fitting the curves using a least square fit method. The derived fatigue life coefficients in this workare also listed in Table 1. In this study, the c slopes of ´1.04 and ´0.96 of the Alloy 617 base metal andweldments, respectively, were obtained according to the experimental data. At all total strain ranges,the base metals exhibited the plastic regime controlling the fatigue deformation. Over a large strainrange, it could be seen that the plastic regime controlled the fatigue deformation, and furthermore,the small strain range was induced by a larger elastic deformation rather than plastic deformation ofthe weldments. The domain in the intersection between plastic and elastic strain line, is called thetransition of the fatigue life, Nt. From Figure 11, we obtained 2Nt of 3766 cycles and 628 cycles for basemetal and weldment specimens, respectively.
Metals 2016, 6, 178 9 of 13
Metals 2016, 6, 178 9 of 13
this work are also listed in Table 1. In this study, the c slopes of −1.04 and −0.96 of the Alloy 617 base
metal and weldments, respectively, were obtained according to the experimental data. At all total
strain ranges, the base metals exhibited the plastic regime controlling the fatigue deformation. Over
a large strain range, it could be seen that the plastic regime controlled the fatigue deformation, and
furthermore, the small strain range was induced by a larger elastic deformation rather than plastic
deformation of the weldments. The domain in the intersection between plastic and elastic strain line,
is called the transition of the fatigue life, Nt. From Figure 11, we obtained 2Nt of 3766 cycles and
628 cycles for base metal and weldment specimens, respectively.
Table 1. The Coffin‐Manson coefficients of Alloy 617 completed at 900 °C and a strain rate of 10−3/s.
Reference εfʹ c σfʹ (MPa) b E (GPa) n‘ K‘ (MPa)
Base Metal 6.527 −1.040 212.4 −0.017 149 −0.048 142.5
Weldments 1.120 −0.958 572.2 −0.078 149 0.087 613.9
102 103 10410-4
10-3
10-2
Plastic Strain Elastic Strain Total Strain
/2
Str
ain
Am
pli
tude
Reversals to failure, 2Nf
Base Metal
2Nt = 3766 cycles
102 103 10410-4
10-3
10-2
Plastic Strain Elastic Strain Total Strain
/2
Str
ain
Am
plit
ud
e
Reversals to failure, 2Nf
Weldment
2Nt = 628 cycles
(a) (b)
Figure 11. The Coffin‐Manson curves of the Alloy 617: (a) base metal; (b) weldment specimens at 900
°C condition.
3.4. Fracture Surface Characterization
In order to investigate the failure location and mechanism of Alloy 617, the macro‐ and
micro‐structural analysis of selected specimens, were investigated using SEM along with an EDX
facility, and OM. Figure 12 shows the comprehensive photographs and micrographs of the cracking
and failure location of the Alloy 617 base metal and weldment specimens at 0.6% total strain range.
In this investigation, we observed that the LCF crack initiation sites of Alloy 617 base metal and
weldment fractured specimens illustrate a flat‐ and a shear‐type crack in the free surface, and that
LCF cracking occurred within the gauge section.
From Figure 12a, it can be seen that the crack initiation site proceeded in the free surface
through intergranular crack initiation resulting from oxidation of surface connected grain
boundaries. It was found that the major role of reduction in the fatigue life of Alloy 617 base metal
was probably generated from surface carbide oxidation. The LCF failure mechanism on the crack
propagation as a result of the slip band containing extrusions and intrusions led to the propagation
of a transgranular nature within the grain on the specimen surface, and finally at the critical stage,
the primary crack is just about to fail. The LCF resistance of Alloy 617 is not affected by the
intergranular creep damage mechanism. The strengthening of carbides creates a barrier to prevent
intergranular creep crack by hindering grain boundary sliding and avoiding the concentration of
stress. All of the base metal primary crack mechanism propagated in a transgranular nature with
some quasi cleavage‐facets and secondary cracks due to higher ductility of grain boundary carbides.
Figure 11. The Coffin-Manson curves of the Alloy 617: (a) base metal; (b) weldment specimens at900 ˝C condition.
Table 1. The Coffin-Manson coefficients of Alloy 617 completed at 900 ˝C and a strain rate of 10´3/s.
Reference εf’ c σf’ (MPa) b E (GPa) n’ K’ (MPa)
Base Metal 6.527 ´1.040 212.4 ´0.017 149 ´0.048 142.5Weldments 1.120 ´0.958 572.2 ´0.078 149 0.087 613.9
3.4. Fracture Surface Characterization
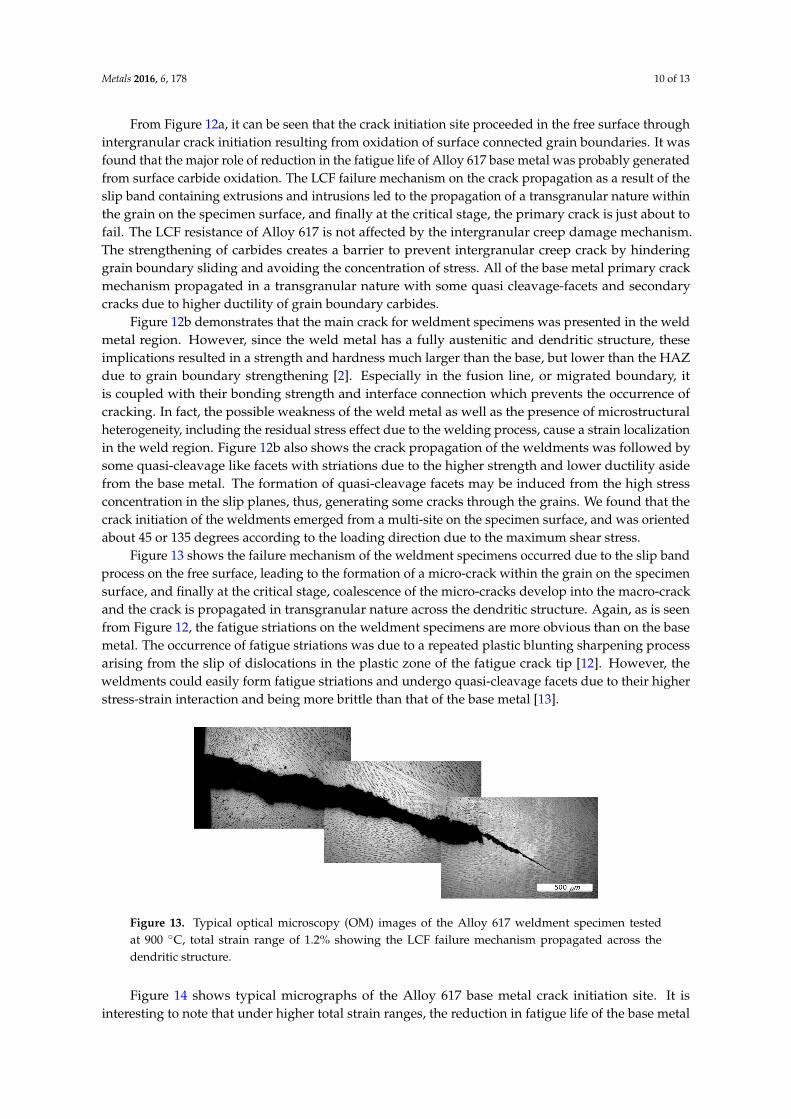
In order to investigate the failure location and mechanism of Alloy 617, the macro- andmicro-structural analysis of selected specimens, were investigated using SEM along with an EDXfacility, and OM. Figure 12 shows the comprehensive photographs and micrographs of the crackingand failure location of the Alloy 617 base metal and weldment specimens at 0.6% total strain range.In this investigation, we observed that the LCF crack initiation sites of Alloy 617 base metal andweldment fractured specimens illustrate a flat- and a shear-type crack in the free surface, and that LCFcracking occurred within the gauge section.
Metals 2016, 6, 178 10 of 13
(a)
(b)
Figure 12. Scanning electron microscopy (SEM) and cross‐view images of the selected specimens of
Alloy 617 at 900 °C condition under LCF testing for (a) base metal; and (b) weldment specimen, total
strain range of 0.6%. (Left to right: Failure location, crack initiation, and crack propagation regions).
Figure 12b demonstrates that the main crack for weldment specimens was presented in the
weld metal region. However, since the weld metal has a fully austenitic and dendritic structure,
these implications resulted in a strength and hardness much larger than the base, but lower than the
HAZ due to grain boundary strengthening [2]. Especially in the fusion line, or migrated boundary, it
is coupled with their bonding strength and interface connection which prevents the occurrence of
cracking. In fact, the possible weakness of the weld metal as well as the presence of microstructural
heterogeneity, including the residual stress effect due to the welding process, cause a strain
localization in the weld region. Figure 12b also shows the crack propagation of the weldments was
followed by some quasi‐cleavage like facets with striations due to the higher strength and lower
ductility aside from the base metal. The formation of quasi‐cleavage facets may be induced from the
high stress concentration in the slip planes, thus, generating some cracks through the grains. We
found that the crack initiation of the weldments emerged from a multi‐site on the specimen surface,
and was oriented about 45 or 135 degrees according to the loading direction due to the maximum
shear stress.
Figure 13. Typical optical microscopy (OM) images of the Alloy 617 weldment specimen tested at 900
°C, total strain range of 1.2% showing the LCF failure mechanism propagated across the dendritic
structure.
Initiation site
Failure location Propagation region
Initiation site Propagation region
Figure 12. Scanning electron microscopy (SEM) and cross-view images of the selected specimens ofAlloy 617 at 900 ˝C condition under LCF testing for (a) base metal; and (b) weldment specimen, totalstrain range of 0.6%. (Left to right: Failure location, crack initiation, and crack propagation regions).
Metals 2016, 6, 178 10 of 13
From Figure 12a, it can be seen that the crack initiation site proceeded in the free surface throughintergranular crack initiation resulting from oxidation of surface connected grain boundaries. It wasfound that the major role of reduction in the fatigue life of Alloy 617 base metal was probably generatedfrom surface carbide oxidation. The LCF failure mechanism on the crack propagation as a result of theslip band containing extrusions and intrusions led to the propagation of a transgranular nature withinthe grain on the specimen surface, and finally at the critical stage, the primary crack is just about tofail. The LCF resistance of Alloy 617 is not affected by the intergranular creep damage mechanism.The strengthening of carbides creates a barrier to prevent intergranular creep crack by hinderinggrain boundary sliding and avoiding the concentration of stress. All of the base metal primary crackmechanism propagated in a transgranular nature with some quasi cleavage-facets and secondarycracks due to higher ductility of grain boundary carbides.
Figure 12b demonstrates that the main crack for weldment specimens was presented in the weldmetal region. However, since the weld metal has a fully austenitic and dendritic structure, theseimplications resulted in a strength and hardness much larger than the base, but lower than the HAZdue to grain boundary strengthening [2]. Especially in the fusion line, or migrated boundary, itis coupled with their bonding strength and interface connection which prevents the occurrence ofcracking. In fact, the possible weakness of the weld metal as well as the presence of microstructuralheterogeneity, including the residual stress effect due to the welding process, cause a strain localizationin the weld region. Figure 12b also shows the crack propagation of the weldments was followed bysome quasi-cleavage like facets with striations due to the higher strength and lower ductility asidefrom the base metal. The formation of quasi-cleavage facets may be induced from the high stressconcentration in the slip planes, thus, generating some cracks through the grains. We found that thecrack initiation of the weldments emerged from a multi-site on the specimen surface, and was orientedabout 45 or 135 degrees according to the loading direction due to the maximum shear stress.
Figure 13 shows the failure mechanism of the weldment specimens occurred due to the slip bandprocess on the free surface, leading to the formation of a micro-crack within the grain on the specimensurface, and finally at the critical stage, coalescence of the micro-cracks develop into the macro-crackand the crack is propagated in transgranular nature across the dendritic structure. Again, as is seenfrom Figure 12, the fatigue striations on the weldment specimens are more obvious than on the basemetal. The occurrence of fatigue striations was due to a repeated plastic blunting sharpening processarising from the slip of dislocations in the plastic zone of the fatigue crack tip [12]. However, theweldments could easily form fatigue striations and undergo quasi-cleavage facets due to their higherstress-strain interaction and being more brittle than that of the base metal [13].
Metals 2016, 6, 178 10 of 13
(a)
(b)
Figure 12. Scanning electron microscopy (SEM) and cross‐view images of the selected specimens of
Alloy 617 at 900 °C condition under LCF testing for (a) base metal; and (b) weldment specimen, total
strain range of 0.6%. (Left to right: Failure location, crack initiation, and crack propagation regions).
Figure 12b demonstrates that the main crack for weldment specimens was presented in the
weld metal region. However, since the weld metal has a fully austenitic and dendritic structure,
these implications resulted in a strength and hardness much larger than the base, but lower than the
HAZ due to grain boundary strengthening [2]. Especially in the fusion line, or migrated boundary, it
is coupled with their bonding strength and interface connection which prevents the occurrence of
cracking. In fact, the possible weakness of the weld metal as well as the presence of microstructural
heterogeneity, including the residual stress effect due to the welding process, cause a strain
localization in the weld region. Figure 12b also shows the crack propagation of the weldments was
followed by some quasi‐cleavage like facets with striations due to the higher strength and lower
ductility aside from the base metal. The formation of quasi‐cleavage facets may be induced from the
high stress concentration in the slip planes, thus, generating some cracks through the grains. We
found that the crack initiation of the weldments emerged from a multi‐site on the specimen surface,
and was oriented about 45 or 135 degrees according to the loading direction due to the maximum
shear stress.
Figure 13. Typical optical microscopy (OM) images of the Alloy 617 weldment specimen tested at 900
°C, total strain range of 1.2% showing the LCF failure mechanism propagated across the dendritic
structure.
Initiation site
Failure location Propagation region
Initiation site Propagation region
Figure 13. Typical optical microscopy (OM) images of the Alloy 617 weldment specimen testedat 900 ˝C, total strain range of 1.2% showing the LCF failure mechanism propagated across thedendritic structure.
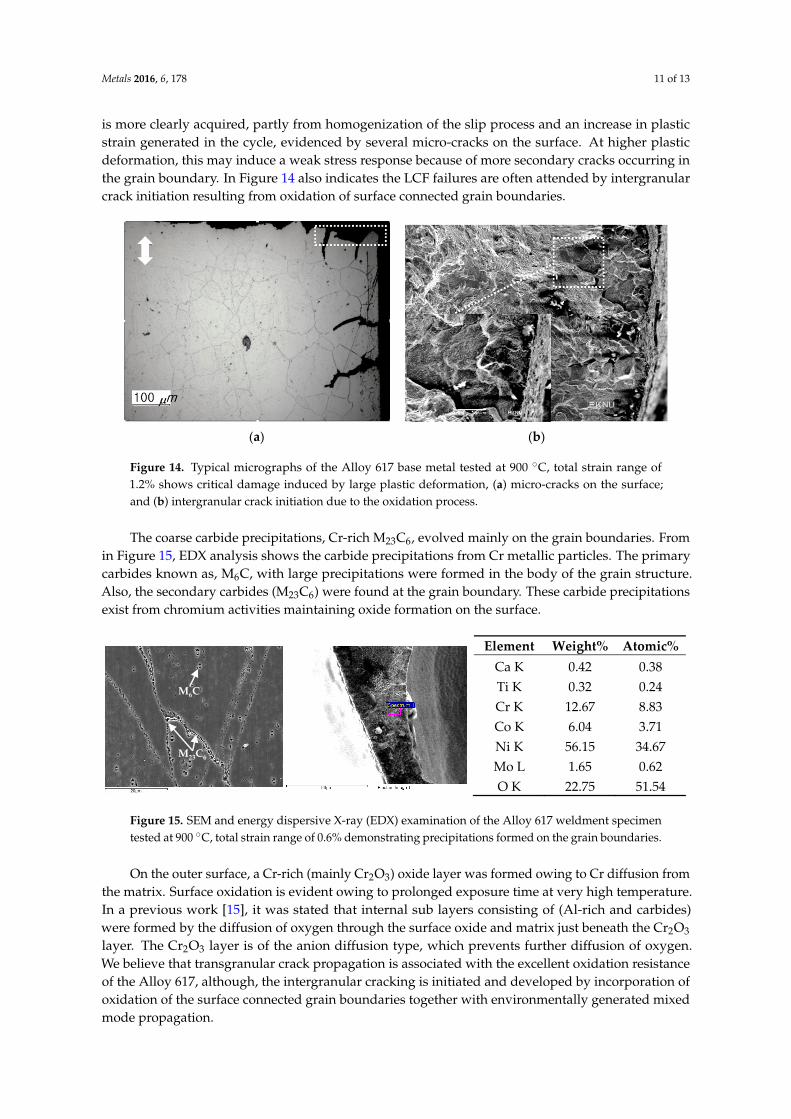
Figure 14 shows typical micrographs of the Alloy 617 base metal crack initiation site. It isinteresting to note that under higher total strain ranges, the reduction in fatigue life of the base metal
Metals 2016, 6, 178 11 of 13
is more clearly acquired, partly from homogenization of the slip process and an increase in plasticstrain generated in the cycle, evidenced by several micro-cracks on the surface. At higher plasticdeformation, this may induce a weak stress response because of more secondary cracks occurring inthe grain boundary. In Figure 14 also indicates the LCF failures are often attended by intergranularcrack initiation resulting from oxidation of surface connected grain boundaries.
Metals 2016, 6, 178 11 of 13
Figure 13 shows the failure mechanism of the weldment specimens occurred due to the slip
band process on the free surface, leading to the formation of a micro‐crack within the grain on the
specimen surface, and finally at the critical stage, coalescence of the micro‐cracks develop into the
macro‐crack and the crack is propagated in transgranular nature across the dendritic structure.
Again, as is seen from Figure 12, the fatigue striations on the weldment specimens are more obvious
than on the base metal. The occurrence of fatigue striations was due to a repeated plastic blunting
sharpening process arising from the slip of dislocations in the plastic zone of the fatigue crack tip
[12]. However, the weldments could easily form fatigue striations and undergo quasi‐cleavage facets
due to their higher stress‐strain interaction and being more brittle than that of the base metal [13].
Figure 14 shows typical micrographs of the Alloy 617 base metal crack initiation site. It is
interesting to note that under higher total strain ranges, the reduction in fatigue life of the base metal
is more clearly acquired, partly from homogenization of the slip process and an increase in plastic
strain generated in the cycle, evidenced by several micro‐cracks on the surface. At higher plastic
deformation, this may induce a weak stress response because of more secondary cracks occurring in
the grain boundary. In Figure 14 also indicates the LCF failures are often attended by intergranular
crack initiation resulting from oxidation of surface connected grain boundaries.
(a) (b)
Figure 14. Typical micrographs of the Alloy 617 base metal tested at 900 °C, total strain range of 1.2%
shows critical damage induced by large plastic deformation, (a) micro‐cracks on the surface; and
(b) intergranular crack initiation due to the oxidation process.
The coarse carbide precipitations, Cr‐rich M23C6, evolved mainly on the grain boundaries. From
In Figure 15, EDX analysis shows the carbide precipitations from Cr metallic particles. The primary
carbides known as, M6C, with large precipitations were formed in the body of the grain structure.
Also, the secondary carbides (M23C6) were found at the grain boundary. These carbide precipitations
exist from chromium activities maintaining oxide formation on the surface.
Element Weight% Atomic%
Ca K 0.42 0.38
Ti K 0.32 0.24
Cr K 12.67 8.83
Co K 6.04 3.71
Ni K 56.15 34.67
Mo L 1.65 0.62
O K 22.75 51.54
Figure 15. SEM and energy dispersive X‐ray (EDX) examination of the Alloy 617 weldment specimen
tested at 900 °C, total strain range of 0.6% demonstrating precipitations formed on the
grain boundaries.
M6C
M23C6
Figure 14. Typical micrographs of the Alloy 617 base metal tested at 900 ˝C, total strain range of1.2% shows critical damage induced by large plastic deformation, (a) micro-cracks on the surface;and (b) intergranular crack initiation due to the oxidation process.
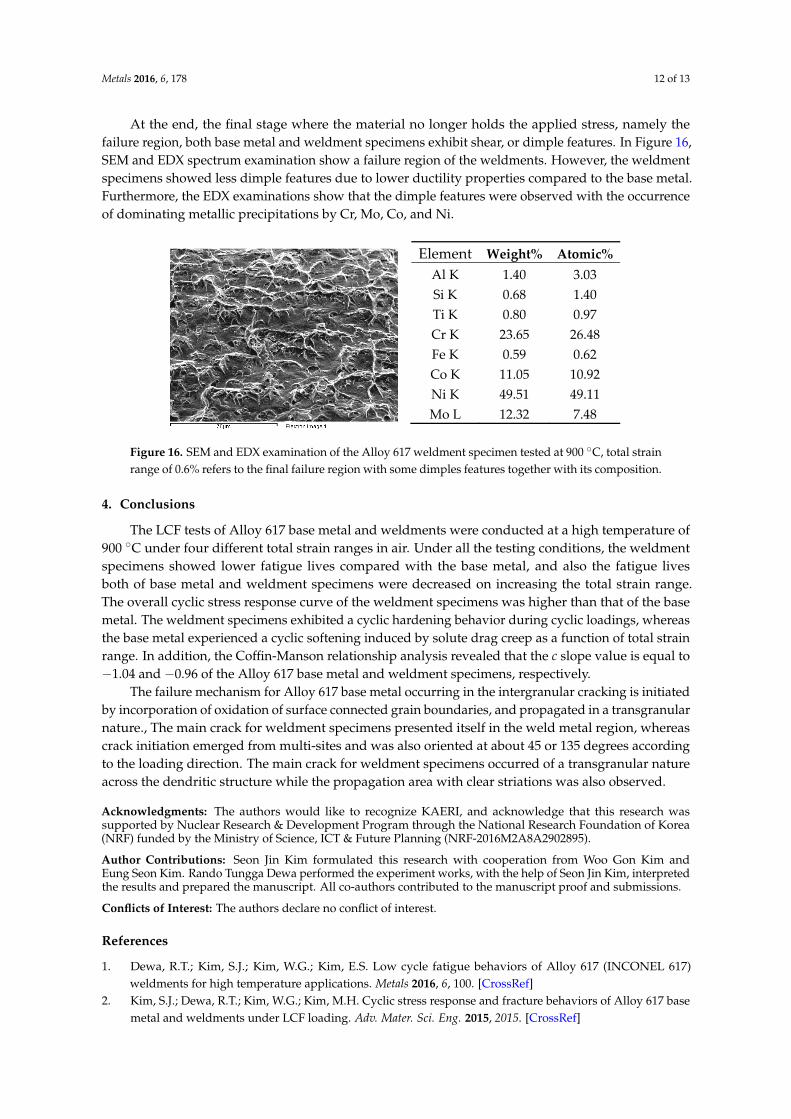
The coarse carbide precipitations, Cr-rich M23C6, evolved mainly on the grain boundaries. Fromin Figure 15, EDX analysis shows the carbide precipitations from Cr metallic particles. The primarycarbides known as, M6C, with large precipitations were formed in the body of the grain structure.Also, the secondary carbides (M23C6) were found at the grain boundary. These carbide precipitationsexist from chromium activities maintaining oxide formation on the surface.
Metals 2016, 6, 178 11 of 13
Figure 13 shows the failure mechanism of the weldment specimens occurred due to the slip
band process on the free surface, leading to the formation of a micro‐crack within the grain on the
specimen surface, and finally at the critical stage, coalescence of the micro‐cracks develop into the
macro‐crack and the crack is propagated in transgranular nature across the dendritic structure.
Again, as is seen from Figure 12, the fatigue striations on the weldment specimens are more obvious
than on the base metal. The occurrence of fatigue striations was due to a repeated plastic blunting
sharpening process arising from the slip of dislocations in the plastic zone of the fatigue crack tip
[12]. However, the weldments could easily form fatigue striations and undergo quasi‐cleavage facets
due to their higher stress‐strain interaction and being more brittle than that of the base metal [13].
Figure 14 shows typical micrographs of the Alloy 617 base metal crack initiation site. It is
interesting to note that under higher total strain ranges, the reduction in fatigue life of the base metal
is more clearly acquired, partly from homogenization of the slip process and an increase in plastic
strain generated in the cycle, evidenced by several micro‐cracks on the surface. At higher plastic
deformation, this may induce a weak stress response because of more secondary cracks occurring in
the grain boundary. In Figure 14 also indicates the LCF failures are often attended by intergranular
crack initiation resulting from oxidation of surface connected grain boundaries.
(a) (b)
Figure 14. Typical micrographs of the Alloy 617 base metal tested at 900 °C, total strain range of 1.2%
shows critical damage induced by large plastic deformation, (a) micro‐cracks on the surface; and
(b) intergranular crack initiation due to the oxidation process.
The coarse carbide precipitations, Cr‐rich M23C6, evolved mainly on the grain boundaries. From
In Figure 15, EDX analysis shows the carbide precipitations from Cr metallic particles. The primary
carbides known as, M6C, with large precipitations were formed in the body of the grain structure.
Also, the secondary carbides (M23C6) were found at the grain boundary. These carbide precipitations
exist from chromium activities maintaining oxide formation on the surface.
Element Weight% Atomic%
Ca K 0.42 0.38
Ti K 0.32 0.24
Cr K 12.67 8.83
Co K 6.04 3.71
Ni K 56.15 34.67
Mo L 1.65 0.62
O K 22.75 51.54
Figure 15. SEM and energy dispersive X‐ray (EDX) examination of the Alloy 617 weldment specimen
tested at 900 °C, total strain range of 0.6% demonstrating precipitations formed on the
grain boundaries.
M6C
M23C6
Figure 15. SEM and energy dispersive X-ray (EDX) examination of the Alloy 617 weldment specimentested at 900 ˝C, total strain range of 0.6% demonstrating precipitations formed on the grain boundaries.
On the outer surface, a Cr-rich (mainly Cr2O3) oxide layer was formed owing to Cr diffusion fromthe matrix. Surface oxidation is evident owing to prolonged exposure time at very high temperature.In a previous work [15], it was stated that internal sub layers consisting of (Al-rich and carbides)were formed by the diffusion of oxygen through the surface oxide and matrix just beneath the Cr2O3
layer. The Cr2O3 layer is of the anion diffusion type, which prevents further diffusion of oxygen.We believe that transgranular crack propagation is associated with the excellent oxidation resistanceof the Alloy 617, although, the intergranular cracking is initiated and developed by incorporation ofoxidation of the surface connected grain boundaries together with environmentally generated mixedmode propagation.
Metals 2016, 6, 178 12 of 13
At the end, the final stage where the material no longer holds the applied stress, namely thefailure region, both base metal and weldment specimens exhibit shear, or dimple features. In Figure 16,SEM and EDX spectrum examination show a failure region of the weldments. However, the weldmentspecimens showed less dimple features due to lower ductility properties compared to the base metal.Furthermore, the EDX examinations show that the dimple features were observed with the occurrenceof dominating metallic precipitations by Cr, Mo, Co, and Ni.
Metals 2016, 6, 178 12 of 13
On the outer surface, a Cr‐rich (mainly Cr2O3) oxide layer was formed owing to Cr diffusion
from the matrix. Surface oxidation is evident owing to prolonged exposure time at very high
temperature. In a previous work [15], it was stated that internal sub layers consisting of (Al‐rich and
carbides) were formed by the diffusion of oxygen through the surface oxide and matrix just beneath
the Cr2O3 layer. The Cr2O3 layer is of the anion diffusion type, which prevents further diffusion of
oxygen. We believe that transgranular crack propagation is associated with the excellent oxidation
resistance of the Alloy 617, although, the intergranular cracking is initiated and developed by
incorporation of oxidation of the surface connected grain boundaries together with environmentally
generated mixed mode propagation.
At the end, the final stage where the material no longer holds the applied stress, namely the
failure region, both base metal and weldment specimens exhibit shear, or dimple features. In Figure
16, SEM and EDX spectrum examination show a failure region of the weldments. However, the
weldment specimens showed less dimple features due to lower ductility properties compared to the
base metal. Furthermore, the EDX examinations show that the dimple features were observed with
the occurrence of dominating metallic precipitations by Cr, Mo, Co, and Ni.
Element Weight% Atomic%
Al K 1.40 3.03
Si K 0.68 1.40
Ti K 0.80 0.97
Cr K 23.65 26.48
Fe K 0.59 0.62
Co K 11.05 10.92
Ni K 49.51 49.11
Mo L 12.32 7.48
Figure 16. SEM and EDX examination of the Alloy 617 weldment specimen tested at 900 °C, total
strain range of 0.6% refers to the final failure region with some dimples features together with
its composition.
4. Conclusions
The LCF tests of Alloy 617 base metal and weldments were conducted at a high temperature of
900 °C under four different total strain ranges in air. Under all the testing conditions, the weldment
specimens showed lower fatigue lives compared with the base metal, and also the fatigue lives both
of base metal and weldment specimens were decreased on increasing the total strain range. The
overall cyclic stress response curve of the weldment specimens was higher than that of the base
metal. The weldment specimens exhibited a cyclic hardening behavior during cyclic loadings,
whereas the base metal experienced a cyclic softening induced by solute drag creep as a function of
total strain range. In addition, the Coffin‐Manson relationship analysis revealed that the c slope
value is equal to −1.04 and −0.96 of the Alloy 617 base metal and weldment specimens, respectively.
The failure mechanism for Alloy 617 base metal occurring in the intergranular cracking is
initiated by incorporation of oxidation of surface connected grain boundaries, and propagated in a
transgranular nature., The main crack for weldment specimens presented itself in the weld metal
region, whereas crack initiation emerged from multi‐sites and was also oriented at about 45 or 135
degrees according to the loading direction. The main crack for weldment specimens occurred of a
transgranular nature across the dendritic structure while the propagation area with clear striations
was also observed.
Acknowledgments: The authors would like to recognize KAERI, and acknowledge that this research was
supported by Nuclear Research & Development Program through the National Research Foundation of Korea
(NRF) funded by the Ministry of Science, ICT & Future Planning (NRF‐2016M2A8A2902895).
Figure 16. SEM and EDX examination of the Alloy 617 weldment specimen tested at 900 ˝C, total strainrange of 0.6% refers to the final failure region with some dimples features together with its composition.
4. Conclusions
The LCF tests of Alloy 617 base metal and weldments were conducted at a high temperature of900 ˝C under four different total strain ranges in air. Under all the testing conditions, the weldmentspecimens showed lower fatigue lives compared with the base metal, and also the fatigue livesboth of base metal and weldment specimens were decreased on increasing the total strain range.The overall cyclic stress response curve of the weldment specimens was higher than that of the basemetal. The weldment specimens exhibited a cyclic hardening behavior during cyclic loadings, whereasthe base metal experienced a cyclic softening induced by solute drag creep as a function of total strainrange. In addition, the Coffin-Manson relationship analysis revealed that the c slope value is equal to´1.04 and ´0.96 of the Alloy 617 base metal and weldment specimens, respectively.
The failure mechanism for Alloy 617 base metal occurring in the intergranular cracking is initiatedby incorporation of oxidation of surface connected grain boundaries, and propagated in a transgranularnature., The main crack for weldment specimens presented itself in the weld metal region, whereascrack initiation emerged from multi-sites and was also oriented at about 45 or 135 degrees accordingto the loading direction. The main crack for weldment specimens occurred of a transgranular natureacross the dendritic structure while the propagation area with clear striations was also observed.
Acknowledgments: The authors would like to recognize KAERI, and acknowledge that this research wassupported by Nuclear Research & Development Program through the National Research Foundation of Korea(NRF) funded by the Ministry of Science, ICT & Future Planning (NRF-2016M2A8A2902895).
Author Contributions: Seon Jin Kim formulated this research with cooperation from Woo Gon Kim andEung Seon Kim. Rando Tungga Dewa performed the experiment works, with the help of Seon Jin Kim, interpretedthe results and prepared the manuscript. All co-authors contributed to the manuscript proof and submissions.
Conflicts of Interest: The authors declare no conflict of interest.
References
1. Dewa, R.T.; Kim, S.J.; Kim, W.G.; Kim, E.S. Low cycle fatigue behaviors of Alloy 617 (INCONEL 617)weldments for high temperature applications. Metals 2016, 6, 100. [CrossRef]
2. Kim, S.J.; Dewa, R.T.; Kim, W.G.; Kim, M.H. Cyclic stress response and fracture behaviors of Alloy 617 basemetal and weldments under LCF loading. Adv. Mater. Sci. Eng. 2015, 2015. [CrossRef]
Metals 2016, 6, 178 13 of 13
3. Lee, H.Y.; Kim, Y.W.; Song, K.N. Preliminary application of the draft code case for alloy 617 for a hightemperature component. J. Mech. Sci. Technol. 2008, 22, 856–863. [CrossRef]
4. Lee, G.G.; Jung, S.; Park, J.Y.; Kim, W.G.; Hong, S.D.; Kim, Y.W. Microstructural investigation of Alloy 617creep-ruptured at high temperature in a helium environment. J. Mater. Sci. Technol. 2013, 29, 1177–1183.[CrossRef]
5. Wright, J.K.; Carroll, L.J.; Cabet, C.; Lillo, T.M.; Benz, J.K.; Simpson, J.A.; Lloyd, W.R.; Chapman, J.A.;Wright, R.N. Characterization of elevated temperature properties of heat exchanger and steam generatoralloys. Nucl. Eng. Des. 2012, 251, 252–260. [CrossRef]
6. Wright, J.K.; Carroll, L.J.; Wright, R.N. Creep and creep-fatigue of Alloy 617 weldments. Available online:http://www.osti.gov/scitech/biblio/1168621 (accessed on 26 July 2016).
7. Totemeier, T.C.; Tian, H.; Clark, D.E.; Simpson, J.A. Microstructure and strength characteristics of Alloy 617welds. Available online: https://inldigitallibrary.inl.gov/sti/3310959.pdf (accessed on 26 July 2016).
8. Wright, J.K.; Carroll, L.J.; Simpson, J.A.; Wright, R.N. Low cycle fatigue of Alloy 617 at 850 ˝C and 950 ˝C.J. Eng. Mater. Technol. 2013, 135, 1–8. [CrossRef]
9. Rao, K.B.S.; Meurer, H.P.; Schuster, H. Creep-fatigue interaction of lnconel 617 at 950 ˝C in simulated nuclearreactor helium. Mater. Sci. Eng. A 1988, 104, 37–51. [CrossRef]
10. Ren, W.; Swindeman, R. A review on current status of Alloys 617 and 230 for Gen IV nuclear reactor internalsand heat exchangers. J. Press. Vessel Technol. 2009, 131. [CrossRef]
11. Rahman, M.S.; Priyadarshan, G.; Raja, K.S.; Nesbitt, C.; Misra, M. Characterization of high temperaturedeformation behavior of INCONEL 617. Mech. Mater. 2009, 41, 261–270. [CrossRef]
12. Tian, D.D.; Liu, X.S.; He, G.Q.; Shen, Y.; Lv, S.Q.; Wang, Q.G. Low cycle fatigue behavior of casting A319alloy under two different aging conditions. Mater. Sci. Eng. A 2016, 654, 60–68. [CrossRef]
13. Zhang, Q.; Zhang, J.; Zhao, P.; Huang, Y.; Yu, Z.; Fang, X. Low-cycle fatigue behaviors of a new type of 10%Cr martensitic steel and welded joint with Ni-based weld metal. Int. J. Fatigue 2016, 88, 78–87. [CrossRef]
14. Jang, C.; Lee, D.; Kim, D. Oxidation behaviour of an Alloy 617 in very high-temperature air and heliumenvironments. Int. J. Press. Vessels Pip. 2008, 85, 368–377. [CrossRef]
15. Kim, W.G.; Park, J.Y.; Lee, G.G.; Hong, S.D.; Kim, Y.W. Temperature effect on the creep behavior of alloy 617in air and helium environments. Nucl. Eng. Des. 2014, 271, 291–300. [CrossRef]
© 2016 by the authors; licensee MDPI, Basel, Switzerland. This article is an open accessarticle distributed under the terms and conditions of the Creative Commons Attribution(CC-BY) license (http://creativecommons.org/licenses/by/4.0/).