understanding mass interactions in online sports viewing...
TRANSCRIPT

6
Understanding Mass Interactions in Online Sports Viewing: ChattingMotives and Usage Patterns
MINSAM KO and SEUNGWOO CHOI, Korea Advanced Institute of Science and Technology (KAIST)JOONWON LEE, Naver CorpUICHIN LEE and AVIV SEGEV, Korea Advanced Institute of Science and Technology (KAIST)
This article aims to deepen understanding of these mass interactions in online sports viewing through study-ing Naver Sports, the largest online sports viewing service in Korea. We examined the diverse aspects of massinteractions, including interactive experiences, usage motives, and relationships between usage patterns andmotives, through analysis of almost 6 million chats from Naver Sports and from self-reporting survey datafrom 1,123 users. First, we found that online sports viewing provides unique interactive experiences whencompared to other settings such as offline sports viewing and social TV viewing with friends. Second, wefound the key motives inspiring online sports viewing include the following: sharing feelings/thoughts, want-ing to be entertained, sharing information, and wanting to feel membership in a group. Third, these motiveswere significantly related to specific usage patterns. Finally, we explored how the study’s key findings canoffer practical design implications to enhance online sports viewing services, and to show system designershow to support particular usage patterns to better accommodate specific user motives.
CCS Concepts: � Information systems → Chat; Web log analysis; � Human-centered computing →Collaborative and social computing
Additional Key Words and Phrases: Online sports viewing, mass interaction, sports fan, social TV
ACM Reference Format:Minsam Ko, Seungwoo Choi, Joonwon Lee, Uichin Lee, and Aviv Segev. 2016. Understanding mass interac-tions in online sports viewing: Chatting motives and usage patterns. ACM Trans. Comput.-Hum. Interact.23, 1, Article 6 (January 2016), 27 pages.DOI: http://dx.doi.org/10.1145/2843941
1. INTRODUCTION
Sports fans enjoy watching sports games at various venues, including in-home andout-of-home locations (e.g., sports bars, workplaces, and sports stadiums). Viewingexperiences vary widely depending on where the viewing occurs [Eastman and Land1997]. In particular, public viewing, which can be defined as watching mediated (ortelevised) sports in public places such as sports bars, provides strong social experiencesbecause viewers can share and affirm their fanship as though they were spectators ata sports stadium [Gantz 2013].
This work was partly supported by Basic Science Research Program through the National Research Founda-tion of Korea (NRF) funded by the Ministry of Science, ICT & Future Planning (NRF-2012R1A1A1008858),and Institute for Information & Communications Technology Promotion (IITP) grant funded by the Koreagovernment (MSIP) (No. 10041313, UX-oriented Mobile SW Platform).Authors’ addresses: M. Ko, S. Choi, U. Lee (corresponding author), and A. Segev, Department of KnowledgeService Engineering, KAIST; emails: {msko, sw.choi, uclee, aviv}@kaist.ac.kr; J. Lee, Naver Corp; email:[email protected] to make digital or hard copies of part or all of this work for personal or classroom use is grantedwithout fee provided that copies are not made or distributed for profit or commercial advantage and thatcopies show this notice on the first page or initial screen of a display along with the full citation. Copyrights forcomponents of this work owned by others than ACM must be honored. Abstracting with credit is permitted.To copy otherwise, to republish, to post on servers, to redistribute to lists, or to use any component of thiswork in other works requires prior specific permission and/or a fee. Permissions may be requested fromPublications Dept., ACM, Inc., 2 Penn Plaza, Suite 701, New York, NY 10121-0701 USA, fax +1 (212)869-0481, or [email protected]© 2016 ACM 1073-0516/2016/01-ART6 $15.00DOI: http://dx.doi.org/10.1145/2843941
ACM Transactions on Computer-Human Interaction, Vol. 23, No. 1, Article 6, Publication date: January 2016.

6:2 M. Ko et al.
This type of public viewing has gone online as a result of recent advances in infor-mation technology, for example, high-speed Internet and Web 2.0. Now, sports fanscan watch sports from anywhere using social TV services such as YouTube Live, MLBTV, and Naver Sports, interacting with other fans via online chatting and cheering ontheir favorite teams while at work, on a bus, in a taxi, and so forth. Social TV servicesprovide unique viewing experiences in that viewers have a degree of freedom similarto that of viewing at home, but they can additionally share and affirm their fanshipwith other online viewers.
Live chatting behavior in social TV is considered a mass interaction because a largenumber of online viewers utilize a single public space to cheer on their favorite teams,express their feelings, and ask/answer questions. However, our knowledge of the natureof mass interactions in online sports viewing remains limited. Prior studies on mediatedsports are limited to social experiences in offline settings such as sports bars [Eastmanand Land 1997; Gantz 2013]. Large-scale data analyses have been used primarily toautomatically summarize sports games because the chatting content is related to thecurrent game [Melnick 1993], analytic algorithms can pinpoint highlight momentsduring which viewers actively participated in live chatting [Nichols et al. 2012; Tangand Boring 2012].
This article deepens our understanding of mass interactions in online sports viewing,and explores how the key findings can offer practical ideas for social TV system design.The following research questions were considered:
—RQ1: What are the quantitative and qualitative characteristics of interactive expe-riences in Naver Sports?
—RQ2: What are the primary motives for engaging in mass interactions while viewingonline sports?
—RQ3: How are these motives related to usage characteristics (physical/social contextand chatting patterns)?
We began by investigating interactive experiences in Naver Sports (RQ1). We ex-plored both the quantitative and qualitative aspects of interactive experiences, andcharacterized them by comparing them to other settings such as offline sports viewingand social TV viewing with friends. Then, based on a uses and gratifications approach[Blumler and Katz 1974], we tried to understand the motives for chatting in onlinesports viewing (RQ2) and to relate them to diverse usage patterns (RQ3). These analy-ses helped us to provide practical design suggestions that can be used to support userinteractions with the goal of increasing specific user motives.
The research questions were answered by analyzing almost 6 million chat messagesfrom Naver Sports, the most popular live streaming service for sports in Korea. Fur-thermore, we supplemented the large-scale data analysis with a self-reporting surveyof 1,123 Naver Sports users. To date, this study is the first large-scale study reportedfor real-world mass interactions in social TV. The key findings of this study are sum-marized as follows.
First, we investigated interactive experiences in Naver Sports and compared themwith those of other services, such as offline sports viewing and social TV viewingwith friends (RQ1). In essence, the number of co-viewers was far greater than thatof other services, and the chat speed was also faster than that of other services (e.g.,offline sports viewing [Eastman and Land 1997] and Internet relay chatting [Joneset al. 2008]). Qualitative analyses also revealed that the topics of chats were coherentand mostly contextually relevant to the current video content. Unlike offline sportsviewing, conversation among co-viewers rarely developed from sports into personalmatters. Finally, we found several unique functions of chat interactions that have not
ACM Transactions on Computer-Human Interaction, Vol. 23, No. 1, Article 6, Publication date: January 2016.
Understanding Mass Interactions in Online Sports Viewing 6:3
been reported in study of general social TV viewing [Weisz et al. 2007]: commentating,emotional release, cheering/jeering, and questioning/answering.
Second, the key motives for participating in mass interactions in social TV wereidentified as follows (RQ2): sharing feelings and thoughts, fun and entertainment,information seeking, information offering, emotional release, intra-membership, andinter-membership. Interestingly, we found that the survey participants (17.1%; 13/76responses) mentioned fan membership as their main motive, while no one participantdescribed building interpersonal relationships. This finding is unlike existing studiesthat evaluate user experiences in small-scale social TV environments (e.g., a group offriends) [Weisz et al. 2007]. Because personal conversation in Naver Sports is limited(considering the high speed of chat postings and strong topical coherence, observed inour quantitative and qualitative analysis), Naver Sports users seem to rarely expectinterpersonal relationships with other co-viewers. Instead, they tend to enjoy a feelingof fan membership by co-viewing and chatting with a massive number of others whoshare similar interests.
Third, the overall usage behaviors and the unique relationships between usage pat-terns and motives were identified using regression analyses (RQ3). In particular, itwas found that multitasking and smart media users exhibited a stronger motive forsharing feelings and thoughts with chats (e.g., to compensate for the loss of interactionopportunities due to multitasking and the lack of interaction opportunities afforded bytheir mobile devices). Chat length was negatively correlated with the entertainmentand emotional release motives according to the frequent use of emoticons instead oflong texts. The number of chats and the number of reporting abusive chats are posi-tively related to information seeking/offering motives. Finally, fan loyalty observed inchatting behavior was clearly reflected in the membership motive. Based on our keyfindings, we present practical design suggestions.
The remainder of this article is organized as follows. In Section 2, we provide back-ground information about mediated sports viewing and review the related literature.In Section 3, we illustrate user interfaces in Naver Sports and our dataset. Section 4explains both the quantitative and qualitative analysis results of the chat dataset.Section 5 presents the results of the explorative factor analyses that identified the keyusage motives, and Section 6 shows the relationship between those motives and diverseusage patterns. Based on our findings, practical design suggestions are presented inSection 7. Section 8 describes the limitations of this study, and this article concludesin Section 9.
2. BACKGROUND AND RELATED WORK
2.1. Motives for Enjoying Mediated Sports
The popularity of watching mediated sports is largely attributed to several factors,including emotional, cognitive, and behavioral/social motivators [Raney 2006]. Therelevance of these factors for understanding mass interactions in social TV will bedemonstrated.
First, people watch mediated sports because they expect positive emotional impactsfrom watching. This is called emotional motivation. Several studies have reported highexpectations of being entertained or experiencing enjoyment during games that peoplecan bring to sports programming [Gantz 1981; Gantz and Wenner 1991]. Anotheremotional motivation is self-esteem. People tend to perceive themselves as attractive,competent, and likable when their favorite team wins [Wann 1995; Wann et al. 1999].For example, sports fans often identify themselves as winners when their favoriteteam wins. This is called basking in the reflected glory [Cialdini et al. 1976]. Thesebehaviors reflect fan identity—that is, social identity related to a specific sports team
ACM Transactions on Computer-Human Interaction, Vol. 23, No. 1, Article 6, Publication date: January 2016.

6:4 M. Ko et al.
[Jacobson 2003]. According to the social identity theory, such social identity motivatespeople to behave in ways that maintain and increase their self-esteem. Thus, self-esteem motivation is more influential when people have stronger fan identities. Finally,escaping the stress of daily life motivates people to watch mediated sports [Gantz 1981;Gantz and Wenner 1991]; for example, people want to view mediated sports to take abreak from repetitive tasks [Krohn et al. 1998].
Second, cognitive motivation drives people to view sports on television. Viewingsports is a cognitive activity as well as an emotional activity. People are often moti-vated to learn more about players and teams [Gantz 1981; Gantz and Wenner 1991]because this knowledge can be useful conversational content with friends and strangers[Melnick 1993]. Viewers also have aesthetic motivations that lead them to appreciatethe artistic or stylistic beauty found in sports games [Zillmann et al. 1989]. This moti-vation is stronger in sports that contain more aesthetic elements, such as gymnasticsor figure skating.
Third, behavioral and social motivations lead people to enjoy mediated sports. Watch-ing sports provides viewers with an opportunity to release emotions [Gantz 1981; Gantzand Wenner 1991]. Viewers often bring their repressed emotions to their viewing expe-riences, and these emotions are further enhanced through viewing sports. With respectto social emotions, prior research has reported that a stronger companionship existsbetween sports viewers than among those who view other types of television content[Wenner and Gantz 1998]. Furthermore, many fans are motivated by group affiliationsbeyond temporal companionship [Smith 1988].
Existing studies have focused primarily on identifying the motives of offline sportsviewers. As a new form of media, social TV systems use chatting functions to provide ahigh degree of freedom similar to that of home viewing or co-viewing experiences suchas stadium/public viewing. The number of online sports viewers who regularly watchsports games, ranging from baseball to e-sports, increases continually. However, thereis a lack of research concerning how viewers use social TV systems and how/why theyinteract with other viewers, particularly in a mass interaction space. We believe thatunderstanding the usage behaviors/motives and the relationships between these usagebehaviors and motives will assist in outlining practical design suggestions for onlinesports viewing systems.
2.2. Online Mass Interactions
The virtual public is a computer-mediated space that enables mass interactions amongthe public [Jones et al. 2004, 2008]. Example services include Usenet, IRC, socialTV (Naver Sports TV, GetGlue, etc.), and Twitter groups. The existing research onmass interactions has focused primarily on information overload, the state at whichthe communication overheads required to process messages exceeds an individual’sinformation processing limit [Jones et al. 2004, 2008]. In their Usenet studies, Joneset al. [2004] identified several user strategies for managing information overload suchas responding to simpler messages, generating simpler responses, and participatingless actively. In IRC chatting [Jones et al. 2008], information processing limits imposelimits on user participation—that is, the community size is typically less than 300.However, the active posters are limited to 40 users, and the information processingrate is bound by 30 messages per minute.
Group chats in Twitter have appeared as new media for mass interactions. Budakand Agrawal [2013] analyzed 30 educational groups and demonstrated that user contri-bution followed the power-law distribution (a large number of Twitter users participatein a single chat group, while a small number of users contribute to multiple groups.).The participants were limited to 2,000 individuals, on average. They also found thatthe factors closely related to continued participation in group chats after the initial
ACM Transactions on Computer-Human Interaction, Vol. 23, No. 1, Article 6, Publication date: January 2016.

Understanding Mass Interactions in Online Sports Viewing 6:5
visit included individual initiatives, group characteristics, linguistic affinity, and per-ceived receptivity. The significant usage motives were to explore due to curiosity; tolearn about new information, tools, and methods; to make connections; and to have asense of belonging. Note that unlike existing virtual public spaces, social TV has twounique characteristics: chat sessions are associated with a corresponding TV programand large numbers of viewers participate in chat sessions simultaneously.
Our study extends understanding of such new media and provides practical sug-gestions for designing online sports viewing systems by analyzing the relationshipsbetween interaction motives and usage patterns.
2.3. User Interactions in Social TV Systems
Social TV is a new breed of video service that integrates other communication serviceslike voice, chat, context awareness, and peer ratings to support shared TV experienceswith others [Klym and Montpetit 2008]. It has been reported that social TV serviceschange traditional user interaction in TV viewing and offer better user experiences. Forexample, various socializing features in social TV systems provide a feeling of sharingthe same social events with others [McPherson et al. 2012], making video content moreenjoyable [Weisz et al. 2007].
Social TV services support diverse social interactions. Cesar and Geerts [2011] clas-sified social interactions in social TV services into four categories: content selectionand sharing, communication, community building, and status updating. First, contentselection means that TV viewers share relevant information about programs to helpeach other make a decision on what to watch (i.e., program recommendations). Forexample, Facebook Live provides a “like” button on a live video, and Hulu allows usersto edit and share video clips with others. NextGuide allows users to create a profileand share their favorite movies or shows with friends, and Grabyo provides an editingtool to share real-time videos via SNS. Second, some social TV services support directcommunication with other viewers via chat, audio, or video. CollaboraTV [Nathan et al.2008] and AmigoTV [Coppens et al. 2004] provide a text-based chatting function forviewers, and Naver Sports, Daum Sports, YouTube Live, and MLB TV support massinteractions among a large number of co-viewers. Additionally, KakaoTV is a mobilesocial TV service that allows mobile viewers to chat with each other by providingstreaming video. Third, a large community of viewers is built when they share theircomments about a program. For example, GetGlue (currently closed) and Voice of TV,customized social network services for TV programs, provide an online space for eachTV program so that TV viewers can exchange messages about TV programs. Finally,status updating gives viewers social awareness of each other’s presence. Naver Sportsand TVing show the number of current viewers. Likewise, Viggle shows the numberof users who are checked into a program, and users can browse their friends’ check-instatuses.
With the advent of smart TV and Internet TV, the concept of social TV covers broaderaspects of new media, and social TV can be further classified according to severaladditional design dimensions. First, social TV systems can be differentiated accordingto their integration of social interaction with a video. In some social TV systems, thespace for social interactions can be co-located on the same screen. With GoogleTVand CommentTV [Hwang et al. 2012], for example, viewers’ comments are presentedright next to the video screen. Viewers can even use second screens separate from thedevice on which a video is playing. For example, while watching a video on a TV or PC,viewers can post short messages with Twitter and WhatsApp using their smartphonesor tablets. Han et al. [2014] showed that viewers often use mobile messengers to searchfor relevant information, communicate with others, and work on tasks in opportunemoments during perceived lulls in the first screen’s content.
ACM Transactions on Computer-Human Interaction, Vol. 23, No. 1, Article 6, Publication date: January 2016.

6:6 M. Ko et al.
Social TV systems can be also differentiated based on the publicness of their interac-tion groups. Some social TV systems support only private social interaction spaces forsmall peer groups. For example, CollaboraTV and KakaoTV provide chatting functionsfor a group of friends who watch a video together online, and TunerFish gives view-ers an awareness of what their friends are currently watching. Another type of socialTV system provides an interaction space for the public. Such social TV systems usu-ally support mass interactions of numerous co-viewers who share the same interestsin a live video (e.g., YouTube Live, TVing, MLB TV, and Naver Sports). In addition,some services support user interactions in both public and private spaces. For example,GetGlue users can share comments in the public space for each program, and at thesame time, they can also directly interact with users on a “friend list.”
In this article, we analyze Naver Sports, which supports direct communicationthrough text-based chatting. The interaction space of Naver Sports is open to thepublic, and it can be considered a venue for mass interactions among sports view-ers. Therefore, our study investigates text-based mass interaction services typicallyobserved in current social TV systems. While previous studies have focused on theuser interactions of a small group of viewers [Geerts et al. 2008; Dezfuli et al. 2011;Weisz et al. 2007; Geerts et al. 2011], we complement these studies by quantitativelyanalyzing mass interactions with a large-scale dataset.
2.4. Online Sports Viewing by Social TV Systems
Earlier studies have demonstrated that sports are one of the most characterizing gen-res of TV. First, people are more interactive while watching sports games [Geerts et al.2008]. The authors demonstrated that communication patterns depend on programgenre. Furthermore, a genre’s plot structure is an important factor that contributesto determining the level of social interaction while watching TV. Genres with an en-gaging plot structure, such as drama and movies, may permit fewer opportunities forsynchronous social interaction because they require more viewer attention. In contrast,genres with short or negligible plot structures, such as quizzes and sports, offer moreopportunities for synchronous interaction.
Second, people feel more comfortable talking with strangers while watching sportsgames [Dezfuli et al. 2011]. Relatively fewer social interactions occur among strangersin the presence of other genres of television because people prefer to interact withfamily or close friends. However, sports fans enjoy watching games with strangers dueto the group identity associated with teams [Lee 1985]. Furthermore, in sports games,the number of co-viewers is more important for viewer satisfaction than the identity ofthe co-viewers [Dezfuli et al. 2011].
Prior studies have analyzed the user interactions of small groups. In recent years,social TV services based on mass interactions (e.g., YouTube Live, MLB TV, and NaverSports) have been grown rapidly, but our knowledge of the nature of such systemsremains limited. Our study aims to bridge this gap by deepening understanding ofmass interactions in online viewing and identifying practical suggestions for social TVsystem design.
3. DATASET: NAVER SPORTS
Naver Sports is a convenient online platform for online sports viewing experiences. Itdelivers live video streams from public broadcasting stations and supports multiple de-vices, such as PCs and smart devices (phones and tablets). It also covers diverse sportsgenres including baseball, soccer, basketball, golf, e-sports, and so on. E-sports refersto competitions of video games such as StarCraft and League of Legends, and Koreahas professional leagues for e-sports that usually provide live competition broadcasts.
ACM Transactions on Computer-Human Interaction, Vol. 23, No. 1, Article 6, Publication date: January 2016.
Understanding Mass Interactions in Online Sports Viewing 6:7
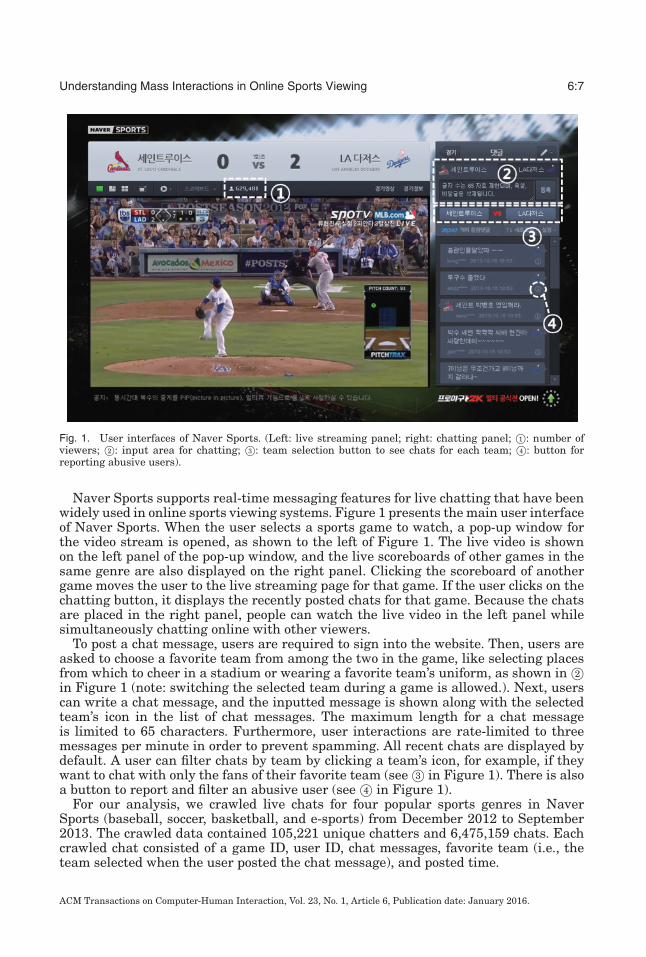
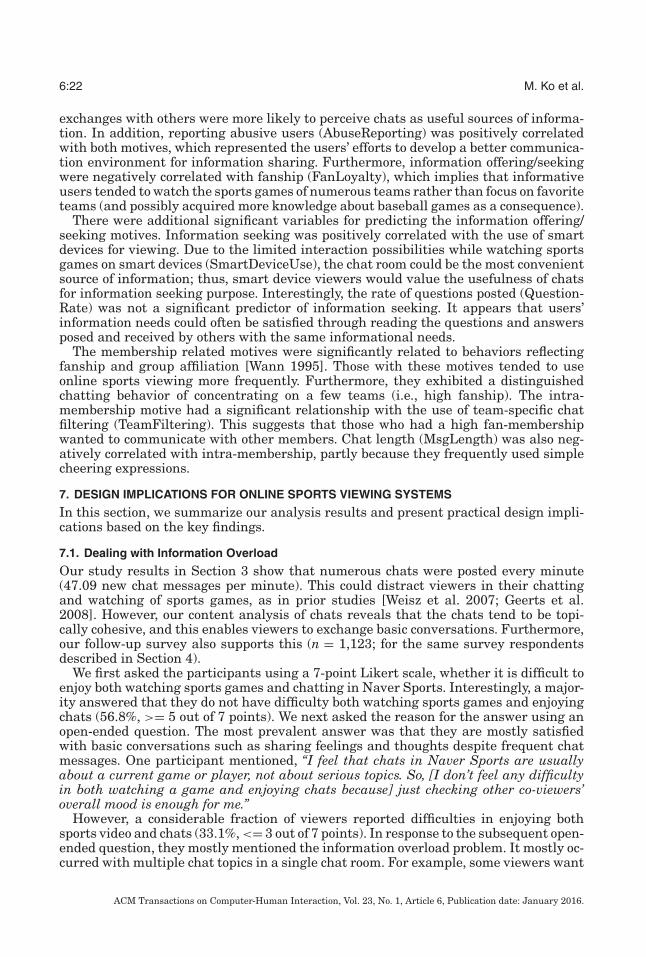
Fig. 1. User interfaces of Naver Sports. (Left: live streaming panel; right: chatting panel; 1©: number ofviewers; 2©: input area for chatting; 3©: team selection button to see chats for each team; 4©: button forreporting abusive users).
Naver Sports supports real-time messaging features for live chatting that have beenwidely used in online sports viewing systems. Figure 1 presents the main user interfaceof Naver Sports. When the user selects a sports game to watch, a pop-up window forthe video stream is opened, as shown to the left of Figure 1. The live video is shownon the left panel of the pop-up window, and the live scoreboards of other games in thesame genre are also displayed on the right panel. Clicking the scoreboard of anothergame moves the user to the live streaming page for that game. If the user clicks on thechatting button, it displays the recently posted chats for that game. Because the chatsare placed in the right panel, people can watch the live video in the left panel whilesimultaneously chatting online with other viewers.
To post a chat message, users are required to sign into the website. Then, users areasked to choose a favorite team from among the two in the game, like selecting placesfrom which to cheer in a stadium or wearing a favorite team’s uniform, as shown in 2©in Figure 1 (note: switching the selected team during a game is allowed.). Next, userscan write a chat message, and the inputted message is shown along with the selectedteam’s icon in the list of chat messages. The maximum length for a chat messageis limited to 65 characters. Furthermore, user interactions are rate-limited to threemessages per minute in order to prevent spamming. All recent chats are displayed bydefault. A user can filter chats by team by clicking a team’s icon, for example, if theywant to chat with only the fans of their favorite team (see 3© in Figure 1). There is alsoa button to report and filter an abusive user (see 4© in Figure 1).
For our analysis, we crawled live chats for four popular sports genres in NaverSports (baseball, soccer, basketball, and e-sports) from December 2012 to September2013. The crawled data contained 105,221 unique chatters and 6,475,159 chats. Eachcrawled chat consisted of a game ID, user ID, chat messages, favorite team (i.e., theteam selected when the user posted the chat message), and posted time.
ACM Transactions on Computer-Human Interaction, Vol. 23, No. 1, Article 6, Publication date: January 2016.
6:8 M. Ko et al.
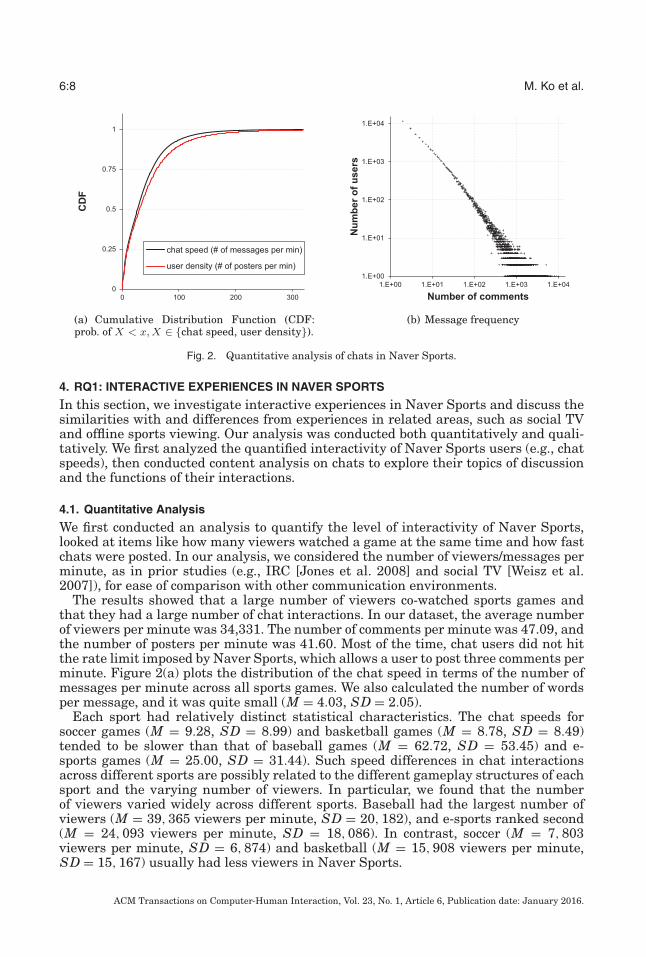
Fig. 2. Quantitative analysis of chats in Naver Sports.
4. RQ1: INTERACTIVE EXPERIENCES IN NAVER SPORTS
In this section, we investigate interactive experiences in Naver Sports and discuss thesimilarities with and differences from experiences in related areas, such as social TVand offline sports viewing. Our analysis was conducted both quantitatively and quali-tatively. We first analyzed the quantified interactivity of Naver Sports users (e.g., chatspeeds), then conducted content analysis on chats to explore their topics of discussionand the functions of their interactions.
4.1. Quantitative Analysis
We first conducted an analysis to quantify the level of interactivity of Naver Sports,looked at items like how many viewers watched a game at the same time and how fastchats were posted. In our analysis, we considered the number of viewers/messages perminute, as in prior studies (e.g., IRC [Jones et al. 2008] and social TV [Weisz et al.2007]), for ease of comparison with other communication environments.
The results showed that a large number of viewers co-watched sports games andthat they had a large number of chat interactions. In our dataset, the average numberof viewers per minute was 34,331. The number of comments per minute was 47.09, andthe number of posters per minute was 41.60. Most of the time, chat users did not hitthe rate limit imposed by Naver Sports, which allows a user to post three comments perminute. Figure 2(a) plots the distribution of the chat speed in terms of the number ofmessages per minute across all sports games. We also calculated the number of wordsper message, and it was quite small (M = 4.03, SD = 2.05).
Each sport had relatively distinct statistical characteristics. The chat speeds forsoccer games (M = 9.28, SD = 8.99) and basketball games (M = 8.78, SD = 8.49)tended to be slower than that of baseball games (M = 62.72, SD = 53.45) and e-sports games (M = 25.00, SD = 31.44). Such speed differences in chat interactionsacross different sports are possibly related to the different gameplay structures of eachsport and the varying number of viewers. In particular, we found that the numberof viewers varied widely across different sports. Baseball had the largest number ofviewers (M = 39, 365 viewers per minute, SD = 20, 182), and e-sports ranked second(M = 24, 093 viewers per minute, SD = 18, 086). In contrast, soccer (M = 7, 803viewers per minute, SD = 6, 874) and basketball (M = 15, 908 viewers per minute,SD = 15, 167) usually had less viewers in Naver Sports.
ACM Transactions on Computer-Human Interaction, Vol. 23, No. 1, Article 6, Publication date: January 2016.

Understanding Mass Interactions in Online Sports Viewing 6:9
In addition, further analysis revealed the power-law nature of user participation.Figure 2(b) presents the distribution of each user’s chat message frequency, whichequals the number of messages per user. A small number of active users posted alarge number of messages, and the remainder of users posted only a small number ofmessages. 58.5% posted fewer than ten messages during the period, and the top 10%of chat participants posted 79.9% of the messages.
4.2. Qualitative Analysis
We conducted content analysis to understand the content of chats in Naver Sports.We first sampled 2,500 chats, and 25 chatting blocks were randomly selected from thedataset. Each block had 100 consecutive chats in order to preserve the chatting context.We then performed affinity diagramming of the chats to identify the topics of chats andthe functions of interactions.
4.2.1. Topics of Chats. To investigate the topics of chats, two researchers collaborativelyconducted affinity diagramming. The coders individually extracted a topic keyword foreach chat, and they grouped the keywords together through discussions. This task wasconducted iteratively, and we finally found that a key dimension for distinguishing thetopics of chats was whether a chat was related to sports or not. This binary codingscheme was evaluated by two external coders (non-researchers), and the results werereliable (kappa value = 0.87).
Overall, chats in Naver Sports were topically coherent with a broader theme ofsports games. Almost all the chats were related to sports (93.5%). The viewers weremost likely to chat about live sports events, for example, interpreting and commentingon events and cheering for players and teams. In addition, they occasionally chattedabout peripheral matters such as cheerleaders, game commentators, other matches indifferent stadiums, and different sports genres.
In contrast, non-sports chats were small in volume (6.5%). Most of the chats inthis category were related to the advertisements shown during breaks. Viewers talkedabout celebrities or products in the advertisements on a live video, for example, “Iwould like to buy this.” There were other chats about trending topics (e.g., breakingnews) and self-expressions from the viewers (e.g., statuses like “I’m hungry, now”).Interestingly, our manual investigation revealed that most viewers tended to chatabout sports events, even during the breaks. They evaluated previous innings andpredicted upcoming innings instead of conversing on other topics such as ads, possiblybecause the same set of ads typically recurred throughout a game.
4.2.2. Functions of Chat Interactions. Next, we classified chats according to their inter-actional functions. Again, two researchers conducted affinity diagramming, and fivecategories emerged: commentating, emotional responses, cheering/jeering, and ques-tioning/answering. We tested inter-coder agreement with two external raters, and theresult was reliable (kappa value = 0.89).
First, commentating was the most popular function (50.2%). This included interpre-tation, evaluation, prediction, instruction, and discussion of game events. For example,there were chats objectively explaining events that had just happened through simpledescriptions (“His third pitch was a strike”) or interpretations (“That was because ofthe third pitch out rule”). We note that the commentating’ chats are different from theanswering’ ones, even though both give useful information for other co-viewers. Ourcoding analysis classified chats containing objective information into commentating’and question/answering’ groups depending on whether they were answers to a previ-ous question or not. Additionally, there were also chats containing subjective opinions.For example, viewers had a discussion about referees’ decisions, made predictions aboutupcoming plays, and gave instructions for game strategy.
ACM Transactions on Computer-Human Interaction, Vol. 23, No. 1, Article 6, Publication date: January 2016.
6:10 M. Ko et al.
Second, a fair number of chats related to emotional responses (31.8%). Most of thechats in this category expressed simple emotions about specific game plays, either pos-itive (e.g., “Good,” “nice!,” and “Wow”) or negative (e.g., “Ah,” “T_T,” and “:-(”). Moreover,viewers often responded to other viewers’ chats. For example, viewers who enjoyedothers’ funny chats and jokes responded with laughing emoticons.
Third, we found a considerable number of chats cheering and jeering (13.4%). Somechats encouraged a team and its players with messages along the lines of “You cando this!” Interestingly, for some popular players, viewers typed their names (or nick-names) and the players’ fight songs as encouragement. Furthermore, some of chatsin this category, like “Please one more hit!” and “I really want a shot this time,” re-flected the viewers’ desires and wishes. In addition, jeering chats included discouragingexpressions toward the opponent’s team. Furthermore, we found fights between twogroups of fans mocking each other.
Finally, viewers also chatted for questioning/answering purpose. This category com-prised 8.7% of the chats, and the fraction of questioning chats (5.9%) was greater thanthat of answering chats (2.7%). Most seeking chats related to game events. For ex-ample, a viewer who had missed an event might ask the others to explain what hadhappened. Some viewers also actively sought information about current matches andplayers. For answering, the majority of chats were answers to others’ questions. Addi-tionally, viewers often answered questions by citing the latest news on a team or anexplanation of the game’s rules.
4.3. Discussion
Our quantitative analysis showed unique characteristics of chat interactions in onlinesports viewing. The number of co-viewers in Naver Sports was large, and the chatspeed was fast; for example, in baseball, the number of co-viewers was close to 40,000,and the chat speed was 62.72 per minute. This level of chat speed was also observed inoverloaded IRC chat channels (e.g., 30 messages per minute with hundreds of partici-pants) [Jones et al. 2008]. A small number of active users contributed to a large amountof the chat volume. This power-law nature of user participation is commonly observedin other mass interaction media, including Twitter groups [Budak and Agrawal 2013]and Usenet groups [Whittaker et al. 1997].
From our qualitative analysis, we found that there was strong topical coherence.Most of the chats were related to a sports game on a live video. The chats also servedmany functions closely related to sports: commentating, emotional response, cheering/jeering, and questioning/answering in response to a live sports game. These resultsare similar to the functions of chats among offline sports viewers [Eastman and Land1997]. However, while offline viewers often pursue chatting topics ranging from sportsto personal matters [Eastman and Land 1997], personal conversations were rarelyobserved in Naver Sports. In fact, such strong topical coherence is likely to be related toinformation overload—highly coherent content requires much less processing overheadthan diverse content. There seems to be a social norm that sports-related chats areacceptable, whereas other concerns are off-topic and should be limited. Although chattopics could become mixed at some points (e.g., one viewer talking about a pitcher, whileothers talked about a batter), topical identity remains as long as chats are relevantto the current context of the live videos, or topically coherent with a broader theme,namely sports.
The strong topical coherence of chats in Naver Sports could be also related to weakinterpersonal relationships among co-viewers. Naver Sports users rarely know eachother personally, so it is likely difficult for them to share their personal matters. Theonline mass interaction probably makes it yet more difficult for strangers to share di-verse, off-topic matters. Offline sports viewers like to have conversations with strangers
ACM Transactions on Computer-Human Interaction, Vol. 23, No. 1, Article 6, Publication date: January 2016.

Understanding Mass Interactions in Online Sports Viewing 6:11
on diverse topics from sports to personal matters [Eastman and Land 1997]. For exam-ple, while 30–50 viewers watch a sports video at the same place (e.g., a bar), they canstill develop conversations with the person next to them (like a sub-group). Namely, of-fline viewers are given space for two-way communication with a small group members.However, in a mass interaction setting like Naver Sports, it is hard to find a separatespace for developing interpersonal relationships due to the large volume of concurrentchats by a large number of co-viewers.
In the next section, we aim to deepen understanding of the mass interactions inonline sports viewing by analyzing the relationship between chat usage and motives formass interactions and drawing practical design suggestions for online sports viewingsystems based on our findings.
5. RQ2: MOTIVES FOR MASS INTERACTION IN ONLINE SPORTS VIEWING
The motives of mass interaction in online sports viewing were investigated using theUses and Gratifications Theory (UGT) approach [Blumler and Katz 1974], a theoreticalframework that examines the “how” and “why” of media use. Strengths of this approachinclude its applicability to a variety of media and its provision of a common frameworkfor understanding usage motives, antecedents, and outcomes. The UGT has been widelyused to understand a variety of interactive media including Facebook [Joinson 2008;Spiliotopoulos and Oakley 2013] and blogs [Kaye 2010]. In this study, we adopted thetwo-stage process of identifying motives typically used in UGT work [Joinson 2008]. Inthe first stage, we conducted an exploratory study to determine users’ motives throughsoliciting answers in a free-text format. Then, survey items were generated based on thesignificant motives that emerged from collaborative content analyses of user responses.In the second stage, we performed a large-scale survey and conducted exploratory factoranalyses that grouped relevant survey items in order to derive statistically significantmotives. In addition, the relationship between usage motives and actual usage behaviorwas investigated through a series of multiple linear regression analyses.
5.1. Exploratory Study
5.1.1. Participants and Survey Content. This study targeted active users who posted alarge number of chat messages in Naver Sports. We invited a total of 1,928 activeusers chosen from the four sports genres (baseball, soccer, basketball, and e-sports) toparticipate in an online survey. Sixty participants responded to the invitation (52 menand 8 women). Most participants were in their 20s (10s: 17.24%, 20s: 58.62%, 30s:15.52%, 40s+: 8.61%). Furthermore, many participants reported that they watchedgames with Naver Sports 2 or 3 days per week (0–1 day: 6.67%, 2–3: 51.67%, 4–5:26.67%, 6–7: 15%). The online survey contained basic demographic questions (e.g., age,gender, and frequency of Naver Sports use) as well as open-ended questions that probedusage motives. The participants were asked to respond to the following questions ina free-text format similar to those described in earlier studies [Joinson 2008]. Theparticipants were compensated with a gift voucher worth USD $10.
—What is the first thing that comes to mind when you think about what you enjoymost when using chats (reading/posting messages) in Naver Sports?
—What other words describe what you enjoy about using chats in Naver Sports?—Using single, easy-to-understand terms, what do you use chats in Naver Sports for?—What uses of chats in Naver Sports are most important to you?
5.1.2. Analysis Results. Two raters worked collaboratively to perform the affinity dia-gramming, which extracted keywords from the participants’ responses, and groupedthem into representative themes. Affinity diagramming was conducted iteratively, andfive key motive themes emerged, as outlined in Table I: sharing feelings and thoughts,
ACM Transactions on Computer-Human Interaction, Vol. 23, No. 1, Article 6, Publication date: January 2016.

6:12 M. Ko et al.
Table I. Main Motive Themes
membership, information sharing, fun and entertainment, and emotional release. It isinteresting to note that no participants mentioned building interpersonal relationshipsor fostering closeness with others. In earlier research on social TV, building interper-sonal relationships was commonly observed in social TV viewing [Weisz et al. 2007]. Weposit that this characteristic is attributed to the large number of “strangers” that par-ticipate in online sports chat sessions, the key factor differentiating this research fromearlier research undertaking small group-based user studies. Although users wouldidentify themselves as fans (membership), due to the massive number of participants,the mass chat format may not facilitate interpersonal relationship building.
5.2. Scale Development to Measure Motives for Mass Interaction in Online Sports Viewing
5.2.1. Survey Content. The questionnaire comprised four parts. First, we asked theparticipants to respond to a motive survey (which included 26 items on a 7-point Likertscale). These items were based on the motives found in the explorative study and weregenerated following the same procedures used in earlier works [Joinson 2008]. Wegenerated six items for sharing feelings and thoughts, five items for membership, sixitems for information sharing, five items for fun and entertainment, and four itemsfor emotional release. The words and phrases in the items were drawn primarily fromthe original responses. Second, we asked detailed questions about the participants’social TV viewing and chatting behaviors (e.g., frequency of Naver Sports use, viewinglocations, and frequency of checking chat rooms). Third, we asked the participantsto report any difficulties that they had encountered while chatting. Fourth, we askedusers to answer demographic questions and other general media usage information.
5.2.2. Participants. We sent email invitations for the online survey to 44,578 NaverSports users randomly chosen from the chat dataset. In total, 1,406 participants re-sponded to these requests, but only 1,123 completed the survey in full. Consideringthe low response rate, we tested for non-response bias, which occurs when the answersof the respondents differ from the potential answers of those who did not answer. To
ACM Transactions on Computer-Human Interaction, Vol. 23, No. 1, Article 6, Publication date: January 2016.

Understanding Mass Interactions in Online Sports Viewing 6:13
test for the non-response bias [Lindner et al. 2001], we divided the user responsesinto two groups: responses submitted in 3 days or less and responses submitted after4 or more days. The group-wise comparisons did not yield any significant differences,which indicates that the survey results were not severely influenced by non-responsebias. The gender distribution was similar to the earlier survey result (986 men and 137women). Most participants were in their 20s (10s: 18.44%, 20s: 57.04%, 30s: 18.80%,40s+: 5.70%). The mean of computer usage hours (including smart devices) was 5.92hours per day (SD = 3.99). Participants mainly watched Naver Sports more than 2 or 3days per week (0–1 day: 5.52%, 2–3: 39.92%, 4–5: 29.85%, 6–7: 24.68%). Fifty randomlyselected participants were compensated with a gift voucher worth USD $10.
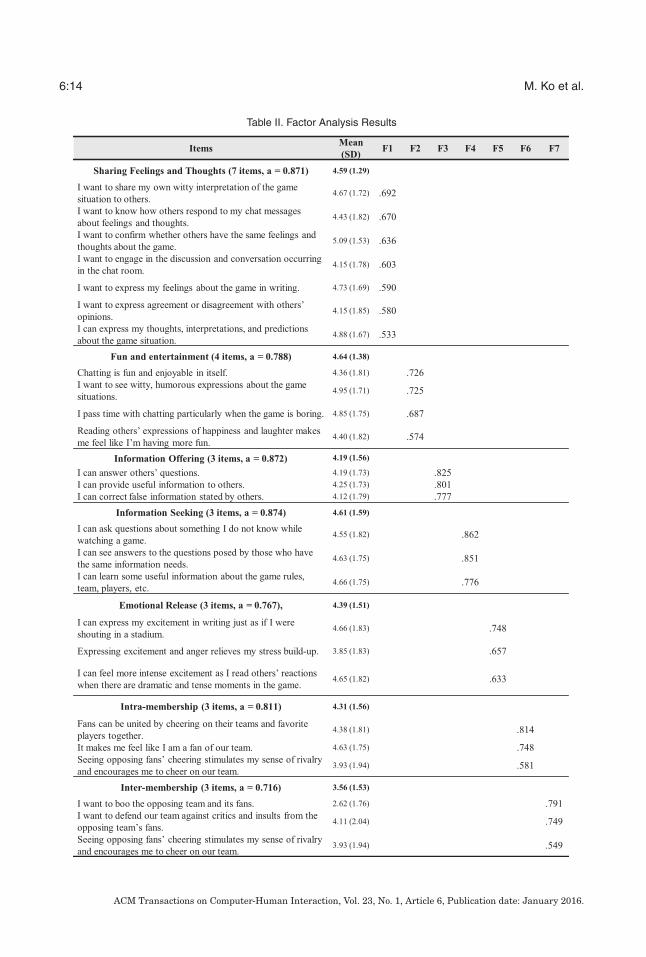
5.2.3. Factor Analysis Results. We conducted exploratory factor analyses on the surveyresponses with 26 questions about motives. The initial analysis (principal componentanalysis with varimax rotation) extracted five components with Eigenvalues over 1,which explained 62.7% of the variance. An examination of the scree plot elbow ledto the inclusion of two additional components (Eigenvalues > 0.8), which resulted inidentification of seven factors that explained 69.32% of the variance. To identify the keyitems for each component, we eliminated items with a lower factor loading value, whichdid not seriously affect the reliability of the factor. One item related to companionshipfrom co-viewing did not load on any components. Based on the selected items, wenamed each component as follows: sharing feelings and thoughts (seven items), funand entertainment (four items), information offering (three items), information seeking(three items), emotional release (three items), intra-membership (three items), andinter-membership (three items). The factors are described in Table II.
Factor 1 contained items related to sharing feelings and thoughts, which was the mostfrequently mentioned theme in the previous study. Some items in this factor concernedsharing feelings and thoughts about game play, as well as checking others’ responses.Furthermore, participants liked to discuss current events in the chat, although themean rates of these items were relatively lower than those of the other items.
Factor 2, fun and entertainment, was comprised of four items. Three items explainedthat the chat messages were fun to read or that chatting made watching games moreenjoyable. As shown in earlier research, users tended to communicate with others morefrequently when they felt bored. In addition, there was an item related to the act ofobserving others’ feelings functioning as a stimulant for feeling like “one of the crowd”(known as social facilitation [Guerin 1993]). In online sports viewing, exposure to co-viewers’ responses could facilitate feelings of enjoyment; for example, people might feelthat they are having more fun when they see others’ laughter.
Factor 3 was composed of items related to information offering, such as “providinguseful information to understand game events” and “answering others’ questions.” Ac-cording to an offline public sports viewing study [Eastman and Land 1997], teachingabout sports has the function of legitimizing and socially rewarding participants. De-spite the fact that these opportunities are limited to those who have sufficient knowl-edge of sports, the participants in this study generally agreed that they could offerinformation to other viewers.
Factor 4 comprised items related to information seeking, such as “asking questions”and “learning by reading others’ messages.” This is closely related to conventionalstudies about motives for (offline) co-viewing because those who want to become fansor learn about the rules or teams could benefit from co-viewing (as opposed to solitaryviewing) [Gantz 1981; Wenner and Gantz 1998].
Factor 5 comprised items about emotional release. The items in this factor reflectedthe users’ desire to express their emotional feelings while watching sports. According tothe literature, the expectation of releasing one’s emotions functions as a key motive for
ACM Transactions on Computer-Human Interaction, Vol. 23, No. 1, Article 6, Publication date: January 2016.
6:14 M. Ko et al.
Table II. Factor Analysis Results
ACM Transactions on Computer-Human Interaction, Vol. 23, No. 1, Article 6, Publication date: January 2016.
Understanding Mass Interactions in Online Sports Viewing 6:15
sports viewing [Gantz 1981; Gantz and Wenner 1991; Krohn et al. 1998; Wenner andGantz 1998]. Enjoyable sports viewing involves applauding and shouting in pleasure,as well as yelling in displeasure or anger. In online sports viewing, such usage behavioris similarly observed, but in the different format of online chats.
Items related to membership were grouped into Factor 6 and Factor 7. Factor 6was related to intra-membership, which referred to fanship or group affiliation [Wann1995]. The items in this factor focused on the use of chats to cheer on their favoriteteams and to strengthen group cohesion. Factor 7 was related to inter-membership,reflecting competitive behaviors against other teams. The items included jeering theopposing teams/fans and defending their own team against insults from the opposingteam’s fans. Interestingly, both factors shared an item about competing for cheering.
5.3. Discussion
We discuss the survey results for each motive. Fun and entertainment was given thehighest rating by the participants (M = 4.64, SD = 1.38); 19.2% of the participantsgave their highest rating to this motive. Similarly, the average rating of sharing feelingsand thoughts was relatively high (M = 4.59, SD = 1.29), and 9.4% of the participantsmost like to share feelings and thoughts motive. Many Naver Sports viewers enjoy chatsprimarily to deal with boredom from a current video, similar to conventional social TVviewers [Weisz et al. 2007], they also often enjoy sharing feelings and thoughts withother co-viewers, similar to in offline sports viewing settings [Eastman and Land 1997].
Interestingly, many participants gave a relatively high rating to the informationseeking motive (M = 4.61, SD = 1.59); the largest number of the participants (24.2%)rated information seeking as their strongest motive. However, another information-related motive, the information offering, was not that highly rated (M = 4.19, SD =1.56). Nevertheless, we found that special user segments enjoy offering informationto other viewers; 11.9% of the participants rated this motive most highly. This resultcould be related to our previous analysis results on interactive experience in NaverSports. In the quantitative analysis, we found that the number of information offeringchats was smaller than that of information seeking chats. Namely, there are a numberof information seekers in Naver Sports and they often ask questions, but the numberof those who like to answer their questions is relatively smaller.
The emotional release (M = 4.39, SD = 1.51) and the intra-membership (M = 4.31,SD = 1.56) motives were rated similarly. Of participants, 14.4% and 15.6% markedemotional release and the intra-membership as their most significant motive, respec-tively. These motives are related with fanship behaviors such as releasing emotions(e.g., shouting) and actively cheering for a team with others [Gantz 2013]. Namely,those who have strong fanship may experience this motive strongly. However, a rela-tively small number of participants who rated inter-membership motive highest (5.6%).Inter-membership was also given the lowest rating (M = 3.56, SD = 1.53). This is prob-ably because inter-membership is based on stronger fanship than intra-membership(its behavior tends to be more active and wild).
In the next section, we investigate how such motives are related with online sportsviewing behaviors.
6. RQ3: USAGE PATTERNS AND THEIR RELATIONSHIP WITH MOTIVES
We examined how the usage characteristics of social TV were related to motives usingmultiple regression analyses. These analyses can provide design suggestions for onlinesports viewing systems. Online sports viewing systems designers should focus on thisto know how to support particular usage patterns and boost specific motives. In thefollowing section, we present the metrics of the usage characteristics and then explainthe multiple regression results.
ACM Transactions on Computer-Human Interaction, Vol. 23, No. 1, Article 6, Publication date: January 2016.
6:16 M. Ko et al.
6.1. Variables
The dependent variables were the seven motive scores; that is, each motive’s score wasthe mean of all ratings. The usage characteristics were used as independent variablesand were classified into three types: demographics, viewing behavior, and chattingbehavior. The values of these variables were measured by analyzing the survey resultsand chat dataset. The independent variables are described as follows.
—Demographics: We used three variables related to demographics: age (Age), gender(Gender), and hours of computer use (ComputerUseHours). Because gender is acategorical variable, we represented it in a regression model using a single dummyvariable (men = 0 and women = 1).
—Viewing behavior: We introduced the following five variables to represent view-ing behavior: frequency of Naver Sports use (ViewingFrequency); viewing places:home, work, and on the move (LocationHome, LocationWork, and LocationMobile);existence of co-viewer (WatchingAlone); use of smart devices for viewing (Smart-DeviceUse); and multitasking while watching (Multitasking). The frequency of NaverSports use was measured with a four-point Likert scale. The remainder of the vari-ables used binary answers (e.g., Are you at home when you watch Naver Sports?),and these variables were also dummy-coded in the regression model.
—Chatting behavior: The variables used to describe chatting behavior were extractedfrom both the survey and chat data analyses. First, we used three variables fromthe survey: frequency of checking a chat room using a seven-point Likert scale(CheckingChats), frequency of reporting abusive users using a seven-point Likertscale (AbuseReporting), and use of a team-specific chat filter with a binary scale(TeamFiltering). In addition, we used five usage variables from the chat dataset:total number of chats (ChatTotalCnt), mean message length (MsgLength), propor-tion of positive/negative messages (SentimentPosRate, SentimentNegRate), fanship(FanLoyalty), and proportion of question-type comments (containing a question markor 5W1H in order to understand its relationship with the information seeking mo-tives; QuestionRate).
Here, we explain in detail how we measured chat sentiment and fanship from chats.
6.1.1. Sentiments of Chats. Analyzing the chat sentiment (e.g., positive, negative, orneutral) provided valuable insight into understanding the characteristics of mass in-teractions in social TV. Because the message length was short and the vocabulary setsvaried widely depending on the TV content, we found that fixed sentiment lexicon-based approaches did not work well in these environments [Pang and Lee 2008]. Wedevised a simple approach to learning sentiment lexicon, inspired by the fact thatemoticons are good sentiment indicators in text messages. Initially, a set of chat mes-sages containing positive emoticons in Korea (e.g., , ) and a set of chat messagescontaining negative emoticons (e.g., , ) were selected. By treating each chatmessage as a document, we calculated the term frequency-inverse document frequency(tf-idf) to weight terms in each chat as follows:
Wt,c = t f (t, c) · idf (t, C), idf (t, C) = log|C|
|{c ∈ C : t ∈ c}| (1)
where t f (t, c) was the number of times term t occurred in chat c (how important theterm was in the chat message) and idf (t, c) was calculated by inversing the number ofchats containing term t among the total set of chats C (how much the term could bedistinguished the chat). According to tf-idf weight, the terms in a chat were weightedmore highly when they occurred many times in the chat and when a small numberof documents included the term. Next, we constructed a m-dimensional term vector of
ACM Transactions on Computer-Human Interaction, Vol. 23, No. 1, Article 6, Publication date: January 2016.

Understanding Mass Interactions in Online Sports Viewing 6:17
a message where the ith entry was a tf-idf value of the ith term and m was the totalnumber of terms used in all of the messages [Manevitz and Yousef 2001]. By runninga feature selection algorithm that reduced the dimension of the vector space (e.g., thegain ratio method in Weka 3.7), we selected the top 300 most often contributed termsto comprise the sentiment lexicon. Some examples of the selected terms with positivesentiment were “ (fascinating),” “ (amazing),” “ (oh),” “ (shot),” and “(good),” while those with negative sentiment were “ (jerk),” “ (Korean curse),”“ (ah, please),” “ (bitter),” “ (disappointing),” and “ (irritated).”
For sentiment classification, we used the features of positive, negative, and neutralscores. For a given message, the positive/negative scores were calculated by countingthe positive/negative terms based on the lexicon, and the neutral score was the absolutedifference of positive and negative scores [Pang and Lee 2008]. We generated a train-ing dataset by randomly selecting 2,000 messages and performing manual sentimentclassification. Then, we trained a classification model using a Support Vector Machine(SVM). The 10-fold cross validation results exhibited an accuracy of 0.82, which issuperior to conventional SVM-based document classification methods [Manevitz andYousef 2001]. Its accuracy in our dataset is given as 0.70.
6.1.2. Fanship Behavior. Naver Sports asks users to express their fan identity by select-ing a favorite team in the game for cheering (refer Section 3). Online sports viewerslike to choose a team icon and post chat messages about both teams during a match(e.g., cheering and jeering), similar to how fans wear a team’s uniform to cheer in astadium. We measured fanship based on the consistency of the team selection for chat-ting. Namely, we assumed that a user had high fanship if they consistently posted fora specific team. Our method did not consider the sentiment of chats, which could be apotential limitation. For example, fan loyalty could be zero if a user posted the samenumber of chats for each team, but positive ones to a favorite team and negative ones toan opposing team. However, according to our analysis of 22,512 chats of 2,383 sampledusers, such cases of missing high fanship were rarely observed. Most users preferredto select a specific team for chatting instead of switching between two teams in a game;85% of the users posted chat messages to only one team in a game. In addition, thechats of the other users who posted to both teams in a game tended to be highly skewedto a specific team (ratio of the number of chats between two teams in a game = 7.8:1),and this tendency was even stronger for active users who left more than 5 chats (ratio =8.7:1).
For a given user (u), we calculated the fraction of chats about a team (t) by the user(= pu,t), which was computed by dividing the number of user chat messages about ateam (= Cu,t) by the total number of user chat messages (= ∑
t∈TuCu,t). Using this
team support distribution, we calculated the entropy of the user. Intuitively, the higherthe entropy value, the greater the randomness. Entropy was maximized when a useruniformly supported all teams. Then, we normalized the entropy and negated its value,which resulted in the following fan loyalty metric for a user, as follows:
FanLoyaltyn = 1 −(−∑
t∈Tupu,t · log2 pu,t
log2 |T |)
, pu,t = Cu,t∑t∈Tu
Cu,t(2)
where Tu was the set of teams for which the user posted messages and representedthe number of teams participating in the season. The fan loyalty values ranged from 0to 1. If a user posted chats on a single team, the user’s fan loyalty was 1. A user’s fanloyalty was zero if equal numbers of chats were posted for every team.
ACM Transactions on Computer-Human Interaction, Vol. 23, No. 1, Article 6, Publication date: January 2016.

6:18 M. Ko et al.
Table III. Multiple Regression Analysis Results
6.2. Usage Statistics
Our usage analysis reveals Naver Sports users’ viewing and chatting behaviors.Table III shows the descriptive statistics of our survey and log analysis results ofviewing and chatting behaviors. First, our survey results show various aspects of theirviewing contexts. The survey respondents answered that they usually use Naver Sportsto watch sports games about three times per week, and their viewing mostly occurredat home rather than at work places (home: 88.3%, work: 19.4%). Also, most respon-dents (94.8%) watch sports videos alone rather than watching it with co-located others.Interestingly, a fair number of respondents reported that they like to use mobile de-vices for their watching (61.6%). Moreover, half of respondents said that they are likelyto do other work simultaneously while watching a sports video (55.3%). Their sec-ond tasks mostly involved watching another TV program, doing house work, and webbrowsing.
Second, we quantified diverse chatting behaviors via the survey and chatting logdata analysis. Most respondents tend to be active in checking the chat room; 59.6%answered that they (strongly) frequently check others’ chats. We also found two differ-ent chatting usages related to reporting abusive users: 42.6% of respondents answeredthey (often) use the reporting function, while others never or rarely use the function.According to our later analysis, this function usage is mostly employed by those withinformation seeking/offering motives. In addition, similar to our quantitative analysisin Section 4, we found high fan loyalty in users tending to focus chat messages on oneor two teams (fan loyalty based on Equation (2) was 0.747), and their chat messagestended to be short. Finally, the proportions of positive and negative chats were alsoobserved similarly to our previous observations in Section 4 (positive: 37.1%, negative13.2%).
ACM Transactions on Computer-Human Interaction, Vol. 23, No. 1, Article 6, Publication date: January 2016.
Understanding Mass Interactions in Online Sports Viewing 6:19
Fig. 3. Variables significantly related to the sharing feelings and thoughts motive.
Fig. 4. Variables significantly related to the fun and entertainment motive.
Fig. 5. Variables significantly related to the emotional release motive.
6.3. Regression Analysis Results
A series of multiple linear regressions were conducted. Table III shows the analysisresults, and Figure 3, 4, 5, 6, 7, 8, and 9 are its graphical representations. All regres-sion models were significant, and their R-squared values were comparable to those ofearlier UGT research [Joinson 2008; Spiliotopoulos and Oakley 2013] (see Table III).Furthermore, we note that our regressions models did not suffer from multicollinearity,
ACM Transactions on Computer-Human Interaction, Vol. 23, No. 1, Article 6, Publication date: January 2016.

6:20 M. Ko et al.
Fig. 6. Variables significantly related to the information seeking motive.
Fig. 7. Variables significantly related to the information offering motive.
Fig. 8. Variables significantly related to the intra-membership motive.
Fig. 9. Variables significantly related to the inter-membership motive.
ACM Transactions on Computer-Human Interaction, Vol. 23, No. 1, Article 6, Publication date: January 2016.

Understanding Mass Interactions in Online Sports Viewing 6:21
which can mislead interpretation of the true nature of the responses. We calculated thecorrelation values for the independent variables to examine potential multicollinearity.While several independent variables were correlated, they were below the critical valueof multicollinearity (threshold = 0.8). The strongest correlation was observed betweenSmartDeviceUse and LocationMobile (r = 0.468, p < 0.001). The variance inflationfactor (VIF) for each independent variable was lower than the critical value of mul-ticollinearity (threshold = 10). The highest value was 1.356 for the SmartDeviceUsevariable.
6.4. Discussion
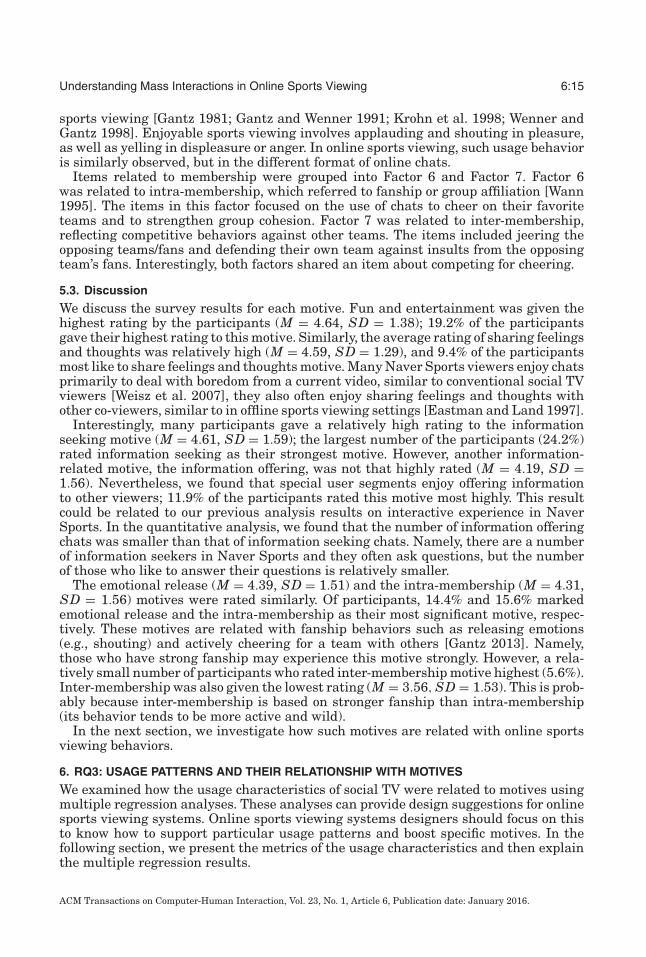
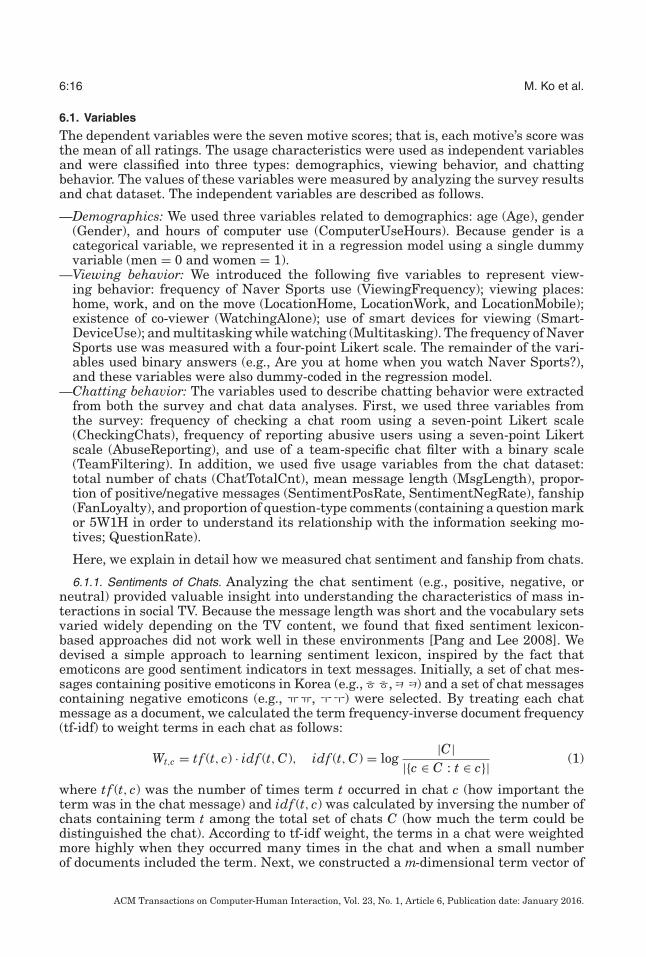
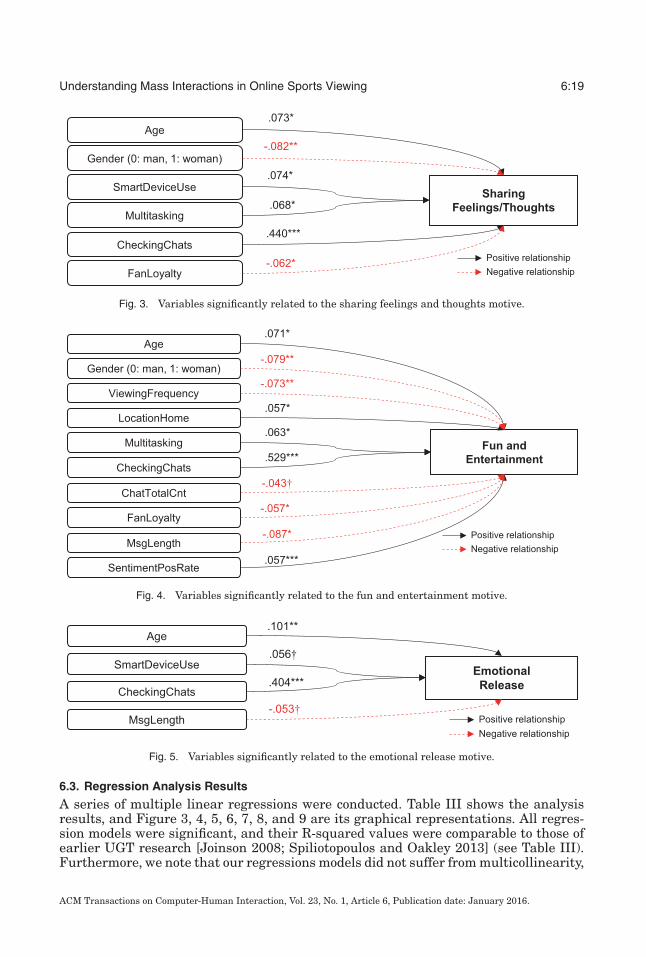
Among the demographic variables, Age and Gender exhibited a significant relationshipwith some of the motives. Sharing feelings/thoughts, entertainment, and emotionalrelease motives were positively correlated with Age; however, sharing feelings/thoughtsand entertainment motives were negatively correlated with Gender, which indicatesthat men might be more motivated by these than women. Also, Gender was negativelycorrelated with information offering. This indicates that men like to offer informationto others more than do women. These results may result from the different levels ofparticipation in sports between the two groups. According to the demographics of sportsfans [Tang and Cooper 2012], men tend to enjoy sports more actively (e.g., viewing andplaying) than do women. Therefore, such experiences might empower them to feel morecompetent in offering information to others.
Several usage patterns—that is, viewing and chatting behaviors—significantly re-flected the users’ motives for enjoying mass online interactions. Checking chats(CheckingChats) emerged as the strongest predictor of all motives. Intuitively, fre-quently viewing the chat screen represents a strong motive for enjoying chats withothers.
Sharing feelings/thoughts was positively associated with multitasking (Multi-tasking) and the use of smart devices for viewing (SmartDeviceUse). This indicatesthat users with this motive desired to check others’ responses occasionally whilesimultaneously doing other tasks, or that they were compensating for the lack ofinteraction opportunities afforded by the chatting functions of smartphones. Fanship(FanLoyalty) was also negatively correlated with the sharing feelings/thoughts motive,which indicates that those users who liked to share feelings/thoughts tended to chatwhile watching games among numerous teams.
The entertainment motive was positively correlated with multitasking (Multitask-ing), as well as negatively correlated with fanship (FanLoyalty), frequency of onlinesports viewing (ViewingFrequency), and total number of chats (ChatTotalCnt). Thisindicates that users with a high entertainment motive may have spent their extra timenot only watching games featuring their favorite teams, but also those featuring otherteams as well. Indeed, our data demonstrate that they tended to post short positivemessages and to respond frequently to amusing chat messages using simple emotionalexpressions such as emoticons.
The predictors of the emotional release motive were similar to those of the sharingfeelings/thoughts and entertainment motives. As with the entertainment motive, theemotional release motive was negatively associated with the length of chat messages(MsgLength), which was perhaps related to frequent use of simple interjections andemoticons. In addition, similar to the sharing feelings/thoughts motive, the use of smartdevices for viewing (SmartDeviceUse) was positively correlated with the emotionalrelease motive. This may have resulted from the fact that smart devices provide aconvenient method for releasing emotions at any time and place.
The information offering/seeking motives were positively associated with num-ber of chat messages (ChatTotalCnt). Users who frequently participated in message
ACM Transactions on Computer-Human Interaction, Vol. 23, No. 1, Article 6, Publication date: January 2016.
6:22 M. Ko et al.
exchanges with others were more likely to perceive chats as useful sources of informa-tion. In addition, reporting abusive users (AbuseReporting) was positively correlatedwith both motives, which represented the users’ efforts to develop a better communica-tion environment for information sharing. Furthermore, information offering/seekingwere negatively correlated with fanship (FanLoyalty), which implies that informativeusers tended to watch the sports games of numerous teams rather than focus on favoriteteams (and possibly acquired more knowledge about baseball games as a consequence).
There were additional significant variables for predicting the information offering/seeking motives. Information seeking was positively correlated with the use of smartdevices for viewing. Due to the limited interaction possibilities while watching sportsgames on smart devices (SmartDeviceUse), the chat room could be the most convenientsource of information; thus, smart device viewers would value the usefulness of chatsfor information seeking purpose. Interestingly, the rate of questions posted (Question-Rate) was not a significant predictor of information seeking. It appears that users’information needs could often be satisfied through reading the questions and answersposed and received by others with the same informational needs.
The membership related motives were significantly related to behaviors reflectingfanship and group affiliation [Wann 1995]. Those with these motives tended to useonline sports viewing more frequently. Furthermore, they exhibited a distinguishedchatting behavior of concentrating on a few teams (i.e., high fanship). The intra-membership motive had a significant relationship with the use of team-specific chatfiltering (TeamFiltering). This suggests that those who had a high fan-membershipwanted to communicate with other members. Chat length (MsgLength) was also neg-atively correlated with intra-membership, partly because they frequently used simplecheering expressions.
7. DESIGN IMPLICATIONS FOR ONLINE SPORTS VIEWING SYSTEMS
In this section, we summarize our analysis results and present practical design impli-cations based on the key findings.
7.1. Dealing with Information Overload
Our study results in Section 3 show that numerous chats were posted every minute(47.09 new chat messages per minute). This could distract viewers in their chattingand watching of sports games, as in prior studies [Weisz et al. 2007; Geerts et al.2008]. However, our content analysis of chats reveals that the chats tend to be topi-cally cohesive, and this enables viewers to exchange basic conversations. Furthermore,our follow-up survey also supports this (n = 1,123; for the same survey respondentsdescribed in Section 4).
We first asked the participants using a 7-point Likert scale, whether it is difficult toenjoy both watching sports games and chatting in Naver Sports. Interestingly, a major-ity answered that they do not have difficulty both watching sports games and enjoyingchats (56.8%, >= 5 out of 7 points). We next asked the reason for the answer using anopen-ended question. The most prevalent answer was that they are mostly satisfiedwith basic conversations such as sharing feelings and thoughts despite frequent chatmessages. One participant mentioned, “I feel that chats in Naver Sports are usuallyabout a current game or player, not about serious topics. So, [I don’t feel any difficultyin both watching a game and enjoying chats because] just checking other co-viewers’overall mood is enough for me.”
However, a considerable fraction of viewers reported difficulties in enjoying bothsports video and chats (33.1%, <= 3 out of 7 points). In response to the subsequent open-ended question, they mostly mentioned the information overload problem. It mostly oc-curred with multiple chat topics in a single chat room. For example, some viewers want
ACM Transactions on Computer-Human Interaction, Vol. 23, No. 1, Article 6, Publication date: January 2016.

Understanding Mass Interactions in Online Sports Viewing 6:23
to have a discussion about a particular player or to conduct questioning/answering, butthese types of chats are often overwhelmed by other chats expressing feelings andthoughts. Another representative case was related to multitasking. A fair number ofrespondents reported that they have difficulty in following the accumulated messages,particularly when they returned after doing another thing. Considering that a con-siderable percentage of online sports viewers perform multitasking according to oursurvey (55.29%) and this behavior is correlated with one of the key motives (i.e., shar-ing thoughts and feelings), it could be important to help multitasking users deal withthe problem of information overload.
One potential method of mitigating such problems is to implement a computationalmechanism for summarizing the trending topics over time while the TV program isin progress. For example, it is possible to automatically detect trending topics anddisplay related keywords [Pan et al. 2013] or to present graphical representations of themessage posters’ sentiments over a period of time [Marcus et al. 2011]. Furthermore, achat navigation tool could be introduced supporting a time-based slider annotated withchat density (and associated sentiment) to enable quick review of the public responses.
7.2. Fostering Information Sharing Environments
According to our study, a number of the Naver Sports users showed information seekingand offering motives, and 8.7% of the chats concerned questioning/answering. Inter-estingly, these motives were significantly and positively correlated with frequency ofreporting abusive users. These results could be interpreted as viewers making signifi-cant efforts to foster a better communication environment for information sharing. Inthe following, we discuss practical design implications for moderating abusive usersand supporting information seeking.
Our follow-up survey results showed that many respondents (40.2%) were unsatisfiedwith the current function of manually filtering abusive users in Naver Sports (i.e.,a user-based message filtering approach in which a viewer can filter messages fromblocked users). Most respondents mentioned difficulty in managing a long list of abusiveusers. Due to the immense number of concurrent viewers and aggressive languageusage commonly observed in sports spectating [Russell 2008], the current Naver Sports’manual moderation techniques would not scale well. Therefore, to support viewerswith information seeking or offering motives, social TV designers should carefullyconsider functions for abuse reporting. Introducing tools that leverage the collectiveintelligence of viewers would assist in reducing the manual intervention cost, and alsoassist users with personalizing their message filtering. For example, abusive words orinsults collaboratively chosen could be used as filters.
We found that the chat room could be helpful for information seekers who use smartdevices for viewing due to the limited interaction possibilities (the information seekingmotive is positively related to smart device use). However, information seeking couldbe still challenging in a single public space with a large number of users becausethis leads to high chat speeds. For example, some useful information can be oftenhindered by a large volume of interfering messages like interjections and cheers/jeers.Designating a separate space for information sharing (such as a Social Q&A) could be anintuitive solution. Alternatively, structured tags could be introduced, allowing filteringof messages based on tags. Enabling automatic identification of question/answer pairsin a chat would help users quickly meet their information needs.
7.3. Leveraging Membership Motives
Our analysis results showed that one of the representative motives for chatting inonline sports viewing was related to membership. Viewers in Naver Sports like to havea feeling of watching and cheering together with other fans, and considered these their
ACM Transactions on Computer-Human Interaction, Vol. 23, No. 1, Article 6, Publication date: January 2016.

6:24 M. Ko et al.
representative motives (i.e., sharing feelings and thoughts, membership motives). Forexample, one participant in our motive study commented concerning the membership,“I can cheer on my favorite teams with other fans,” and another said, “When I cheertogether, I feel a sense of unity.” Awareness of the presence of co-viewers can helpgratify the membership motive. Naver Sports basically supports presence awarenessby displaying the total number of chats and the total number of current co-viewers.Considering membership motives, presence awareness of co-viewers could be increasedby displaying team-level statistics of user activities.
Further, the membership motive was significantly associated with behaviors that ex-pressed fanship, for example, skewed team selection and team filtering use. Therefore,to increase the membership motive, expression of fan identity should be supported,and better group companionship among viewers cheering for the same team should beestablished. Possible methods for encouraging fan identity could include showing thenumber of fans viewing the game online (e.g., enabling fan check-ins) and adopting so-cial reinforcement mechanisms such as badges for fan loyalty [Kraut and Resnick 2012](note that Naver Sports currently does not adopt any social reinforcement mechanismsexcept for choosing a team page for chatting). Supporting structured mechanisms forinteractive cheering (e.g., voting for the best players and cheering for current players)could be also incorporated to facilitate fan collaboration.
In addition, mining online viewing activities in social TV enables deeper understand-ing of user behavior, such as fan loyalty, and content characteristics such as scenes ofinterest. For example, we measured user fanship by adopting the scale from Wann andBranscombe [1993] and conducting multiple regression analyses to predict fanship us-ing the same independent variables used in Section 6, confirming that fanship wassignificantly correlated with viewing and chatting behavior (R2 = 0.203, p < 0.001).Mining such information could be useful for boosting membership motives and to en-able a range of new applications for personalized sports marketing and advertising, aswell as more personalized content recommendation services for video highlights andrelevant news articles about teams and players of interest.
8. LIMITATIONS
As with most single-site work, the generalizability of this work is limited, and addi-tional research using other online sports viewing sites, for example, YouTube Live andMLB.TV, is necessary. Furthermore, it would be beneficial to analyze the mass interac-tions in second-screen social TV services such as Twitter and GetGlue which providea public space for mass interactions among TV viewers where live video streamingis not included. Another aspect worth exploring is analysis of mass interactions indifferent TV genres such as drama, comedy, and movies. In this work, we focused onthe sports genre, which usually encourages active viewer participation in social TVservices [Geerts et al. 2008]. We believe that more in-depth understanding of generalonline viewing behaviors could be gained through comparison of diverse genres (e.g.,by examining GetGlue data). Finally, while the general behaviors of sports fans areuniversal, the participants of this study were limited to Koreans. Identifying key dif-ferences between different cultures will assist in generalizing the results presentedhere.
9. CONCLUSION
Our work aimed to deepen our understanding of mass interaction in online sportsviewing by analyzing chat interaction data in Naver Sports, the largest online sportsviewing service in Korea and conducting a large-scale survey study.
Specifically, our study first revealed several characteristics of mass interactions inonline sports viewing. There were a number of co-viewers in Naver Sports, and the
ACM Transactions on Computer-Human Interaction, Vol. 23, No. 1, Article 6, Publication date: January 2016.

Understanding Mass Interactions in Online Sports Viewing 6:25
chat speed was fairly fast. We also found that most of the chats were related to asports game on a live video, and the chats also served many functions closely related tosports: commentating, emotional responding, cheering/jeering, and information seek-ing/offering. In addition, we identified seven key motives for mass interaction: sharingfeelings and thoughts, fun and entertainment, information seeking, information offer-ing, emotional release, intra-membership, and inter-membership. These motives weresignificantly related to specific usage patterns: multitasking and smart device usewith motive for sharing feelings and thoughts, short chat length with motives forentertainment/emotional release, chat frequency and abuse reporting with motivesfor information seeking/sharing, and fan loyalty in chat behavior with the motive formembership.
Our study results provide useful implications for designing online sports viewingsystems. First, we observed that information overload problems often occur due highchat speed and frequent multitasking behaviors in online sports viewing. Therefore,providing a summary of trending topics or chat navigation tools can help viewers todeal with information overload and better enjoy mass interaction with others. Second,we found a lot of chat messages related to information sharing behaviors. These chatmessages are valuable sources for satisfying viewers’ concurrent information needs.However, according to our study, these motives are hindered by limited interactionspaces such as mobile viewing and irrelevant chat messages. Better filtering functions,such as keyword-based filters or collaborative social filters, should be considered tofoster information sharing behaviors. Also, designating a separate space for informa-tion sharing (such as a Social Q&A) could be helpful. Finally, the membership motive isconsidered a key motive in online sports viewing. Presence awareness of co-viewers canbe helpful in gratifying the membership motive, for example, by displaying team-levelstatistics of user activities.
Sports have been popular among many people, and sports fan interactions haveevolved with the advent of new online media such as SNS and online sports viewingsystems. We made the first step toward understanding such fan interactions in a newmedia. Our results provide valuable insights for designing better interaction spacesthrough which sports fans cannot only have enjoyable spectating experiences, but alsocommunicate with each other to share information and build membership.
REFERENCES
J. G. Blumler and E. Katz. 1974. The Uses of Mass Communications: Current Perspectives on GratificationsResearch. Sage, Beverly Hills, CA.
Ceren Budak and Rakesh Agrawal. 2013. On participation in group chats on Twitter. In Proceedings of ACMWWW 2013. ACM, 165–176.
Pablo Cesar and David Geerts. 2011. Understanding social TV: A survey. In Proceedings of NEM Summit2011. New European Media (NEM), 94–99.
Robert B. Cialdini, Richard J. Borden, and Avril Thorne. 1976. Basking in reflected glory: Three (Football)field studies. J. Pers. Soc. Psychol. 34, 3 (1976), 366–375.
Toon Coppens, Lieven Trappeniers, and Marc Godon. 2004. AmigoTV: Towards a social TV experience. InProceedings of EuroITV 2004. ACM, 159–162.
Niloofar Dezfuli, Mohammadreza Khalilbeigi, Max Muhlhauser, and David Geerts. 2011. A study on inter-personal relationships for social interactive television. In Proceedings of EuroITV 2011. ACM, 21–24.
Susan Tyler Eastman and Arthur M. Land. 1997. The best of both worlds: Sports fans find good seats at thebar. J. Sport Soc. Issues 21, 2 (1997), 156–178.
Walter Gantz. 1981. An exploration of viewing motives and behaviors associated with television sports. J.Sport Soc. Issues 25, 3 (1981), 263–275.
Walter Gantz. 2013. Reflections on communication and sport: On fanship and social relationships. Commun.Sport 1, 1–2 (2013), 176–187.
ACM Transactions on Computer-Human Interaction, Vol. 23, No. 1, Article 6, Publication date: January 2016.

6:26 M. Ko et al.
Walter Gantz and Lawrenece A. Wenner. 1991. Men, women, and sports: Audience experiences and effects.J. Broadcasting Electron. Media 35, 2 (1991), 233–243.
David Geerts, Pablo Cesar, and Dick Bulterman. 2008. The implications of program genres for the design ofsocial television systems. In Proceedings of UXTV 2008. ACM, 71–80.
David Geerts, Ishan Vaishnavi, Rufael Mekuria, Oskar Van Deventer, and Pablo Cesar. 2011. Are we insync? Synchronization requirements for watching online video together. In Proceedings of ACM CHI2011. ACM, 311–314.
Bernard Guerin. 1993. Social Facilitation. Press Syndicate of the University of Cambridge.E. Han and S.-W. Lee. 2014. Motivations for the complementary use of text-based media during linear TV
viewing: An exploratory study. Comput. Hum. Behav. 32, 1 (2014), 235–243.Jee Yeon Hwang, Pol Pla i Conesa, Henry Holtzman, and Marie-Jose Montpetit. 2012. CommenTV: A time-
sensitive social commenting system for audiovisual content. In Proceedings of IEEE CCNC 2012. IEEE,84–88.
Beth Jacobson. 2003. The social psychology of the creation of a sports fan identity: A theoretical review ofthe literature. Online J. Sport Psychol. 5, 2 (2003), 1–14.
Adam N. Joinson. 2008. Looking at, looking up or keeping up with people? Motives and use of Facebook. InProceedings of ACM CHI 2008. ACM, 1027–1036.
Quentin Jones, Mihai Moldovan, Daphne Raban, and Brian Butler. 2008. Empirical evidence of informationoverload constraining chat channel community interactions. In Proceedings of ACM CSCW 2008. ACM,323–332.
Quentin Jones, Gilad Ravid, and Sheizaf Rafaeli. 2004. Information overload and the message dynamicsof online interaction space: Theoretical model and empirical exploration. Inf. Syst. Res. 15, 2 (2004),194–210.
Barbara K. Kaye. 2010. Going to the blogs: Toward the development of a uses and gratifications measurementscale for blogs. Atl. J. Commun. 18, 4 (2010), 194–210.
N. Klym and M. Montpetit. 2008. Innovation at the edge: Social TV and beyond. In MIT CommunicationsFutures Program (CFP).
Robert E. Kraut and Paul Resnick. 2012. Building Successful Online Communities: Evidence-Based SocialDesign. MIT Press.
Franklin B. Krohn, Mark Clarke, Eric Preston, Mike McDonald, and Bradley Preston. 1998. Psychologicaland sociological influences on attendance at small college sporting events. Coll. Stud. J. 32, 2 (1998),277–288.
Martin J. Lee. 1985. Self-esteem and social identity in basketball fans: A closer look at basking in reflectedglory. J. Sport Behav. 8, 4 (1985), 210–223.
James R. Lindner, Tim H. Murphy, and Gary E. Briers. 2001. Handling nonresponse in social science research.J. Agric. Education 42, 4 (2001), 43–53.
Larry M. Manevitz and Malik Yousef. 2001. One-class SVMs for document classification. J. Mach. Learn.Res. 2, 1 (2001), 139–154.
Adam Marcus, Michael S. Bernstein, Osama Badar, David R. Karger, Samuel Madden, and Robert C. Miller.2011. Twitinfo: Aggregating and visualizing microblogs for event exploration. In Proceedings of ACMCHI 2011. ACM, 227–236.
K. McPherson, K. Huotari, F. Y.-S. Cheng, D. Humphrey, C. Cheshire, and A. L. Brooks. 2012. Glitter:A mixed-methods study of Twitter use during glee broadcasts. In Proceedings of ACM CSCW WorkCompanion 2012. ACM, 167–170.
Merrill J. Melnick. 1993. Searching for sociability in the stands: A theory of sports spectating. J. SportManag. 7, 1 (1993), 44–60.
Mukesh Nathan, Chris Harrison, Svetlana Yarosh, Loren Terveen, Larry Stead, and Brian Amento. 2008.CollaboraTV: Making television viewing social again. In Proceedings of UXTV 2008. ACM, 85–94.
Jeffrey Nichols, Jalal Mahmud, and Clemens Drews. 2012. Summarizing sporting events using Twitter. InProceedings of ACM IUI 2012. ACM, 189–198.
Shimei Pan, Michelle X. Zhou, Yanggiu Song, Weihong Qian, Fei Wang, and Shixia Liu. 2013. Optimizingtemporal topic segmentation for intelligent text visualization. In Proceedings of ACM IUI 2013. ACM,339–349.
Bo Pang and Lilian Lee. 2008. Opinion mining and sentiment analysis. Found. Trends Inf. Retr. 2, 1–2 (2008),1–135.
Arthur A. Raney. 2006. Why we watch and enjoy mediated sports. In Handbook of Sports and Media (Inbook-Text-in-Chap). Taylor & Francis, 313–329.
ACM Transactions on Computer-Human Interaction, Vol. 23, No. 1, Article 6, Publication date: January 2016.
Understanding Mass Interactions in Online Sports Viewing 6:27
Gordon W. Russell. 2008. Aggression in the Sports World A Social Psychological Perspective. Oxford UniversityPress.
Garry J. Smith. 1988. The noble sports fan. J. Sport Soc. Issues 12, 1 (1988), 54–65.Tasos Spiliotopoulos and Ian Oakley. 2013. Understanding motivations for Facebook use: Usage metrics,
network structure, and privacy. In Proceedings of ACM CHI 2013. ACM, 3287–3296.Anthony Tang and Sebastian Boring. 2012. EpicPlay: Crowd-sourcing sports video highlights. In Proceedings
of ACM CHI 2012. ACM, 1569–1572.Tang Tang and Roger Cooper. 2012. Gender, sports, and new media: Predictors of viewing during the 2008
Beijing olympics. J. Broadcasting Electron. Media 56, 1 (2012), 75–91.Daniel L. Wann. 1995. Preliminary validation of the sports fan motivational scale. J. Sport Soc. Issues 19, 4
(1995), 377–396.Daniel L. Wann and Nyla R. Branscombe. 1993. Sports fans: Measuring degree of identification with their
team. Int. J. Sport Psychol. 24, 1 (1993), 1–17.Daniel L. Wann, Michael P. Schrader, and Anthony M. Wilson. 1999. Sports fan motivation: Questionnaire
validation, comparison by sport, and relationship to athletic motivation. J. Sport Behav. 22, 1 (1999),114–139.
Justin D. Weisz, Sara Kiesler, Hui Zhang, Yuging Ren, Robert E. Kraut, and Joseph A. Konstan. 2007.Watching together: Integrating text chat with video. In Proceedings of ACM CHI 2007. ACM, 877–886.
Lawrence A. Wenner and Walter Gantz. 1998. Watching sports on television: Audience experience, gender,fanship, and marriage. In Media Sport (Inbook-text-in-chap). Routledge, 233–251.
Steve Whittaker, Loren Terveen, Will Hill, and Lynn Cherny. 1997. Dynamics of mass interaction. In Pro-ceedings of ACM CSCW 1997. ACM, 257–264.
Dolf Zillmann, Jennings Bryant, and Barry S. Sapolsky. 1989. Enjoyment from sports spectatorship. InSports, Games, and Play in Social and Psychological Viewpoints (Inbook-Text-In-Chap). Lawrence Erl-baum Associates, 241–278.
Received January 2014; revised August 2015; accepted November 2015
ACM Transactions on Computer-Human Interaction, Vol. 23, No. 1, Article 6, Publication date: January 2016.