understanding nrega: a simple theory and some...
TRANSCRIPT

Understanding NREGA: A Simple Theory and Some Facts*
Diganta Mukherjee# and Uday Bhanu Sinha
Abstract
The government of India has implemented the National Rural Employment Guarantee Act (NREGA)
in recent past, to complement the income of the poor by providing them employment for certain
number of labour days in a year. In this paper, using a simple theoretical framework, we have
analysed the impact of NREGA scheme on (i) rural labour market, (ii) income of the poor households
and (iii) overall agricultural production. We show that in some situations the poor may exhibit a
backward bending supply curve of labour which may lead to an aggregate reduction in agricultural
output. This adverse production effect can arise even when the NREGA activities lead to a moderate
improvement in agricultural productivity. Some empirical facts validate our concerns and the data on
food prices tend to support our finding to some extent.
Keywords: NREGA, target income, labour supply, agricultural productivity, India, Asia
JEL Classification: I38, J22, J43
Corresponding Author: Uday Bhanu Sinha, Department of Economics, Delhi School of Economics,
University of Delhi, Delhi 110007, India. Fax: +91-11-2766 7159
Email: [email protected]
This paper is published as :
Mukherjee, D. and Sinha, U. B., 2012, “Understanding NREGA: A simple theory and
some facts” in K. Narayanan and N. S. Siddharthan (eds.), Human Capital and
Development: The Indian Experience, Springer India, pp. 103-128.
* Acknowledgement: We are grateful to Nancy Chau, Deepti Goel, Bishwantath Goldar and J. V. Meenakshi for
helpful comments on an earlier version of this paper. # Diganta Mukherjee, Indian Statistical Institute, Kolkata, India, [email protected]

1
Introduction
The policy of employment guarantee scheme (EGS) is well known since the 1817 Poor Employment
Act and the 1834 Poor Law Amendment Act in Great Britain (Blaug, 1963, 1964), and the New Deal
programs of the 1930s in the United States (Kesselman, 1978; Bernstein, 1970), and it was considered
an important element of relief policies during natural disasters and economic downturns. In recent
past, this kind of schemes were followed both in developed and developing countries with multiple
objectives such as poverty reduction, building and maintaining public infrastructure, improving
bargaining power of the workers etc. Among others, some notable examples of such schemes mainly
for poverty alleviation are as followed by Chile (1987), India (1978), Pakistan (1992), Bangladesh
(1983), Philippines (1990), Botswana (1960, Kenya (1992).
The EGS is a policy of direct transfer to the poor through the provision of public works (Drèze and
Sen, 1991; Lipton 1996; von Braun, 1995) satisfying the property of self selection (Besley and Coate,
1992; Besley and Kanbur, 1993) and the magnitude of such direct transfer benefits was empirically
studied (Ravallion,1991; Ravallion et al.,1993). The earlier studies on rural public works programs
emphasized its role as income insurance in the presence of seasonality in agrarian labour market
(Basu, 2007), for building longer term capital assets (Basu, 1981), preventing dislocation of families
in search of jobs and food (Drèze and Sen, 1991), affecting rural-urban migration (Ravallion, 1990).
Though the policy of employment guarantee schemes are commonly followed by governments in both
developing and developed countries alike as a relief policy, there is very little by way of formal
theoretical modelling to understand the issue. Recently Basu et al (2010) provides a theoretical
framework to analyse both the positive and normative implications of such a policy in a spectrum of
labour market structures. While the introduction of such a scheme introduces a contestability in the
labour market where government is another employer, however the outcome with respect to wages
and overall level of employment in the labour market would depend on the “degree of distributional
and/or efficiency concerns of the planner”. In this paper, we analyse the impact of NREGA scheme on
(i) rural labour market, (ii) income of the poor households and (iii) overall agricultural production.
When the income from NREGA alone can be a substantial part of the target income of the poor, the
poor may exhibit a backward bending supply curve of labour which may lead to an aggregate
reduction in agricultural output. This adverse production effect can happen even when the NREGA
activities lead to a moderate improvement in agricultural productivity.
Consider the scenario where there exists a labour market with demand and supply of labour and a
wage rate. Even if the wage is competitively determined, it may not be adequate for the poor
household to reach their target income; what they consider as means of a decent living for their

2
households. Envisaging situations like these, the Indian government from time to time has
implemented different policies to complement the income of the poor. The National Rural
Employment Guarantee Act (NREGA) is one such policy of EGS which is introduced in recent past.
Passed by the Lok Sabha on August 23, 2004 and signed by the President of India on September 5,
2005, NREGA has been hailed as a major initiative in the Government of India’s commitment to
providing an economic safety net to India’s rural poor. The NREGA extends to all rural areas of India,
including Fifth and Sixth Schedule areas, except the State of Jammu and Kashmir. In this paper we
would provide a conceptual framework and also some empirical facts for understanding the different
plausible impacts of NREGA. Some of the impacts have already been documented by different studies
(see Mathur, 2007; Mehrotra, 2008). In the following subsections we first outline the scope of the
scheme and the debate that surrounds it.
1.1 The Scheme: National Rural Employment Guarantee Act of India, 20051
Data show that 71.9% of India’s population still resides in rural areas (2002), and given that the
majority of India’s poor also resides in rural areas, the NREGA can be thought of as a policy to boost
rural income, stabilize agricultural production and reduce the population pressure in urban areas
through migration.
Some of the original provisions of the NREGA were as outlined below.
(i) Every household in the rural areas of India shall have a right to at least 100 days of guaranteed
employment every year for at least one adult member, for doing casual manual labour at the rate of
Rupees 60 per day;
(ii) Only productive works shall be taken up under the Programme. The State Council shall prepare a
list of permissible works as well as a list of “preferred works”. The identification of preferred works
shall be based on the economic, social and environmental benefits of different types of works, their
contribution to social equity, and their ability to create permanent assets;
(iii) The Programme may also provide, as far as possible, for the training and up-gradation of the
skills of unskilled labourers;
(iv) Wages may be paid in cash or in kind or both, taking into account the guidelines and
recommendations of the State Council on this matter as far as possible;
(v) Employment shall be provided within a radius of 5 kilometres of the village where the applicant
resides at the time of applying. In cases where employment is provided outside such radius, it must be
provided within the Block, and transport allowances and daily living allowances shall be paid in
accordance with Programme Rules;
1 This section borrows from Basu, Chau and Kanbur (2005).

3
(vi) In cases where at least twenty women are employed on a worksite, a provision shall be made for
one of them to be deputed to look after any children under the age of six who may be brought to the
worksite, if the need arises. The person deputed for child-minding shall be paid the statutory
minimum wage;
(vii) A proportion of the wages, not exceeding 5%, may be deducted as a contribution to welfare
schemes organized for the benefit of labourers employed under the Programme, such as health
insurance, accident insurance, survivor benefits, maternity benefits and social security schemes.2
The NREGA scheme also comes with two important riders:
(i) Public works programmes should not compete with agricultural labour hiring decisions and
(ii) Public works programmes should generate a productive asset that directly impacts agricultural
productivity.
However, with most of Indian agriculture characterized by seasonality - a lean season when
agricultural labour demand is low and a harvest season when labour demand is high - it was
reasonably assumed that the public employment, guaranteed for at least 100 days, will be instituted
during the lean season when the rural labour force is most vulnerable. Some of the performance
parameters of the scheme are illustrated in Table 1, where we outline the spread of the programme in
different states of the country, in terms of number of districts covered, funds and its utilisation,
coverage in terms of man-days and number of households covered. The general pattern of these
performance indicators remains stable even up to 2010 - 11.3
1.2 The Debate
NREGA is supposed to alleviate rural poverty, but the operational dimensions of the NREGA have
been subject to much debate regarding the efficacy and targeting of the act. NREGA has attracted
mixed reactions from economists and policy analysts.4 There has been considerable discussion on
whether the employment has been successfully targeted to the poor, or there are leakages to those
above the poverty line. The most detailed evaluation so far has been undertaken by Dreze and Khera
2 There are eight specific types of works listed in the NREGA: (i) water conservation and water harvesting; (ii)
drought proofing including afforestation; (iii) irrigation canals; (iv) provision of irrigation facility to land-owned
by SC and ST, land of beneficiaries of land reforms and of Indira Awaas Yojana (IAY) (rural housing for poor);
(v) renovation of traditional water bodies; (vi) land development; (vii) flood control works; (viii) rural
connectivity to provide all weather access; and (ix) any other work, which may be notified by central
government in consultation with state government (see Mehrotra, 2008 for more discussion on this issue) . 3 All the data cited in this paper are from the relevant Government of India websites like http://www.agricoop.
nic.in/ and http://nrega.nic.in/netnrega/home.aspx. Further calculations are done by authors. 4 Much has been written about NREGA both in favour and against the programme. Some argued that the
NREGA was unnecessary because in any case poor agricultural workers had a very low unemployment rate
(Business Standard, December 25, 2004).

4
(2009), covering six states in 2007-08. Dreze and Khera (2009) find that 98% of the sample workers
stated that they were ready to work for 100 days in the year – the “upper limit” under the Act.
NREGA as of now meets only a fraction of this demand: in their survey only 13% of the respondents
had actually secured 100 days of NREGA work in the preceding 12 months. There are, of course,
wide inter-State variations in this respect. While the proportion of sample workers who had completed
100 days of work was particularly low in Chhattisgarh (1%), Bihar (2%), Uttar Pradesh (3%) and
Jharkhand (7%), it was considerably higher in Madhya Pradesh (17%), and as high as 35% in
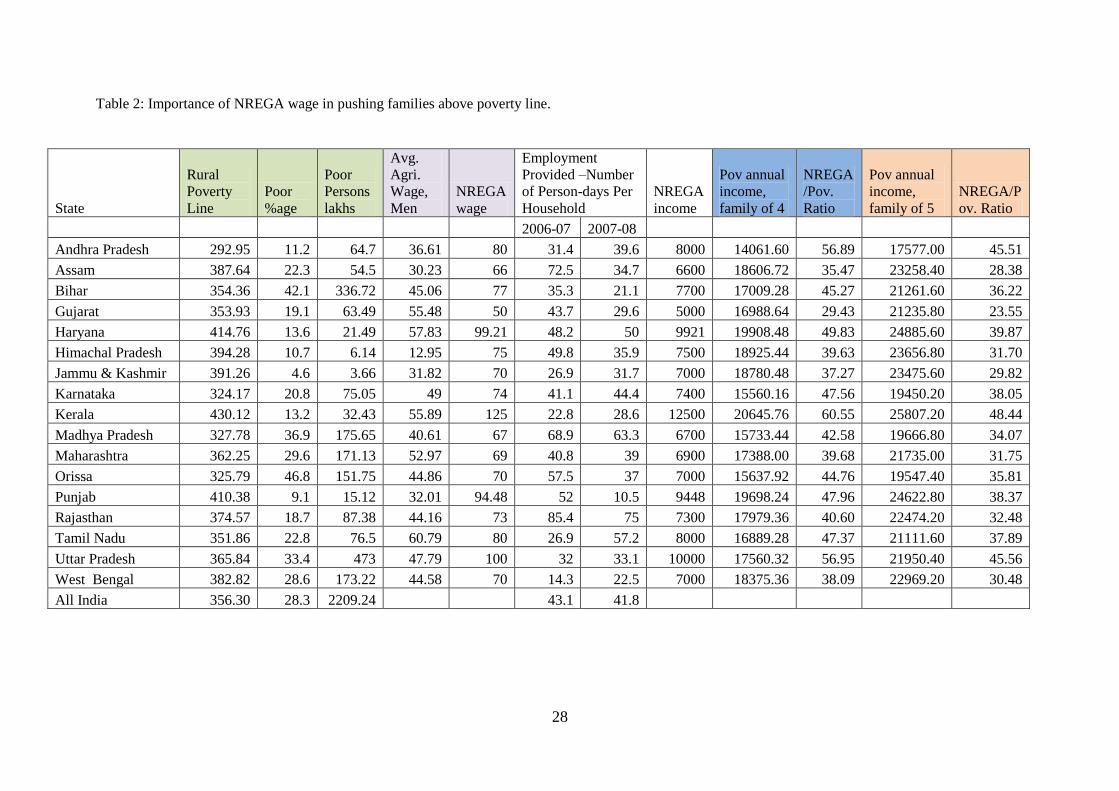
Rajasthan. Also see Table 2, columns 7 and 8 for a state-wise breakdown of employment provided
(person-days). The numbers are all well below the target. Again, checking more recent data (updated
till 2010 – 11) reveals small improvement in performance.
We start with the presumption that rural labour markets in India do not conform to the classic
competitive labour markets of economics textbooks. If they did, the arguments for the NREGA would
be weaker. In fact, the labour market in rural India can best be characterized as imperfect with high
costs on the part of workers to seek and to switch employment, and with elements of collusion and
social power on the part of employer that lead to low wages, and above all to equilibrium
unemployment.
Assuming the NREGA targets this group of unemployed workers, the possibility of an alternative
source of income raises the reservation wage of all workers in the rural sector, and implicitly confers
some bargaining power to rural workers. Thus, it is clear that the fact of a guarantee of employment at
a given wage through the NREGA would introduce contestability in the rural labour market. In other
words, in the presence of NREGA scheme the large land holders in rural areas may now need to raise
wage of workers they hire in order to ensure the necessary supply of labour.
The key questions are whether the NREGA can have fruitful impact on poverty, raise private sector
wages and overall employment for rural labour force. Will it lead to higher aggregate production? The
answers essentially lie in how the labour supply schedule available to large land holders in agriculture
react to the opposing effects of the NREGA. On the one hand, the NREGA scheme provides an
alternative source of employment and which may lead to a reduction in the pool of workers available
for private employer in a particular year and also the potential contestability effect of the NREGA in
terms of higher wage reduces the demand for labour in private employment; on the other hand, there
is positive effect in terms of higher productivity in agriculture. Though the eventual outcome is more

5
of a matter of empirical investigation but here in this paper we would provide some theoretical
predictions with the help of a baseline model. 5
We outline a simple theoretical model for the above discussions in the following section looking at
the (im)perfection of the labour market and the effect of NREGA in the rural labour supply decision.
We go on to discuss the aggregate production consequences, considering alternative productivity
implications of the scheme in section 3. In Section 4 we provide some empirical evidence in support
of our concerns highlighted in the theoretical framework. Section 5 concludes with some future
directions of research.
2. A Simple Theoretical Model
Consider a rural economy with two types of households: rich and poor. There are m number of rich
households and n number of poor households (reasonably, we assume that m < n). Each household has
L number of labour days available in a year. The rich household has enough land (K) in their disposal
and as a result they would like to employ more labour from outside the household at a reasonable
wage. Therefore, they would be net buyer of labour service. On the other hand, the poor household
has little land to work with (k < K) and as a result each poor household has excess supply of labour
which they can sell in the market. The agricultural production functions for both rich and poor
households are the same, Q = f(.) is a function of land and labour, and it is only the endowment of
land that is different. Given that there is not much sales and purchase of land happening in rural India,
we assume that land market does not exist and each household whether rich or poor has fixed amount
of land which is part of the inherited property.6
Thus, the rich household has the production f(K, .) and the poor household has the production f(k, .)
depending on their choice of employment of labour. Given the fixed endowment of land the
production function satisfies the usual properties of first and second derivatives with respect to labour.
That is, the marginal productivity of labour is positive and downward sloping curve. However,
keeping in view the features of agricultural production process we take the marginal productivity
curve of labour to attain zero after some labour employment on any fixed plot of land.7
5 The productive value of NREGA works is also something of a mystery. The general impression is that they are
mostly useless. Some dismissed them as a futile attempt “to play with mud, to create a road that goes from
nowhere to nowhere, to dig ditches that will be washed away in the next monsoon” (The Hindustan Times,
February 14, 2008). This verdict, however, is hard to substantiate or negate and we leave this again as a subject
of empirical enquiry. 6 Basu et al (2010) found in their sample that 94% of land is inherited while 2% is purchased and the rest of land
is obtained either as gifts, or through share cropping or through encroachment of village commons or forests. 7 The standard textbook in Development Economics always work with such a scenario (for instance, see Basu,

6
2.1 Perfect labour market:
Given the production function, in perfect labour market without a friction, the equilibrium wage
would be established at a wage where the total supply of labour from the poor household is equal to
the total demand for labour from the rich household. Define the equilibrium wage as w*.
w
MPL
wh MPL
w*
l* L Labour
Figure 1: (a) Poor household’s own employment
w
MPL MPL
w
w*
L c* L
1: (b) Rich household’s own employment (L) and thus, MPL to
the right of L is the labour demand curve of the rich households.
At w* the poor household employs an amount of labour say l* in their own land. So the excess labour
supply they have is L – l*. Thus, the total supply of labour would be n(L – l*) . At w* suppose the
rich wants to employ c* amount of labour (given the marginal productivity of labour on their land).
Out of c* the rich employs their own supply L and any additional labour they need they demand it
from the market. Thus the demand for labour for the rich household at w* is c* - L per household.
Therefore, the total demand for labour for the rich households would be m(c* - L). In the perfect
labour market w* would be such that
n(L – l*) = m(c* - L). (1)
It is clear from the behaviour of the marginal productivity of labour curves that RHS is a decreasing
function of w and the LHS is an increasing function of w. With some additional regularity
assumptions it is possible that competitive labour market equilibrium exists and it would be obtained
at a unique wage level w*.
(1997) and Ray (1998)).
7
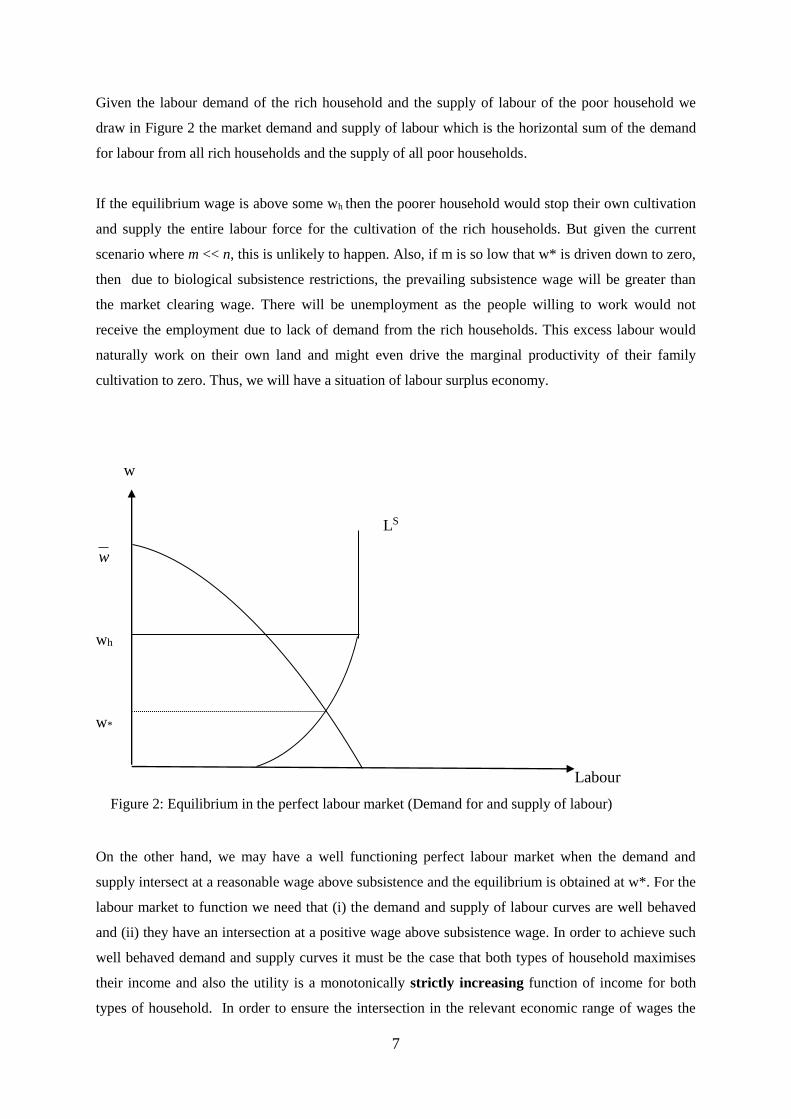
Given the labour demand of the rich household and the supply of labour of the poor household we
draw in Figure 2 the market demand and supply of labour which is the horizontal sum of the demand
for labour from all rich households and the supply of all poor households.
If the equilibrium wage is above some wh then the poorer household would stop their own cultivation
and supply the entire labour force for the cultivation of the rich households. But given the current
scenario where m << n, this is unlikely to happen. Also, if m is so low that w* is driven down to zero,
then due to biological subsistence restrictions, the prevailing subsistence wage will be greater than
the market clearing wage. There will be unemployment as the people willing to work would not
receive the employment due to lack of demand from the rich households. This excess labour would
naturally work on their own land and might even drive the marginal productivity of their family
cultivation to zero. Thus, we will have a situation of labour surplus economy.
w
LS
w
wh
w*
Labour
Figure 2: Equilibrium in the perfect labour market (Demand for and supply of labour)
On the other hand, we may have a well functioning perfect labour market when the demand and
supply intersect at a reasonable wage above subsistence and the equilibrium is obtained at w*. For the
labour market to function we need that (i) the demand and supply of labour curves are well behaved
and (ii) they have an intersection at a positive wage above subsistence wage. In order to achieve such
well behaved demand and supply curves it must be the case that both types of household maximises
their income and also the utility is a monotonically strictly increasing function of income for both
types of household. In order to ensure the intersection in the relevant economic range of wages the

8
population of rich and poor should be in certain proportion. As mentioned above, if there are too
many poor household as compared to rich we will have labour surplus economy.
It is possible to have a situation where even though the labour market is perfect and we have an
equilibrium wage determined by the market forces of demand and supply; the poor households may
not receive adequate income in order to maintain a decent living or else at least maintain a living
above the relevant poverty line of income.
It is obvious that when a programme like NREGA is introduced in a perfectly functioning labour
market and assuming that NREGA work is preferred over working for the rich households at all
wages then the supply curve of the labour would shift leftward, leading to a higher market clearing
wage. In such a situation the poor and rich household would employ less labour for agricultural
cultivation. As a result, the total agricultural production will fall.8 On the other hand, if there is
surplus labour in the economy and in case the NREGA works are provided just to absorb that surplus
labour then there may not be any adverse effect on agricultural production. Of course, this prediction
is based on the assumption that NREGA works are not creating any permanent asset which can
impinge on the productivity of land.
2.2 Imperfect labour market:
It has been revealed by various studies undertaken in rural India that the labour market is not perfect
and the wages are typically suppressed far below the competitive wage due to the presence of extra-
economic coercion and other factors such as feudal forces exerted by the rich households or caste.
Also in some regions due to population pressure the prevailing wages as well as the works available
are not adequate for the poor households for a sustainable living which often leads to large scale
migration. Thus the existence of surplus labour in agriculture at the prevailing wage is a feature of
labour market which does not go well with the assumption of perfect labour market. 9
Consider that all poor households have a target level of income, say T. T can well be interpreted as the
poverty line or a level of income which the poor household aspires to achieve for their decent living.
8 This relies on the assumption that substitution of labour by machine is not possible in the short run. However,
there are evidences that the demand for labour saving technology such as tractors and harvesters etc. has gone
up in response to NREGA in some states like Haryana and Punjab in India. 9 There is evidence that the labour market is imperfect and characterized by market power in both rural and
urban areas (Bardhan and Rudra,1981; Bardhan, 1979, 1984; Binswanger et al., 1984; Card and Krueger, 1995;
Datt, 1997; Manning, 2005). Mukherji (2006) explored the relationship between wages and employment in a
spectrum of labour market structure. He argued that when the labour market is non-competitive the “unique
link” between wages and employment break down and thus the rise in minimum wage does not necessarily
reduce the employment.
9
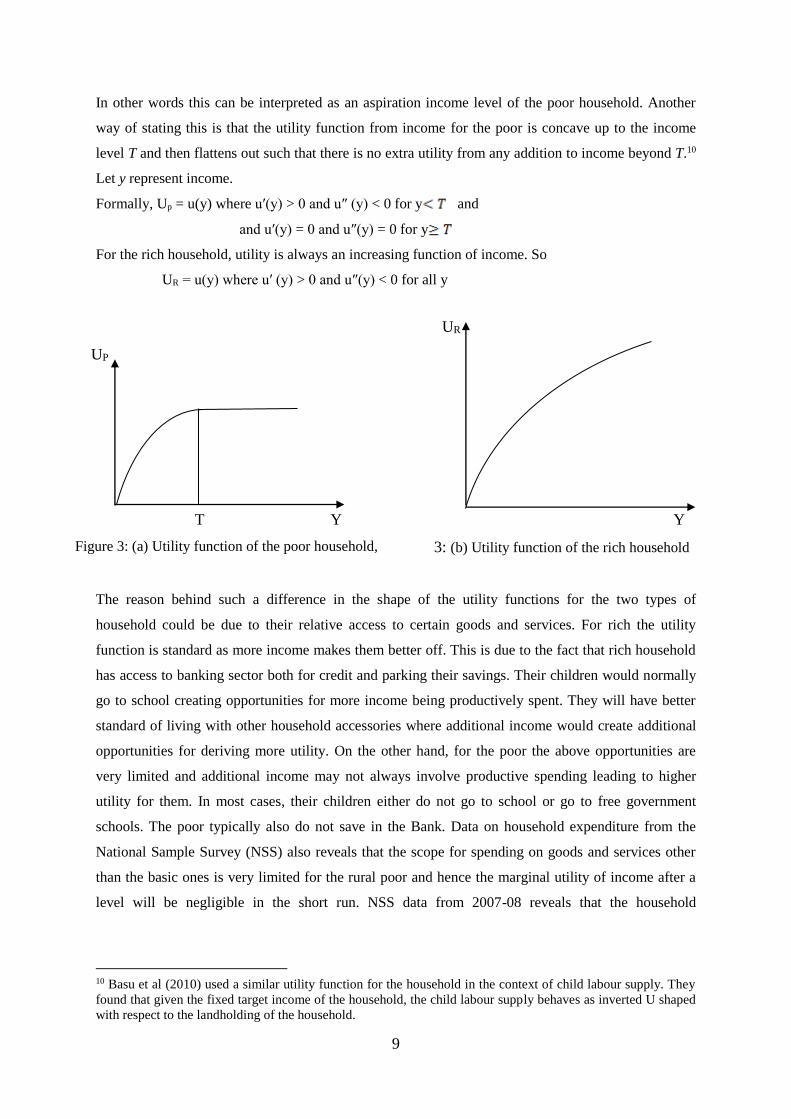
In other words this can be interpreted as an aspiration income level of the poor household. Another
way of stating this is that the utility function from income for the poor is concave up to the income
level T and then flattens out such that there is no extra utility from any addition to income beyond T.10
Let y represent income.
Formally, Up = u(y) where u′(y) > 0 and u″ (y) < 0 for y and
and u′(y) = 0 and u″(y) = 0 for y
For the rich household, utility is always an increasing function of income. So
UR = u(y) where u′ (y) > 0 and u″(y) < 0 for all y
UP
T Y
Figure 3: (a) Utility function of the poor household,
UR
Y
3: (b) Utility function of the rich household
The reason behind such a difference in the shape of the utility functions for the two types of
household could be due to their relative access to certain goods and services. For rich the utility
function is standard as more income makes them better off. This is due to the fact that rich household
has access to banking sector both for credit and parking their savings. Their children would normally
go to school creating opportunities for more income being productively spent. They will have better
standard of living with other household accessories where additional income would create additional
opportunities for deriving more utility. On the other hand, for the poor the above opportunities are
very limited and additional income may not always involve productive spending leading to higher
utility for them. In most cases, their children either do not go to school or go to free government
schools. The poor typically also do not save in the Bank. Data on household expenditure from the
National Sample Survey (NSS) also reveals that the scope for spending on goods and services other
than the basic ones is very limited for the rural poor and hence the marginal utility of income after a
level will be negligible in the short run. NSS data from 2007-08 reveals that the household
10 Basu et al (2010) used a similar utility function for the household in the context of child labour supply. They
found that given the fixed target income of the household, the child labour supply behaves as inverted U shaped
with respect to the landholding of the household.

10
expenditure on elastic items (medical, educational, entertainment, toiletries, footwear, consumer
services etc.) is about Rs. 60 per month (15% of total monthly per capita expenditure.
2.3 Absence of NREGA
Now consider the decision problem of the poor household in the above setup without the presence of
NREGA programme. Given the labour days available with the family, they would have two options to
allocate their total labour. Suppose the prevailing wage rate is w. First, consider the possibility of w >
w*: the case of labour surplus economy. In the prevailing wage there would be excess supply of
labour. Each rich household would employ ls such that f′ (K, L+ls) = w. So the total amount of labour
demand would be m.ls. Assuming that the total demand for labour is shared equally by all the poor
households, each poor household would supply . In such an economy, the poor family would try
to reach as close to the income target as possible. Therefore, out of the rest of the labour ,
the poor household would employ on their own field so far as the marginal productivity of labour is
zero. The excess labour remains totally unemployed due to the lack of opportunities.11
Next we move on to the possibility where there is no excess supply of labour at the prevailing wage
and the market equilibrium can be obtained such that at a reasonable wage the demand and supply
equate. However, the imperfection in the labour market manifests in the form a of lower prevailing
wage than the equilibrium wage that could be ensured by the free play of demand and supply forces.
This is the case of wage suppression mentioned earlier. Thus, we assume that 0 < w < w*. Given the
prevailing wage the poor household would employ a part, say lp, in their own field such that f′ (k, lp) =
w. The remaining labour supply is L – lp.12
So there are two possibilities: either they supply the entire
surplus labour to rich household or they supply less than the available labour days with them.
Case 1: Income below the target for the Poor: the poor household supply the entire surplus labour
and get w(L – lp). Their total income is f (k, lp) + w(L – lp). They will supply the entire surplus labour
to the rich household at the prevailing wage, provided that
f (k, lp) + w(L – lp) < T (2)
Case 2: Income at the target for the Poor: If the opposite happens i.e., f (k, lp) + w(L – lp) >T, the
poor household would not supply the entire surplus labour to the rich household. They will work for
11 Here we have presumed that with excess supply of labour it is not possible to reach the target income with
such a low wage for the poor households. 12 Note that if the wage rate w > wh then the poor would decide not to cultivate their land and only supply the
labour to the rich household. In that case lp =0. This is the case when the poor households become agricultural
labourers and stop cultivating their own land.
11
say ls labour days for the rich household such that f (k, lp) + wls = T. And as a result lP + ls< L (the
poor household’s endowment of labour).
Note that in case 1, at the prevailing wage, the entire excess labour days from all poor households is
absorbed in the production of rich households and given that the prevailing wage is below the
equilibrium wage w*, there would be excess demand for labour. The wage does not adjust to
equilibrium given the labour market imperfection and the related socioeconomic factors, which keeps
the wage lower than the equilibrium wage though there exist an upward pressure on the wage.
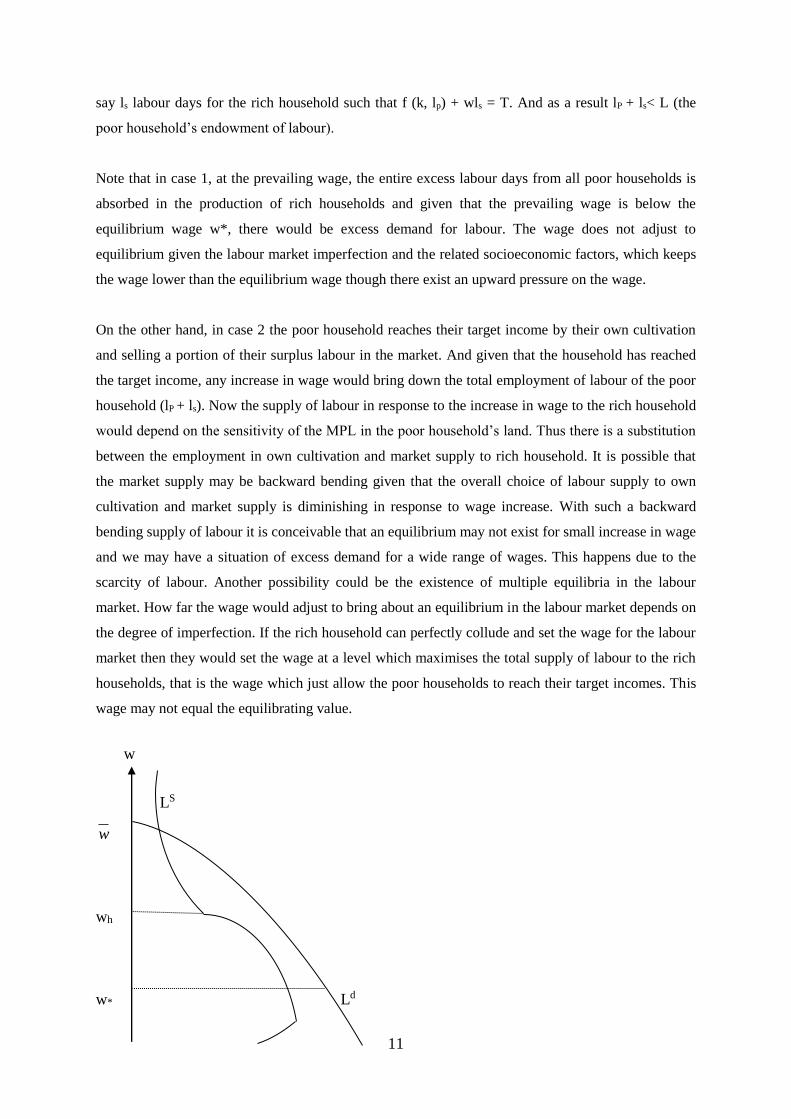
On the other hand, in case 2 the poor household reaches their target income by their own cultivation
and selling a portion of their surplus labour in the market. And given that the household has reached
the target income, any increase in wage would bring down the total employment of labour of the poor
household (lP + ls). Now the supply of labour in response to the increase in wage to the rich household
would depend on the sensitivity of the MPL in the poor household’s land. Thus there is a substitution
between the employment in own cultivation and market supply to rich household. It is possible that
the market supply may be backward bending given that the overall choice of labour supply to own
cultivation and market supply is diminishing in response to wage increase. With such a backward
bending supply of labour it is conceivable that an equilibrium may not exist for small increase in wage
and we may have a situation of excess demand for a wide range of wages. This happens due to the
scarcity of labour. Another possibility could be the existence of multiple equilibria in the labour
market. How far the wage would adjust to bring about an equilibrium in the labour market depends on
the degree of imperfection. If the rich household can perfectly collude and set the wage for the labour
market then they would set the wage at a level which maximises the total supply of labour to the rich
households, that is the wage which just allow the poor households to reach their target incomes. This
wage may not equal the equilibrating value.
w
LS
w
wh
w* Ld

12
Labour
Figure 4: The labour supply from the poor households when their earnings are on target.
Case 1 is amply illustrated by the perfect labour market analysis in Figure 2. However, for Case 2,
figure 4 would be useful to understand the outcome (Basu et al, 2010 consider a somewhat similar
situation in terms of child labour supply). It is clear from the diagram that labour supply would be
backward bending and there are possibilities of multiple equilibria in the labour market. It is also
possible that even if the wages are allowed to adjust upward, the magnitude of adjustment has to be
fairly large. It is also possible that after a large wage adjustment for an equilibrium, the poor
household might stop cultivating their own land.13
The possible existence of inverse relationship between labour supply and wage for some categories of
workers in developing countries was subject to scrutiny by various authors. Traditionally the study of
backward-bending supply curve was based on the assumptions of "target income" (Berg, 1961),
"'limited aspiration" (Mellor, 1963), and "subsistence mentality" (Lewis, 1954). An early study by
Berg (1961) posed the problem in terms of ‘target income’ for the migrant labour in a dual economy
structure and argued that “the aggregate labor supply function to any given country (say the Union of
South Africa, or the Ivory Coast or Uganda) may have been backward-sloping in the early years of
African development”. Among some of the recent studies, the studies by Licona (2000) for Mexico,
Dessing (2002) for Philippines, Bhalotra (2007) for child labour in Pakistan and El-Hamidi (2003) for
female labour in Egypt and Sharif (1991) for Bangaldesh are noteworthy. In Indian context, Bardhan
(1979) mentioned that “there seems to be some evidence for at least a locally back- ward-bending
supply curve of labor for the set of all adult women (primarily house- wives) and of hired-out farm
labor for the set of cultivators of all size groups taken together” in his sample of 8,500 rural workers
from nearly 4,900 households drawn from about 500 sample villages belonging to the state of West
Bengal. Lately, Goldar and Dasgupta (2005) investigated the issue for rural female labour supply
using NSS data for 1999-2000 and they found that “supply of female labour from below poverty line
households in rural areas is inversely related to wage rate and the number of earning members in the
family” and thus, as early as 2005, they raised doubt about the efficacy of National Rural
Employment Guarantee Scheme.
2.4 Impact of NREGA
13 There is also the possibility that the poor households reach their target income only from cultivating their own
land. In that case the labour market vanishes at the prevailing wage. We leave this uninteresting case out.

13
Under NREGA a certain number of days of labour employment is provided by the government
scheme. Assume that number to be x. In this section we consider the case where the NREGA work is
just an employment scheme and no assets are created which influence the productivity of land. As a
result the production functions for rich and poor households remain as they were before.
It is an empirical fact that the NREGA wage is higher than the prevailing wage rate in most areas (see
Table 2, columns 5 and 6, a notable exception being the state of Gujarat). For a poor household there
are three options to work and try to reach the target income. Assume the NREGA wage is wN > w,
which is the prevailing wage.
Case of labour surplus economy:
In case of the labour surplus economy, the impact of NREGA depends on the relative magnitude of
NREGA work and the amount of surplus labour in the economy. If the amount of NREGA work is
below the surplus labour available in each poor household then there would be no impact of NREGA
work on the employment decision for their own cultivation and the decision to supply labour for the
rich households. As a result of NREGA work, the level of outputs in both rich and poor households
remain the same but the NREGA work would increase the income of the poor households. This
prediction is based on the presumption that that NREGA work of 100 labour days does not still allow
the poor household to reach their target level of income (but it is still comparatively substantial as
illustrated in Table 2, last 4 columns. Here it is seen that, assuming a household of size 5, the earnings
from NREGA alone is sufficient to cover 30 – 50% of the income required to be above the poverty
line. The percentage is closer to 60% assuming households with 4 members.). If the amount of
NREGA works available is more than the surplus labour available in each poor household then there
would be some change in the employment decision of the poor households and the analysis is similar
to what is given below for any economy with or without surplus labour. This additional demand from
NREGA work would reduce the supply of labour to the rich households.
The poor household try to maximise y = f(k, lP) + wN.x + wls T subject to lP +x+ ls L.
Posssibility 1: if y = f(k, lP(wN)) + wN.x , then the poor household would not even undertake the
full amount of NREGA work allotted to them. So they may not even work for x labour days and
would choose the amount of work z x such that y = f(k, lP(wN)) + wN.z = . In this scenario the
labour market would vanish. As compared to the regime without NREGA, it is clear that the
agricultural production in poor households would be less, and also the production in the rich
household would be less, leading to an overall adverse production effect. Though the presence of
NREGA improves the lot of the poor but due to the labour shortage (in this case the labour supply for
the rich household vanishes completely), the rich households would be worse off.

14
Possibility 2: if y = f(k, lP(w)) + wN.x f(k, lP(wN)) + wN.x . The poor household would choose
l for its own cultivation such that l < lP(w) and y = f(k, lP(w)) + wN.x . So they would not supply
any labour to the rich household but only employ the labour for self cultivation and do the full amount
of NREGA work and hence reach their target income. Here also the labour market vanishes
altogether.
Possibility 3: when y = f(k, lP(w)) + wN.x < , the poor would still like to supply some labour to the
rich households at the prevailing wage w. Now the poor household would supply (i) the entire surplus
labour L - lP(w)) - x if y = f(k, lP(wN)) + wN.x + w(L - lP(wN)) - x) < . Or (ii) supply lN < (L - lP(wN))
– x such that y = f(k, lP(wN)) + wN.x + wlN = .
Thus, we have three possible outcomes of the economy with the introduction of the NREGA scheme.
There is no supply to the labour market and the target income of the poor is reached by their own
cultivation and NREGA work (possibility 1 and 2). In possibility 3 the labour market exists and the
target of the poor may or may not be reached.
It is obvious that, in the presence of NREGA, starting from the same situation, a poor household
would supply less labour to the market than could be hired by the rich household. As a result there
will be adverse production effect, and the poor household would be better off but the rich households
would be worse off. Note that with the introduction of NREGA, given that the NREGA wage is
higher than the prevailing market wage, the poor household would always prefer to work for the
NREGA scheme. The market supply is only related to how the remaining labour days are being
allocated between own cultivation and the market supply.
Remark: When the target of the poor households are fulfilled with only partial supply of their labour
to the market then any attempt to increase the wage in the market for bringing more labour supply to
the market may be counterproductive as the labour supply to the market would eventually be
backward bending with large increase in the market wage w (possibility 3 above). On the other hand,
when the target of the poor household is not reached even with supply of labour to the market, then
with the increase in wage it is possible to bring forth more labour to the market.

15
w
LS
w
w″
w Ld
Labour
Figure 5. Possibility of multiple equilibria post NREGA
The above figure shows the possibility of multiple equilibria after the NREGA scheme is
implemented starting from an initial situation where there was only one equilibrium. There are three
equilibria: two of them are stable and the middle one is unstable. If the market plays itself out
perfectly then the equilibrium wages are all above the initial one. However, given the labour supply
curve if the rich households can organise themselves and cooperate they would fix the wage at ,
which would maximise the total labour supply to the rich households.
3. NREGA - Productivity Link:
The above observations are made with the assumption that NREGA work does not affect the
production function of the agricultural sector at all. Since NREGA works are to create some social
assets which would have impact on the productivity of the agriculture by facilitating irrigation and
water conservation; roads and rural marketing etc,. we now introduce that NREGA work improves the
productivity in agriculture by a factor ε. Thus the production function becomes Q = (1+ε ) f(.) for both
type of households. Given the public good nature of the asset creation to enhance productivity in
agriculture we assume that the productivity increases symmetrically for both rich and poor
households.
Now due to this productivity increase in the land the marginal productivity of labour shifts outwards
for both households with fixed amount of land. Thus, for any prevailing wage the poor would like to

16
employ more labour in their own land leaving less available for NREGA work or for the labour
market. This rise in productivity increases the likelihood that the poor reaches their target income
easily. Thus, the rise in productivity increases the chance either that the labour market vanishes or the
poor household reaches their target income without supplying the whole surplus labour to the labour
market.
First we consider the case of labour surplus economy. Suppose, the NREGA work is just sufficient to
absorb the surplus labour from the economy. Given that labourers are fully employed there would be
upward pressure on the wage to bring about more labour for the cultivation of rich household. Even if
the wage increases in response to NREGA work or even if the level of employment in both rich and
poor household remains the same absent NREGA work, production in both households increases and
both the rich and poor households are better off. This situation can only arise if the poor households
do not reach their target income even after the NREGA works provided to them. In case the poor
reaches the target income and there is less or no supply of labour to the rich household, this would be
a negative factor despite the increase in productivity. The overall effect on the level of production can
go in either direction.
Now we consider the situation where there exists a labour market in the absence of NREGA and the
poor household does not reach their target income due to the low wage in the economy.
Consider the worst possible scenario in the absence of NREGA the poor households could not reach
their target income even though they supply the surplus labour entirely to the market. Now with the
introduction of NREGA the productivity of the land increases. This results into more labour to be
employed in the land of poor household. Now even after undertaking the NREGA work there may or
may not be surplus labour for the market. Consider the extreme form of productivity increase which is
very high so that there is no surplus labour for the market and the poor households target incomes are
reached. The labour market vanishes altogether. The poors are necessarily better off. The rich
household would also be better off for very high productivity increase if the following condition is
satisfied.
(1+ε) f(K, L) > f(K, L+ n
lm s.)
It is not so clear from the above expression what happens for a relatively small or moderate
productivity increase. It would depend on the relative change in labour supply vis a vis the relative
change in productivity and the effect can go either way. In general one can expect that if the NREGA
leads to a relatively small productivity increase compared to a relatively large drop in the labour
supply the overall production will go down, whereas if there is relatively large productivity increase

17
and relatively little change in labour supply in response to NREGA there would be positive output
effect.
3.1 Numerical example:
The following numerical example illustrates an interesting possibility where the output effect would
be non-monotonic in relation to increase in productivity.
Consider a village with one rich household and three poor households.14 The rich household has a
land holding of 625 units and each of the poor household has 4 units of land. The wage in the market
is w = 60 and each household has the amount of labour available L= 200. The poor household has a
target income T= 12000. The NREGA wage wN = 100 and the total amount of NREGA work
available per household x= 40 labour days.
The agricultural production function: land (k) and labour (l)
Given the production function the marginal productivity of labour is given by
Thus, the marginal productivity of labour is a linear function and attains zero at the level of
employment l = 25 . The marginal productivity of labour for rich household is :
.
Similarly, for the poor households: .
Note that this production function obeys the diminishing marginal productivity property for land as
well. However, in case of land the marginal productivity curve is convex.
Routine calculation would show that for different ranges of productivity parameter we can plot the
behaviour of the total output of the economy as below (figure 6).15
The figure shows that there exists a non-monotonic relationship between the increase in productivity
and the total output produced in both poor and rich households together. For an initial range, the poor
household still supplies labour to the rich household but this is decreasing. This two effects balances
at a point ε = .4124 and then the output start falling up to ε = .6544. After that the labour market
14 One can increase the size of the village by replicating the number of households in the given proportion and
all our results in this section would still hold true. 15 The detailed calculation can be obtained from the authors on request

18
vanishes for the rich household and subsequent increase in productivity increases the total output in
the economy. This is a very interesting result as the programme like NREGA despite having the
strong productivity enhancement effect (up to 65%) can still lead to decrease in total output in the
economy.
Total output
ε
0.1564 0.4124 0.6544 ε* 0.7434 1.5
Figure 6: Total production for the example where ε*=.736 (approximately).
The output starts falling when the increase in productivity is beyond .4124 and upto .6544. However,
the output increases as productivity increases up to 1.5 at which the labour supply even for the
NREGA work goes to zero. The labour supply to NREGA work comes to a halt at ε=1.5 and so
without the labour supply for NREGA the productivity increase cannot take place. The purpose of this
example is illustrative and it is not conceivable that such a drastic productivity increase would at all
take place from the NREGA scheme itself.
We have checked in the above example the behaviour of total output when there are one rich and only
one poor households in the economy. Then the increase in productivity always leads to an increase in
the total output in the economy. Keeping in view that the annual increase in productivity of the
agriculture in India is around 3%, in the above example we have tried with another set of parameter
configurations. Using the same set of production functions for the rich and poor farmers with the days
of NREGA works increased to 60 days and the number of poor farmers increased to 6 households, we
have found that with respect to productivity increase the total agricultural production goes up until 2%
increase in productivity and then starts falling until 27% productivity increase and then again starts
increasing from there onwards for all values of productivity growth. Thus we also demonstrate that
the relative distribution of the rich and poor households in the economy is extremely important for
understanding the effect of productivity increase on the overall output in agriculture as a result of
NREGA scheme.
19
4. Empirical Support
It is too early to assess the impact of NREGA with respect to the broad parameters of our framework
that we have developed in our theoretical section. Although there is government data with respect to
the coverage, spending, number of work days created, people participation etc. in the NREGA
programmes since its inception, however, there is no attempt by the researchers to undertake rigorous
empirical work to pin down the possible effects and inter linkages with other activities in the
economy. The focus of the existing empirical studies, which are few in number, is to analyse the
success or failures of this scheme in different areas and how the scheme has benefitted the people who
participated in it. There are considerable concerns about the implementation of the scheme in certain
areas and the leakages that arise due to corrupt practices. However, whatever little empirical case
studies are available they have glossed over the fundamental issues that are raised in this paper such
as the impact on the labour market in terms of demand and supply, wages, and the impact on the
overall agricultural production or other activities such as self employment. These are important
parameters for evaluating a programme like NREGA and we hope that researchers would pay
attention to these parameters while undertaking empirical studies in the future. Below we report some
of the empirical studies which validate our concern to some extent. These studies are indicative and
not conclusive given their obvious limitations in the methodology.
4.1. NREGA – Demand for Employment
Nair et al (2009) studied the impact of the National Rural Employment Guarantee Programme in three
Grama Panchayats of Kasaragod District of Kerala, namely Madikai, Ajanoor and Trikarpur. While
the worker registration is appreciably good in all the three Grama Panchayats including registration of
SC and ST categories, however, there is a sharp drop in the number of people who demanded jobs in
2007-08 which was below one fourth in two Panchayats and just above one third in the third
Panchayat. There was further drop in the number in the following year.
The relationship of the NREGA wage rate with the state minimum wage rate has also been a complex
and contentious issue. Initially the NREGA wage rate was linked to the state minimum wage and
consequently helped to push up the minimum wage in the laggard states. But this increased the burden
on the central exchequer. Finally, in 2009, the NREGA wage rate was delinked from the state
minimum and immediately several rights group started criticizing this move fearing “Minimum wages
began to be enforced only after NREGS was pegged to it… delinking will again reduce the Minimum
Wage Act to a well-meaning, but poorly enforced law.” (Economic Times, April 5, 2011).
20
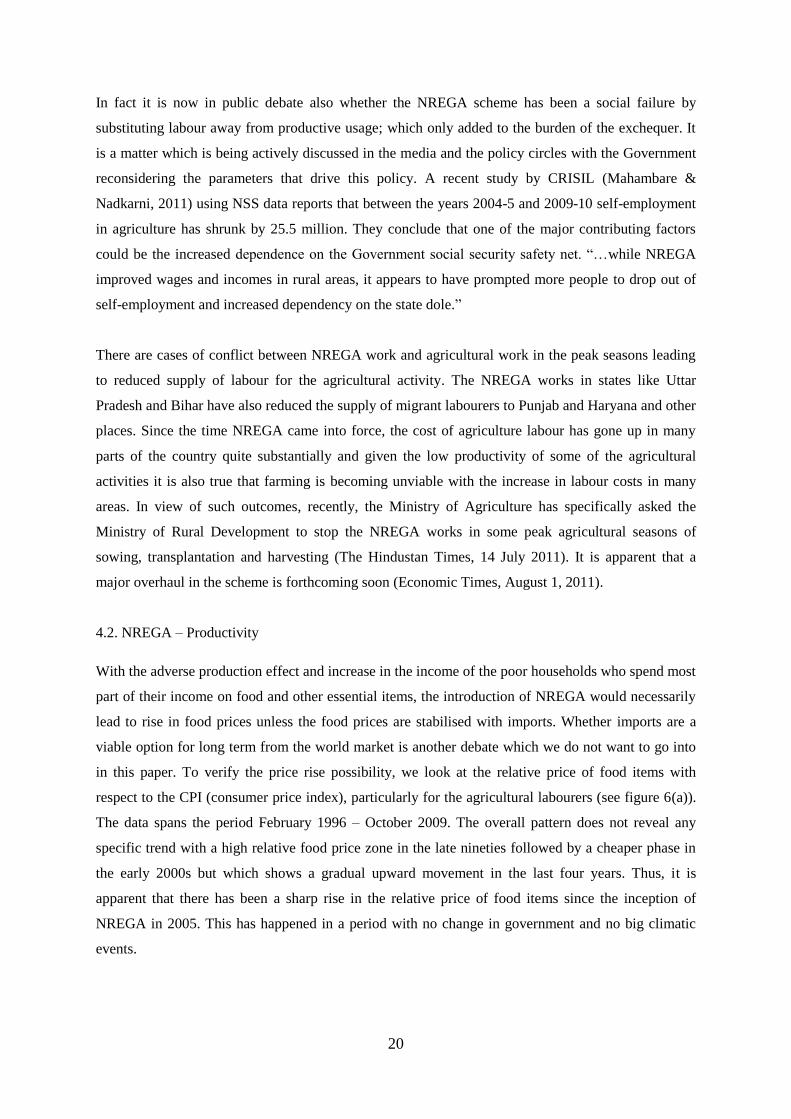
In fact it is now in public debate also whether the NREGA scheme has been a social failure by
substituting labour away from productive usage; which only added to the burden of the exchequer. It
is a matter which is being actively discussed in the media and the policy circles with the Government
reconsidering the parameters that drive this policy. A recent study by CRISIL (Mahambare &
Nadkarni, 2011) using NSS data reports that between the years 2004-5 and 2009-10 self-employment
in agriculture has shrunk by 25.5 million. They conclude that one of the major contributing factors
could be the increased dependence on the Government social security safety net. “…while NREGA
improved wages and incomes in rural areas, it appears to have prompted more people to drop out of
self-employment and increased dependency on the state dole.”
There are cases of conflict between NREGA work and agricultural work in the peak seasons leading
to reduced supply of labour for the agricultural activity. The NREGA works in states like Uttar
Pradesh and Bihar have also reduced the supply of migrant labourers to Punjab and Haryana and other
places. Since the time NREGA came into force, the cost of agriculture labour has gone up in many
parts of the country quite substantially and given the low productivity of some of the agricultural
activities it is also true that farming is becoming unviable with the increase in labour costs in many
areas. In view of such outcomes, recently, the Ministry of Agriculture has specifically asked the
Ministry of Rural Development to stop the NREGA works in some peak agricultural seasons of
sowing, transplantation and harvesting (The Hindustan Times, 14 July 2011). It is apparent that a
major overhaul in the scheme is forthcoming soon (Economic Times, August 1, 2011).
4.2. NREGA – Productivity
With the adverse production effect and increase in the income of the poor households who spend most
part of their income on food and other essential items, the introduction of NREGA would necessarily
lead to rise in food prices unless the food prices are stabilised with imports. Whether imports are a
viable option for long term from the world market is another debate which we do not want to go into
in this paper. To verify the price rise possibility, we look at the relative price of food items with
respect to the CPI (consumer price index), particularly for the agricultural labourers (see figure 6(a)).
The data spans the period February 1996 – October 2009. The overall pattern does not reveal any
specific trend with a high relative food price zone in the late nineties followed by a cheaper phase in
the early 2000s but which shows a gradual upward movement in the last four years. Thus, it is
apparent that there has been a sharp rise in the relative price of food items since the inception of
NREGA in 2005. This has happened in a period with no change in government and no big climatic
events.

21
To check whether this has been due to a poor rainfall and hence overall decrease in agricultural
production, in figure 7(b) we have also presented the rainfall deficit by plotting the actual rainfall as a
percentage of ‘ideal’ rainfall levels (according to meteorological standards). Although this data only
covers up to 2006, what we can see is that the rainfall in 2004 and 2006 has not been below average
with one slightly bad year in between. In fact, on average the rainfall situation has been better in the
period 2004 – 2006 compared to the previous nine years. But during the later period, the relative price
has taken a sharp and monotone upward move. Thus we can detect no clear linkage between the rise
in food price and annual rainfall levels. This further strengthens our intuition of a possible linkage
between the policy inception and the price rise.
4. Concluding Remarks
A crucial dimension of the rural labour market is the target income of the poor. This target income is
the root cause of the backward bending supply curve of labour in our analysis. So the policy focus
should be to increase this target income by creating more market access and opportunities for the poor
households and improving their standard of living. In other words, in the current scenario with limited
opportunities for productive spending and market access, it is unlikely that just generating extra
income would alone solve the problem. Consider a poor household who wants to buy a TV set or
other electronic equipments which would improve their quality of living. But without electricity
connection or with extremely irregular supply of electricity to rural areas it is impossible for a poor
household to enjoy the benefit properly. As a result the household may prefer to live without such
household accessories which otherwise would have improved the quality of their living. The similar
problem of market access arises when it comes to educating their children. Even though the poor
household is interested in good education of their children there may not be any good school in the
neighbourhood. The poor households in most cases avoid banking sector for parking their savings as
the process of dealing with a bank requires some level of education which most poor households do
not have. Thus, to enhance the opportunities for the poor the policy should be inclusive and
multipronged. Thus, the target income may be enhanced by creating opportunities and market access
from multiple dimensions and not just an income generating scheme like NREGA can help to improve
the situation of the poor households.
In order to avoid the adverse production effect arising out of reduction of labour supply from the poor
households, we need a direct policy of agricultural productivity increase such as another green
revolution along with mechanisation so that a large part of agricultural activity can be done by
machine which will replace the labour in agriculture. It is also important to revisit patterns of land
holdings in states like West Bengal where the successful land reform has created too much

22
fragmentation and such tiny plots of land are a deterrent for large scale mechanisation of agriculture.
So we also suggest a consolidation of land holdings wherever necessary.
Most of our results are tentative predictions from a simple conceptual framework involving the
NREGA scheme. Future researchers must investigate the truth of some of the predictions empirically.
Our testable hypotheses are:
1. Wages have gone up in response to NREGA scheme.
2. Do people refuse to work even at higher wage in peak agricultural seasons (during sowing or
harvesting seasons) while they have worked for NREGA in lean seasons?
3. There has been improvement in agricultural productivity due to NREGA.
4. There has been a net loss in agricultural production in sync with the implementation of NREGA.
Given the significant impact of NREGA scheme in the rural labour market as we have depicted in this
paper it is possible to have a reverse migration from urban to rural areas. That is, we may observe a
Lewis model in reverse, urban industrial workers coming back to agricultural area in search of easy
NREGA wage. Though there is casual empirical evidence on this, however, no proper empirical study
is available on this aspect of NREGA.

23
References
Bardhan, Pranab, 1979. Labor supply functions in a poor agrarian economy. American Economic
Review 69, 73–83.
Bardhan, Pranab, 1984. Land, Labor, and Rural Poverty: Essays in Development Economics. Oxford
Univ. Press, Delhi.
Bardhan, Pranab K., Rudra, A., 1981. Terms and conditions of labour contracts in agriculture: results
of a survey in West Bengal 1979. Oxford Bulletin of Economics and Statistics 43, 1
February.Bernstein, Irving, 1970. Turbulent Years: A History of the American Worker, 1933–1941.
Houghton Mifflin, Boston.
Basu, Arnab K. 2007. “Impact of rural employment guarantee schemes on seasonal labor markets:
optimum compensation and workers' welfare,” College of William and Mary, mimeo.
Basu Arnab, Nancy Chau and Ravi Kanbur, 2005, The National Rural Employment Guarantee Act of
India, Entry for the Oxford Companion to Economics in India.
Basu, Kaushik. 1981. “Food for work programmes: beyond roads that get washed away.” Economic
and Political Weekly, January 3–10
Basu, Kaushik. 1997. Analystical Development Economics: The Less Developed Economy Revisited,
MIT Press, 1997.
Basu, Kaushik. Sanghamitra Das, Bhaskar Dutta, 2010, Child labor and household wealth: Theory
and empirical evidence of an inverted-U, Journal of Development Economics 91, 8–14.
Berg, Elliot, 1961, "Backward-sloping labor supply function in dual economies -- African ease,"
Quarterly Journal of Economics, Vol. 75, No. 3, 468-492.
Besley, Timothy, Coate, Stephen, 1992. Workfare vs. welfare: incentive arguments for work
requirements in poverty alleviation programs. American Economic Review 82 (2), 249–261.
Besley, Timothy, Kanbur, Ravi, 1993. Principles of targeting. In: Lipton, Michael, van de Gaag,
Jacques (Eds.), Including the Poor: Proceedings of a Symposium Organized by the World Bank and
the International Food Policy Research Institute. The World Bank, Washington D.C., pp. 67–90.
Bhalla, Surjit S, 2004, Ten Lies and an Act: I, Business Standard, December 25, 2004.
Bhalotra, Sonia . 2007, Is Child Work Necessary?. Oxford Bulletin of Economics and Statistics, Vol.
69, No. 1, 29-55.
Binswanger, Hans P., Doherty, V.S., Balaramaiah, T., Bhende, M.J., Kshirsagar, K.G., Rao, V.B.,
Raju, P.S.S.,1984. Common features and contrasts in labor relations in the semiarid tropics of India.
In: Binswanger, Hans, Rosenzweig, Mark (Eds.), Contractual Arrangements, Employments, and
Wages in Rural Labor Markets in Asia. Yale University Press, New Haven, pp. 143–168.

24
Blaug, Mark., 1963. The myth of the old poor law and the making of the new. Journal of Economic
History 23, 151–184.
Blaug, Mark, 1964. The poor law report re-examined. Journal of Economic History 24, 229–245.
von Braun, Joachim, 1995. Employment for Poverty Reduction and Food Security. International Food
Policy Research Institute, Washington DC.
Card, David, Krueger, Alan B., 1995. Myth and Measurement: The New Economics of the Minimum
Wage. Princeton University Press, Princeton.
Dasgupta, Purnamita and Bishwanath Goldar, 2005, Female Labour Supply in Rural India: An
Econometric Analysis, Discussion Paper, E/265/2005, Institute of Economic Growth, Delhi, India.
Datt, Gaurav, 1997. Bargaining Power, Wages and Employment: An Analysis of Agricultural Labor
Markets in India. Sage Publications, London.
Dessing, Maryke, 2002, “Labour supply, the family and poverty: the S-shaped labour supply curve”,
Journal of Economic Behavior & Organization, Vol. 49, 433–458
Dreze Jean and Khera, Reetika, 2009, The battle for employment guarantee, Frontline, 26 (01), Jan.
03-16.
Drèze, Jean, Sen, Amartya, 1991. Strategies of entitlement protection. Chapter 7, In Hunger and
public action, Oxford University Press, pp 104–121.
El-Hamidi, Fatima, 2003, “Poverty and Labour Supply of Women: Evidence from Egypt” Paper
presented at Tenth Annual Conference of the Economic Research Forum, 16-18 December.
The Hindustan Times, February 14, 2008
Kesselman, Jonathan R., 1978.Work relief programs in the Great Depression. In: Palmer, J.L. (Ed.),
Creating Jobs: Public Employment Programs andWage Subsidies. Brookings Institution, Washington,
D.C.
Lewis, W. A., 1954, "'Economic development with unlimited supplies of labor," Manchester School
of Economics and Social Studies, Vol. 22, 139-91.
Licona, Gonzalo Henández, 2000, “Reshaping the Labour Supply Curve for the Poor”, paper
presented at the Annual Meeting of the Latin American and Caribbean Economic Association, Rio,
2000.
Lipton, Michael, 1996. Success in anti-poverty. Issues in Development Discussion Paper, vol. 8.
International Labour Office, Geneva.
Mahambare, Vidya and Romola Nadkarni, 2011, Unemployment in India: uneven and weak, A study
by CRISIL Centre for Economic Research, CRISIL Research Report Employment Eco Insight ,
India.

25
Manning, Alan, 2005. Monopsony in Motion: Imperfect Competition in Labor Markets. Princeton
University Press, Princeton.
Mathur, Lalit, 2007, Employment Guarantee: Progress So Far, Economic & Political Weekly
December 29, 2007
Mehrotra, Santosh, 2008, NREG Two Years On: Where Do We Go from Here?, Economic & Political
Weekly, August 2.
Mukherji, Anjan, (2006). On Wages and Employment, Indian Journal of Labour Economics, Vol. 49,
66-77.
Nair, K. N., T.P. Sreedharan and M. Anoopkumar, 2009, A Study of National Rural Employment
Guarantee Programme in Three Grama Panchayats of Kasaragod District, Working Paper 413, Centre
for Development Studies, Trivandrum, India.
National Sample Survey: NSS Report no. 530, Household Consumer Expenditure in India, 2007-08,
NSS 64th Round, July 2007 - June 2008.
National Sample Survey: NSS Report no. 509, Household Consumption of Various Goods and
Services in India, 2004-05, NSS 61st Round, July 2004 - June 2005.
Ravallion, Martin, 1990. Market responses to anti-hunger policies: effects on wages prices and
employment. In: Drèze, J., Sen, A. (Eds.), The Political Economy of Hunger. Clarendon Press,
Oxford.
Ravallion, Martin, 1991. Reaching the rural poor through EGS employment: arguments, lessons, and
evidence from South Asia.World Bank Research Observer 6 (1), 153–176.
Ravallion, Martin, Datt, Guarav, Chaudhuri, S.,1993. Does Maharashtra's employment guarantee
scheme guarantee employment? Effects of the 1988wage increase. Economic Development and
Cultural Change 41 (2), 251–275.
Ray, Debraj, 1998, Development Economics, Princeton University Press.
Web references:
Ghose, S. The idiocy of urban thinking, The Hindustan Times 14 Feb 2008,
http://www.hindustantimes.com/editorial-views-on/Platform/The-idiocy-of-urban-thinking/Article1-
275862.aspx
Banerji, D. UPA Govt's NREGA back on table for removing flaws, The Economic Times 1 Aug 2011.
http://articles.economictimes.indiatimes.com/2011-08-01/news/29838758_1_rural-roads-scheme-
national-rural-employment-guarantee
Rajshekhar, M. Can Centre fix NREGS wages in isolation? The Economic Times, 5 April 2011.
http://www.im4change.org/rural-news-update/can-centre-fix-nregs-wages-in-isolation-by-m-
rajshekhar-6961.html

26
Prasad, N. “Ministry seeks to halt job plan in farm season”, The Hindustan Times, 14 July 2011.
http://www.hindustantimes.com/India-news/NewDelhi/Ministry-seeks-to-halt-job-plan-in-farm-
season/Article1-721231.aspx
http://www.agricoop.nic.in/
http://nrega.nic.in/netnrega/home.aspx

27
Table 1: Some Performance Parameters for States and Districts – 2006-07
State
No of
NREGA
Districts
Funds
Available
(Rs in cr)
Expen
-diture
Percentage
Utilised
Average Person
Days (in lakh)
per district
Daily Unskilled
Wage Paid (Rs)
% of Households
Completed 100 Days of
Employment
2006-07 2007-08
Andhra Pradesh 13 1142 680 59.6 52 86 2.7 9
Assam 7 707
83.7 82 67 23.4 17.1
Bihar 23 1197 713 59.8 26 70 3.6 0.7
Chhattisgarh 11 841 669 79.5 64 63 10.4 11.2
Gujarat 6 124 85 69.4 17 56 5.4 3.9
Haryana 2 47 36 77.3 12 97 11.1 10.4
Himachal Pradesh 2 57 39 68.9 15 69 26.5 5.1
Jammu and Kashmir 3 50 35 68.9 11 69 9.7 1.4
Jharkhand 20 982 712 72.4 26 80 3.7 3
Karnataka 6 341 248 72.8 37 67 12.8 4.2
Kerala 2 48 28 57.7 10 121 0.5 32.1
Madhya Pradesh 18 2134 1862 87.3 110 59 18.5 21
Maharashtra 10 630 395 62.6 44 70 1.5 1.8
Meghalaya 2 26
81.7 12.1 73 0.6 6.4
Mizoram 2 26
63.2 3.9 175 11.7 0
Orissa 19 890 733 82.4 42 53 11.1 3.4
Punjab 1 38 25 65.1 11 96 16.8 5.3
Rajasthan 6 856 693 81 167 51 54.4 42
Sikkim 1 5
57.4 2.4 87 5.4 10.2
Tamil Nadu 6 252 151 60.2 31 80 0.3 6.2
Tripura 1 50
90.6 50 60 26.3 0.4
Uttar Pradesh 22 1029 780 75.8 37 56 6 10.9
Uttarakhand 3 71 48 68.3 13 72 2.8 8.3
West Bengal 12 486 174 35.9 13 104 0.6 0.8
All India 200 12073 8823 73 90.51cr 65 10.2 10.8
28
Table 2: Importance of NREGA wage in pushing families above poverty line.
State
Rural
Poverty
Line
Poor
%age
Poor
Persons
lakhs
Avg.
Agri.
Wage,
Men
NREGA
wage
Employment
Provided –Number
of Person-days Per
Household
NREGA
income
Pov annual
income,
family of 4
NREGA
/Pov.
Ratio
Pov annual
income,
family of 5
NREGA/P
ov. Ratio
2006-07 2007-08
Andhra Pradesh 292.95 11.2 64.7 36.61 80 31.4 39.6 8000 14061.60 56.89 17577.00 45.51
Assam 387.64 22.3 54.5 30.23 66 72.5 34.7 6600 18606.72 35.47 23258.40 28.38
Bihar 354.36 42.1 336.72 45.06 77 35.3 21.1 7700 17009.28 45.27 21261.60 36.22
Gujarat 353.93 19.1 63.49 55.48 50 43.7 29.6 5000 16988.64 29.43 21235.80 23.55
Haryana 414.76 13.6 21.49 57.83 99.21 48.2 50 9921 19908.48 49.83 24885.60 39.87
Himachal Pradesh 394.28 10.7 6.14 12.95 75 49.8 35.9 7500 18925.44 39.63 23656.80 31.70
Jammu & Kashmir 391.26 4.6 3.66 31.82 70 26.9 31.7 7000 18780.48 37.27 23475.60 29.82
Karnataka 324.17 20.8 75.05 49 74 41.1 44.4 7400 15560.16 47.56 19450.20 38.05
Kerala 430.12 13.2 32.43 55.89 125 22.8 28.6 12500 20645.76 60.55 25807.20 48.44
Madhya Pradesh 327.78 36.9 175.65 40.61 67 68.9 63.3 6700 15733.44 42.58 19666.80 34.07
Maharashtra 362.25 29.6 171.13 52.97 69 40.8 39 6900 17388.00 39.68 21735.00 31.75
Orissa 325.79 46.8 151.75 44.86 70 57.5 37 7000 15637.92 44.76 19547.40 35.81
Punjab 410.38 9.1 15.12 32.01 94.48 52 10.5 9448 19698.24 47.96 24622.80 38.37
Rajasthan 374.57 18.7 87.38 44.16 73 85.4 75 7300 17979.36 40.60 22474.20 32.48
Tamil Nadu 351.86 22.8 76.5 60.79 80 26.9 57.2 8000 16889.28 47.37 21111.60 37.89
Uttar Pradesh 365.84 33.4 473 47.79 100 32 33.1 10000 17560.32 56.95 21950.40 45.56
West Bengal 382.82 28.6 173.22 44.58 70 14.3 22.5 7000 18375.36 38.09 22969.20 30.48
All India 356.30 28.3 2209.24
43.1 41.8

29