understanding organizational traps in implementing service...
TRANSCRIPT

Understanding Organizational Traps in Implementing
Service-Oriented Architecture
Xitong Li
Working Paper CISL# 2013-14
February 2013
Composite Information Systems Laboratory (CISL)
Sloan School of Management, Room E62-422
Massachusetts Institute of Technology
Cambridge, MA 02142

Understanding Organizational Traps in
Implementing Service-Oriented Architecture
by
Xitong Li
B.S., Control Science and Engineering - Tsinghua University, P.R. China, 2004
Ph.D., Control Science and Engineering - Tsinghua University, P.R. China, 2010
SUBMITTED TO SLOAN SCHOOL OF MANAGEMENT IN
PARTIAL FULFILLMENT OF THE REQUIREMENTS FOR THE DEGREE OF
MASTER OF SCIENCE IN MANAGEMENT RESEARCH
AT THE
MASSACHUSETTS INSTITUTE OF TECHNOLOGY
FEBRUARY 2013
© 2013 Xitong Li. All rights reserved.
The author hereby grants to MIT permission to reproduce and to
distribute publicly paper and electronic copies of this thesis document
in whole or in part in any medium now known or hereafter created.
Signature of Author: __________________________________________________________________
Sloan School of Management
February 12th, 2013
Certified by: _________________________________________________________________________
Stuart E. Madnick
John Norris Maguire Professor of Information Technologies, MIT Sloan School of Management
& Professor of Engineering Systems, MIT School of Engineering
Thesis Supervisor
Accepted by: _________________________________________________________________________
Ezra Zuckerman
Professor, MIT Sloan School of Management

2
(This page left intentionally blank)

3
Understanding Organizational Traps in
Implementing Service-Oriented Architecture
by
Xitong Li
Submitted to Sloan School of Management on February 20h, 2013
in Partial Fulfillment of the Requirements for the Degree of
Master of Science in Management Research
Abstract
One of the major objectives of implementing service-oriented architecture (SOA)
is to enhance IS agility and improve IT-business alignment. However, the contradictory
experiences about SOA implementation turn out to be a paradox: why many
organizations failed to meet their expectations about SOA implementation efforts, while
others succeeded? Contrast to prior research on SOA, this study adopts the process
perspective and provides plausible theoretical explanations for the “SOA
implementation paradox”. The study uses multiple case studies and literature review to
develop a system dynamics model which highlights the feedback loops and time delay
during the SOA implementation process. The results reveal the dynamic characteristics
of learning curve of SOA implementation and two organizational traps (technology
learning trap and implementation effectiveness trap) associated with SOA
implementation. The theory of the organizational traps can be generalized to a broad
context of innovative IS implementation. Further, the theoretical causes of the traps are
discussed.
Thesis Supervisor: Professor Stuart E. Madnick
Title: John Norris Maguire Professor of Information Technologies, MIT Sloan School of
Management & Professor of Engineering Systems, MIT School of Engineering

4
(This page left intentionally blank)

5
Acknowledgements
I am sincerely thankful to Prof. Stuart Madnick for giving me this opportunity to
complete my thesis under his guidance. I would also like to mention my gratitude
towards Allen Moulton for guiding me in the right direction and helping me out with
the case study interviews.
I am thankful to Sharon Cayley and the entire staff of Sloan School of
Management for providing me with all the support and encouragement; and being
extremely flexible and patient in accommodating with my queries and requests. I
express my gratitude towards the Sloan cohort for contributing to my learning through
class projects, discussions and for the wonderful times we shared.
On a personal front, this is dedicated to my parents and my siblings, for
supporting me in this endeavor, and not letting me lose sight of my target.
Finally, I would like to acknowledge that the work reported herein was
supported, in part, by the MIT Lincoln Laboratories and the Defense Intelligence
Agency (DIA) under the "Understanding the Challenges to Net-Centric Systems and
Mitigating Approaches" project, MIT Lincoln Laboratory contract 16-11-TCO-0013. Any
opinions, findings, and conclusions or recommendations expressed in this material are
those of the authors and do not reflect the official policy or position of MIT Lincoln
Laboratory, the Defense Intelligence Agency or the Department of Defense.

6
(This page left intentionally blank)

7
Table of Contents
Abstract.......................................................................................................................................... 3
1. Introduction .......................................................................................................................... 8
2. Theoretical Background .................................................................................................... 14
2.1 Variance Research on SOA ............................................................................................. 14
2.1.1 Potential Benefits of SOA ......................................................................................... 14
2.1.2 Critical Success Factors of SOA Implementation ................................................. 15
2.2 Capability Traps in Process Improvement ................................................................... 16
3. Research Methodology ...................................................................................................... 19
3.1 Sample Selection ............................................................................................................... 20
3.2 Data Collection ................................................................................................................. 21
3.3 Data Analysis .................................................................................................................... 23
4. Model ................................................................................................................................... 26
4.1 Balancing Loop B1 ........................................................................................................... 28
4.2 Balancing Loop B2 & B3 .................................................................................................. 30
4.3 Reinforcing Loop R1 ........................................................................................................ 32
4.4 Reinforcing Loop R2 ........................................................................................................ 34
4.5 The Causal-Loop Model .................................................................................................. 36
5. Theory .................................................................................................................................. 40
5.1 Learning Curve of SOA Implementation ..................................................................... 40
5.2 Organizational Traps ....................................................................................................... 43
5.3 Causes of the Traps .......................................................................................................... 46
6. Implication .......................................................................................................................... 52
6.1 Research Implication ....................................................................................................... 52
6.2 Practice implication ......................................................................................................... 55
References ................................................................................................................................... 57

8
Understanding Organizational Traps in
Implementing Service-Oriented Architecture
1. Introduction
In an increasingly fast-changing environment, it is important for an organization to
be able to adapt its IT systems and quickly respond to changing business conditions.
Such an ability is defined as the organization’s information systems (IS) agility1 [1] and
has been considered as a key facilitator to enhance dynamic capabilities [2] and
competitive advantages [3, 4]. However, the traditional IT systems, e.g., Enterprise
Resource Planning (ERP) systems, are usually designed using a monolithic architecture
and built as integrated sets of software modules linked to a common database, handling
corporate functions like finance, human resources, material management, and sales [5].
It is thus quite difficult, expensive and time-consuming for organizations to make
changes to their IT systems designed using the monolithic architecture [1]. To address
such difficulties, service-oriented architecture (SOA) has been advocated as a new
computing paradigm to build IT systems in organizations [6]. In this paper, SOA refers
to “the architecture style that supports loosely coupled services to enable business
flexibility in an interoperable, technology-agnostic manner” [7] and consists of a
composite set of business-aligned services that support a flexible and dynamically
1 Information System (IS) agility is defined by Choi et al. (2010) as “the ability to quickly make changes to
IT applications in response to changing business conditions”.

9
reconfigurable end-to-end business process realization using interface-based service
descriptions2.
One of the major objectives of implementing SOA is to enhance the IS agility of
organizations and improve IT-business alignment [1, 8, 9]. Many organizations with the
expectation to reap those potential benefits have invested in SOA. A recent Forrester
report reveals that 71% of the enterprises surveyed are already using SOA or will be by
the end of 2011 [10]. However, mixed outcomes about SOA implementation have been
often reported. For example, a 2007 InformationWeek Web survey of 278 IT
professionals found that 32% of those using SOA said those projects fell short of
expectations and “of those, 58% said their SOA projects introduced more complexity
into their IT environments, and 30% said they cost more than expected. Out of all
respondents using SOAs, just 10% said the results exceeded expectations” [11]. In stark
contrast, CA Technologies recently released a survey which covered 615 companies in
the process of SOA-based efforts and found that 92% of their SOA initiatives met or
exceeded business unit objectives [12]. The contradictory outcomes turn out to be a
paradox of SOA implementation. The key puzzle regarding the “SOA implementation
paradox” is why many organizations failed to meet their expectations about their efforts
2 Herein it is necessary to emphasize the specificity and difference of SOA, comparing to traditional ERP
systems. While ERP implementation often focuses on integrating multiple IT systems across the
organization, SOA implementation focuses on improving the organization’s IS agility and flexibility.
Because of the difference between SOA and ERP, we are able to develop the theory presented in this
paper which is different from prior theories developed upon extant studies on ERP.

10
on SOA implementation, while others succeeded. Given the growing significance of
SOA, it is surprising that there is a scarcity of academic research addressing the SOA
implementation paradox [13].
Mohr (1982) identifies two different perspectives of organizational research:
variance and process perspectives [14]. According to Mohr’s distinction, variance
research seeks to explain variation in outcome variables by associating them with
predictor variables and necessary and sufficient conditions. By contrast, process
research seeks to “explain outcomes by examining sequences of events over time” [5].
To date, prior academic research on SOA has largely adopted the variance perspective.
Specifically, prior research on SOA has intensively claimed potential benefits and
advantages of SOA [9, 15, 16], but there are only a few empirical works actually
measuring the benefits of specific SOA implementation [17, 18]. Despite the potential
benefits claimed, organizations implementing SOA often encounter difficulties in their
efforts. To address those difficulties, more recent, yet relatively even few, literature
turns to explore critical success factors (CSFs) that potentially affect SOA
implementation. Research in this strand tends to enumerate a number of factors that
potentially facilitate or impede organizations to receive the intended benefits of SOA.
Prior research, however, failed to explore the causal relationships and, particularly,
complex interactions between those critical factors. After all, prior research on SOA
largely from the variance perspective posits an invariant relationship between

11
antecedents and outcomes, which is too stringent to explain organizational phenomena
[19]. Besides that, after an extensive literature review, Luthri et al. (2009a) found “there
is little or no realistic data available on what, if anything, firms are doing in practice to
address the inherent challenges of implementing a service-oriented architecture…” [13].
There is thus a clear need for research to provide qualitative data from case studies on
SOA implementation. In sum, to the best of our knowledge, there has been neither
theoretical formulation nor empirical examination of SOA implementation in the
literature. This paper seeks to fill the gap at those aspects.
Noticing the widely-reported contradictory experiences with SOA
implementation, the research presented in this paper suggests that we may be able to
make some sense of the apparently inconsistent outcomes by shifting the focus away
from the variance perspective to the process perspective. Unlike the variance research,
the process studies “have lower aspirations about ‘explained variance’, but provide
richer explanations of how and why the outcomes occur when they do occur” [19]. As
demonstrated in this paper, the process perspective is appropriate to specify temporal
relations among theoretical elements and study the micro-processes of capability-
enhancing organizational change [20] and thus allow us to explain different experiences
with SOA implementation.
Using process perspective, this paper interprets the SOA implementation process
as a specific case of IT-based improvement process of an organization’s IS agility and

12
conceptualizes it as a form of organizational change. The core research question is: how
various critical elements interact with each other during the SOA implementation
process and result in the difficulties (so-called organizational traps3) associated with the
process?
In answering this question, this paper develops a theory through an inductive
research strategy which was successfully used in Repenning’s works on manufacturing
process improvement [20, 21]. Note that our research does not simply apply the existing
organizational theory of capability traps [20, 21] to understanding the difficulties in
SOA implementation. In fact, based on our observation, SOA implementation has at
least two inherent characteristics distinct from manufacturing process improvement
(see the discussion in the next section). Accordingly, the model and theory developed
upon case studies and literature review suggest that two different but intertwined
organizational traps, technology learning trap and implementation effectiveness trap,
play important roles in the difficulties of many SOA implementation efforts. As will be
explained in detail, technology learning trap refers to the situation in which certain
innovative technology is less understood due to insufficient learning, the more difficult
and complex the technology is perceived. Implementation effectiveness trap refers to
the situation in which SOA is misperceived to be inappropriate when SOA
3 Organizational traps in this paper specifically refer to technology learning trap and implementation
effectiveness trap, both of which will be introduced in the next paragraph.

13
implementation is temporally less effective and the perceived benefits of SOA are
delayed. Both organizational traps are supported by the empirical evidences from case
studies and literature review and are distinct from the existing theory of capability traps
and have not been discussed in the existing literature.
This research makes two important contributions to the literature on information
systems and organizational studies. First, the theoretical contribution provides the
theory of organizational traps in SOA implementation from the process perspective.
The theory constitutes a theoretical explanation for the contradictory outcomes of
innovative technology implementation in general and SOA implementation in
particular. Second, the empirical contribution provides meaningful qualitative data
about how organizations have implemented SOA in practice. The empirical results
reveal that the inherent tradeoffs of SOA implementation between short-term
performance drop and potential long-term benefits and between local project needs and
organization-level IS agility. Human agency of organizational actors plays an important
role in the tradeoffs and may facilitate or impede SOA implementation, depending on
different organizational contexts.

14
2. Theoretical Background
We organize the relevant academic research into two parts. The first part is the prior
studies on SOA, most (if not all) of which have adopted the variance research
perspective. Two strands can be distinguished: research on potential benefits of SOA
and research on critical success factors of SOA implementation4. The second part is
Repenning’s works on capability traps in manufacturing process improvement [20, 21].
2.1 Variance Research on SOA
2.1.1 Potential Benefits of SOA
The potential benefits of SOA have been numerously claimed in the literature [9, 15].
An early work [22] has analyzed multiple cases and suggested that the realized benefits
of SOA can be classified into two groups: improved business agility and cost reduction.
The benefits contributing to improved business agility include easier integration of
components and systems [16], better IT-business alignment [8], and a quicker response
to market change [1]. The benefits of cost reduction consist of lower application
development costs, reuse of existing components/services [23], and lower maintenance
costs. The recent work [9] develops a comprehensive conceptual framework to
understanding the economic potential of SOA. They built on the resource-based view
and argued that SOA can enhance an organization’s IS capabilities which is
4 Although there are extensive prior studies on the success and challenges of ERP implementation,
research focusing on the challenges of SOA implementation is very limited. This is one of the motivations
of this paper.

15
conceptualized as IS agility [1]. IT developers’ productivity is also believed to be
enhanced by IS reusability and interoperability from SOA design principles [1, 9, 24].
This strand of literature generally adopts technological determinism and omits
important organizational elements associated with the SOA implementation process.
Despite the numerous benefits claimed in the literature, organizations adopting SOA
cannot receive the intended benefits automatically.
2.1.2 Critical Success Factors of SOA Implementation
More recent (yet relatively few) literature turns to explore critical success factors
(CSFs) and challenges that potentially affect SOA implementation. The work [25]
explores the organizational constraints and challenges experienced by firms considering
the enterprise-wide SOA implementation. They analyzed several case studies and
propose a set of seven best practices for successful SOA implementation. The top three
are: 1) get commitment at the broad level; 2) manage expectations and invest in SOA for
the long term; and 3) align the entire organization along the SOA strategy. The work
[13] presents six factors that influence the organizational adoption of SOA. The work
[26] examines two organizational factors that are potentially critical in ensuring the
success of SOA implementation: top management support and centralization of IT
decision-making. Their empirical results from hypothesis testing indicate that top
management support is a significant factor, yet centralization of IT decision-making is
not. The recent work [27] conducts a comprehensive research and identifies 20 factors

16
based on their review of 34 SOA studies and 22 interviews. Their results show that
“building strong support for enterprise-wide core human resources” and “clear goal-
setting based on business value” are ranked among top 3 of their lists.
The research strand on CSFs tends to list a number of factors that potentially
affect SOA implementation and facilitate or impede organizations to receive the
intended benefits. Like the research on potential benefits of SOA, the research on CSFs
omits important organizational elements associated with the SOA implementation
process. Also, prior research on SOA fails to explore the causal relationships among
those critical factors. More importantly, none of them investigates how those critical
factors interact with each other during the dynamics of the multi-month/year
implementation process. Therefore, prior research on SOA offers little in the way of
theoretical explanations for the puzzling SOA implementation paradox.
2.2 Capability Traps in Process Improvement
Another relevant literature is Repenning’s works on capability traps in process
improvement [20, 21] and innovation implementation [28]. His research focuses on
Total Quality Management (TQM) initiatives in manufacturing and develops causal-
loop diagrams and system dynamic models to understand the impact of time delays
between investing in process improvement and realizing the benefits. He argues that
the long delays in the feedback loops of process improvement create the dynamics of
the “worse-before-better” pattern and cause capability traps and self-confirming errors.

17
The phenomenon of beneficial improvement and innovations that go unused
have been documented not only in TQM but other administrative initiatives, such as
human resource practices [29] and best practices for product development [30].
Although Repenning’s work has been successfully used to explain process
improvement in manufacturing, it is unknown whether or not the phenomenon had
happened during IS improvement efforts in general and SOA implementation in
particular. To date, none of IS literature has provided theoretical explanation for the
contradictory outcomes of SOA implementation from the perspective of improvement
process. As one of the major contributions, this research finds two organizational traps
(technology learning trap and implementation effectiveness trap), which result from the
interaction between human judgmental biases and the physical structure of IS
development processes, may explain the difficulties in many SOA implementation
efforts.
It is worth noting that this research does not simply apply the theory of capability
traps to understanding the challenges in SOA implementation. Our observation reveals
that SOA implementation has two inherent characteristics that are distinct from TQM
and process improvement programs in manufacturing:
1) SOA implementation often requires enterprise-wide involvement and
commitment, while process improvement programs often focus on certain work
process (e.g., manufacturing, product development). It is more challenging to call

18
for and maintain enterprise-wide, long-term involvement and commitment in
organizations.
2) In regard to process improvement programs, it is relatively easier to identify
defects and correct them when the process capability is low [20]. Thus, favorable
results and word of mouth are easier to achieve and come earlier from the
investment in improvement. Unfortunately, SOA implementation is not such a
case. The learning curve of SOA technology creates longer substantial delay and
postpones the potential benefits. It should be anticipated that developers may
perceive little SOA effectiveness when they start learning how to use IT systems
developed by SOA design principles. Overcoming the learning-curve barrier is
critical to achieve perceived benefits from SOA.

19
3. Research Methodology
The main research methodology used in this study is system dynamics modeling
[31] which has been shown to be a powerful modeling tool for organizational theory
building [20, 31-33]. Since Abdel-Hamid and Madnick started using it in investigating
software project management in late 1980s [34], system dynamic modeling has
continued to receive increasing attention in IS research [1, 35-37]. This research adopts
system dynamics modeling for three primary reasons.
First, system dynamics modeling highlights the key elements associated with the
process of organizational change which are often omitted in IS studies [19, 38]. System
dynamics modeling provides “a useful context in which to study the micro-processes
that impede or facilitate competence-enhancing change” [20] and is compatible with the
focus of process perspective of organizational research to “explain outcomes by
examining sequences of events over time” [5, 19]. Thus, the research approach that
specifically includes elements of process is particularly appropriate here.
Second, as Weick (1979) notes, “It is the network of causal relationships that
impose many of the controls in organizations and that stabilize or disrupt the
organization. It is the patterns of these causal links that account for much of what
happens in organizations” [39]. Unfortunately, Law and Urry (2004) pointed out “social
science method has problems in understanding non-linearity relationships and flows”
[40]. Compared to other organizational research methodologies, system dynamics

20
modeling has its strengths and is particularly useful here, because it allows focusing on
the feedback loops and nonlinearity of the change associated with SOA implementation
process [31].
Third, system dynamics modeling specifically focuses on the effects of the
feedback delay on organizational change and learning [31, 41]. Thus, it allows
generating unique insights into the dynamics of implementation and appropriation of
SOA, which are less likely to be produced using other research methods.
3.1 Sample Selection
We employed multiple comparative case study design in this research. Case study is
justified as a research strategy that “attempts to examine: (a) a contemporary
phenomenon in its real-life context, especially when (b) the boundaries between
phenomenon and context are not clearly evident” [42]. Although case studies often
report phenomena observed in a single case [43] or two comparative cases [20, 38],
multiple case studies have been effectively used in IS research [5, 34, 44]. Multiple
comparative case studies were conducted here for two reasons. First, Robey et al. (2002)
note that “Although some richness of detail may be sacrificed with additional cases, the
ability to compare phenomena across different contexts is enhanced” [5]. By using the
case cluster method [45], the ability of multiple case comparisons can be even enhanced.
Second, multiple case study design is compatible with our research interest in
generating an explanatory theory that is applicable to a general organizational context

21
rather than that for a specific one. The research sample consists of 10 North American
organizations that have implemented or been implementing SOA in recent years,
including EMC, Raytheon, Oracle, SAP, MIT Lincoln Lab and several US government
agencies. While some of them only implemented SOA in their own organizations like
US government agencies, most of others, like EMC, Raytheon, Oracle, SAP and MIT
Lincoln Lab, have implemented SOA not only in their own organizations but for other
organizations as contractors. Thus, the sample covers all of the contractual parties
involved in SOA implementation projects.
3.2 Data Collection
In this research, we followed the standard method of data collection that was used
in Abdel-Hamid and Madnick’s works on software project management [34]. Sterman
(2000) also suggested a similar method of data collection and analysis which mainly
uses semistructured interviews and literature review. Specifically, we took three steps
as follows.
First, the initial series of 10 unstructured interviews were conducted with 14
different managers and developers. Interviews lasted between 60 and 90 minutes. After
the purpose of the research was explained, informants began by describing their
professional background. They were then asked to share their experience about SOA
implementation efforts in the organization. Finally, they were asked to speculate the
potential key challenges and elements that facilitated or impeded those SOA

22
implementation efforts. In particular, we focused on collecting data that reveals the
dependencies between those elements and the interactions of the elements occurring
over time. To build more confidence in our findings and to come up with “holistic and
multifaceted explanations of change” [46], numerous follow-up conversations on
telephone and via email, intensive documentation review, and direct on-site
observation were also conducted to supplement the data collection. The various
techniques of data collection is particularly beneficial in theory generation because “it
provides multiple perspectives on an issue, supplies more information on emerging
concepts, allows for cross-checking, and yields stronger substantiation of constructs”
[38]. The product of the information collected at the first phase is a “skeleton” model
which served as a useful guideline for the data collection at subsequent steps. As
Forrester (1968) suggested in his classic book on system dynamics, “A model should
come first. And one of the first uses of the model should be to determine what formal
data need to be collected” [47].
Second, an extensive literature review was conducted after a “skeleton” model
was built. The scope of the literature review covers the literature on organizational
studies [5, 14, 38], system dynamics [20, 31-33], and information systems [34] including
SOA [1, 9, 24] and ERP [5], just listed a few. The literature review not only provides
guidance in techniques for qualitative data collection and analysis but, more
importantly, filled in many gaps of the “skeleton” model, leading to a more detailed

23
version of the model. In particular, each causal link in the model was justified by the
supportive evidence from the literature review, a key step of the model building.
Third, another series of 15 interviews were conducted with 22 interviewees. We
sampled the interviewees including CIO, middle-level IT managers, and IT developers,
so that the evidences could reflect the perspectives of various organizational levels.
With the concepts and model generated from the prior two stages, the interviews of this
phase became more structured and concentrated than that in the first phase. Likewise,
various techniques of data collection were used such as numerous follow-up
conversations, intensive documentation review and on-site observation. As typical with
interpretive research based on qualitative data [46, 48], we triangulated across the
multiple data sources and proceeded iteratively between the data gathered and the
model.
3.3 Data Analysis
The data analysis was begun with the traditional methods for inductive research
study. Constructs and patterns of interest were identified from the initial data analysis
and categories of the constructs formed based on the coding. Key variables and causal
links among them emerged during the analysis. Then, we used the causal loop
diagramming method common in system dynamics [20, 31] to develop the “skeleton”
model. While developing the model, we emphasized the essential feedback loops that
would generate the patterns of SOA implementation emerged from the coded data.

24
These feedback loops allow the emerging model and theory to focus on the processual
elements and exploring the dynamics of the implementation process. Following the
similar methods, data analysis after the data collection in the second and third phase
provided an opportunity to refine, improve and validate the emerging model.
Note that in this research data analysis and data collection actually overlapped
and were iteratively conducted. Overlapping data analysis with data collection, as
Eisenhardt (1989) notes, “not only gives the researcher a head start in analysis, but more
importantly allows researchers to take advantage of flexible data collection”. Further,
the data collected in a later phase allowed us to “criticize it, expose it again and so on in
an iterative process that would continue as long as it proves to be useful” [34] so that
the model is refined and improved 5 . As indicated above, we combined various
techniques of data collection synergistically and conducted data analysis overlapping
data collection through iterative methods of constant comparison [49]. In such a way,
we were able to produce complete accounts of the organizations that had implemented
or were implementing SOA. Thus, the resulting causal-loop model is both tightly
grounded in our data from case studies and literature review and provides a logical and
internally consistent explanation for how the micro-level interactions involved in SOA
5 Besides informative interviews, some IT managers/developers even spent 2-4 hours with the authors
together and went through every single variable and causal link of the model. Their inputs and feedbacks
allowed the authors produce the final model largely grounded upon empirical experiences of those
practitioners. By doing so, the validity of the model was strengthened by being validated directly with
the sources.

25
implementation combined to create the more macro-level dynamics of the entire
process.

26
4. Model
In this research, we use system dynamics modeling to develop causal-loop diagrams
for the theory building [31]. System dynamics models consist of stocks, flows and causal
links between variables. A stock denoted by a rectangle represents the level that can
accumulate or deplete over time. Flows denoted by straight arrows with valves cause
an increase or decrease in stock levels. Stocks and flows complement positive (self-
reinforcing) and balancing (self-correcting) feedback loops which play an important role
in determining the dynamic behaviors of organizational systems.
Note that causal-loop diagrams in this paper are not intended to provide an
accurate mathematical specification of the causal links. Yet by explicitly demonstrating
feedbacks with nonlinearity, discontinuities and time delays between causes and effects,
causal-loop diagramming enables us to reach a new level of specificity concerning the
mutual causality. Thus far this approach has been effectively used in organizational
theory development [20, 21, 32, 33, 50]. Specifying a formal mathematical model is often
the next step in testing the theories embodied in the causal-loop diagrams [20] and is
beyond the focus of this paper. It is also worth noting that in building the model, we
focused on the evidences that are generalizable across multiple organizations instead of
those merely applied to a specific one. By doing so, we were able to make the model
built in a broad organizational context and produce general theoretical insights and
implications.
27
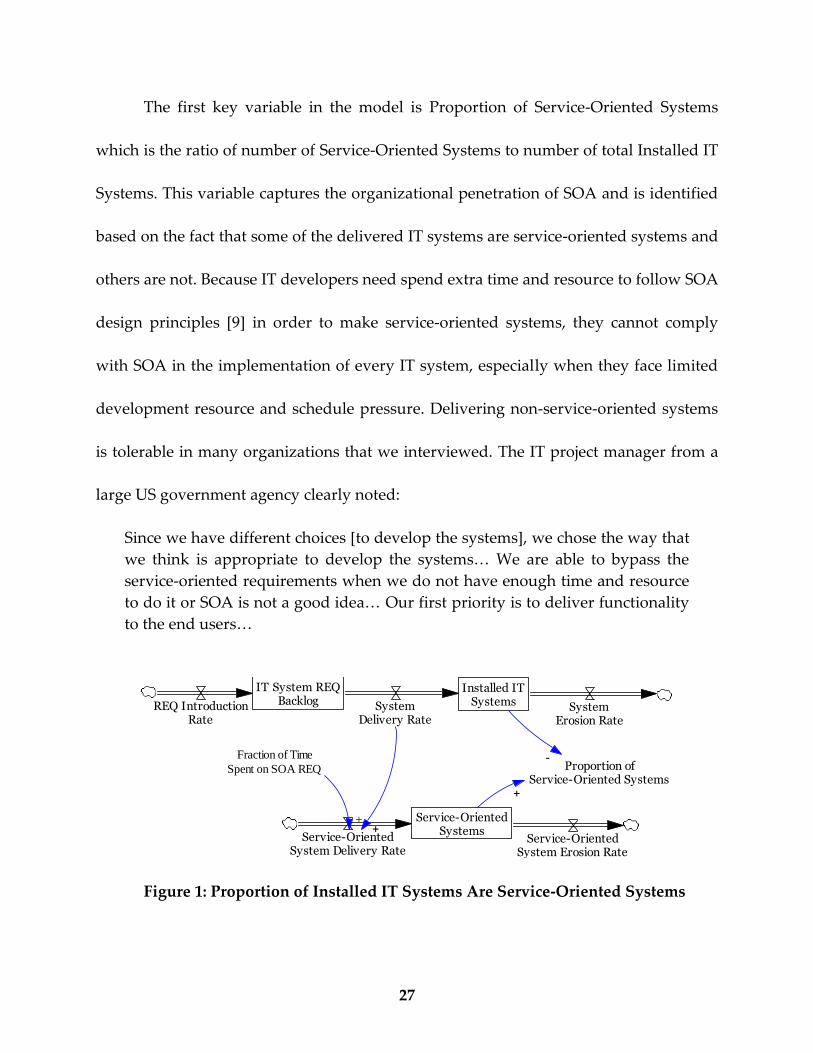
The first key variable in the model is Proportion of Service-Oriented Systems
which is the ratio of number of Service-Oriented Systems to number of total Installed IT
Systems. This variable captures the organizational penetration of SOA and is identified
based on the fact that some of the delivered IT systems are service-oriented systems and
others are not. Because IT developers need spend extra time and resource to follow SOA
design principles [9] in order to make service-oriented systems, they cannot comply
with SOA in the implementation of every IT system, especially when they face limited
development resource and schedule pressure. Delivering non-service-oriented systems
is tolerable in many organizations that we interviewed. The IT project manager from a
large US government agency clearly noted:
Since we have different choices [to develop the systems], we chose the way that
we think is appropriate to develop the systems… We are able to bypass the
service-oriented requirements when we do not have enough time and resource
to do it or SOA is not a good idea… Our first priority is to deliver functionality
to the end users…
Figure 1: Proportion of Installed IT Systems Are Service-Oriented Systems
Service-OrientedSystems
IT System REQBacklog
Installed ITSystems
Service-OrientedSystem Delivery Rate
Service-OrientedSystem Erosion Rate
REQ IntroductionRate
SystemDelivery Rate
SystemErosion Rate
+
Proportion ofService-Oriented Systems
-
+
Fraction of Time
Spent on SOA REQ
+

28
Figure 1 shows the stock of IT system requirements backlog accumulates as
system requirements are introduced over time. The delivered IT systems are installed
with System Delivery Rate. Service-Oriented System Delivery Rate is a fraction of the
overall System Delivery Rate. The fraction coefficient depends on the fraction of
working hours spent on implementing SOA requirements. The “+” sign at the head of
the causal link from System Delivery Rate to Service-Oriented System Delivery Rate
means there is a positive causal relationship between the two variables. That is, all other
factors are equal, the higher System Delivery Rate, the higher Service-Oriented System
Delivery Rate.
We present the key feedback loops in the rest of this section and then synthesize
them in the causal-loop model. Readers may need to keep the entire causal-loop model
(see Figure 6) in mind while reading through each of the feedback loops.
4.1 Balancing Loop B1
Figure 2 shows the higher Proportion of Service-Oriented Systems enhance the
organization’s IS agility [1]. A top-level IT manager working in EA group for a large
international oil company commented the benefits of services to IS agility:
You can wrap legacy and get to components and data faster. Eventually you’ll
become more of a process-oriented firm. You can link services together to get an
optimum value chain. When you can automate value chains, you become more
agile and achieve faster time to market. The IT people are going to have to sell
the concept to non-IT people. We are aiming to become a more process driven
company… Right now we’re just trying to get the capability developed.

29
Figure 2: Balancing Loop B1: Implement Service-Oriented Systems under Pressure
The IS Agility Gap, defined as the difference between the Desired IS Agility and the
actual IS Agility, results in the Pressure to Implement SOA. Management Commitment
is also required along with IS Agility Gap to generate Pressure to Implement SOA,
reflecting the fact that management commitment and support is a critical success factor
of SOA implementation [26, 27]. Under the Pressure to Implement SOA, developers
have to put a fraction of the work hours spent on implementing SOA requirements. The
more time spent on SOA REQ, the higher Service-Oriented System Delivery Rate.
However, the rise of Service-Oriented System Delivery Rate can only be realized after a
substantial time delay, because developers have to learn how to build service-oriented
systems. The balancing loop B1 in Figure 2 represents the fact that developers
implement service-oriented systems under certain pressure.
Service-OrientedSystems
Service-OrientedSystem Delivery Rate
Service-OrientedSystem Erosion Rate
<Installed IT Systems>
<System Delivery Rate>
+
Proportion ofService-Oriented Systems
-
+
IS Agility
Desired IS Agility
IS Agility Gap
Pressure toImplement SOA
Fraction of Time Spent on SOA REQ
+
-
+
+
+
+
B1
ImplementService-Oriented Systems
Management Commitment+
Delay

30
4.2 Balancing Loop B2 & B3
Figure 3 shows the normal work structure of IT developers in their daily work lives.
With the IT System REQ Backlog and the cycle time requested by business units for
delivering IT systems, IT managers and developers calculate the Desired Delivery Rate.
The IT department has its actual System Delivery Rate which is determined by
Developer Headcount, a developer’s average Development Productivity, and how
much time developers need to spend on functional requirements. Development
Productivity refers to on average how many IT systems6 that a developer can deliver
within one unit of time (say one month) when the developer spends all of his work
hours on the development of functionalities. Differently, System Delivery Rate refers to
how many IT systems that the development team as a whole can deliver within one unit
of time during which the developers may spend part of their work hours on
implementing SOA requirement. System Delivery Rate is a more salient performance
indicator. An interviewee who used to be the CIO of a large US university told us that:
As a manager, I usually don’t care much about a single developer’s
productivity. I always care about how fast we [as a team] are able to deliver the
systems requested [by business units]. In other words, we mostly care about the
overall system delivery rate.
6 For measurement consideration, a developer’s development productivity can be measured as unit of
software components, modules or functional features.

31
Figure 3: Balancing Loop B2 & B3: Work Harder to
Deliver on Schedule and Bypass SOA
Delivery Rate Gap refers to the difference between Desired Delivery Rate and
System Delivery Rate and creates the pressure to deliver IT systems on schedule,
reflecting the fact that the primary tasks of developers are to develop and deliver IT
systems to end users. Pressure to Deliver on Schedule has two effects on developers’
work decisions: on the one hand, developers are forced to spend a substantial faction of
time on implementing functional requirements. On the other hand, the developers have
to reduce part of their work hours that would have been spent on SOA requirements
otherwise. The balancing loop B3 captures such a situation in which developers could
bypass the SOA requirements in order to deliver the functionalities of the IT systems on
schedule. In fact, when asked how developers made the tradeoff of work hours under
the pressure to deliver systems on schedule, the IT manager of an interviewed
organization replied:
The requirement list we received from other departments usually put
functional requirements on top of non-functional [service-oriented]
requirements. But those non-functional requirements were not mandatory.
When we received the requirement list, we would check it and if we don’t have
enough time, we just cut off those non-functional requirements.… After all, we
IT SystemREQ Backlog
Installed ITSystems REQ Introduction
RateSystem Delivery Rate
SystemErosion Rate
Fraction of TimeSpent on SOA REQ Development Productivity
Developer HeadcountFraction of Time Spent onFunctional REQ
Cycle Time ofSystem REQ BacklogDesired Delivery RateDelivery Rate Gap
Pressure to Deliveron Schedule
+ ++
+
-++
+
- -
-
B2
Work Harder
B3
Bypass SOA REQ

32
have to deliver the capabilities [functionalities of the IT systems] to our end
users within the limited schedule and resources.
The principle software architect of a large software vendor also responded to this
tradeoff:
Business only care about one thing - the deadline. Business don’t care how we
do that, they only care about timely result. And that’s why people who
implement SOA projects in some cases prefer to cut corners just to meet the
deadline.
4.3 Reinforcing Loop R1
Service-oriented systems developed using SOA design principles are more reusable,
interoperable and easier to integrate with other IT systems [1, 9]. Therefore, it is easy for
developers to make use of the existing reusable service-oriented systems (e.g.,
components or services) when they develop new IT systems and integrate them with
existing service-oriented systems. In this sense, SOA implementation actually makes the
development job easier and allows developers to develop IT systems faster. In other
words, SOA implementation increases Development Productivity of the developers on
average [1, 9, 24]. For example, the IT manager from a large US insurance company
commented the benefits of reusable services to development productivity:
How many services we have depends on what you’d consider a service, but we
have more than 200. We expect reuse of all of them. We’re getting probably 80%
reuse. Kevin would work with developers to identify best services. We are
designing business architecture. When we do that, reusable services show up
easily. We create a reusable service that maps the complexity of a given
requirement. Top-down business architecture identifies reusable business
architecture and eases the system development.

33
Figure 4: Reinforcing Loop R1: Implement SOA through Productivity Increase
In Figure 4, we use a key variable Effectiveness of SOA to represent the extent to
which the developers’ Development Productivity is increased, on average, compared to
their Base Development Productivity in the normal situation prior to SOA
implementation. This also reflects many IT managers’ beliefs and rationale of
implementing SOA in their organizations. With higher System Delivery Rate, Delivery
Rate Gap is closed and the Pressure to Deliver on Schedule is released. As a result,
developers with less schedule pressure are more likely to spend more time on
developing service-oriented systems, increasing the System-Oriented System Delivery
Rate. Eventually, the Proportion of System-Oriented System will rise further and SOA
becomes more effective. The entire process becomes a reinforcing loop R1 which is
labeled as “Implement SOA through Productivity Increase” in Figure 4. A reinforcing
Service-OrientedSystems
IT SystemREQ Backlog
Installed ITSystems
Service-OrientedSystem Delivery Rate
Service-OrientedSystem Erosion Rate
REQ IntroductionRate
System Delivery RateSystem
Erosion Rate
<Installed IT Systems><System Delivery Rate>
+
Proportion ofService-Oriented Systems
-
+
IS Agility
IS Agility Gap
Pressure toImplement SOA
Fraction of TimeSpent on SOA REQ
+
-
+
+
+
Effectivenessof SOA
DevelopmentProductivity
Base DevelopmentProductivity
+
+
+Developer Headcount
Fraction of Time Spent onFunctional REQ
Cycle Time ofSystem REQ BacklogDesired Delivery RateDelivery Rate Gap
Pressure to Deliveron Schedule
+ ++
+
-++
+-
-
-
R1
Implement SOA through Productivity Increase
Delay
Delay

34
loop can operate as either virtuous (say better and better) or vicious (say worse and
worse) cycles, depending on its current state [31]. When the reinforcing loop R1
operates as virtuous cycles, more service-oriented systems are implemented and SOA
becomes more effective. Conversely, when R1 operates as vicious cycles, less SOA
penetration in the organization generates little effectiveness of SOA and contributes
little to the developers’ development productivity.
4.4 Reinforcing Loop R2
As discussed, Effectiveness of SOA increases the developers’ Development
Productivity, compared to their Base Development Productivity. The degree to which
extent the development productivity is increased is represented as Increase Ratio of
Productivity in Figure 5. The bigger the ratio, the more benefits are perceived by the
organizational actors (e.g., managers and developers). Choi et al. (2010) specifically
pointed out that SOA implementation effectiveness is an important determinant of the
perceived benefits and value derived from SOA.
Greater perceived benefits of SOA create favorable word of mouth in the
organization [31] and generate the additional commitment to SOA implementation
internally. The chief architect of a large US insurance company told us that:
It takes a lot to get good value from this [SOA] .net framework. You’d think the
success stories would bring more people on board... We found we had an 80%
code reduction at the user interface layer with use of this framework. Now our
framework advocates (super users) get our help. I don’t want to underestimate

35
the challenge of getting everybody on board. Jackowski’s major platform is
100% use of .net framework. We are getting over the hump.
Figure 5: Reinforcing Loop R2: Motivate Commitment through
Perceived Benefits of SOA
The causal link between results of the technology in use and the commitment
generation has also been supported by many motivation and organizational theories
[28, 51]. In this research, the commitment generated by perceived benefits of SOA are
considered to be internal or endogenous, reflecting the additional commitment actually
results from the results attribute to use of service-oriented systems. Besides the
endogenous commitment, there are exogenous sources of commitment which are
labeled as Normative Commitment. Institutional theory suggests that coercive, mimetic
and normative pressures are important factors affecting the innovation adoption [52].
The work [53] on the assimilation of enterprise systems also provides support that
Service-Oriented Systems
Service-OrientedSystem Delivery Rate
Service-OrientedSystem Erosion Rate
<Installed IT Systems> Proportion ofService-Oriented Systems
-
+
IS Agility
IS Agility Gap
Pressure toImplement SOA
Fraction of TimeSpent on SOA REQ
+
-
+
+
+
Effectivenessof SOA
DevelopmentProductivity
Base DevelopmentProductivity
Increase Ratio ofProductivity
PerceivedBenefits of SOA
+
+
+
-
+
+
Pressure to Deliveron Schedule
-
Management Commitment
+
+
R2
Motivate Commitment throughPerceived Benefits of SOA
NormativeCommitment
+
Delay
Delay

36
institutional pressures positively affect top management participation in the IT
assimilation process.
Figure 5 shows the mediating role played by Management Commitment between
Normative Commitment and SOA implementation. Management Commitment
generates Pressure to Implement SOA and forces developers to spend part of their work
hours on implementing SOA, even though they are still under the Pressure to Deliver
on Schedule. When service-oriented systems are implemented over time, SOA
implementation becomes more effective and enhances developers’ Development
Productivity. With more benefits of SOA perceived by the organization, favorable word
of mouth would generate internal commitment endogenously and enhance the total
Management Commitment. The reinforcing loop R2, labeled as “Motivate Commitment
through Perceived Benefits of SOA”, represents the dynamics of the commitment
motivation.
4.5 The Causal-Loop Model
The causal-loop model in Figure 6 includes three balancing loops and two
reinforcing loops.
The balancing loop B1 indicates developers invest part of their work hours to
implement service-oriented systems. There are two kinds of pressures that affect the
tradeoff decision of IT developers and managers: one is the pressure to deliver the
functionalities of IT systems on schedule, and the other is the pressure to SOA

37
implementation. The balancing loop B1 operates to close the IS agility gap over time, yet
management commitment to SOA plays the important role in generating the
momentum for SOA implementation.
Figure 6: The Causal-Loop Model of SOA Implementation
The balancing loop B2 represents the decision that developers would naturally
make to work harder and to get the functional development completed on schedule.
The decision actually shifts part of their work hours to the functional development and
bypasses SOA implementation, as revealed by the balancing loop B3. Both B2 and B3
indicate the tendency of developers that puts high priority on delivering functionalities
to end users on schedule, which is confirmed by many managers that we interviewed.
B2 and B3 operate to close the delivery rate gap and release the schedule pressure. It is
worth noting that there is relatively shorter delay within B2 and B3 than the delay
Service-OrientedSystems
IT SystemREQ Backlog
Installed ITSystems
Service-OrientedSystem Delivery Rate
Service-OrientedSystem Erosion Rate
REQ IntroductionRate
System Delivery RateSystem
Erosion Rate
<Installed IT Systems>
<System Delivery Rate>
+
Proportion ofService-Oriented Systems
-
+
IS Agility
Desired IS Agility
IS Agility Gap
Pressure toImplement SOA
Fraction of TimeSpent on SOA REQ
+
-
+
+
+
+
B1
ImplementService-Oriented Systems
Effectivenessof SOA
DevelopmentProductivity
Base DevelopmentProductivity
Increase Ratio ofProductivity
PerceivedBenefits of SOA
+
+
+-
+
+
Developer Headcount
Fraction of Time Spent onFunctional REQ
Cycle Time ofSystem REQ BacklogDesired Delivery RateDelivery Rate Gap
Pressure to Deliveron Schedule
+
+
+
+
-++
+
-
-
-
B2
Work Harder
B3
Bypass SOA REQ
R1
Implement SOA through Productivity Increase
Management Commitment
+
+
R2
Motivate Commitment throughPerceived Benefits of SOA
NormativeCommitment
+
Delay
Delay

38
within B1. In case of a large delivery rate gap (e.g., urgent IT functionalities are
requested by end users from business units), it is very likely for the IT managers and
developers to make the decision that bypasses the SOA requirements and accelerates
the development of functionalities. This is because System Delivery Rate is a more
salient performance indicator associated to closing the Delivery Rate Gap more quickly,
while IS Agility is an organizational, less salient performance indicator. That human
beings tend to overemphasize salient factors when processing attributions is a well-
known cognitive and perceptual bias [54]. Since bypassing SOA requirements only
undermines the IS agility in the long term, it is less likely for people to attribute the
unsatisfactory IS agility to such shortcuts due to the substantial delay. In contrast,
closing the Delivery Rate Gap more quickly may probably bring IT managers and
developers favorable gains or avoid negative words from other organizational actors
(e.g., end users from business units).
The reinforcing loop R1 represents developers’ development productivity
increase over time with more and more service-oriented systems installed in the
organization, releasing the Pressure to Deliver on Schedule. Under less intense schedule
pressure, it is more likely for IT managers and developers to invest their work hours in
SOA implementation. However, developers cannot immediately acquire the knowledge
of SOA considering the technical complexity [1] and thus cannot increase their
development productivity in a short period. The substantial delay in the reinforcing

39
loop R1 has two important effects on the decisions of IT managers and developers. On
the one hand, the substantial delay suggests managers have to keep investing in SOA
for a long time and sacrifice the system delivery rate before the development
productivity takes off. This means the “worse” period of the “worse-before-better”
pattern [21] may last long, but apparently, not every organization or manager would
tolerate a substantially long “worse” period. On the other hand, the substantial delay
makes the causal link between the effectiveness of SOA and system delivery rate
uncertain and less salient. It is thus difficult for people to attribute the rise of system
delivery rate to the investment in SOA implementation several months or even years
ago, because people tend to attribute to more available and salient causes due to
cognitive biases [54].
The reinforcing loop R2 represents the situation where an organization perceives
more benefits from SOA implementation when the development productivity is being
improved over time. Management commitment to SOA may initially come from
normative commitment from top managers. Meanwhile, the perceived benefits of SOA
would motivate management commitment from the internal environment of the
organization (perhaps from various organizational actors including managers and
developers) and promote the SOA implementation further, resulting in more perceived
benefits. Similar to R1, R2 is also subject to the substantial delay between higher SOA
penetration and the rise of development productivity. Yet the substantial delay in R2

40
has a very important effect but different from the two effects of the delay in R1. That is,
the substantial delay in R2 largely postpones the potential benefits of SOA to be
perceived by organizational actors. Accordingly, organizations that decide to
implement SOA have to be patient enough and tolerate a probable long period during
which perhaps little benefits of SOA are perceived, especially at the early stage of SOA
implementation. Thus, the primary part of management commitment to SOA has to
come from normative commitment. In such situations, top management (e.g., CIOs) has
to use their leadership to resist possibly unfavorable initial word of mouth about SOA.
The normative commitment has to be maintained for long enough before perceived
benefits of SOA arrive and enough endogenous commitment is motivated. The
implication is that top management’s leadership in maintaining normative commitment
is important to leverage the benefits of IT in general [55] and SOA in particular.
5. Theory
5.1 Learning Curve of SOA Implementation
SOA, as a new architectural style [7], has certain technical complexity and its
implementation process is characterized by a high learning barrier [1]. In order to
implement service-oriented systems and make use of them in the future IS
development, developers have to invest substantial time and energy in learning the new
41
architectural style, e.g., learning SOA design principles and methodologies [9] 7. This
suggests there is substantial delay from the investment in SOA to the rise of
development productivity and the perceived benefits of SOA; the delays are labeled in
Figure 6. In other words, it is likely to see little rise of development productivity and
little perceived benefits at the early stage of SOA implementation process.
Prior research has demonstrated the presence of an organizational learning curve
in the implementation of software packages [56], the adoption of CASE tools [57], and
software development methodology [58]. Traditional wisdom originally from industrial
learning curve suggests that “the rate at which the average cost of production decreases
as the cumulative amount produced increases” [57] and that the learning curve is
shaped as exponential decreasing [57, 59].
However, considering the substantial delays in the reinforcing loops R1 and R2
(as labeled in Figure 6), we postulate the learning rate of SOA implementation may not
be decreasing constantly during the implementation process. Specifically, we
hypothesize the learning curve of SOA implementation is likely to be flat or decrease very
slowly at the early stage of the implementation process. Only after a certain point, the learning
curve would become steep. In other words, it is likely that the learning curve of SOA
implementation turns out to be reversely S-shaped, as shown in Figure 7, instead of an
7 Learning SOA for an organization is far more than just SOA design principles and methodologies. Based
on the evidences from our interview data, we found there are at least three levels of SOA learning: (1)
basic concepts, design principles; (2) specific tools and technologies (e.g., J2EE); and (3) specific practices,
standards and methodologies used in the organizations.

42
exponential-decreasing shape suggested by the traditional wisdom [57, 59]. The
hypothesis on the learning curve of SOA implementation has been observed
empirically. As Hau et al. (2008) note, “the first release of an SOA application to take
additional time because adherence to SOA design principles often leads to longer
design time without yielding immediate benefits” [1, 24]. Some IT managers who
encountered difficulty in their efforts of SOA implementation also complained to us
that they received little benefit, especially, when they started implementing SOA. We
believe it is partially because they just reached the flat part of the SOA learning curve.
Figure 7: Learning curve of SOA Implementation
Cumulative number of service-oriented systems
Average development cost per IT systems Learning curve of SOA
Traditional learning curve
Flat part
43
In fact, the hypothesis on the learning curve of SOA implementation can be
generalized to a larger context of innovative technology implementation. According to a
survey of 60 sites, Chew et al. (1991) conclude that performance on initial projects with
new technology implementation is usually worse than performance on projects with the
old technology and this effect eventually wears off with improved positive performance
[60]. After investigating CASE tool adoption from a perspective of learning curve,
Kemerer also observed that initial projects adopting CASE tools are relatively more
expensive than later projects [57], which is similar to the observation of SOA
implementation done by Hau et al. (2008). This research suggests that the time delays in
the reinforcing loops R1 and R2 is a plausible explanation for the reversely S-shaped
learning curve of innovative technology implementation in general and SOA
implementation in particular, as shown in Figure 7.
5.2 Organizational Traps
As indicated above, due to the substantial delay, managers and developers are likely
to bypass SOA requirements and/or underinvest in SOA, especially when urgent IT
functionalities are requested by end users from business units and intense schedule
pressure is created. Bypassing SOA requirements may even be institutionalized in some
organizations. A project manager that we interviewed told that:
There are actually “waiver processes”. When the requests [of IT functionalities]
from end users are urgent enough or some emergence happens, they can apply
for the waiver and don’t need to go through the whole process [e.g., bypassing

44
SOA requirements]. This is a tactic vs. strategic balance in our organization.
And different departments actually have different waiver processes…
Underinvestment in SOA postpones the first release of an SOA application and
perhaps allows delivering non-service-oriented systems, leading to less penetration of
SOA in the organization and in turn less effectiveness of SOA implementation. As a
result, the perceived benefits of SOA are further delayed and negative word of mouth
may spread across the organization. For example, the technical complexity of SOA is
overemphasized, instability of open standards for SOA and inappropriateness of SOA
are misperceived [1, 24]. In such situations, the organization is likely to be stuck in two
different traps: technology learning trap and implementation effectiveness trap.
Technology learning trap refers to the situation in which certain innovative
technology is less understood due to insufficient learning, the more difficult and
complex the technology is perceived. Technology learning trap indicates a vicious cycle
of the “learning-by-doing” [61] or more specifically “learning-by-using” process [62].
Consequently, developers may continue to underinvest in SOA and thus the initial flat
part of the learning curve of SOA implementation is actually prolonged, which
postpones the perceived benefits of SOA even further. Thus, the organization is trapped
in the initial flat yet prolonging part of the learning curve of SOA implementation and
can hardly see it taking off ever.
Implementation effectiveness trap refers to the situation in which SOA is
misperceived to be inappropriate when SOA implementation is temporally less

45
effective and the perceived benefits of SOA are delayed. It is likely for the organization
to falsely conclude that SOA is inappropriate to its organizational context, rather than to
admit that it is just due to insufficient SOA penetration in the organization. As a result,
developers continue to underinvest in SOA and deliver non-service-oriented systems,
further undermining the effectiveness of SOA implementation. In such a case, the
organization is stuck in the trap and can hardly realize the effectiveness of SOA.
Technology learning trap and implementation effectiveness trap are different but
intertwined with each other. Because top management team may change [63] or their
strategic attention (and resources) often fades away over time [64], the two traps result
in the failures of SOA implementation efforts of many organizations when the
normative commitment to SOA fades away. The theory of the two organizational traps
has emerged from our case studies and literature review and we found substantive
empirical evidences supporting the theory. For example, the chief scientist from a large
international software vendor complained to us about the complexity of SOA
technologies:
I think the technologies of SOA are very complex and hard to
understand…There are so many dependencies among the parts of different
services… We used to develop a SOA system. But when we demonstrated it, it
failed to work! Because the dependencies are so complex and there is little
documentation, we could not find the problems… the contexts of using SOA
are also too complex…so many configurations…
However, when we asked how much they had invested in learning SOA technologies,
the chief scientist told that they didn’t have sufficient exporters to train their IT
46
developers, which indicates that there is insufficient technology learning of SOA in that
organization. By contrast, interviewees from those organizations who had good
experiences about their SOA implementation efforts seldom complained the complexity
of SOA technologies and often provided favorable words about the effectiveness of
SOA.
Note that the theory of the two organizational traps suggested in this research
rejects the traditional wisdom of a static, deterministic learning curve of innovation
technology implementation [56-58, 60]. The learning rate (i.e., the slope of the learning
curve) is nondeterministic and actually affected by various organizational contexts and
properties, such as the interpretation and actions of organizational actors as well as
structures [38, 43]. The view of a dynamic learning curve may explain the inconsistent
statistics of measuring the learning curve for CASE tools disclosed by Kemerer (1992),
as prior research with technological determinism tends to ignore organizational
contexts and properties which may affect organizational change and learning. Further,
the theory of organizational traps suggests the social world (in this case the
organizational outcomes of SOA implementation) is “produced and reinforced by
humans through their action and interaction” [65].
5.3 Causes of the Traps
We extend the theory of organizational traps in SOA implementation by discussing
the plausible causes contributing to the traps.
47
First, the fundamental tension that results in the traps during SOA implementation
is the tradeoff between short-term performance drop and the potential long-term
benefits, indicated by the “worse-before-better” pattern [21]. As Hau et al. (2008) note,
one of the primary challenges of SOA implementation is that “many firms failed to
realize the benefits of SOA because they suffered from the inherent tradeoff between
long-term benefits versus short-term local needs of project management” [24]. Investing
resources (e.g., time and financial budgets) in SOA implementation and corresponding
organizational change clearly disrupts the normal operation of the organization to a
large extent. In particular, developers need to devote substantial amount of their work
hours to SOA implementation, which decreases their responsiveness to the request for
IT functionalities from business units at the early stage of the implementation process.
As the model suggests (see Figure 6), there are two different performance gaps that
managers and developers need to close up: delivery rate gap and IS agility gap. In order
to improve IS agility, the organization probably has to sacrifice the short-term
performance. However, system delivery rate is a more salient, immediate and certain
performance indicator and the urgency of IT functionality request from business units
often emphasizes the salience, whereas IS agility is an organizational-level, less salient,
less immediate and uncertain performance indicator. Because of the cognitive and
perceptual bias that human tend to overemphasize salient and certain factors when
processing attributions [54], organizational actors are likely to overweight delivery rate

48
gap and ignore improving IS agility. Repenning and Sterman (2002) support the
tradeoff tension and point that “subjects [in many experiments] have been shown to
grossly overweight the short-run positive benefits of their decisions while ignoring the
long-run, negative consequences” [20]. In some circumstances, sacrificing the long-term
benefits of SOA seems inevitable for some organizations. The CIO of a large energy
company explained this dilemma:
Firms will likely scale back on SOA investment due to economic conditions,
sacrificing long term benefit for short term gains. As the short term view is
focused on survival, this is the right change of focus. This will result in higher
overall SOA costs as investments to date will either become stranded, or written
off. At some future point, when such projects resume, technology and staff will
have changed, not permitting continuity from where things were left. Time to
realize benefits will be extended due to both total cost and total time to
implement.
Second, there may be interest conflicts of different groups of organizational actors
(e.g., top management, business line units, and IT unit). Local business units often focus
much on how fast their requests of new IT functionalities can be delivered on schedule,
so that they can catch the business opportunities that come out but may disappear in a
short period. Based on our interviews, local business units usually do not understand or
appreciate much about the organizational IS agility. In many cases, local business units
have much power to urge their requests, because they control the resources of
generating revenues for the organization. Thus, organizations probably have to give up
part of the needs of local business units to some extent at least at the early stage of the
implementation process. Hau et al. (2008) discuss the tension between “long term global

49
benefits of SOA [e.g., IS agility] and short term local needs of project management
[requested by business units]” [24] is a key challenge in SOA implementation. Choi et
al. (2010) explicitly point out that “most firms cannot afford giving up short-term
benefits when project management goals [set by business units] and the necessity to
adhere to SOA design principles conflict with each other” [1].
Third, SOA, as a complex architectural style, manifests the agency of organizational
actors (e.g., IT managers and developers) to control their interaction with the
technology of SOA and its characteristics. Thus, organizational actors have much
flexibility in design, implement, use, and interpretation of service-oriented systems,
indicating the notion of interpretive flexibility of technological artifacts [43]. We were
told by many IT managers that there are usually different ways to deliver the same
system functionality when they decide the implementation strategies. Interpretive
flexibility allows the technology of SOA to be appropriated in diverse ways by actors in
different organizations or by the same actors in different organizational contexts. Thus,
there is possibility that organizational actors may inappropriately implement or use
SOA and misinterpret the effectiveness of SOA implementation. An IT manger from a
large software vendor commented on the challenge of interpretive flexibility of SOA
implementation:
It is difficult to monitor along the way whether the developers actually use the
SOA standards and methodology to build the systems. So I think QA [quality
assurance] is important. But even there is a QA process, it usually comes in at

50
the end of the project. Enforcement of compliance to SOA standards and
methodology is challenging.
While organizations enjoying the perceived benefits of SOA early are more dedicated to
their SOA implementation efforts, those falling short of their expectation of SOA are
likely to underinvest in their SOA implementation, resulting in an even worse situation.
It is less likely for them to attribute the worse results of SOA implementation to their
past actions (e.g., underinvestment in SOA). The complex dynamics of SOA
implementation process bias organizational actors’ interpretation and appropriateness
of SOA, triggering the vicious cycle of declining SOA implementation.
Finally, when the perceived benefits of SOA do not meet the immediate
expectations, managers and developers tend to blame the technical complexity and
inappropriateness of SOA instead of attributing that they have bypassed the SOA
requirements in their past actions. Organizational actors in the case of SOA
implementation are more likely to attribute the ineffectiveness to the technology itself.
The tendency of humans to blame the technology rather than themselves is widely
observed and documented in the literature [66]. As Shneiderman (1990) notes,
“Complex and confusing systems enable users and designers to blame the machine”
[67]. Also, Brown et al. (1998) wrote that “An understandable reaction [for frustrated
users] is to blame the technology, but the attempts to achieve the advantages of
information systems can be thwarted by both technological and organizational
constraints” [68]. After observing the adoption process of the faculty educational

51
technology in a university, Moser (2007) found that “If technology was involved,
however, faculty were quick to blame the failure on the technology and abandon newly
acquired teaching practice and technology use” [69]. When stuck in the technology
learning trap and implication effectiveness trap, blaming the complexity and
inappropriateness of the technology, providing a possibility for organizational actors to
excuse their past actions of underinvestment in SOA implementation, is actually
misperceived and false. The vicious cycle of declining SOA implementation reinforces
the excuse and misperception. Such misinterpretation about the ineffectiveness or
inappropriateness of SOA implementation reveals organizational actors’ self-
confirming attribution error [20]. Accordingly, Lorenzi et al. (2003) clearly suggest
“Existing organizational and/or people problems often surface during the
implementation of new technical systems. Instead of waiting for latent problems to
emerge, organizations should deal with managerial problems before implementing new
technology. If it is not possible to effectively handle the problems, the organization
must at least avoid placing blame for the problem on the technological system” [70].

52
6. Implication
This paper has presented the findings of a study on SOA implementation and,
particularly, the theory of organizational traps associated with the implementation of
innovative IS technologies. The findings and theory articulated here have important
implications for research and practice.
6.1 Research Implication
This research assumes to a large extent that SOA, once implemented well in an
organization, can enhance the organization’s IS agility and developers’ development
productivity in the long term [1, 9, 22, 24]. Yet the intended benefits of SOA cannot be
realized automatically and many organizations have encountered organizational and
human challenges in their SOA implementation efforts [23, 25]. Therefore, this research
adopts the process perspective which is largely overlooked by prior studies that use
variance models [14] and seek to explain the variance in outcomes from SOA. Using the
process perspective is a clear distinction between this paper and the existing literature
on SOA [9, 22, 26, 27]. By doing so, this research suggests a theoretical explanation for
the contradictory results of SOA implementation paradox from an organizational
perspective. That is, it is likely to be explained by the differences in processes,
interpretations and actions around the implementation and use of service-oriented
systems in different organizations. Due to the dynamics and nonlinearity of the process,
53
the connections between starting conditions, actions, and outcomes in SOA
implementation are not deterministic.
In fact, the extant IS literature indicates that human agency often plays an
important, and sometimes critical, role in organization-wide IS implementation, like
Enterprise Resource Planning (ERP) implementation [43, 71]. In the IS literature on ERP,
Grant et al. (2006) write “key stakeholders in the ERP implementation process adopted
different discourses” and highlighted the role of their discourses in the social shaping of
ERP implementation [72]. Scott el al. (2003) further point out that the “success” or
“failure” of the ERP implementation is actually highly situated and relate to “the
negotiations between actor networks surrounding the implementation process” [73].
Although ERP as a monolithic IS architecture is very different from SOA and thus has
different organizational implications, prior research on ERP leads us to accommodate
human agency in this research and to examine the important role that human agency
plays during the SOA implementation process.
The implementation of SOA manifests the agency and voluntarism of
organizational actors (e.g., IT managers and developers). There is a high degree to
which those organizational actors are engaged in SOA implementation process during
both the implementation and use of service-oriented systems. As indicated in the model
(see Figure 6), the actions that implement SOA and that use SOA are mutually
influenced by each other, both of which in most circumstances are acted by the same

54
organizational actors (e.g., IT managers and developers) in similar organizational
context (time and space), because developers of service-oriented systems are also users
of those systems. This characteristic of time-space continuity between the
implementation and use of SOA illuminates the notion of “duality of technology”
named by Orlikowski (1992), that is, “the technology is created and changed by human
action, yet it is also used by humans to accomplish some action” [43]. Thanks to the
clear characteristic of time-space continuity, the implementation process of SOA is a
meaningful field to study the duality of technology which can provide insights different
from that derived from the conceptual dualism of technology dominating the IS
literature [43].
SOA implementation requires organizations to invest substantial resources
upfront before potential benefits are perceived by organizational actors, known as the
“worse-before-better” phenomenon [21]. That is, there are substantial delays between
the implementation investment and the perceived benefits. During the “worse” period
of the implementation, different organizational actors often make different senses and
judgments about what becomes “worse” to them, how “worse” it will be, and how long
the “worse” will last. Impatient organizational actors are likely to underinvest in SOA
implementation and thus the dynamics can get stuck in the two intertwined traps:
technology learning trap and implementation effectiveness trap. Once stuck in the
traps, it would be difficult for organizational actors to correctly attribute to the vicious

55
cycle of the dynamics of the implementation process. Due to the misattribution, the
subsequent reaction of the organizational actors may further exacerbate the situation of
the vicious cycle. This research suggests that the technology learning trap and
implementation effectiveness trap result from not only the characteristics of technology
(in this case, SOA) and the inherent structure of the implementation process (i.e., the
balancing and reinforcing feedback loops), but the dynamic interactions between
human agency and the technology implementation process, indicating the duality of
technology [43]. The misattribution of organizational actors when they are stuck in the
traps reflects another form of self-confirming error; yet it is different from that
discussed in Repenning’s works on process improvement in manufacturing [20].
More empirical research on the theory of organizational traps and the theoretical
explanation for SOA implementation paradox is needed. In particular, empirical
validation and elaboration of the findings in this research will enrich the theory
developed here and provide more refined understanding of the dynamics of the SOA
implementation process in various organizational settings.
6.2 Practice implication
Managers who make the decision of SOA implementation for their organizations
need to be aware and prepared of the potential traps in the implementation process.
Long-term commitment is definitely helpful to SOA implementation. Patient and
consistent decision-makings about the tradeoff between short-term performance drop

56
and potential long-term benefits and about the tradeoff between local project needs and
organization-level SOA implementation are important. In addition, institutionalization
of the long-term commitment and consistent decision-making about the tradeoffs using
appropriate governance mechanisms may increase the chance of successful SOA
implementation [15, 74].
57
References
1. Choi, J., Nazareth, D.L., and Jain, H.K. Implementing Service-Oriented
Architecture in Organizations. Journal of Management Information Systems, 26, 4 (2010),
253-286.
2. Sher, P.J., and Lee, V.C. Information Technology as a Facilitator for Enhancing
Dynamic Capabilities Through Knowledge Management. Information & Management, 41,
8 (2004), 933-945.
3. Winter, S.G. Understanding dynamic capabilities. Strategic Management Journal,
24, 10 (2003), 991-995.
4. Luthria, H., and Rabhi, F. Using Service Oriented Computing for Competitive
Advantage. Proceedings of Americas Conference on Information Systems (AMCIS 2009),
2009, pp. 140.
5. Robey, D., Ross, J.W., and Boudreau, M.C. Learning to implement enterprise
systems: An exploratory study of the dialectics of change. Journal of Management
Information Systems, 19, 1 (2002), 17-46.
6. Papazoglou, M.P., and Georgakopoulos, D. Service-oriented computing.
Communications of the ACM, 46, 10 (2003), 25-28.
7. Borges, B., Holley, K., and Arsanjani, A. Service-Oriented Architecture:
Components and Modeling Can Make the Difference. Web Services Journal, 9, 1 (2004),
34-38.
8. Bieberstein, N., Bose, S., Walker, L., and Lynch, A. Impact of Service-Oriented
Architecture on Enterprise Systems, Organizational Structures, and Individuals. IBM
Systems Journal, 44, 4 (2005), 691-708.
9. Mueller, B., Viering, G., Legner, C., and Riempp, G. Understanding the Economic
Potential of Service-Oriented Architecture. Journal of Management Information Systems,
26, 4 (2010), 145-180.

58
10. Kanaracus, C. SOA is Alive and Well, Forrester Says. Computer World, 2011.
11. Smith, R. A Simpler Approach To SOA. Information Week 2008.
12. McKendrick, J. So Far, SOA failures are Few and Far Between, Survey Says.
ZDNet, 2011.
13. Luthria, H., and Rabhi, F. Service Oriented Computing in Practice: An Agenda
for Research into the Factors Influencing the Organizational Adoption of Service
Oriented Architectures. Journal of theoretical and applied electronic commerce research, 4
(2009), 39-56.
14. Mohr, L.B. Explaining organizational behavior: The limits and possibilities of theory and
research. San Francisco, CA, USA: Jossey-Bass, 1982.
15. Varadan, R., Channabasavaiah, K., Simpson, S., Holley, K., and Allam, A.
Increasing Business Flexibility and SOA Adoption Through Effective SOA Governance.
IBM Systems Journal, 47, 3 (2008), 473-488.
16. Cherbakov, L., Galambos, G., Harishankar, R., Kalyana, S., and Rackham, G.
Impact of Service Orientation at the Business Level. IBM Systems Journal, 44, 4 (2005),
653-668.
17. Baskerville, R., Cavallari, M., Hjort-Madsen, K., Pries-Heje, J., Sorrentino, M., and
Virili, F. Extensible Architectures: The Strategic Value of Service Oriented Architecture
in Banking. ECIS 2005 Proceedings (2005), 61.
18. Moitra, D., and Ganesh, J. Web Services and Flexible Business Processes:
Towards the Adaptive Enterprise. Information & Management, 42, 7 (2005), 921-933.
19. Markus, M.L., and Robey, D. Information technology and organizational change:
causal structure in theory and research. Management science, 34, 5 (1988), 583-598.
20. Repenning, N.P., and Sterman, J.D. Capability Traps and Self-Confirming
Attribution Errors in the Dynamics of Process Improvement. Administrative Science
Quarterly, 47, 2 (2002), 265-295.

59
21. Repenning, N.P., and Sterman, J.D. Nobody Ever Gets Credit for Fixing Problems
That Never Happened. California management review, 43, 4 (2001), 64-88.
22. Yoon, T., and Carter, P. Investigating the Antecedents and Benefits of SOA
Implementation: A Multi-Case Study Approach. AMCIS 2007 Proceedings (2007), 195-
205.
23. Fricko, A. SOAs Require Culture Change and Service Reuse. Business
Communications Review, 36, 5 (2006), 58.
24. Hau, T., Ebert, N., Hochstein, A., and Brenner, W. Where to Start with SOA:
Criteria for Selecting SOA Projects. Proceedings of the 41st Hawaii International Conference
on System Sciences (HICSS 2008), Waikoloa, Big Island, Hawaii: IEEE Computer Society,
2008, pp. 314-322.
25. Luthria, H., and Rabhi, F. Organizational Constraints to Realizing Business Value
from Service Oriented Architectures: An Empirical Study of Financial Service
Institutions. Service-Oriented Computing - ICSOC 2008 (2008), 256-270.
26. Boh, W.F., and Yellin, D.M. Enablers and benefits of implementing Service-
Oriented Architecture: an empirical investigation. International Journal of Information
Technology and Management, 9, 1 (2010), 3-29.
27. Lee, J.H., Shim, H.J., and Kim, K.K. Critical Success Factors in SOA
Implementation: An Exploratory Study. Information Systems Management, 27, 2 (2010),
123-145.
28. Repenning, N.P. A Simulation-Based Approach to Understanding the Dynamics
of Innovation Implementation. Organization Science, 13, 2 (2002), 109-127.
29. Pfeffer, J., and Sutton, R.I. The Knowing-Doing Gap: How Smart Companies Turn
Knowledge into Action. Cambridge, MA, USA: Harvard Business School Press, 2000.
30. Wheelwright, S.C., and Clark, K.B. Leading Product Development. Free Press, 1995.
31. Sterman, J.D. Business Dynamics: Systems Thinking and Modeling for a Complex
World with CD-ROM. Irwin/McGraw-Hill, 2000.

60
32. Rudolph, J.W., Morrison, J.B., and Carroll, J.S. The dynamics of action-oriented
problem solving: linking interpretation and choice. The Academy of Management Review
(AMR), 34, 4 (2009), 733-756.
33. Sastry, M.A. Problems and paradoxes in a model of punctuated organizational
change. Administrative Science Quarterly, 42, 2 (1997), 237-275.
34. Abdel-Hamid, T., and Madnick, S.E. Software project dynamics: an integrated
approach. New Jersey, USA, 1991.
35. Georgantzas, N.C., and Katsamakas, E.G. Information systems research with
system dynamics. System Dynamics Review, 24, 3 (2008), 247-264.
36. Cao, L., Ramesh, B., and Abdel-Hamid, T. Modeling dynamics in agile software
development. ACM Transactions on Management Information Systems (TMIS), 1, 1 (2010),
5.
37. Rahmandad, H., and Weiss, D.M. Dynamics of concurrent software
development. System Dynamics Review, 25, 3 (2009), 224-249.
38. Orlikowski, W.J. CASE tools as organizational change: Investigating incremental
and radical changes in systems development. Mis Quarterly (1993), 309-340.
39. Weick, K.E. The social psychology of organization. Addison-Wesley, 1979.
40. Law, J., and Urry, J. Enacting the Social. Economy and society, 33, 3 (2004), 390-410.
41. Rahmandad, H., Repenning, N., and Sterman, J. Effects of feedback delay on
learning. System Dynamics Review, 25, 4 (2009), 309-338.
42. Yin, R.K. The case study crisis: Some answers. Administrative Science Quarterly,
26, 1 (1981), 58-65.
43. Orlikowski, W.J. The Duality of Technology: Rethinking the Concept of
Technology in Organizations. Organization Science, 3, 3 (1992), 398-427.
44. Bandara, W., Gable, G.G., and Rosemann, M. Factors and measures of business
process modelling: model building through a multiple case study. European Journal of
Information Systems, 14, 4 (2005), 347-360.
61
45. McClintock, C.C., Brannon, D., and Maynard-Moody, S. Applying the logic of
sample surveys to qualitative case studies: The case cluster method. Administrative
Science Quarterly, 24, 4 (1979), 612-629.
46. Pettigrew, A.M. Longitudinal field research on change: theory and practice.
Organization Science, 1, 3 (1990), 267-292.
47. Forrester, J.W. Industrial Dynamics. Cambridge, MA, USA, 1968.
48. Locke, K.D., and Locke, K. Grounded theory in management research. SAGE
Publications Ltd, 2001.
49. Ryan, G.W., and Bernard, H.R. Data Management and Analysis Methods. In,
Norman K. Denzin, Y.S.L., (ed.), Handbook of Qualitative Research, Sage, CA, USA:
Citeseer, 2000, pp. 769-801.
50. Perlow, L.A., Okhuysen, G.A., and Repenning, N.P. The speed trap: Exploring
the relationship between decision making and temporal context. The Academy of
Management Journal, 45, 5 (2002), 931-955.
51. Vroom, V.H. Work and Motivation. New York: Wiley, 1964.
52. DiMaggio, P.J., and Powell, W.W. The Iron Cage Revisited: Institutional
Isomorphism and Collective Rationality in Organizational Fields. American sociological
review, 48, 2 (1983), 147-160.
53. Liang, H., Saraf, N., Hu, Q., and Xue, Y. Assimilation of Enterprise Systems: The
Effect of Institutional Pressures and the Mediating Role of Top Management.
Management Information Systems Quarterly, 31, 1 (2007), 6.
54. Tversky, A., and Kahneman, D. Judgment under Uncertainty: Heuristics and
Biases. Science, 185, 4157 (1974), 1124.
55. Armstrong, C.P., and Sambamurthy, V. Information Technology Assimilation in
Firms: The Influence of Senior Leadership and IT Infrastructures. Information systems
research, 10, 4 (1999), 304-327.

62
56. Saraswat, S.P., and Gorgone, J.T. Organizational learning curve in software
installation: an empirical investigation. Information & Management, 19, 1 (1990), 53-59.
57. Kemerer, C.F. How the learning curve affects CASE tool adoption. Software,
IEEE, 9, 3 (1992), 23-28.
58. Boh, W.F., Slaughter, S.A., and Espinosa, J.A. Learning from experience in
software development: A multilevel analysis. Management science, 53, 8 (2007), 1315-
1331.
59. Argote, L., and Epple, D. Learning curves in manufacturing. Science, 247, 4945
(1990), 920.
60. Chew, W.B., Leonard-Barton, D., and Bohn, R.E. Beating Murphy's law. Sloan
Management Review, 32, 3 (1991), 5-16.
61. Arrow, K.J. The Economic Implications of Learning by Doing. The review of
economic studies, 29, 3 (1962), 155-173.
62. Rosenberg, N. Inside the Black Box: Technology and Economics. Cambridge:
Cambridge University Press, 1982.
63. Lee, J.C., and Myers, M.D. Dominant Actors, Political Agendas, and Strategic
Shifts Over Time: A Critical Ethnography of An Enterprise Systems Implementation.
The Journal of Strategic Information Systems, 13, 4 (2004), 355-374.
64. Kotter, J. Leading Change: Why Transformation Efforts Fail. Harvard Business
Review, 73 (1995), 59-67.
65. Orlikowski, W.J., and Baroudi, J.J. Studying information technology in
organizations: Research approaches and assumptions. Information systems research, 2, 1
(1991), 1-28.
66. Avital, M., and Vandenbosch, B. SAP implementation at Metalica: an
organizational drama in two acts. Journal of Information Technology, 15, 3 (2001), 183-194.

63
67. Shneiderman, B. Human values and the future of technology: a declaration of
empowerment. Proceedings of the conference on Computers and the quality of life: ACM,
1990.
68. Brown, M.M., and Brudney, J.L. Public sector information technology initiatives.
Administration & Society, 30, 4 (1998), 421.
69. Moser, F.Z. Faculty Adoption of Educational Technology. EDUCAUSE quarterly,
30, 1 (2007), 66.
70. Lorenzi, N.M., and Riley, R.T. Organizational issues= change. International Journal
of Medical Informatics, 69, 2-3 (2003), 197-203.
71. Volkoff, O., Strong, D.M., and Elmes, M.B. Technological Embeddedness and
Organizational Change. Organization Science, 18, 5 (2007), 832-848.
72. Grant, D., Hall, R., Wailes, N., and Wright, C. The False Promise of Technological
Determinism: The Case of Enterprise Resource Planning Systems. New Technology, Work
and Employment, 21, 1 (2006), 2-15.
73. Scott, S.V., and Wagner, E.L. Networks, Negotiations, and New Times: The
Implementation of Enterprise Resource Planning into an Academic Administration.
Information and organization, 13, 4 (2003), 285-313.
74. Joachim, N., Beimborn, D., and Weitzel, T. What Are Important Governance and
Management Mechanisms to Achieve IT Flexibility in Service-Oriented Architectures
(SOA)?: An Empirical Exploration. Proceedings of the 44th Hawaii International Conference
on System Sciences (HICSS 2011), Kauai, Hawaii USA: IEEE Computer Society, 2011, pp.
1-10.