understanding pesticide fate for the protection of...
TRANSCRIPT

Understanding Pesticide Fate for the Protection of Water Resources
Jeffrey Jenkins
Department of Environmental and Molecular ToxicologyOregon State University

Pesticides are only a
part of the chemical
load and other
potential stressors of
aquatic life in the
Pacific Northwest
Source: U.S. Geological Survey

Pest and pesticide management
• Mitigation of human and environmental adverse impacts often drive pesticide management decisions.
• Pest/crop management decisions must balance mitigation of pesticide adverse impacts with sustainability and economic viability.

Pest and pesticide management
• Understanding pesticide fate and effects, what scale?– Field scale: efficacy, impact on beneficials,
potential for off-site movement.– Watershed scale: integration of field level
impacts, particular emphasis on water quality.– Regional scale: integration of watershed-
airshed level effects, long range transport of persistent pesticides.

Pesticide released into the atmosphere
Mass transfer to surface water?
Transformation and loss tothe upper atmosphere?
Deposited on site

Pesticide Loss at the Watershed Scale

US Geological Survey National Water-Quality
Assessment (NAWQA) Program

Willamette
Puget
Upper Snake
Yakima
CentralColumbiaPlateau
PNW Basins and USGS
water quality monitoring sites
Willamette

Pesticide Max concentrationLower Clackamasug/L
BenthicInvertebrates96 hr LC50
Fish96 hr LC50
Cladocerans(daphnia) 96 hr LC50
2,4 D 6.1 1,600-144,100 1,400-358,000 3,200-25,000
atrazine 0.30 94-14,900 2,000-69,000 6,900-115,000
azinphos-methyl1 0.21 0.10-56 0.36-4,270 1.1-4.4
benomyl 5.7 No data No data No data
carbaryl 0.15 51-6,933 140-290,000 2.77-71,000
chlorothalonil 0.26 No data 7.6-430 70-172
chlorpyrifos1 0.17 0.04-83 0.58-806 0.10-1.7
dacthal (DCPA) 0.46 6,200 6,600-30,000 27,000-138,000
Selected Data for Pesticides in the Lower Clackamas River Basin
1Risk Quotient (RQ) >0.5 RQ= EEC/LC50 or EC50
EEC=expected environmental concentration

Distribution of Endangered Species Act‐listed salmon
and steelhead
Oncorhynchus keta
28 Evolutionarily Significant Units
Oncorhynchus nerka
Oncorhynchus mykiss
Oncorhynchus tshawytscha
Oncorhynchus kisutch
Scott Hecht, NOAA Fisheries, 6-15-10

Pesticide Benefit-Risk AssessmentEnvironmental fate:
Persistence (how long does it last)Re-distribution in the environment (where does it go)
Maximum efficacy/minimum environmental impact:
apply to target only effective pest control minimal impact on beneficials/non-target sp.no movement from site degrades to non-toxic products

leach towardgroundwater
microbial orchemical
degradation
runoff
winderosion
sorption to soil particles
volatilization
Plantuptake
washoff
photodegradation
drift
interception
Chemical fate processes
Sublateral flowto surface water

EPA Pesticide Aquatic Risk Assessment
• Pesticides Regulated under FIFRA/FQPA, a quasi risk-benefit balancing statute
• Determine risks of adverse impacts to human health and the environment: toxicity, opportunities for exposure
• Mitigate risks with label restrictions
• Generally not site-specific

Site-specific Risk Assessment: Conservation planning
• Water resources of concern• Pest management practices• Pesticide use practices
– pesticide properties– soil properties– hydraulic loading (irrigation or rainfall)– pesticide toxicity to humans/aquatic life

Pesticide Risk Assessment: Exposure Assessment
• Initial distribution in the environment:
• method of application• timing of application• frequency of
application• amount of active
ingredient• formulation (other
ingredients)


Initial Distribution

Environmental Behavior of Pesticides in Soils
Initial distribution
Persistenceand
Mobility
Environmental Fate
temperature
soil pH
soil texture
sunlight
organic matter
moisture

Pesticide Fate and Transport
• Physical-chemical properties:
• Water solubility• Vapor Pressure• Kd (soil/water partition coefficient)• Soil half-life• Foliar half-life• Wash-off fraction


Soil sorption

Distribution coefficient Kd
Where: Cs = concentration in the solid phase- soilCw = concentration in water
sd
w
CKC
=
Pesticide Kd Dicamba 0.07-0.52 Atrazine 0.28-2.46 Imazapyr 1.7-4.9
Methidathion 4 – 15 Glyphosate 61 Permithrin 633

Methidathion soil sorption
Sand Silt Clay %OM pH Kd
Sand 96.4 2.1 1.5 1.2 6.3 4.1
Loamy sand 87 10.2 2.8 2.2 7.8 2.5
Siltloam 38.4 49.4 12.2 3.6 6.1 4.5
Sandy clay loam 57.8 19.6 22.6 5.6 6.7 14.8

Soil sorption
• To account for different soil types and organic matter content the Kd is normalized for % organic carbon.
doc *
KK% organic carbon
=
* decimal equivalent; OC = OM/1.724

Methidathion soil sorption
Sand Silt Clay %OM pH Kd Koc
96.4 2.1 1.5 1.2 6.3 4.1.012 = 338
87 10.2 2.8 2.2 7.8 2.5.022 = 113
38.4 49.4 12.2 3.6 6.1 4.5.036 = 265
57.8 19.6 22.6 5.6 6.7 14.8.056 = 126
4.1.012 =

Soil Properties that Influence Leaching and Runoff
• Permeability • Water table conditions• Organic matter content• Clay content• Macropores and other preferential
flow paths


Example pesticide distribution by texture class

Course textured soils and other soil conditions thatresult in preferential flow paths must also be considered.

Pesticides in Surface and Ground Water

Pesticides in Surface and Ground Water
Pesticides in runoff primarily in the dissolved phase; varies water solubility and soil sorption.
soil particle waterConcentration
of pesticidesorbed to soil
Concentrationof pesticide in
solution
Pesticide movement towardsgroundwater is a function of soil properties and pesticide water solubility and sorption.

• What does not run-in will runoff:
• System state: % field capacity, crop•• Soil permeability, water table, etc.
• Timing of rainfall/irrigation event relative to pesticide application and previous hydraulic loading (run-in and/or runoff events).
Pesticides in Surface and Ground Water

Atmospheric Transport
Zones
Follows the concentrationgradient:
Leaf surface to atmosphere
Atmospheric deposition to leaf surface


Volatile loss from Turf as Percent Applied
Pesticide Application Rate(kg a.i./Ha)
Vapor Pressure(mPa @ 25 oC)
24 hr Volatile lossas % Applied
Chlorpyrifos 1.9 2.50 16.5
Ethofumesate 2.5 0.650 6.3
Triclopyr (acid) 1.1 0.170 4.5
Triadimefon 3.1 0.060 2.1
Propiconazole 2.2 0.056 1.1
Cyfluthrin 0.2 0.004 ND

Pesticide Fate
• Field dissipation: sum of chemical and biological processes including:
– Chemical degradation– Biological degradation (microbial + plant)– Photodegradation– Volatilization

Pesticide Dissipation in the EnvironmentA
mou
nt
Time
Volatile loss
Photo-degradation
Plant uptake – Metabolism
Chemical degradation
Microbial degradation
Leaching/runoff
Assumption: competing dissipation processes roughly conform to 1st order
degradation kinetics
How fast and which pathway predominates depends on chemical properties and
environmental conditions
Pesticide Fate Processes
leach towardgroundwater
microbial orchemical
degradation
runoff
winderosion
sorption to soil particles
volatilization
Plantuptake
washoff
photodegradation
drift

Pesticide dissipation half-life
• Assume 1st order degradation
• Half-life = the amount of time it takes the parent compound to decay to half its original amount
• Field dissipation (soil) - sum of all loss processes: degradation, volatilization, leaching, plant uptake

Pesticide Half-life in Soil
Pesticide Half-life (days) Dicamba 14 Atrazine 60 Imazapyr 90
Methidathion 7 Glyphosate 47 Permithrin 30
dC/dt = -k CC = pesticide concentrationk = 1st order rate constant
Ct/C0 = 0.5 = e-kt1/2
t1/2 = 0.639/k

Pesticide dissipation half-life
No of ½ lives
% amount remaining
3.3 10
6.6 1
10 0.1

Herbicides Commonly Used in OregonTrade Common ½ life Koc water sol vapor pressurename name (days) mg/L (mm Hg)
Sencor metribuzin 40 60 1220 1.0x10‐5Eptam EPTC 6 200 344 3.4x10‐2Treflan trifluralin 60 8000 0.3 1.1x10‐4Outlook dimethenamid 30 210 260 3.0x10‐8Dual metolachlor 90 200 530 3.1x10‐5Roundup glyphosate 47 24000 530000 0Roneet cycloate 30 430 95 1.6x10‐3Nortron ethofumesate 30 340 50 4.9x10‐6Betamix desmedipham 30 1500 8 3.0x10‐9Kerb pronamide 60 800 15 8.5x10‐5Poast sethoxydim 5 100 4390 1.6x10‐7Prefar bensulide 120 1000 5.6 8.0x10‐7Goal oxyfluorfen 35 100000 0.1 2.0x10‐7Prowl pendimethalin 90 500 0.3 9.4x10‐6Buctril bromoxynil 7 10000 0.8 4.8x10‐6Dachthal DCPA 100 5000 0.5 2.5x10‐6OSU Extension Pesticide Properties Database EM 8709

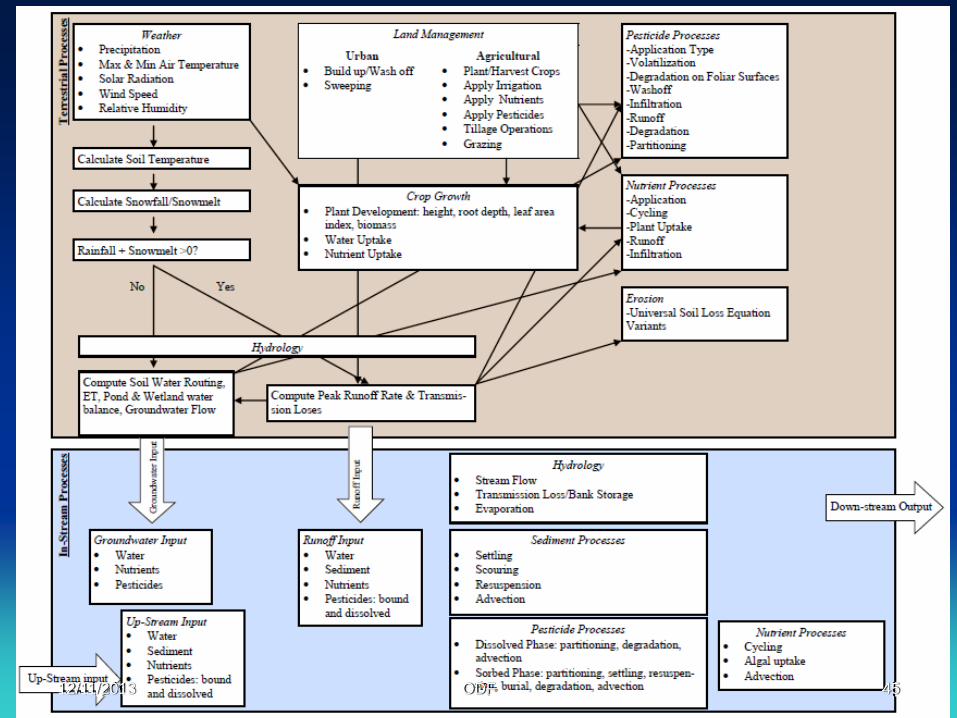
Modeling Land Use Practices and Pesticide Surface Water Loading at the Watershed Scale

Soil and Water Assessment Tool (SWAT)• USDA ARS watershed scale ecohydrologic model• Evaluates impacts of land management practices on hydrology and
contaminant fate on a daily time-step• Uses input data (nearly 300 variables) on:
– Climatic variables (precipitation, temperature, wind speed, solar irradiation, humidity)
– Topography– Hydrography (stream flow path)– Land use/land cover– Soils– Land management practice (pesticide applications, nutrient management, tillage,
irrigation, drainage, plant growth
• Simulates contaminant movement (dissolved and particle bound) from the field in overland and subsurface flow to streams and ponds where concentrations are estimated.
12/11/2013 45ODF

Pudding Sub-basin

Pudding Sub-basin Watersheds

How SWAT Works
Topography and stream network
Soils
Land use/Land Cover

Zollner CreekLand Use/Land Cover


Monitoring and Modeling to Assess Water Quality BMPs
• Capable of simulating BMPs

Summary
• Pesticides are designed to be toxic.
• Each pesticide product is unique in its toxicity and environmental fate.
• Use practices ultimately determine a pesticide’s hazard to humans and aquatic life.