understanding population change - wiley · understanding population change ... for food or other...
TRANSCRIPT
8
Africa has the most rapidly growing population ofall the continents. Africa’s population in mid-2002 wasestimated at 840 million, with most of the populationconcentrated in sub-Saharan Africa, that part of Africalocated south of the Sahara Desert. Experts predict thatthe sub-Saharan population of 660 million will more thandouble to 1.4 billion by 2030.
During the mid- and late-1990s, many populationexperts lowered their estimates of population growthrates in sub-Saharan Africa. These lower projections werenot based on declining birth rates. Tragically, the esti-mates were lowered because acquired immune defi-ciency syndrome (AIDS), caused by the humanimmunodeficiency virus (HIV), is ravaging an increasingnumber of countries in the sub-Saharan region. The U.N.Program on AIDS estimates that more than 28.5 million ofthe world’s 40 million people who are now infected withHIV/AIDS live in sub-Saharan Africa. Ten percent of theadult sub-Saharan population, ages 15 to 49, areinfected. Botswana, Zimbabwe, and Swaziland in south-ern Africa have the highest prevalence of HIV/AIDS in theworld: More than 33% of the adult population in each ofthese countries is infected. Even more tragic is the factthat at the end of 2001, about 11 million African childrenliving in the region had lost one or both parents to AIDS.By 2010, that number is expected to double. Many ofthese AIDS orphans do not have adequate education,health care, or nutrition.
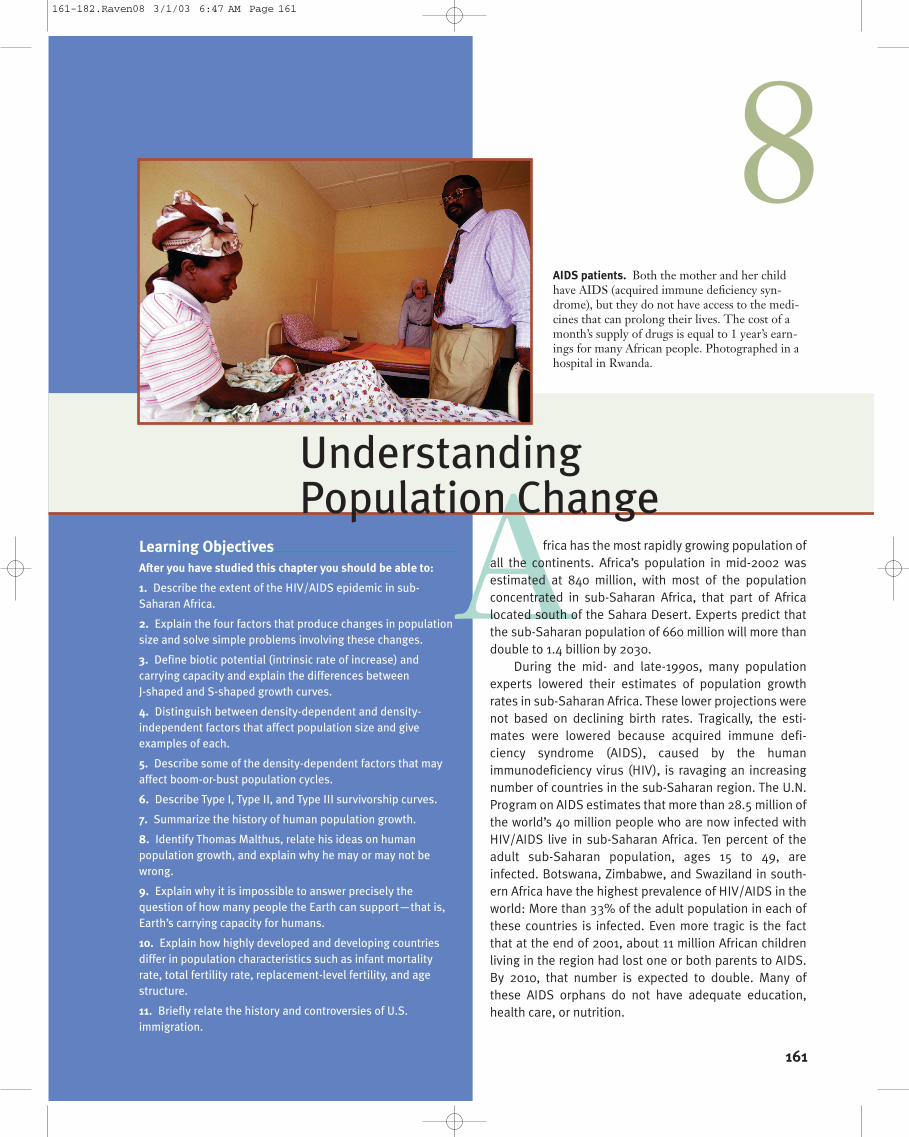
AIDS patients. Both the mother and her childhave AIDS (acquired immune deficiency syn-drome), but they do not have access to the medi-cines that can prolong their lives. The cost of amonth’s supply of drugs is equal to 1 year’s earn-ings for many African people. Photographed in ahospital in Rwanda.
161
Learning Objectives
After you have studied this chapter you should be able to:
1. Describe the extent of the HIV/AIDS epidemic in sub-
Saharan Africa.
2. Explain the four factors that produce changes in population
size and solve simple problems involving these changes.
3. Define biotic potential (intrinsic rate of increase) and
carrying capacity and explain the differences between
J-shaped and S-shaped growth curves.
4. Distinguish between density-dependent and density-
independent factors that affect population size and give
examples of each.
5. Describe some of the density-dependent factors that may
affect boom-or-bust population cycles.
6. Describe Type I, Type II, and Type III survivorship curves.
7. Summarize the history of human population growth.
8. Identify Thomas Malthus, relate his ideas on human
population growth, and explain why he may or may not be
wrong.
9. Explain why it is impossible to answer precisely the
question of how many people the Earth can support—that is,
Earth’s carrying capacity for humans.
10. Explain how highly developed and developing countries
differ in population characteristics such as infant mortality
rate, total fertility rate, replacement-level fertility, and age
structure.
11. Briefly relate the history and controversies of U.S.
immigration.
Understanding Population Change
161-182.Raven08 3/1/03 6:47 AM Page 161
In developing countries, including those in sub-Saha-ran Africa, almost all people infected with HIV/AIDS die,usually within 10 years of infection, because they cannotafford the high cost of potent antiviral drugs. Countries insub-Saharan Africa are experiencing high death ratesfrom HIV/AIDS, which is now the leading cause of death inAfrica. In 2001, 2.2 million people died of AIDS in sub-Saharan Africa. (Three million people died worldwide ofAIDS that year.)
The high mortality from HIV/AIDS has caused lifeexpectancies to decline in many African countries. Theaverage life expectancy in Botswana, for example,declined from a high of about 60 years in the late 1980s to39 years in 2002. Africa’s AIDS crisis has many repercus-sions beyond a reduced life expectancy, however. TheHIV/AIDS epidemic threatens the economic stability andsocial support networks of the region and has over-whelmed health care systems. Labor shortages are com-mon, and foreign investments have slowed because manyinvestors are wary of the high rate of infection amongworkers.
The HIV/AIDS epidemic is but one factor affecting thehuman population. In this chapter, we focus on thedynamics of population change characteristic of all organ-isms and then describe the current state of the humanpopulation. Chapter 9 examines the consequences ofcontinued human population growth and explores waysto limit the expanding world population.
PRINCIPLES OF POPULATION
ECOLOGY
Because the size of the human population is central to somany environmental problems and their solutions, it isimportant that we understand how populations increaseor decrease. We can understand much about the biologi-cal principles that affect the growth of human popula-tions by first studying populations of other species.
Individuals of a given species are part of a largerorganization known as a population. Populations exhibitcharacteristics distinctive from those of the individuals ofwhich they are composed. Some of the features discussedin this chapter that are characteristic of populations butnot of individuals are population density, birth and deathrates, growth rates, and age structure.
Population ecology deals with the number of indi-viduals of a particular species that are found in an areaand how and why those numbers increase or decreaseover time. Population ecologists try to determine thepopulation processes that are common to all populations.They study how a population responds to its environ-ment, such as how individuals in a population competefor food or other resources, and how predation, disease,
and other environmental pressures affect the population.Population growth, whether of bacteria or maples orgiraffes, cannot increase indefinitely because of suchenvironmental pressures.
Additional aspects of populations that are importantto environmental science are their reproductive successor failure (that is, extinction) and how populations affectthe normal functioning of communities and ecosystems.Scientists in applied disciplines, such as forestry, agron-omy (crop science), and wildlife management, must pos-sess an understanding of population ecology in order tomanage populations of economic importance, such as,forests, field crops, game animals, and fishes. An under-standing of the population dynamics of endangeredspecies plays a key role in efforts to prevent their slide toextinction. An understanding of the population dynamicsof pest species plays a key role in efforts to prevent theirincrease to levels that cause significant economic orhealth impacts.
Population Density
By itself, the size of a population tells us relatively little.Population size is only meaningful when the boundariesof the population are defined. Consider the differencebetween 1,000 mice in 100 hectares (250 acres) and 1,000mice in 1 hectare (2.5 acres). Often a population is toolarge to study in its entirety. Such a population is exam-ined by sampling a part of it and then expressing the pop-ulation in terms of density. Examples include the numberof dandelions per square meter of lawn, the number ofwater fleas per liter of pond water, and the number ofcabbage aphids per square centimeter of cabbage leaf.Population density, then, is the number of individualsof a species per unit of area or volume at a given time.
Different environments vary in the population den-sity of any species that they can support. This densitymay also vary in a single habitat (local environment) fromseason to season or year to year. As an example, considerred grouse populations in northwest Scotland at twolocations only 2.5 km (1.6 mi) apart (Figure 8.1). At onelocation the population density remained stable during a3-year period, but at the other site it almost doubled inthe first 2 years and then declined to its initial density inthe third year. The reason was likely a difference in habi-tat. The area where the population density increased hadbeen experimentally burned, and young heather shootsproduced during the 2 years following the burn providednutritious food for the red grouse. Population density,then, may be determined in large part by external factorsin the environment.
How Do Populations Change in Size?
Populations of organisms, whether they are sunflowers,eagles, or humans, change over time. On a global scale,this change is due to two factors: the rate at which indi-
162 Chapter 8 U N D E R S TA N D I N G P O P U L AT I O N C H A N G E
161-182.Raven08 3/1/03 6:47 AM Page 162

viduals produce offspring (the birth rate) and the rate atwhich organisms die (the death rate) (Figure 8.2a). Inhumans, the birth rate (b) is usually expressed as thenumber of births per 1,000 people per year, and thedeath rate (d) as the number of deaths per 1,000 peopleper year (see “Mini-Glossary: Basic Population Terms”).
The rate of change (increase or decrease), or growthrate (r), of a population is the birth rate (b) minus the
death rate (d). Growth rate is also referred to as naturalincrease in human populations.
r = b – d
As an example, consider a hypothetical human popula-tion of 10,000 in which there are 200 births per year (thatis, by convention, 20 births per 1,000 people) and 100deaths per year (that is, 10 deaths per 1,000 people).
r = 20/1000 – 10/1000
b dr = 0.02 – 0.01 = 0.01, or 1% per year
If organisms in the population are born faster thanthey die, r is a positive value, and population sizeincreases. If organisms in the population die faster thanthey are born, r is a negative value, and population sizedecreases. If r is equal to zero, births and deaths match,and population size is stationary despite continued repro-duction and death.
P R I N C I P L E S O F P O P U L AT I O N E C O LO G Y 1 6 3
Figure 8.1 Red grouse. Red grouse are game birds whosepopulations are managed for hunting. Photographed in Dee-side, Scotland.
Basic Population Terms
birth rate: The number of births per 1,000 individuals.
death rate: The number of deaths per 1,000 individuals.
growth rate: The natural increase of a population, expressed as per-cent per year.
dispersal: The movement of individuals among populations.
immigration: The dispersal of individuals into a population fromanother area or country.
emigration: The dispersal of individuals from a population, boundfor another area or country in which to live.
M I N I - G L O S S A R Y
Increases population: Decreases population:
Births DeathsGlobal
population
(a)
Increases population: Decreases population:
Births Deaths
Immigration Emigration
(b)
Localpopulation
Figure 8.2 Factors that interact to change population size.
(a) On a global scale, the change in a population is due to thenumber of births and deaths. (b) In local populations, such asthe population of the United States, the number of births,deaths, immigrants, and emigrants affect population size.
161-182.Raven08 3/1/03 6:48 AM Page 163

In addition to birth and death rates, dispersal, whichis movement from one region or country to another,must be considered when changes in populations on alocal scale are examined. There are two types of disper-sal: immigration (i), by which individuals enter a popu-lation and thus increase its size, and emigration (e), bywhich individuals leave a population and thus decrease itssize. The growth rate of a local population must take intoaccount birth rate (b), death rate (d), immigration (i), andemigration (e) (Figure 8.2b). The growth rate equals (thebirth rate minus the death rate) plus (immigration minusemigration):
r = (b – d) + (i – e)
For example, the growth rate of a population of 10,000that has 100 births (by convention, 10 per 1,000), 50deaths (5 per 1,000), 10 immigrants (1 per 1,000), and100 emigrants (10 per 1,000) in a given year would becalculated as follows:
r = (10/1000 – 5/1000) + (1/1000 – 10/1000)
b d i er = (0.010 – 0.005) + (0.001 – 0.010)r = 0.005 – 0.009 = –0.004, or –0.4% per year
Maximum Population Growth
The maximum rate at which a population could increaseunder ideal conditions is known as its biotic potential orintrinsic rate of increase. Different species have differ-ent biotic potentials. A particular species’ biotic potentialis influenced by several factors. These include the age atwhich reproduction begins, the fraction of the life spanduring which an individual of that species is capable ofreproducing, the number of reproductive periods perlifetime, and the number of offspring produced duringeach period of reproduction. These factors, called life his-tory characteristics, determine whether a particular specieshas a large or a small biotic potential.
Generally, larger organisms, such as blue whales andelephants, have the smallest biotic potentials, whereasmicroorganisms have the greatest biotic potentials.Under ideal conditions (that is, an environment withunlimited resources), certain bacteria can reproduce bydividing in half every 30 minutes. At this rate of growth,a single bacterium would increase to a population ofmore than 1 million in just 10 hours (Figure 8.3a), andthe population from a single individual would exceed 1billion in 15 hours! If we plot the population number ver-sus time, the graph has a J shape that is characteristic ofexponential population growth, the accelerating popu-lation growth that occurs when optimal conditions allowa constant reproductive rate (Figure 8.3b). When a popu-lation grows exponentially, the larger that population
gets, the faster it grows. It doubles, then doubles again,then again, but each time the doubling occurs in a shortertime period.
Regardless of which species one is considering,whenever the population is growing at its biotic poten-tial, population size plotted versus time gives a curve ofthe same shape. The only variable is time. It may takelonger for a lowland gorilla population than for a bacter-ial population to reach a certain size (because gorillas do
164 Chapter 8 U N D E R S TA N D I N G P O P U L AT I O N C H A N G E
600500400300200100
0 2 3 4 10
700800900
1,0001,100
01 5 6 7 8 9
(b)
(a)
Time (hours)
Num
ber
of b
acte
ria(in
thou
sand
s)
Time (hours)
0
0.51.01.52.02.53.03.54.0
4.55.0
5.56.06.57.07.58.08.59.09.5
10.0
Number of bacteria
1
248
163264
128256
5121,024
2,0484,0968,192
16,38432,76865,536
131,072262,144524,288
1,048,576
Figure 8.3 Exponential population growth. (a) When bacte-ria divide at a constant amount during each time period, theirnumbers increase exponentially. This set of figures assumes azero death rate, but even if a certain percentage of each gener-ation of bacteria died, exponential population growth wouldstill occur; it would just take longer to reach the very highnumbers. (b) When these data are graphed, the curve of expo-nential population growth has a characteristic J shape.
161-182.Raven08 3/1/03 6:48 AM Page 164
not reproduce as rapidly as bacteria), but both popula-tions will always increase exponentially as long as theirgrowth rates remain constant.
Environmental Resistance and CarryingCapacity
Certain populations may exhibit exponential populationgrowth for a short period of time. Exponential popula-tion growth has been experimentally demonstrated inbacterial and protist cultures and in certain insects. How-ever, organisms cannot reproduce indefinitely at theirbiotic potentials, because the environment sets limits,which are collectively called environmental resistance.Environmental resistance includes such unfavorableenvironmental conditions as the limited availability offood, water, shelter, and other essential resources (result-ing in increased competition) as well as limits imposed bydisease and predation. Using the earlier example, bacteriawould never be able to reproduce unchecked for anindefinite period of time because they would run out offood and living space, and poisonous body wastes wouldaccumulate in their vicinity. With crowding, bacteriawould also become more susceptible to parasites (highpopulation densities facilitate the spread of infectiousorganisms such as viruses among individuals) and preda-tors (high population densities increase the likelihood ofa predator catching an individual). As the environmentdeteriorated, their birth rate (b) would decline and theirdeath rate (d) would increase. The environmental condi-tions might worsen to a point where d would exceed b,and the population would decrease. The number of indi-viduals in a population, then, is controlled by the abilityof the environment to support it. As the number of indi-viduals in a population increases, so does environmentalresistance, which acts to limit population growth. Envi-ronmental resistance is an excellent example of a nega-tive feedback loop (see Chapter 6).
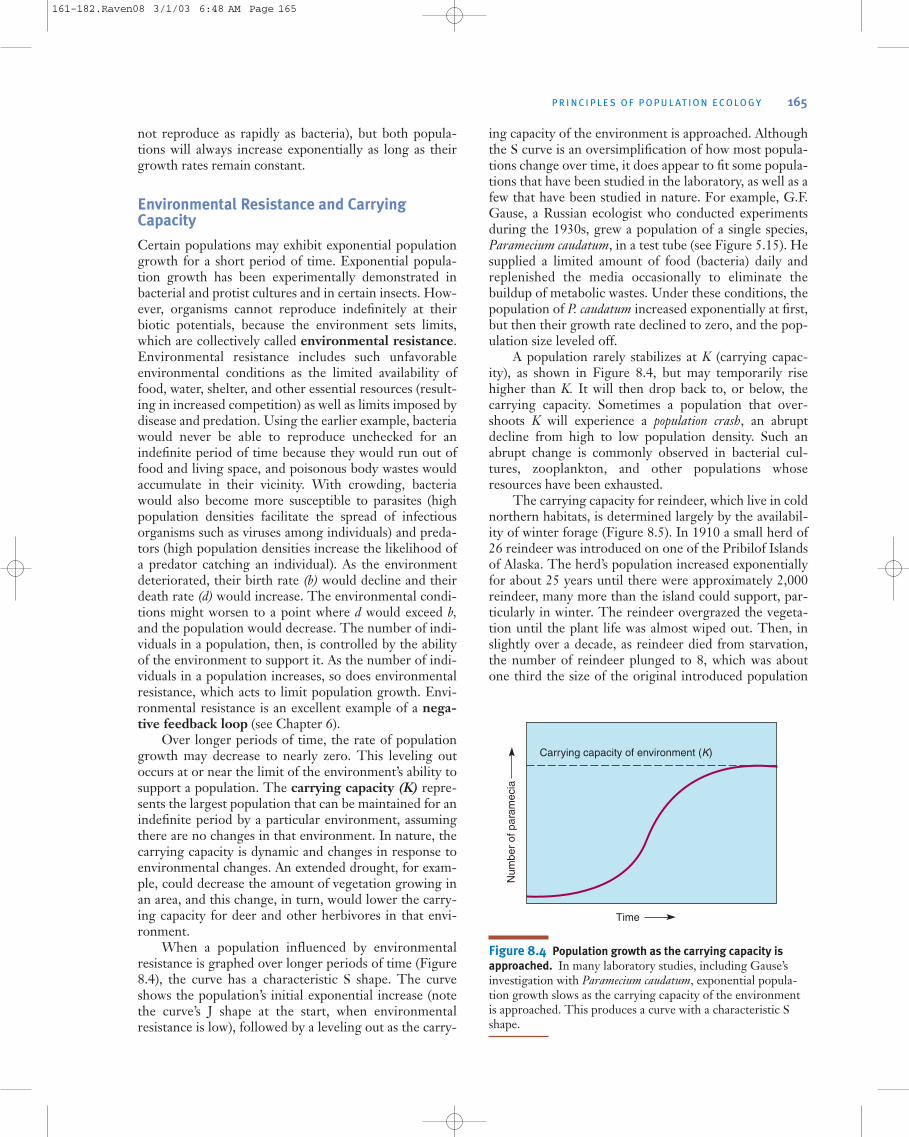
Over longer periods of time, the rate of populationgrowth may decrease to nearly zero. This leveling outoccurs at or near the limit of the environment’s ability tosupport a population. The carrying capacity (K) repre-sents the largest population that can be maintained for anindefinite period by a particular environment, assumingthere are no changes in that environment. In nature, thecarrying capacity is dynamic and changes in response toenvironmental changes. An extended drought, for exam-ple, could decrease the amount of vegetation growing inan area, and this change, in turn, would lower the carry-ing capacity for deer and other herbivores in that envi-ronment.
When a population influenced by environmentalresistance is graphed over longer periods of time (Figure8.4), the curve has a characteristic S shape. The curveshows the population’s initial exponential increase (notethe curve’s J shape at the start, when environmentalresistance is low), followed by a leveling out as the carry-
ing capacity of the environment is approached. Althoughthe S curve is an oversimplification of how most popula-tions change over time, it does appear to fit some popula-tions that have been studied in the laboratory, as well as afew that have been studied in nature. For example, G.F.Gause, a Russian ecologist who conducted experimentsduring the 1930s, grew a population of a single species,Paramecium caudatum, in a test tube (see Figure 5.15). Hesupplied a limited amount of food (bacteria) daily andreplenished the media occasionally to eliminate thebuildup of metabolic wastes. Under these conditions, thepopulation of P. caudatum increased exponentially at first,but then their growth rate declined to zero, and the pop-ulation size leveled off.
A population rarely stabilizes at K (carrying capac-ity), as shown in Figure 8.4, but may temporarily risehigher than K. It will then drop back to, or below, thecarrying capacity. Sometimes a population that over-shoots K will experience a population crash, an abruptdecline from high to low population density. Such anabrupt change is commonly observed in bacterial cul-tures, zooplankton, and other populations whoseresources have been exhausted.
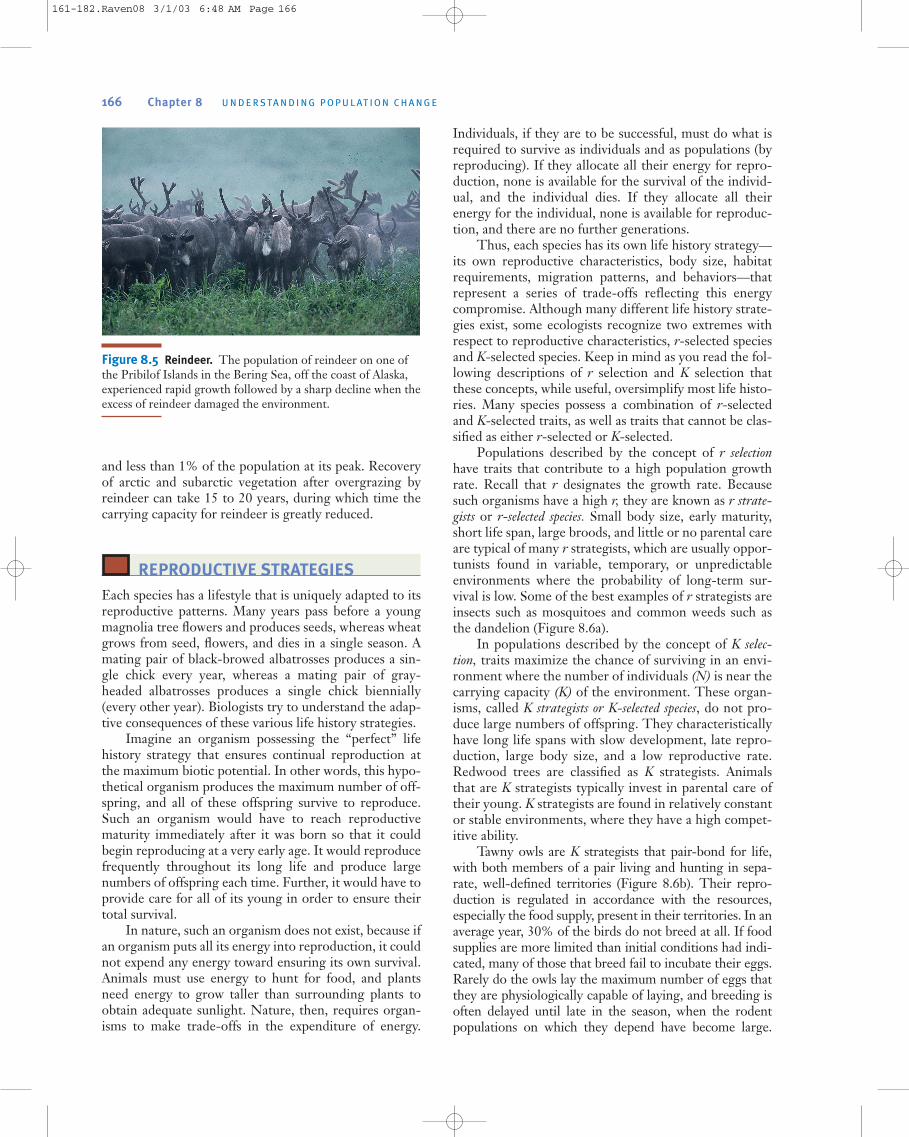
The carrying capacity for reindeer, which live in coldnorthern habitats, is determined largely by the availabil-ity of winter forage (Figure 8.5). In 1910 a small herd of26 reindeer was introduced on one of the Pribilof Islandsof Alaska. The herd’s population increased exponentiallyfor about 25 years until there were approximately 2,000reindeer, many more than the island could support, par-ticularly in winter. The reindeer overgrazed the vegeta-tion until the plant life was almost wiped out. Then, inslightly over a decade, as reindeer died from starvation,the number of reindeer plunged to 8, which was aboutone third the size of the original introduced population
P R I N C I P L E S O F P O P U L AT I O N E C O LO G Y 165
Time
Num
ber
of p
aram
ecia
Carrying capacity of environment (K)
Figure 8.4 Population growth as the carrying capacity is
approached. In many laboratory studies, including Gause’sinvestigation with Paramecium caudatum, exponential popula-tion growth slows as the carrying capacity of the environmentis approached. This produces a curve with a characteristic Sshape.
161-182.Raven08 3/1/03 6:48 AM Page 165
and less than 1% of the population at its peak. Recoveryof arctic and subarctic vegetation after overgrazing byreindeer can take 15 to 20 years, during which time thecarrying capacity for reindeer is greatly reduced.
REPRODUCTIVE STRATEGIES
Each species has a lifestyle that is uniquely adapted to itsreproductive patterns. Many years pass before a youngmagnolia tree flowers and produces seeds, whereas wheatgrows from seed, flowers, and dies in a single season. Amating pair of black-browed albatrosses produces a sin-gle chick every year, whereas a mating pair of gray-headed albatrosses produces a single chick biennially(every other year). Biologists try to understand the adap-tive consequences of these various life history strategies.
Imagine an organism possessing the “perfect” lifehistory strategy that ensures continual reproduction atthe maximum biotic potential. In other words, this hypo-thetical organism produces the maximum number of off-spring, and all of these offspring survive to reproduce.Such an organism would have to reach reproductivematurity immediately after it was born so that it couldbegin reproducing at a very early age. It would reproducefrequently throughout its long life and produce largenumbers of offspring each time. Further, it would have toprovide care for all of its young in order to ensure theirtotal survival.
In nature, such an organism does not exist, because ifan organism puts all its energy into reproduction, it couldnot expend any energy toward ensuring its own survival.Animals must use energy to hunt for food, and plantsneed energy to grow taller than surrounding plants toobtain adequate sunlight. Nature, then, requires organ-isms to make trade-offs in the expenditure of energy.
Individuals, if they are to be successful, must do what isrequired to survive as individuals and as populations (byreproducing). If they allocate all their energy for repro-duction, none is available for the survival of the individ-ual, and the individual dies. If they allocate all theirenergy for the individual, none is available for reproduc-tion, and there are no further generations.
Thus, each species has its own life history strategy—its own reproductive characteristics, body size, habitatrequirements, migration patterns, and behaviors—thatrepresent a series of trade-offs reflecting this energycompromise. Although many different life history strate-gies exist, some ecologists recognize two extremes withrespect to reproductive characteristics, r-selected speciesand K-selected species. Keep in mind as you read the fol-lowing descriptions of r selection and K selection thatthese concepts, while useful, oversimplify most life histo-ries. Many species possess a combination of r-selectedand K-selected traits, as well as traits that cannot be clas-sified as either r-selected or K-selected.
Populations described by the concept of r selectionhave traits that contribute to a high population growthrate. Recall that r designates the growth rate. Becausesuch organisms have a high r, they are known as r strate-gists or r-selected species. Small body size, early maturity,short life span, large broods, and little or no parental careare typical of many r strategists, which are usually oppor-tunists found in variable, temporary, or unpredictableenvironments where the probability of long-term sur-vival is low. Some of the best examples of r strategists areinsects such as mosquitoes and common weeds such asthe dandelion (Figure 8.6a).
In populations described by the concept of K selec-tion, traits maximize the chance of surviving in an envi-ronment where the number of individuals (N) is near thecarrying capacity (K) of the environment. These organ-isms, called K strategists or K-selected species, do not pro-duce large numbers of offspring. They characteristicallyhave long life spans with slow development, late repro-duction, large body size, and a low reproductive rate.Redwood trees are classified as K strategists. Animalsthat are K strategists typically invest in parental care oftheir young. K strategists are found in relatively constantor stable environments, where they have a high compet-itive ability.
Tawny owls are K strategists that pair-bond for life,with both members of a pair living and hunting in sepa-rate, well-defined territories (Figure 8.6b). Their repro-duction is regulated in accordance with the resources,especially the food supply, present in their territories. In anaverage year, 30% of the birds do not breed at all. If foodsupplies are more limited than initial conditions had indi-cated, many of those that breed fail to incubate their eggs.Rarely do the owls lay the maximum number of eggs thatthey are physiologically capable of laying, and breeding isoften delayed until late in the season, when the rodentpopulations on which they depend have become large.
166 Chapter 8 U N D E R S TA N D I N G P O P U L AT I O N C H A N G E
Figure 8.5 Reindeer. The population of reindeer on one ofthe Pribilof Islands in the Bering Sea, off the coast of Alaska,experienced rapid growth followed by a sharp decline when theexcess of reindeer damaged the environment.
161-182.Raven08 3/1/03 6:48 AM Page 166
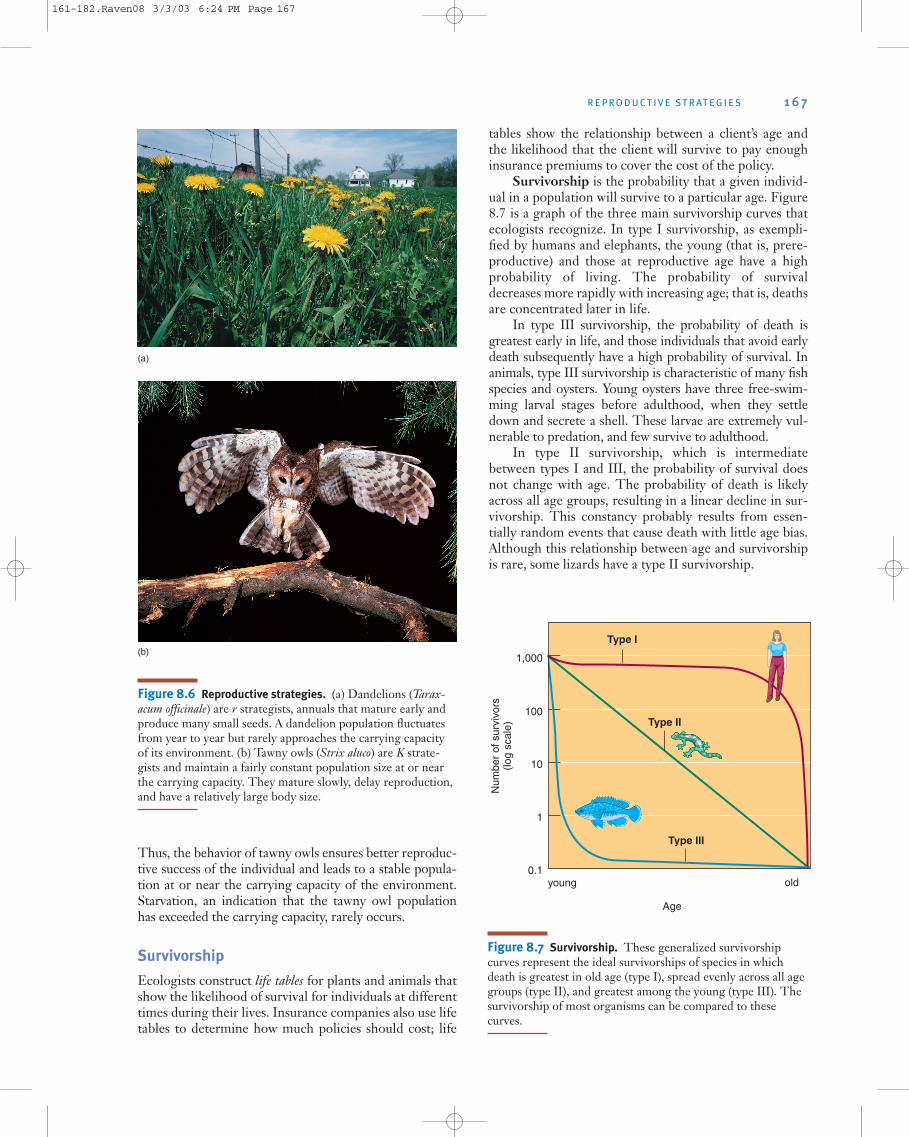
Thus, the behavior of tawny owls ensures better reproduc-tive success of the individual and leads to a stable popula-tion at or near the carrying capacity of the environment.Starvation, an indication that the tawny owl populationhas exceeded the carrying capacity, rarely occurs.
Survivorship
Ecologists construct life tables for plants and animals thatshow the likelihood of survival for individuals at differenttimes during their lives. Insurance companies also use lifetables to determine how much policies should cost; life
tables show the relationship between a client’s age andthe likelihood that the client will survive to pay enoughinsurance premiums to cover the cost of the policy.
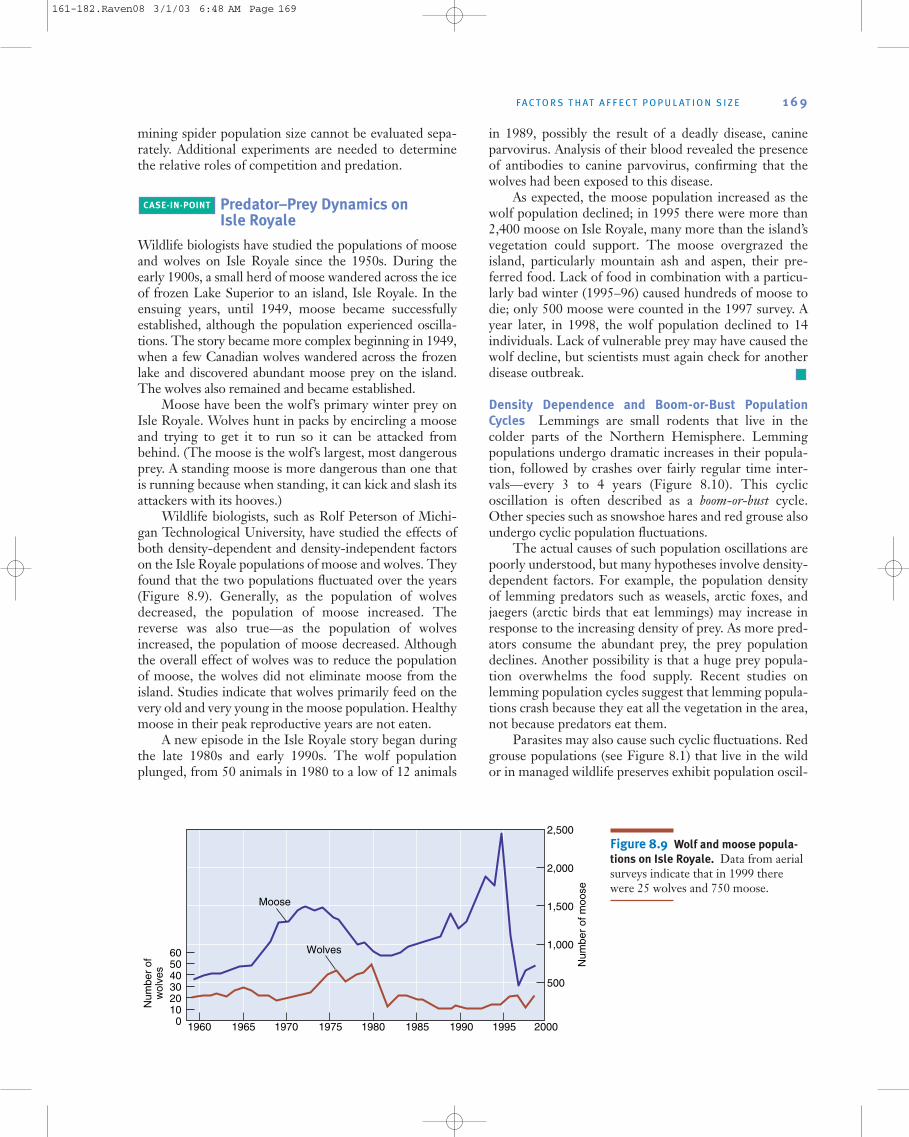
Survivorship is the probability that a given individ-ual in a population will survive to a particular age. Figure8.7 is a graph of the three main survivorship curves thatecologists recognize. In type I survivorship, as exempli-fied by humans and elephants, the young (that is, prere-productive) and those at reproductive age have a highprobability of living. The probability of survivaldecreases more rapidly with increasing age; that is, deathsare concentrated later in life.
In type III survivorship, the probability of death isgreatest early in life, and those individuals that avoid earlydeath subsequently have a high probability of survival. Inanimals, type III survivorship is characteristic of many fishspecies and oysters. Young oysters have three free-swim-ming larval stages before adulthood, when they settledown and secrete a shell. These larvae are extremely vul-nerable to predation, and few survive to adulthood.
In type II survivorship, which is intermediatebetween types I and III, the probability of survival doesnot change with age. The probability of death is likelyacross all age groups, resulting in a linear decline in sur-vivorship. This constancy probably results from essen-tially random events that cause death with little age bias.Although this relationship between age and survivorshipis rare, some lizards have a type II survivorship.
R E P R O D U C T I V E S T R AT E G I E S 1 6 7
Figure 8.6 Reproductive strategies. (a) Dandelions (Tarax-acum officinale) are r strategists, annuals that mature early andproduce many small seeds. A dandelion population fluctuatesfrom year to year but rarely approaches the carrying capacityof its environment. (b) Tawny owls (Strix aluco) are K strate-gists and maintain a fairly constant population size at or nearthe carrying capacity. They mature slowly, delay reproduction,and have a relatively large body size.
(a)
(b)
Num
ber
of s
urvi
vors
(log
scal
e)
10
1
Age
young old
100
1,000
0.1
Type III
Type II
Type I
Figure 8.7 Survivorship. These generalized survivorshipcurves represent the ideal survivorships of species in whichdeath is greatest in old age (type I), spread evenly across all agegroups (type II), and greatest among the young (type III). Thesurvivorship of most organisms can be compared to thesecurves.
161-182.Raven08 3/3/03 6:24 PM Page 167

The three survivorship curves are generalizations,and few populations exactly fit one of the three. Somespecies have one type of survivorship curve early in lifeand another type as adults. Herring gulls have a type IIIsurvivorship curve early in life and a type II curve asadults (Figure 8.8). Note that with most, death occursalmost immediately after hatching, despite the protectionand care given to the chicks by the parent bird. Herringgull chicks die from predation or attack by other herringgulls, inclement weather, infectious disease, or starvationfollowing the death of the parent. Once the chicksbecome independent, their survivorship increases dra-matically, and death occurs at about the same ratethroughout their remaining lives. As a result, few or noherring gulls die from the degenerative diseases of “oldage” that cause death in most humans.
FACTORS THAT AFFECT
POPULATION SIZE
Certain natural mechanisms appear to influence popula-tion size. Factors that affect population size fall into twocategories, density-dependent factors (the “regulatory”mechanisms) and density-independent factors (the “non-regulatory” mechanisms). These two sets of factors varyin importance from one species to another, and in mostcases probably interact simultaneously in complex waysto determine the size of a population.
Density-Dependent Factors
Certain environmental factors have a greater influenceon a population when its density is greater. If a change inpopulation density alters how an environmental factoraffects that population, then the environmental factor is
said to be a density-dependent factor. As populationdensity increases, density-dependent factors tend to slowpopulation growth by causing an increase in death rateand/or a decrease in birth rate. The effect of these den-sity-dependent factors on population growth increases asthe population density increases—that is, density-dependent factors affect a larger proportion, not just alarger number, of the population. Density-dependentfactors can also affect population growth when popula-tion density declines, by decreasing death rate and/orincreasing birth rate. Density-dependent factors, then,tend to regulate a population at a relatively constant sizethat is near the carrying capacity of the environment.(Keep in mind, however, that the carrying capacity of theenvironment frequently changes.)
Predation, disease, and competition are examples ofdensity-dependent factors. As the density of a populationincreases, predators are more likely to find an individualof a given prey species. When population density is high,the members of a population encounter one anothermore frequently, and the chance of their transmittinginfectious disease organisms increases. As populationdensity increases, so does competition for resources suchas living space, food, cover, water, minerals, and sunlight.The opposite effects occur when the density of a popula-tion decreases. Predators are less likely to encounter indi-vidual prey, parasites are less likely to be transmittedfrom one host to another, and competition among mem-bers of the population for resources such as living spaceand food declines.
Most studies of density dependence have been con-ducted in laboratory settings where all density-depend-ent (and density-independent) factors except one arecontrolled experimentally. But populations in natural set-tings are exposed to a complex set of variables that con-tinually change. As a result, in natural communities it canbe difficult to evaluate the relative effects of differentdensity-dependent and density-independent factors.
Ecologists from the University of California, Davisnoted that few spiders occur on tropical islands inhabitedby lizards, whereas more spiders and more species of spi-ders are found on lizard-free islands. Deciding to studythese observations experimentally, the researchersselected 12 very small Caribbean islands, 4 with lizardsand 8 without; all contained web-building spiders. Theyintroduced a small population of lizards onto four of thelizard-free islands. After 7 years, spider population densi-ties were higher in the lizard-free islands than in islandswith lizards. Moreover, the islands without lizards hadmore species of spiders. Therefore, we might concludethat lizards control spider populations. But even in thisrelatively simple experiment, the results may also beexplained by a combination of two density-dependentfactors, predation (lizards eat spiders) and competition(lizards compete with spiders for insect prey—that is,both spiders and lizards eat insects). In this experiment,the effects of the two density-dependent factors in deter-
168 Chapter 8 U N D E R S TA N D I N G P O P U L AT I O N C H A N G E
Sur
vivo
rs p
er th
ousa
nd(lo
g sc
ale)
10
100
1000
1
Age (years)
10 20
Figure 8.8 Survivorship for a herring gull population. Thissurvivorship curve reveals type III survivorship as chicks andtype II survivorship as adults.
161-182.Raven08 3/1/03 6:48 AM Page 168
mining spider population size cannot be evaluated sepa-rately. Additional experiments are needed to determinethe relative roles of competition and predation.
Predator–Prey Dynamics on Isle Royale
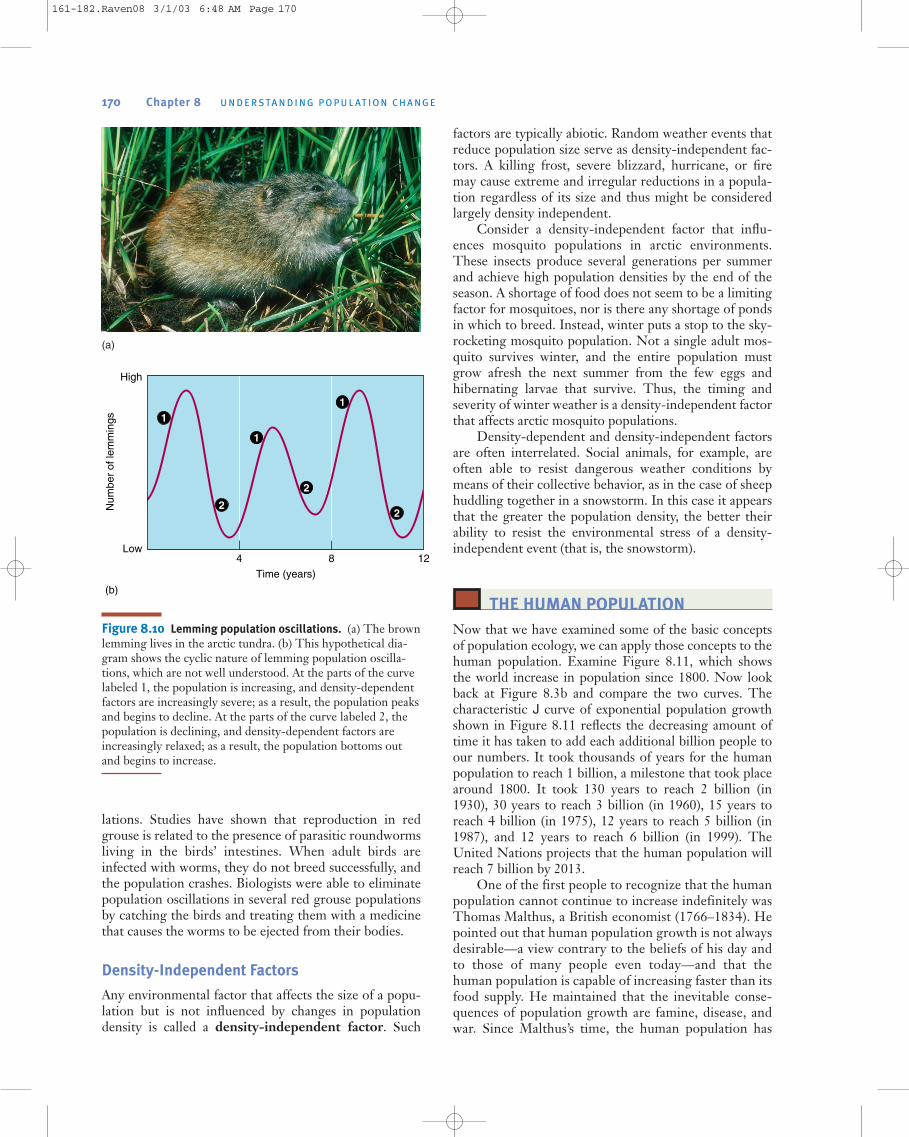
Wildlife biologists have studied the populations of mooseand wolves on Isle Royale since the 1950s. During theearly 1900s, a small herd of moose wandered across the iceof frozen Lake Superior to an island, Isle Royale. In theensuing years, until 1949, moose became successfullyestablished, although the population experienced oscilla-tions. The story became more complex beginning in 1949,when a few Canadian wolves wandered across the frozenlake and discovered abundant moose prey on the island.The wolves also remained and became established.
Moose have been the wolf’s primary winter prey onIsle Royale. Wolves hunt in packs by encircling a mooseand trying to get it to run so it can be attacked frombehind. (The moose is the wolf’s largest, most dangerousprey. A standing moose is more dangerous than one thatis running because when standing, it can kick and slash itsattackers with its hooves.)
Wildlife biologists, such as Rolf Peterson of Michi-gan Technological University, have studied the effects ofboth density-dependent and density-independent factorson the Isle Royale populations of moose and wolves. Theyfound that the two populations fluctuated over the years(Figure 8.9). Generally, as the population of wolvesdecreased, the population of moose increased. Thereverse was also true—as the population of wolvesincreased, the population of moose decreased. Althoughthe overall effect of wolves was to reduce the populationof moose, the wolves did not eliminate moose from theisland. Studies indicate that wolves primarily feed on thevery old and very young in the moose population. Healthymoose in their peak reproductive years are not eaten.
A new episode in the Isle Royale story began duringthe late 1980s and early 1990s. The wolf populationplunged, from 50 animals in 1980 to a low of 12 animals
in 1989, possibly the result of a deadly disease, canineparvovirus. Analysis of their blood revealed the presenceof antibodies to canine parvovirus, confirming that thewolves had been exposed to this disease.
As expected, the moose population increased as thewolf population declined; in 1995 there were more than2,400 moose on Isle Royale, many more than the island’svegetation could support. The moose overgrazed theisland, particularly mountain ash and aspen, their pre-ferred food. Lack of food in combination with a particu-larly bad winter (1995–96) caused hundreds of moose todie; only 500 moose were counted in the 1997 survey. Ayear later, in 1998, the wolf population declined to 14individuals. Lack of vulnerable prey may have caused thewolf decline, but scientists must again check for anotherdisease outbreak.
Density Dependence and Boom-or-Bust Population
Cycles Lemmings are small rodents that live in thecolder parts of the Northern Hemisphere. Lemmingpopulations undergo dramatic increases in their popula-tion, followed by crashes over fairly regular time inter-vals—every 3 to 4 years (Figure 8.10). This cyclicoscillation is often described as a boom-or-bust cycle.Other species such as snowshoe hares and red grouse alsoundergo cyclic population fluctuations.
The actual causes of such population oscillations arepoorly understood, but many hypotheses involve density-dependent factors. For example, the population densityof lemming predators such as weasels, arctic foxes, andjaegers (arctic birds that eat lemmings) may increase inresponse to the increasing density of prey. As more pred-ators consume the abundant prey, the prey populationdeclines. Another possibility is that a huge prey popula-tion overwhelms the food supply. Recent studies onlemming population cycles suggest that lemming popula-tions crash because they eat all the vegetation in the area,not because predators eat them.
Parasites may also cause such cyclic fluctuations. Redgrouse populations (see Figure 8.1) that live in the wildor in managed wildlife preserves exhibit population oscil-
CASE·IN·POINT
F A C TO R S T H AT A F F E C T P O P U L AT I O N S I Z E 1 6 9
6050403020100
2,500
2,000
1,500
1,000
500
Moose
1960 1965 1970 1975 1980 1985 1990 1995 2000
Num
ber
of m
oose
Num
ber
ofw
olve
s
Wolves
Figure 8.9 Wolf and moose popula-
tions on Isle Royale. Data from aerialsurveys indicate that in 1999 therewere 25 wolves and 750 moose.
161-182.Raven08 3/1/03 6:48 AM Page 169
lations. Studies have shown that reproduction in redgrouse is related to the presence of parasitic roundwormsliving in the birds’ intestines. When adult birds areinfected with worms, they do not breed successfully, andthe population crashes. Biologists were able to eliminatepopulation oscillations in several red grouse populationsby catching the birds and treating them with a medicinethat causes the worms to be ejected from their bodies.
Density-Independent Factors
Any environmental factor that affects the size of a popu-lation but is not influenced by changes in populationdensity is called a density-independent factor. Such
factors are typically abiotic. Random weather events thatreduce population size serve as density-independent fac-tors. A killing frost, severe blizzard, hurricane, or firemay cause extreme and irregular reductions in a popula-tion regardless of its size and thus might be consideredlargely density independent.
Consider a density-independent factor that influ-ences mosquito populations in arctic environments.These insects produce several generations per summerand achieve high population densities by the end of theseason. A shortage of food does not seem to be a limitingfactor for mosquitoes, nor is there any shortage of pondsin which to breed. Instead, winter puts a stop to the sky-rocketing mosquito population. Not a single adult mos-quito survives winter, and the entire population mustgrow afresh the next summer from the few eggs andhibernating larvae that survive. Thus, the timing andseverity of winter weather is a density-independent factorthat affects arctic mosquito populations.
Density-dependent and density-independent factorsare often interrelated. Social animals, for example, areoften able to resist dangerous weather conditions bymeans of their collective behavior, as in the case of sheephuddling together in a snowstorm. In this case it appearsthat the greater the population density, the better theirability to resist the environmental stress of a density-independent event (that is, the snowstorm).
THE HUMAN POPULATION
Now that we have examined some of the basic conceptsof population ecology, we can apply those concepts to thehuman population. Examine Figure 8.11, which showsthe world increase in population since 1800. Now lookback at Figure 8.3b and compare the two curves. Thecharacteristic J curve of exponential population growthshown in Figure 8.11 reflects the decreasing amount oftime it has taken to add each additional billion people toour numbers. It took thousands of years for the humanpopulation to reach 1 billion, a milestone that took placearound 1800. It took 130 years to reach 2 billion (in1930), 30 years to reach 3 billion (in 1960), 15 years toreach 4 billion (in 1975), 12 years to reach 5 billion (in1987), and 12 years to reach 6 billion (in 1999). TheUnited Nations projects that the human population willreach 7 billion by 2013.
One of the first people to recognize that the humanpopulation cannot continue to increase indefinitely wasThomas Malthus, a British economist (1766–1834). Hepointed out that human population growth is not alwaysdesirable—a view contrary to the beliefs of his day andto those of many people even today—and that thehuman population is capable of increasing faster than itsfood supply. He maintained that the inevitable conse-quences of population growth are famine, disease, andwar. Since Malthus’s time, the human population has
170 Chapter 8 U N D E R S TA N D I N G P O P U L AT I O N C H A N G E
High
Low4 8
Time (years)
(b)
12
Num
ber
of le
mm
ings 1
1
2
2
2
1
(a)
Figure 8.10 Lemming population oscillations. (a) The brownlemming lives in the arctic tundra. (b) This hypothetical dia-gram shows the cyclic nature of lemming population oscilla-tions, which are not well understood. At the parts of the curvelabeled 1, the population is increasing, and density-dependentfactors are increasingly severe; as a result, the population peaksand begins to decline. At the parts of the curve labeled 2, thepopulation is declining, and density-dependent factors areincreasingly relaxed; as a result, the population bottoms outand begins to increase.
161-182.Raven08 3/1/03 6:48 AM Page 170

grown from about 1 billion to more than 6 billion. Itappears that Malthus was proved wrong. Our popula-tion has been able to grow so dramatically because sci-entific advances have enabled us to improve theproductivity of the land so that in most places food pro-duction has kept pace with population growth. The rea-son Malthus’s ideas may ultimately be proved correct,however, is that we do not know if our increase in foodproduction is sustainable. Have we achieved this increasein food production at the environmental cost of reduc-ing the ability of the land to meet the needs of futurepopulations?
Current Population Numbers
Our world population was 6.2 billion in 2002 andincreased by approximately 78 million from 2001 to2002. This increase is not due to an increase in the birthrate (b). In fact, the world birth rate has actually declinedslightly during the past 200 years. The increase in popu-lation is due instead to a dramatic decrease in the deathrate (d), which has occurred primarily because greaterfood production, better medical care, and improvementsin water quality and sanitation practices have increasedthe life expectancies for a great majority of the globalpopulation. From about 1920 to 2000, the death rate inMexico fell from approximately 40 to 5 per 1,000 individ-uals, whereas the birth rate dropped from approximately40 to 26 per 1,000 individuals (Figure 8.12). BecauseMexico’s birth rate currently remains much greater than
its death rate, it has a high annual growth rate (r), 2.1%in 2002:
r = b – dr = 26/1,000 – 5/1,000r = 0.026 – 0.005 = 0.021, or 2.1% per year
Projecting Future Population Numbers
The human population has reached a turning point.Although our numbers continue to increase, the worldgrowth rate (r) has declined slightly over the past severalyears, from a peak of 2.2% per year in the mid-1960s to1.3% per year in 2002. Population experts at the UnitedNations and the World Bank have projected that thegrowth rate will continue to decrease slowly until zeropopulation growth is attained. Thus, exponential growthof the human population will end, and the J curve may bereplaced by the S curve. It is projected that zero popula-tion growth—when the birth rate equals the deathrate—will occur toward the end of the 21st century (see“Mini-Glossary: Population Terms Commonly Appliedto Humans”)
The United Nations periodically publishes popula-tion projections for the 21st century. The latest (2000)U.N. figures available forecast that the human popula-tion will be between 7.9 billion (their “low” projection)and 10.9 billion (their “high” projection) in the year2050, with 9.3 billion thought to be “most likely” (Figure8.13). The estimates vary depending on fertility changes,particularly in less developed countries because that iswhere almost all of the growth will take place.
Such population projections are “what if” exercises:Given certain assumptions about future tendencies in the
T H E H U M A N P O P U L AT I O N 1 7 1
Year
1800 1900 2000
Hum
an P
opul
atio
n(b
illio
ns)
1
2
3
4
5
6
Figure 8.11 Human population numbers, 1800 to present.
The human population has been increasing exponentially.Population experts predict that the population will level outduring the 21st century, possibly forming the S curve observedin other species.
Rat
e pe
r 10
00 p
opul
atio
n
10
40
50
1900 1925
Time
20
30
1950 1975 2000
Death rate
Birth rate
Ove
rall
popu
latio
nin
crea
se
Figure 8.12 Birth and death rates in Mexico, 1900 to 2000.
Both birth and death rates generally declined in Mexico duringthe 20th century. Because the death rate declined much morethan the birth rate, Mexico experienced a high growth rate.(The high death rate prior to 1925 was caused by the MexicanRevolution.)
161-182.Raven08 3/1/03 6:48 AM Page 171
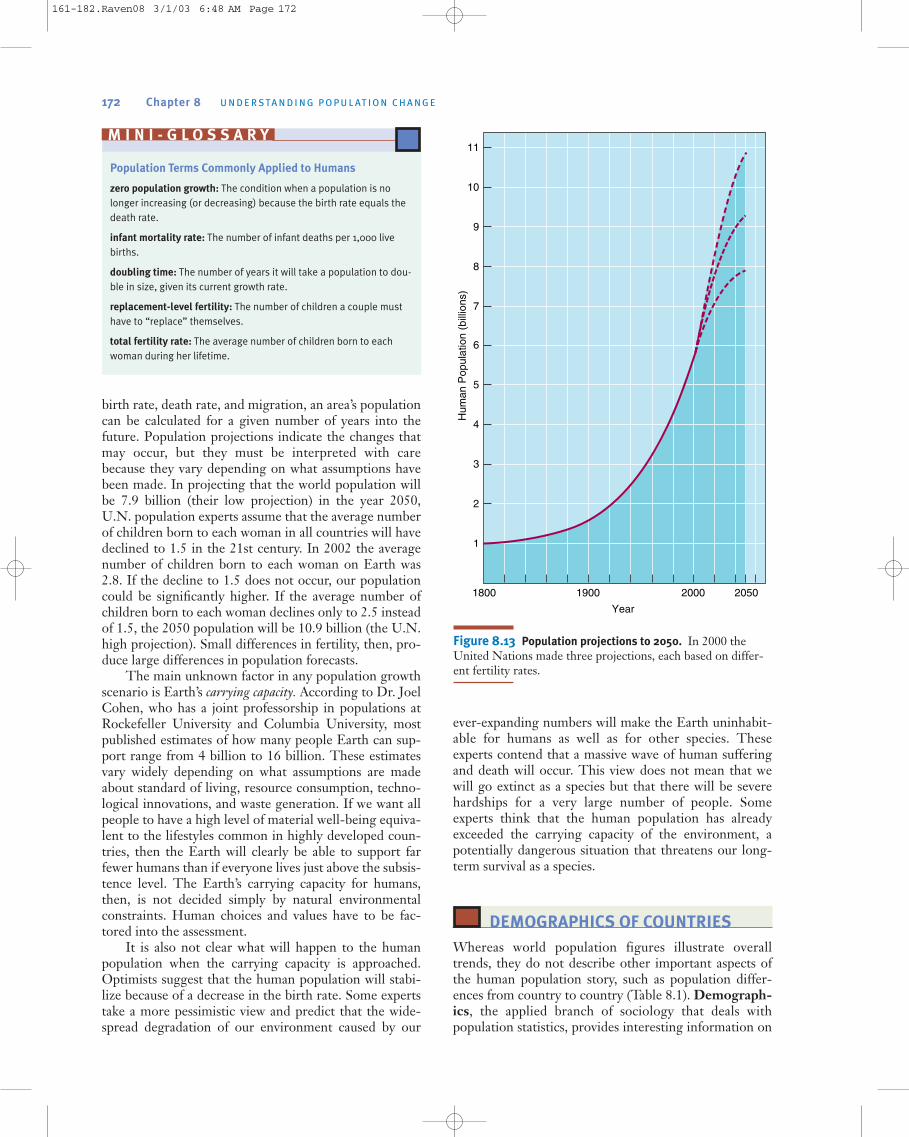
birth rate, death rate, and migration, an area’s populationcan be calculated for a given number of years into thefuture. Population projections indicate the changes thatmay occur, but they must be interpreted with carebecause they vary depending on what assumptions havebeen made. In projecting that the world population willbe 7.9 billion (their low projection) in the year 2050,U.N. population experts assume that the average numberof children born to each woman in all countries will havedeclined to 1.5 in the 21st century. In 2002 the averagenumber of children born to each woman on Earth was2.8. If the decline to 1.5 does not occur, our populationcould be significantly higher. If the average number ofchildren born to each woman declines only to 2.5 insteadof 1.5, the 2050 population will be 10.9 billion (the U.N.high projection). Small differences in fertility, then, pro-duce large differences in population forecasts.
The main unknown factor in any population growthscenario is Earth’s carrying capacity. According to Dr. JoelCohen, who has a joint professorship in populations atRockefeller University and Columbia University, mostpublished estimates of how many people Earth can sup-port range from 4 billion to 16 billion. These estimatesvary widely depending on what assumptions are madeabout standard of living, resource consumption, techno-logical innovations, and waste generation. If we want allpeople to have a high level of material well-being equiva-lent to the lifestyles common in highly developed coun-tries, then the Earth will clearly be able to support farfewer humans than if everyone lives just above the subsis-tence level. The Earth’s carrying capacity for humans,then, is not decided simply by natural environmentalconstraints. Human choices and values have to be fac-tored into the assessment.
It is also not clear what will happen to the humanpopulation when the carrying capacity is approached.Optimists suggest that the human population will stabi-lize because of a decrease in the birth rate. Some expertstake a more pessimistic view and predict that the wide-spread degradation of our environment caused by our
ever-expanding numbers will make the Earth uninhabit-able for humans as well as for other species. Theseexperts contend that a massive wave of human sufferingand death will occur. This view does not mean that wewill go extinct as a species but that there will be severehardships for a very large number of people. Someexperts think that the human population has alreadyexceeded the carrying capacity of the environment, apotentially dangerous situation that threatens our long-term survival as a species.
DEMOGRAPHICS OF COUNTRIES
Whereas world population figures illustrate overalltrends, they do not describe other important aspects ofthe human population story, such as population differ-ences from country to country (Table 8.1). Demograph-ics, the applied branch of sociology that deals withpopulation statistics, provides interesting information on
172 Chapter 8 U N D E R S TA N D I N G P O P U L AT I O N C H A N G E
Population Terms Commonly Applied to Humans
zero population growth: The condition when a population is nolonger increasing (or decreasing) because the birth rate equals thedeath rate.
infant mortality rate: The number of infant deaths per 1,000 livebirths.
doubling time: The number of years it will take a population to dou-ble in size, given its current growth rate.
replacement-level fertility: The number of children a couple musthave to “replace” themselves.
total fertility rate: The average number of children born to eachwoman during her lifetime.
M I N I - G L O S S A R Y
Year
1800 1900 2000 2050
Hum
an P
opul
atio
n (b
illio
ns)
1
2
3
4
5
6
7
8
9
10
11
Figure 8.13 Population projections to 2050. In 2000 theUnited Nations made three projections, each based on differ-ent fertility rates.
161-182.Raven08 3/1/03 6:48 AM Page 172
the populations of various countries. As you probablyknow, not all countries have the same rates of populationincrease. Countries can be classified into two groups—highly developed and developing—depending on growthrates, degree of industrialization, and relative prosperity(Table 8.2).
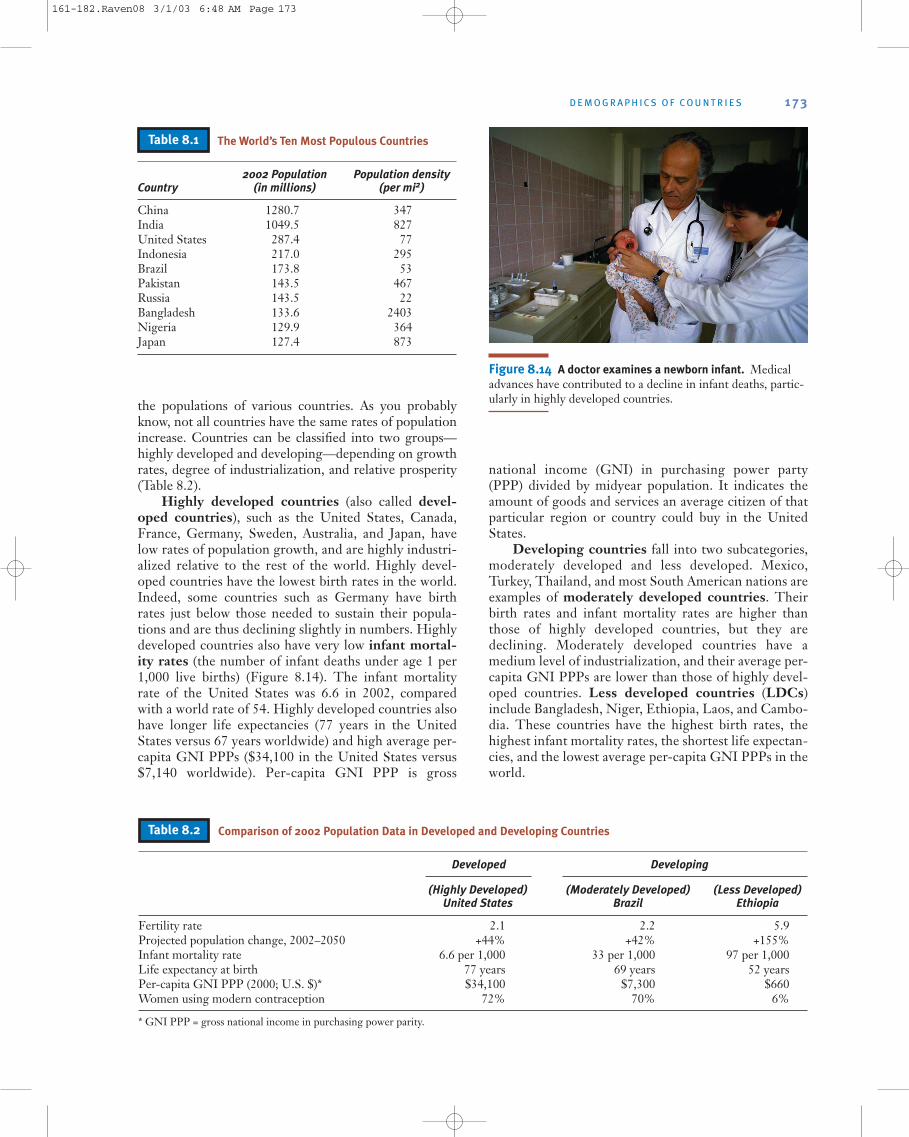
Highly developed countries (also called devel-oped countries), such as the United States, Canada,France, Germany, Sweden, Australia, and Japan, havelow rates of population growth, and are highly industri-alized relative to the rest of the world. Highly devel-oped countries have the lowest birth rates in the world.Indeed, some countries such as Germany have birthrates just below those needed to sustain their popula-tions and are thus declining slightly in numbers. Highlydeveloped countries also have very low infant mortal-ity rates (the number of infant deaths under age 1 per1,000 live births) (Figure 8.14). The infant mortalityrate of the United States was 6.6 in 2002, comparedwith a world rate of 54. Highly developed countries alsohave longer life expectancies (77 years in the UnitedStates versus 67 years worldwide) and high average per-capita GNI PPPs ($34,100 in the United States versus$7,140 worldwide). Per-capita GNI PPP is gross
national income (GNI) in purchasing power party(PPP) divided by midyear population. It indicates theamount of goods and services an average citizen of thatparticular region or country could buy in the UnitedStates.
Developing countries fall into two subcategories,moderately developed and less developed. Mexico,Turkey, Thailand, and most South American nations areexamples of moderately developed countries. Theirbirth rates and infant mortality rates are higher thanthose of highly developed countries, but they aredeclining. Moderately developed countries have amedium level of industrialization, and their average per-capita GNI PPPs are lower than those of highly devel-oped countries. Less developed countries (LDCs)include Bangladesh, Niger, Ethiopia, Laos, and Cambo-dia. These countries have the highest birth rates, thehighest infant mortality rates, the shortest life expectan-cies, and the lowest average per-capita GNI PPPs in theworld.
D E M O G R A P H I C S O F C O U N T R I E S 1 7 3
The World’s Ten Most Populous Countries
2002 Population Population density Country (in millions) (per mi2)
China 1280.7 347India 1049.5 827United States 287.4 77Indonesia 217.0 295Brazil 173.8 53Pakistan 143.5 467Russia 143.5 22Bangladesh 133.6 2403Nigeria 129.9 364Japan 127.4 873
Table 8.1
Comparison of 2002 Population Data in Developed and Developing Countries
Developed Developing
(Highly Developed) (Moderately Developed) (Less Developed) United States Brazil Ethiopia
Fertility rate 2.1 2.2 5.9Projected population change, 2002–2050 +44% +42% +155%Infant mortality rate 6.6 per 1,000 33 per 1,000 97 per 1,000Life expectancy at birth 77 years 69 years 52 yearsPer-capita GNI PPP (2000; U.S. $)* $34,100 $7,300 $660Women using modern contraception 72% 70% 6%
* GNI PPP = gross national income in purchasing power parity.
Table 8.2
Figure 8.14 A doctor examines a newborn infant. Medicaladvances have contributed to a decline in infant deaths, partic-ularly in highly developed countries.
161-182.Raven08 3/1/03 6:48 AM Page 173

One way to express the population growth of a coun-try is to determine its doubling time, the amount of timeit would take for its population to double in size, assum-ing that its current growth rate does not change. A sim-plified formula for doubling time (td) is td = 70/r. Theactual formula involves calculus and is beyond the scopeof this text.
A country’s doubling time can usually identify it as ahighly, moderately, or less developed country: Theshorter the doubling time, the less developed the coun-try. At rates of growth in 2002, the doubling time is 30years for Laos, 28 years for Ethiopia, 47 years for Turkey,87 years for Thailand, and 175 years for France.
It is also instructive to examine replacement-levelfertility—that is, the number of children a couple mustproduce in order to “replace” themselves. Replacement-level fertility is usually given as 2.1 children. The numberis greater than 2.0 because some infants and children diebefore they reach reproductive age. Worldwide, the totalfertility rate—the average number of children born toeach woman—is currently 2.8, which is well above thereplacement level.
Demographic Stages
Demographers recognize four demographic stages, basedon their observations of Europe as it became industrial-ized and urbanized (Figure 8.15). These stages convertedEurope from relatively high birth and death rates to rela-tively low birth and death rates. Because all highly devel-oped and moderately developed countries with moreadvanced economies have gone through this demo-graphic transition, demographers generally assume thatthe same progression will occur in less developed coun-tries as they become industrialized.
In the first stage, called the preindustrial stage,birth and death rates are high, and population grows at a
modest rate. Although women have many children, theinfant mortality rate is high. Intermittent famines,plagues, and wars also increase the death rate, so the pop-ulation grows slowly or temporarily declines. If we use aEuropean country such as Finland to demonstrate thefour demographic stages, we can say that Finland was inthe first demographic stage from the time of its firsthuman settlements until the late 1700s.
As a result of improved health care and more reliablefood and water supplies that accompany the beginning ofan industrial society, the second demographic stage,called the transitional stage, is characterized by a low-ered death rate. Because the birth rate is still high, thepopulation grows rapidly. Finland in the mid-1800s wasin the second demographic stage.
The third demographic stage, the industrial stage,is characterized by a decline in birth rate and takes placeat some point during the industrialization process. Thedecline in birth rate slows population growth despite arelatively low death rate. For Finland, this occurred inthe early 1900s.
Low birth and death rates characterize the fourthdemographic stage, sometimes called the postindustrialstage. In countries that are heavily industrialized, peopleare better educated and more affluent; they tend to desiresmaller families and take steps to limit family size. Thepopulation grows very slowly or not at all in the fourthdemographic stage. This is the situation in such highlydeveloped countries and groups of countries as theUnited States, Canada, Australia, Japan, and Europe,including Finland.
Why has the population stabilized in more than 30highly developed countries that are in the fourth demo-graphic stage? The reasons are complex. The decline inbirth rate has been associated with an improvement inliving standards. However, it is difficult to say whetherimproved socioeconomic conditions have resulted in a
174 Chapter 8 U N D E R S TA N D I N G P O P U L AT I O N C H A N G E
10
40
80
20
30
Death rate
50
60
70
0
Size of population
Birth rate
STAGE 1Preindustrial
STAGE 2Transitional
STAGE 3Industrial
STAGE 4Postindustrial
Bir
th a
nd d
eath
rat
es(n
umbe
r pe
r 10
00 p
opul
atio
n)
Rel
ativ
e po
pula
tion
size
Time
High
Low
Figure 8.15 Demographic
transition. The demographictransition consists of fourdemographic stages throughwhich a population pro-gresses as its society becomesindustrialized. Note that thedeath rate declines first, fol-lowed by a decline in thebirth rate.
161-182.Raven08 3/1/03 6:48 AM Page 174
decrease in birth rate, or a decrease in birth rate hasresulted in improved socioeconomic conditions. Per-haps both are true. Another reason for the decline inbirth rate in highly developed countries is the increasedavailability of family planning services. Other socioeco-nomic factors that influence birth rate are increasededucation, particularly of women, and urbanization ofsociety. These factors are considered in greater detail inChapter 9.
Once a country reaches the fourth demographicstage, is it correct to assume it will continue to have alow birth rate indefinitely? The answer is that we do notknow. Low birth rates may be a permanent response tothe socioeconomic factors that are a part of an industri-alized, urbanized society. On the other hand, low birthrates may be a response to socioeconomic factors suchas the changing roles of women in highly developed
countries. It could be that unforeseen changes in thesocioeconomic status of women and men in the futuremay again change birth rates. No one knows for sure.
The population in many developing countries isbeginning to approach stabilization. The fertility ratemust decline in order for a population to stabilize; seeTable 8.3 and note the general decline in total fertilityrates in selected developing countries from the 1960s to2002. The total fertility rate in developing countries hasdecreased from an average of 6.1 children per woman in1970 to 3.1 in 2002.
Although the fertility rates in these countries havedeclined, it should be remembered that they still exceedreplacement-level fertility. Consequently, the popula-tions in these countries are still increasing. Also, evenwhen fertility rates equal replacement-level fertility, pop-ulation growth will still continue for some time. Tounderstand why this is so, we now examine the age struc-ture of various countries.
Age Structure of Countries
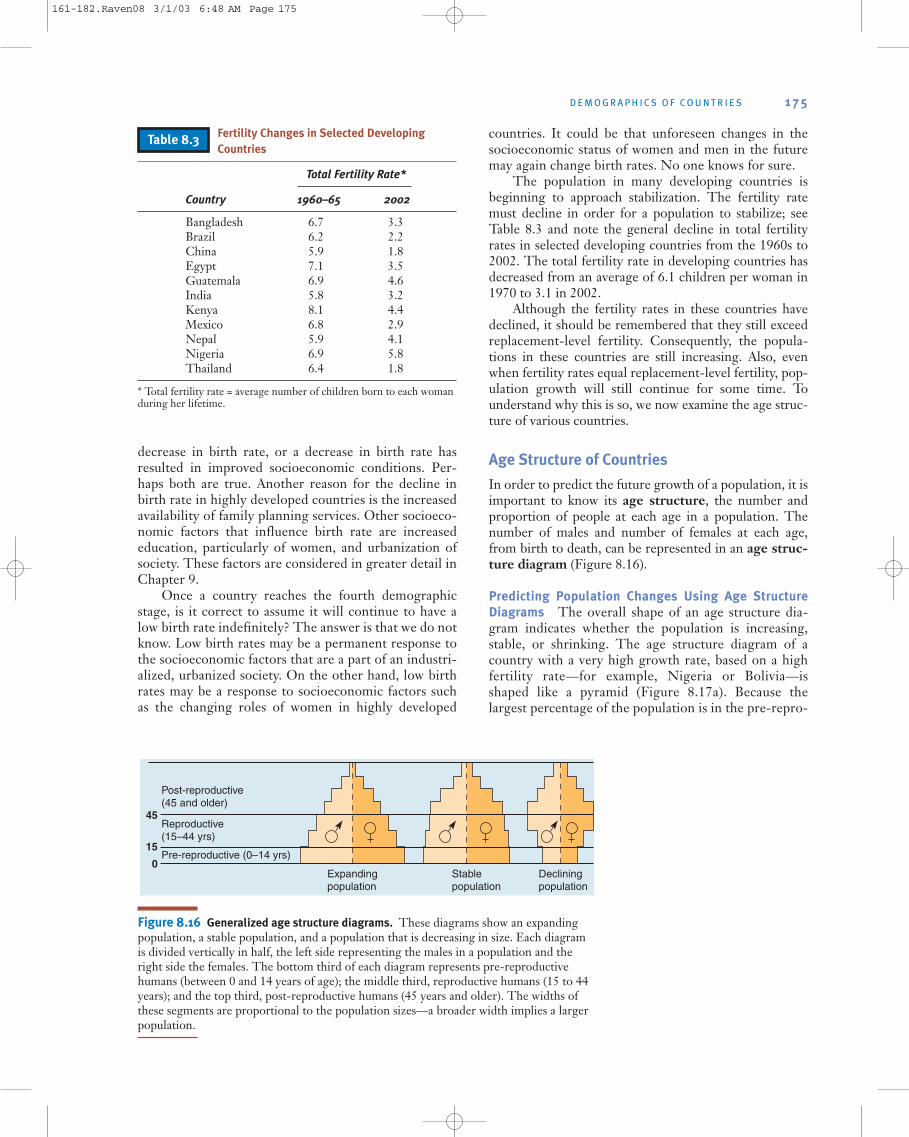
In order to predict the future growth of a population, it isimportant to know its age structure, the number andproportion of people at each age in a population. Thenumber of males and number of females at each age,from birth to death, can be represented in an age struc-ture diagram (Figure 8.16).
Predicting Population Changes Using Age Structure
Diagrams The overall shape of an age structure dia-gram indicates whether the population is increasing,stable, or shrinking. The age structure diagram of acountry with a very high growth rate, based on a highfertility rate—for example, Nigeria or Bolivia—isshaped like a pyramid (Figure 8.17a). Because thelargest percentage of the population is in the pre-repro-
D E M O G R A P H I C S O F C O U N T R I E S 1 7 5
Fertility Changes in Selected Developing
Countries
Total Fertility Rate*
Country 1960–65 2002
Bangladesh 6.7 3.3Brazil 6.2 2.2China 5.9 1.8Egypt 7.1 3.5Guatemala 6.9 4.6India 5.8 3.2Kenya 8.1 4.4Mexico 6.8 2.9Nepal 5.9 4.1Nigeria 6.9 5.8Thailand 6.4 1.8
* Total fertility rate = average number of children born to each womanduring her lifetime.
Table 8.3
Expandingpopulation
Post-reproductive(45 and older)
Reproductive(15–44 yrs)
Pre-reproductive (0–14 yrs)
45
15
0Decliningpopulation
Stablepopulation
Figure 8.16 Generalized age structure diagrams. These diagrams show an expandingpopulation, a stable population, and a population that is decreasing in size. Each diagramis divided vertically in half, the left side representing the males in a population and theright side the females. The bottom third of each diagram represents pre-reproductivehumans (between 0 and 14 years of age); the middle third, reproductive humans (15 to 44years); and the top third, post-reproductive humans (45 years and older). The widths ofthese segments are proportional to the population sizes—a broader width implies a largerpopulation.
161-182.Raven08 3/1/03 6:48 AM Page 175
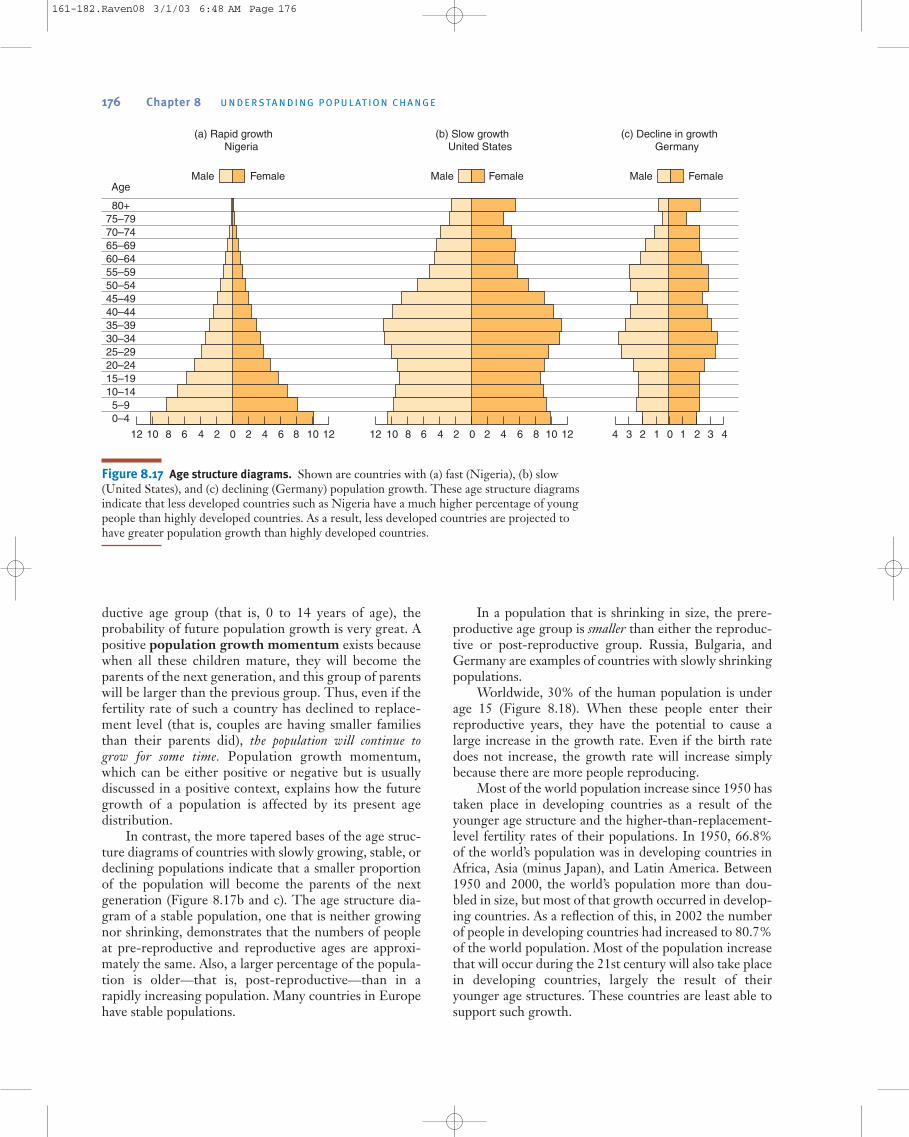
ductive age group (that is, 0 to 14 years of age), theprobability of future population growth is very great. Apositive population growth momentum exists becausewhen all these children mature, they will become theparents of the next generation, and this group of parentswill be larger than the previous group. Thus, even if thefertility rate of such a country has declined to replace-ment level (that is, couples are having smaller familiesthan their parents did), the population will continue togrow for some time. Population growth momentum,which can be either positive or negative but is usuallydiscussed in a positive context, explains how the futuregrowth of a population is affected by its present agedistribution.
In contrast, the more tapered bases of the age struc-ture diagrams of countries with slowly growing, stable, ordeclining populations indicate that a smaller proportionof the population will become the parents of the nextgeneration (Figure 8.17b and c). The age structure dia-gram of a stable population, one that is neither growingnor shrinking, demonstrates that the numbers of peopleat pre-reproductive and reproductive ages are approxi-mately the same. Also, a larger percentage of the popula-tion is older—that is, post-reproductive—than in arapidly increasing population. Many countries in Europehave stable populations.
In a population that is shrinking in size, the prere-productive age group is smaller than either the reproduc-tive or post-reproductive group. Russia, Bulgaria, andGermany are examples of countries with slowly shrinkingpopulations.
Worldwide, 30% of the human population is underage 15 (Figure 8.18). When these people enter theirreproductive years, they have the potential to cause alarge increase in the growth rate. Even if the birth ratedoes not increase, the growth rate will increase simplybecause there are more people reproducing.
Most of the world population increase since 1950 hastaken place in developing countries as a result of theyounger age structure and the higher-than-replacement-level fertility rates of their populations. In 1950, 66.8%of the world’s population was in developing countries inAfrica, Asia (minus Japan), and Latin America. Between1950 and 2000, the world’s population more than dou-bled in size, but most of that growth occurred in develop-ing countries. As a reflection of this, in 2002 the numberof people in developing countries had increased to 80.7%of the world population. Most of the population increasethat will occur during the 21st century will also take placein developing countries, largely the result of theiryounger age structures. These countries are least able tosupport such growth.
176 Chapter 8 U N D E R S TA N D I N G P O P U L AT I O N C H A N G E
12
(a)
Age
80+75–7970–7465–6960–6455–5950–5445–4940–4435–3930–3425–2920–2415–1910–145–90–4
023 42024681012 108642
(c)
Male Female Female Male Female
4 1 1 312 0246810 12108642
(b)
Male
Rapid growthNigeria
Slow growthUnited States
Decline in growthGermany
Figure 8.17 Age structure diagrams. Shown are countries with (a) fast (Nigeria), (b) slow(United States), and (c) declining (Germany) population growth. These age structure diagramsindicate that less developed countries such as Nigeria have a much higher percentage of youngpeople than highly developed countries. As a result, less developed countries are projected tohave greater population growth than highly developed countries.
161-182.Raven08 3/1/03 6:48 AM Page 176

DEMOGRAPHICS OF THE
UNITED STATES
The United States has the largest population of all highlydeveloped countries, and compared to the global popula-tion, U.S citizens have a high level of material well-being. However, a persuasive argument could be madethat the United States is one of the most overpopulatedcountries in the world, because of overconsumption byits individuals (see Chapter 9). Moreover, the populationof the United States continues to grow significantly, inpart because people from developing countries immi-grate to the United States to try for a better life. Popula-tion experts and environmental scientists try to predictwhat the increasing population size and high consump-tion level of the United States will mean to future gener-ations, both in the United States and worldwide. Shouldthe United States have a formal population policy thatstipulates desirable family size and economic prosperity?
Should we—or can we—control immigration? Is it ethi-cal to curtail individual rights of the present generationin order to assure a better future for generations that willfollow us?
Currently, the United States does not have a formalpopulation policy, and the closest it has come to such apolicy occurred under President Nixon’s leadership,when a commission was established to examine U.S. pop-ulation growth. The commission spent 3 years gatheringdata and listening to testimonies from experts and thepublic before concluding in 1972 that the United Stateswould gain no substantial benefits from continued popu-lation growth. The commission therefore recommendedthat the United States should try to stabilize its popula-tion. Despite this recommendation, the U.S. populationhas continued to increase.
The United States has one of the highest rates ofpopulation increase of all the highly developed countries.The U.S. population increased by 19.7 million from 1997to 2002. This translates to a 0.6% annual increase in2002, which is greater than most highly developed coun-tries—for example, Western Europe’s annual increase in2002 was 0.1% and Japan’s was 0.2%. These figures takeonly birth and death rates into account; immigration isnot considered.
Immigration has a greater effect on population sizein the United States than in many other nations. Since1992, the United States has accepted about 1 millionlegal immigrants annually. The number of unauthorizedmigrants who gain access to the United States and arenot deported is not known with any certainty, but this
D E M O G R A P H I C S O F T H E U N I T E D S TAT E S 1 7 7
0
10
20
30
40
50
Per
cent
age
of p
eopl
e un
der
age
15
World Africa LatinAmerica
Asia Oceania NorthAmerica
Europe
Figure 8.18 Percentages of the population under age 15 for
various regions in 2002. The higher this percentage, thegreater the potential for population growth when people inthis group reach their reproductive years.
A Look at U.S. Population
Here are some facts about the changing and complex populationwithin the United States, based on 2000 data (latest available).
� The three states with the greatest number of residents areCalifornia (33.9 million), Texas (20.9 million), and New York (19million).
� The two states with the highest population densities are New Jer-sey (1,134 people per square mile of land area) and Rhode Island(1,003 people per square mile). The two states with the lowestpopulation densities are Alaska (1 person per square mile) andWyoming (5 people per square mile).
� Between 1990 and 2000, Nevada had the highest growth rate(66.3% increase), with Arizona second (40% increase). The Dis-trict of Columbia had the largest population decline (–5.7%).
� In 2000, Utah had the highest percentage of its population belowthe age of 18 (32%) whereas Florida had the highest percentageof its population over age 65 (18%).
� In 2025, the 3 states with the greatest number of residents areprojected to be California (49.3 million), Texas (27.2 million), andFlorida (20.7 million).
E N V I R O B R I E F
161-182.Raven08 3/1/03 6:48 AM Page 177
number is estimated by the International Organizationfor Migration to be about 300,000 per year. The totalpopulation of unauthorized migrants living in the UnitedStates in 2001 was estimated to be 7.8 million. Assumingthat recent immigration levels continue, the U.S. CensusBureau estimates that the U.S. population will reach 404million by 2050.
U.S. Immigration
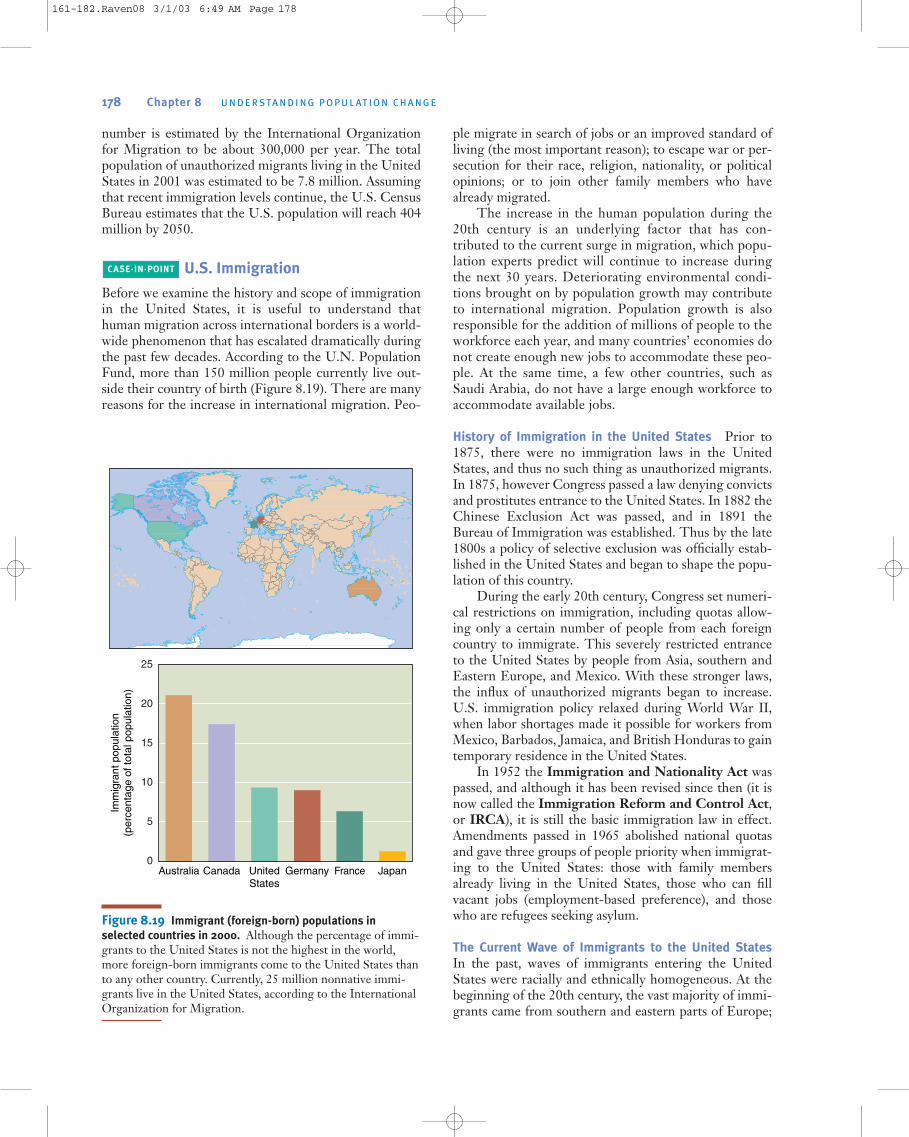
Before we examine the history and scope of immigrationin the United States, it is useful to understand thathuman migration across international borders is a world-wide phenomenon that has escalated dramatically duringthe past few decades. According to the U.N. PopulationFund, more than 150 million people currently live out-side their country of birth (Figure 8.19). There are manyreasons for the increase in international migration. Peo-
ple migrate in search of jobs or an improved standard ofliving (the most important reason); to escape war or per-secution for their race, religion, nationality, or politicalopinions; or to join other family members who havealready migrated.
The increase in the human population during the20th century is an underlying factor that has con-tributed to the current surge in migration, which popu-lation experts predict will continue to increase duringthe next 30 years. Deteriorating environmental condi-tions brought on by population growth may contributeto international migration. Population growth is alsoresponsible for the addition of millions of people to theworkforce each year, and many countries’ economies donot create enough new jobs to accommodate these peo-ple. At the same time, a few other countries, such asSaudi Arabia, do not have a large enough workforce toaccommodate available jobs.
History of Immigration in the United States Prior to1875, there were no immigration laws in the UnitedStates, and thus no such thing as unauthorized migrants.In 1875, however Congress passed a law denying convictsand prostitutes entrance to the United States. In 1882 theChinese Exclusion Act was passed, and in 1891 theBureau of Immigration was established. Thus by the late1800s a policy of selective exclusion was officially estab-lished in the United States and began to shape the popu-lation of this country.
During the early 20th century, Congress set numeri-cal restrictions on immigration, including quotas allow-ing only a certain number of people from each foreigncountry to immigrate. This severely restricted entranceto the United States by people from Asia, southern andEastern Europe, and Mexico. With these stronger laws,the influx of unauthorized migrants began to increase.U.S. immigration policy relaxed during World War II,when labor shortages made it possible for workers fromMexico, Barbados, Jamaica, and British Honduras to gaintemporary residence in the United States.
In 1952 the Immigration and Nationality Act waspassed, and although it has been revised since then (it isnow called the Immigration Reform and Control Act,or IRCA), it is still the basic immigration law in effect.Amendments passed in 1965 abolished national quotasand gave three groups of people priority when immigrat-ing to the United States: those with family membersalready living in the United States, those who can fillvacant jobs (employment-based preference), and thosewho are refugees seeking asylum.
The Current Wave of Immigrants to the United States
In the past, waves of immigrants entering the UnitedStates were racially and ethnically homogeneous. At thebeginning of the 20th century, the vast majority of immi-grants came from southern and eastern parts of Europe;
CASE·IN·POINT
178 Chapter 8 U N D E R S TA N D I N G P O P U L AT I O N C H A N G E
Australia Canada UnitedStates
Germany France Japan0
5
10
15
20
25
Imm
igra
nt p
opul
atio
n(p
erce
ntag
e of
tota
l pop
ulat
ion)
Figure 8.19 Immigrant (foreign-born) populations in
selected countries in 2000. Although the percentage of immi-grants to the United States is not the highest in the world,more foreign-born immigrants come to the United States thanto any other country. Currently, 25 million nonnative immi-grants live in the United States, according to the InternationalOrganization for Migration.
161-182.Raven08 3/1/03 6:49 AM Page 178
most were young and poor, often barely able to affordtravel fares. In contrast, typical immigrants to the UnitedStates today are a more diverse group. Four of every fivelegal immigrants come from either Asia or Latin Amer-
ica. The top five countries from which legal U.S. immi-grants migrate are Mexico, the Philippines, Vietnam, theDominican Republic, and China. About 70% of thesenew arrivals are poor and have few skills but the remain-der are college graduates and may practice their profes-sions, such as medicine, engineering, and computerscience, in the United States. More than 4% of legalimmigrants are senior citizens, many of whom live withtheir adult children.
Immigration as a Controversial Environmental Issue
U.S. environmental groups have not reached a consen-sus on immigration. Some environmentalists think thepopulation of the United States is already too large.According to this viewpoint, the presence of legal immi-grants and unauthorized migrants is undesirablebecause it contributes greatly to pollution and resourcedepletion as these people adopt the affluent, high-con-sumption lifestyle of “typical” U.S. citizens. Thesegroups argue that the United States must reduce bothbirth rates and immigration rates to bring about sus-tainability.
Other environmentalists point out that the UnitedStates is not the only country to take in immigrants.They argue that it is morally unacceptable to deny peoplea chance for a better life in the United States. TheUnited States can absorb the environmental conse-quences of immigrants, who often have simpler lifestylesthan most U.S. citizens (at least for the first generation),more easily than their home countries can. Because cen-sus figures indicate that immigrants tend to have smallerfamilies than if they had stayed in their countries of ori-gin, immigration helps to reduce the rate of global popu-lation growth. Further, immigrants provide U.S.environmental groups with a much-needed global con-sciousness, a “we’re in this together” viewpoint that iseasy to overlook when simply considering U.S. environ-mental issues.
S U M M A R Y W I T H S E L E C T E D K E Y T E R M S 1 7 9
Diverting the Flood of Refugees
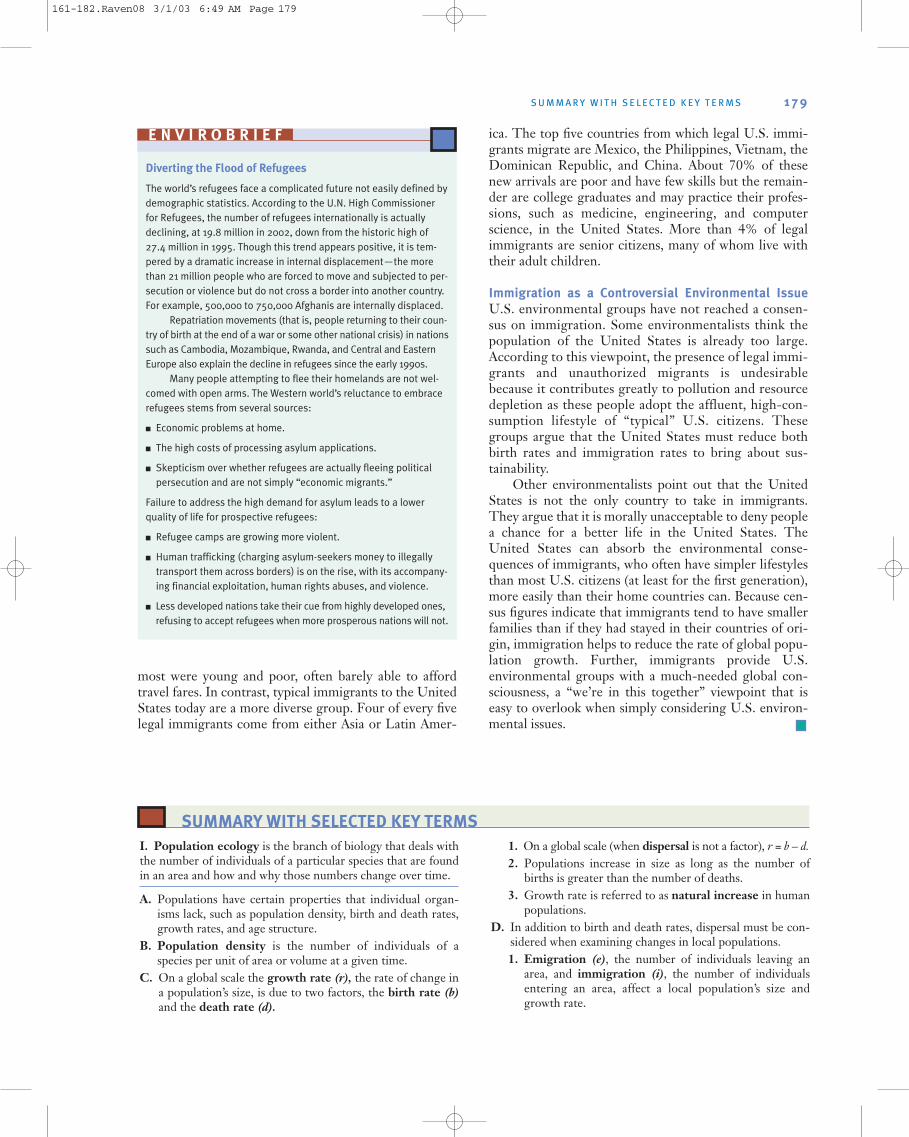
The world’s refugees face a complicated future not easily defined bydemographic statistics. According to the U.N. High Commissionerfor Refugees, the number of refugees internationally is actuallydeclining, at 19.8 million in 2002, down from the historic high of27.4 million in 1995. Though this trend appears positive, it is tem-pered by a dramatic increase in internal displacement—the morethan 21 million people who are forced to move and subjected to per-secution or violence but do not cross a border into another country.For example, 500,000 to 750,000 Afghanis are internally displaced.
Repatriation movements (that is, people returning to their coun-try of birth at the end of a war or some other national crisis) in nationssuch as Cambodia, Mozambique, Rwanda, and Central and EasternEurope also explain the decline in refugees since the early 1990s.
Many people attempting to flee their homelands are not wel-comed with open arms. The Western world’s reluctance to embracerefugees stems from several sources:
� Economic problems at home.
� The high costs of processing asylum applications.
� Skepticism over whether refugees are actually fleeing politicalpersecution and are not simply “economic migrants.”
Failure to address the high demand for asylum leads to a lowerquality of life for prospective refugees:
� Refugee camps are growing more violent.
� Human trafficking (charging asylum-seekers money to illegallytransport them across borders) is on the rise, with its accompany-ing financial exploitation, human rights abuses, and violence.
� Less developed nations take their cue from highly developed ones,refusing to accept refugees when more prosperous nations will not.
E N V I R O B R I E F
SUMMARY WITH SELECTED KEY TERMS
I. Population ecology is the branch of biology that deals withthe number of individuals of a particular species that are foundin an area and how and why those numbers change over time.
A. Populations have certain properties that individual organ-isms lack, such as population density, birth and death rates,growth rates, and age structure.
B. Population density is the number of individuals of aspecies per unit of area or volume at a given time.
C. On a global scale the growth rate (r), the rate of change ina population’s size, is due to two factors, the birth rate (b)
and the death rate (d).
1. On a global scale (when dispersal is not a factor), r = b – d.2. Populations increase in size as long as the number of
births is greater than the number of deaths.3. Growth rate is referred to as natural increase in human
populations.D. In addition to birth and death rates, dispersal must be con-
sidered when examining changes in local populations.1. Emigration (e), the number of individuals leaving an
area, and immigration (i), the number of individualsentering an area, affect a local population’s size andgrowth rate.
161-182.Raven08 3/1/03 6:49 AM Page 179
2. For a local population (where dispersal is a factor), r = (b – d) + (i – e).
II. Biotic potential, or intrinsic rate of increase, is the max-imum rate at which a species or population could increaseunder ideal conditions.
A. Although populations with a constant reproductive rateexhibit exponential population growth for limited periodsof time (the J curve), eventually the growth rate decreases toaround zero or becomes negative.
B. Population size is modified by limits set by the environ-ment, which are collectively called environmental resist-ance. Environmental resistance includes the limitedavailability of food, water, shelter, and other resources, aswell as limits imposed by disease and predation.
C. The carrying capacity (K) of the environment is thelargest population that can be maintained for an indefinitetime by a particular environment.
D. The S curve shows an initial lag phase (when the populationis small), followed by an exponential phase, followed by aleveling phase as the carrying capacity of the environment isreached. The S curve is an oversimplification of how mostpopulations change over time.
III. Each species has its own life history strategy.
A. An r strategy emphasizes a high growth rate. These organ-isms often have small body sizes, high reproductive rates,and short life spans, and they typically inhabit variable envi-ronments.
B. A K strategy results in maintenance of a population near thecarrying capacity of the environment. These organismsoften have large body sizes, low reproductive rates, and longlife spans, and they typically inhabit stable environments.
C. Many species possess a combination of r-selected and K-selected traits, as well as traits that are characteristic of nei-ther r selection nor K selection.
D. There are three general types of survivorship curves.1. In type I survivorship, death is greatest in old age.2. In type III survivorship, death is greatest among the
young.3. In type II survivorship, death is spread evenly across all
age groups.
IV. Environmental factors limit population growth.
A. Density-dependent factors regulate population growth byaffecting a larger proportion of the population as population
density rises. Predation, disease, and competition are exam-ples.
B. Density-independent factors limit population growth butare not influenced by changes in population density. Hurri-canes and fires are examples.
C. Cyclic population oscillations are poorly understood butmay involve density-dependent factors. Examples of ani-mals with such boom-or-bust cycles include lemmings,snowshoe hares, and red grouse.
V. The principles of population ecology apply to humans.
A. The world population was 6.2 billion in 2002 and increasedby 78 million from 2001 to 2002.1. Although our numbers continue to increase, the growth
rate (r) has declined slightly over the past several years,from a peak in the mid-1960s of 2.2% per year to 1.3%per year in 2002.
2. Demographers, scientists who study population statis-tics, project that the world population will become sta-tionary (r = 0)—that is, zero population growth—bythe end of the 21st century.
B. Highly developed countries have the lowest birth rates,lowest infant mortality rates, longest life expectancies, andhighest per-capita GNI PPPs. Developing countries havethe highest birth rates, highest infant mortality rates, short-est life expectancies, and lowest per-capita GNI PPPs.
C. The age structure of a population greatly influences popu-lation dynamics.1. It is possible for a country to have replacement-level
fertility and still experience population growth if thelargest percentage of the population is in the pre-repro-ductive years.
2. Such an age structure causes a positive populationgrowth momentum.
D. The United States has one of the highest rates of popula-tion increase (0.6% in 2002) of all the highly developedcountries.1. Immigration has a greater effect on population size in
the United States than in many other countries.2. The Immigration Reform and Control Act (IRCA),
the basic immigration law in effect in the United States,gives three groups of people priority when migrating tothe United States: those with family members living inthe United States, those who can fill vacant jobs, andthose who are refugees seeking asylum.
180 Chapter 8 U N D E R S TA N D I N G P O P U L AT I O N C H A N G E
THINKING ABOUT THE ENVIRONMENT
1. What are some of the factors that have contributed to thehuge increase in the incidence of AIDS in sub-SaharanAfrica?
2. Describe the effect of each of the following on populationsize: birth rate, death rate, immigration, and emigration.
3. Explain how biotic potential and/or carrying capacity pro-duce the J-shaped and S-shaped population growth curves.
4. Draw a graph to represent the long-term growth of a pop-ulation of bacteria cultured in a test tube containing anutrient medium that is not replenished.
161-182.Raven08 3/1/03 6:49 AM Page 180
5. Give three examples each of density-dependent and den-sity-independent factors that affect population growth.
6. Explain how the spread of human diseases such as theBlack Death, tuberculosis, and AIDS is related to highpopulation densities found in urban environments. Aresuch diseases density-dependent or density-independent?
7. What is a boom-or-bust population cycle? Describe den-sity-dependent factors that may influence such cyclic pop-ulation oscillations.
8. Draw the three main survivorship curves and relate themto r selection and K selection in animals.
9. Describe human population growth for the past 200 years.10. Who was Thomas Malthus, and what were his views on
human population growth?11. When determining Earth’s carrying capacity for humans,
why is it not enough to just consider human numbers?What else must be considered?
12. What is infant mortality rate? How does it affect lifeexpectancy?
13. Distinguish between the total fertility rate and replace-ment-level fertility.
14. If all the women in the world suddenly started bearingchildren at replacement-level fertility rates, would thepopulation stop increasing immediately? Why or whynot?
15. Use the Population Reference Bureau’s World PopulationData Sheet, a poster located inside the back cover of thistext, to obtain what percentage of the population isyounger than 15 and what percentage is older than 65 fortwo countries, Bolivia and Austria. On the basis of thisinformation, which of these countries will have the high-est population growth momentum over the next twodecades? Why?
16. Should the rapid increase in world population be of con-cern to the average citizen in the United States? Why orwhy not?
17. Should the United States increase or decrease the numberof legal immigrants? Present arguments in favor of bothsides.
*18. If a population of 100,000 has 2,700 births per year and900 deaths per year, what is its growth rate in percent peryear?
*19. Use the Population Reference Bureau’s World PopulationData Sheet inside the back cover of this text to obtain thepopulation and growth rate (natural increase, annual per-centage) of India. Assuming that the growth rate remainsconstant, what will India’s population be in 2005? In whatyear will India’s population be double that of its 2002 pop-ulation?
* Solutions to questions preceded by asterisks appear in Appendix VII.
W O R L D P O P U L AT I O N D ATA S H E E T A S S I G N M E N T 1 8 1
WORLD POPULATION DATA SHEET ASSIGNMENT
Use the Population Reference Bureau’s World Population DataSheet from inside the back cover to answer the following ques-tions.
1. What is the estimated world population in billions?2. What is the current birth rate for the world?3. Which continent has the highest birth rate, and what is it?4. Which country or countries has/have the highest birth
rate, and what is it?5. Which continent has the lowest birth rate, and what is it?6. Which country or countries has/have the lowest birth rate,
and what is it?7. What is the current death rate for the world?8. Which country or countries has/have the highest death
rate, and what is it?9. How is natural increase (annual, %) calculated?
10. Which country or countries does not/do not have a posi-tive natural increase (i.e., are either stable or decreasing inpopulation)?
11. What is an infant mortality rate?12. Which country or countries has/have the world’s highest
infant mortality rate, and what is it?
13. Which country or countries has/have the world’s lowestinfant mortality rate, and what is it?
14. What is a total fertility rate?15. Which country or countries has/have the world’s highest
total fertility rate, and what is it?16. Which country or countries has/have the world’s lowest
total fertility rate, and what is it?17. Which country or countries has/have the highest percent-
age of the population under age 15, and what is it?18. Which country or countries has/have the highest percent-
age of the population over age 65, and what is it?19. Which country or countries has/have the longest life
expectancy, and what is it?20. Which country or countries has/have the shortest life
expectancy, and what is it?21. Which country or countries has/have the highest percent-
age of the population living in urban areas, and what is thepercentage?
22. Which country or countries has/have the highest per-capita GNI PPP, and what is it?
23. Which country or countries has/have the lowest per-capitaGNI PPP, and what is it?
161-182.Raven08 3/1/03 6:49 AM Page 181
Visit our Web site at http://www.wiley.com/college/raven
(select Chapter 8 from the Table of Contents) for links to moreinformation about the controversies surrounding U.S. immi-gration policies. Consider the opposing views of supporters andopponents to current immigration policies, and debate theissues with your classmates. You will find tools to help youorganize your research, analyze the data, think critically aboutthe issues, and construct a well-considered argument. Take a
Stand activities can be done individually or as part of a team, asoral presentations, written exercises, or Web-based (e-mail)assignments.
Additional on-line materials relating to this chapter, includingStudent Quizzes, Activity Links, Useful Web Sites, FlashCards, and more, can also be found on our Web site.
182 Chapter 8 U N D E R S TA N D I N G P O P U L AT I O N C H A N G E
TAKE A STAND
SUGGESTED READINGBongaarts, J. “Demographic Consequences of Declining Fer-
tility.” Science, Vol. 282 (October 16, 1998). A nice overviewof trends in fertility rates in different regions of the world.
Brown, L., and B. Halweil. “Breaking Out or BreakingDown.” WorldWatch, Vol. 12 (September–October 1999).The upward trend in life expectancy has reversed in certainof the world’s poorer countries.
Doyle, R. “Assembling the Future.” Scientific American, Vol.286, No. 2 (February 2002). International migrants are nowthe major contributor to demographic change in manycountries, including the United States.
Ezzell, C. “Care for a Dying Continent.” Scientific American,Vol. 282, No. 5 (May 2000). Documents the extent of theAIDS crisis in Zimbabwe.
Ferguson, A.R.B. “Perceiving the Population Bomb.” WorldWatch, Vol. 14, No. 4 (July–August 2001). The hard factsabout human fertility and population growth are considered.
Knodel, J. “Deconstructing Population Momentum.” Popula-tion Today, Vol. 27 (March 1999). An explanation of howpopulation momentum affects the dynamics of populationgrowth.
Martin, P., and E. Midgley. “Immigration to the UnitedStates.” Population Bulletin, Vol. 54 (June 1999). Examinescurrent U.S. immigration policies and patterns.
Perkins, S. “And Counting…” Science News, Vol. 161 (February23, 2002). The 2000 U.S. census is the most accurate one todate.
Tuljapurkar, S. “Taking the Measure of Uncertainty.” Nature,Vol. 387 (June 19, 1997). A discussion of the strengths andshortcomings of the methods used by demographers to fore-cast populations.
Wattenberg, B.J. “‘Overpopulation’ Turns Out to Be Over-hyped.” Wall Street Journal (March 4, 2002). This authorpresents a view about human population that is quite differ-ent from that of most population experts.
Wilson, E.O. “The Bottleneck.” Scientific American, Vol. 286,No. 2 (February 2002). This excerpt from Wilson’s recentlypublished book, The Future of Life, is thought-provoking andinformative.
2002 World Population Data Sheet. Washington, D.C.: Popu-lation Reference Bureau, 2002. A chart published annuallythat provides current population data for all countries: birthrates, death rates, infant mortality rates, total fertility rates,and life expectancies, as well as other pertinent information.See the poster located inside the back cover of this text.
161-182.Raven08 3/1/03 6:49 AM Page 182