understanding risk tolerance and building an effective
TRANSCRIPT

Understanding Risk Tolerance and
Building an Effective Safety Culture
David Loyd
NASA Johnson Space Center
Safety & Mission Assurance
May 9, 2018
NASA Johnson Space Center
HOUSTON, TEXAS

NASA Risk and Safety Culture
• Understanding Risk Tolerance– Working with Imperfect Humans
– Learning How to Identify “Smart Risks”
– Risk Management Processes
• NASA’s Safety Culture – Reducing Error by Cultivating Skill-Based Behavior
– Bolstering Trust Throughout Operations
– Looking at Catastrophic Events Through the Safety Culture Lens
– Comparing Safety Culture Objectives
• Exercise – Risk Mitigation Planning
2March 12, 2018 David T. Loyd

3
“It can only be attributable to human error.“-- HAL 9000 (2001: A Space Odyssey)
Words of Wisdom
November 8, 2016 David T. Loyd
What is the impact of Human Factors?
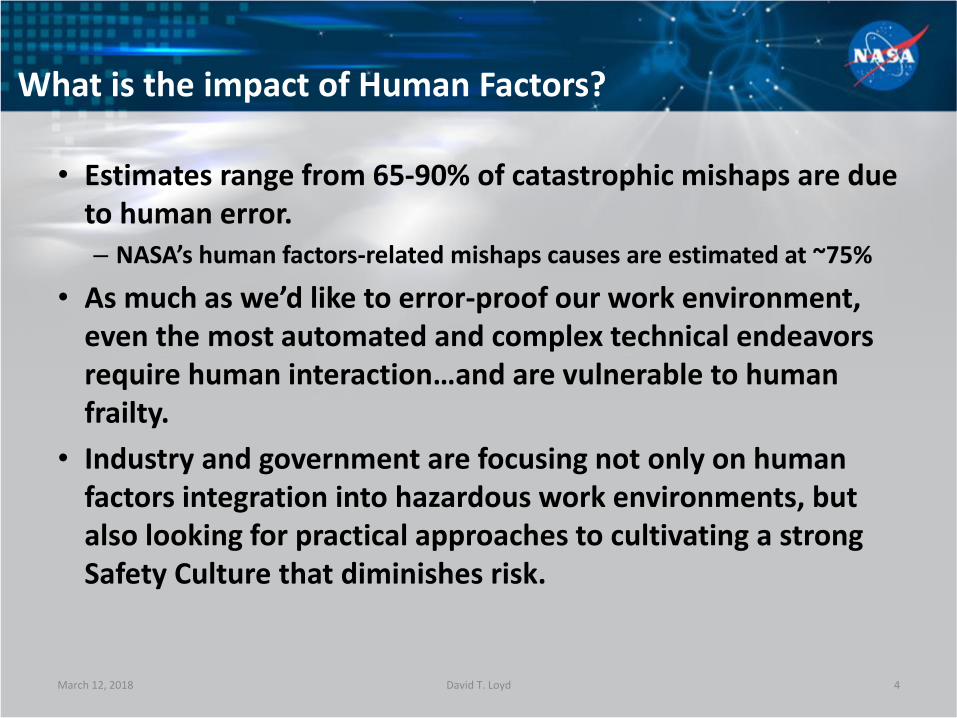
• Estimates range from 65-90% of catastrophic mishaps are due to human error.– NASA’s human factors-related mishaps causes are estimated at ~75%
• As much as we’d like to error-proof our work environment, even the most automated and complex technical endeavors require human interaction…and are vulnerable to human frailty.
• Industry and government are focusing not only on human factors integration into hazardous work environments, but also looking for practical approaches to cultivating a strong Safety Culture that diminishes risk.
4March 12, 2018 David T. Loyd

Some Risk Management Philosophy…
As much as we’d like to be able to predict error, the reality is that we must measure known performance characteristics to identify vulnerabilities, mitigate greatest risk, and enable prudent response to the next accident.
March 12, 2018 |5David T. Loyd

High Risk Occupations vs. Space Flight
Shuttle Astronaut
Northeast Multispecies Groundfish Fishing
Alaskan Commercial Fishing
Commercial Fishing
Extraction –Mining, Oil and Gas
Construction Worker
Alaskan Commuter Pilot
Airline Pilot
Timber Cutting and Logging
Truck Driver
0 1:100 1:50 1:33Probability
1:218
1:166
1:775
1:851
1:4420
1:4190
1:336
1:1270
1:998
1:3790
Person-Fatality Risk Per Year
Risk increases as “drill down” into smaller and smaller groups that drive the risk.
Shuttle Astronaut risk is a very small group that has high risk.
Miner risk does not include fatalities due to chronic illnesses like “black lung.”
March 12, 2018 6
1:70Mt. Everest Climber
David T. Loyd

Risk Tolerance & Failing Smart
NASA is known for Gene Kranz’sfamous quote,
“Failure is not an option.”
It is not an option anyone chooses, but it is a reality we must confront.
March 12, 2018 |7
How to identify a smart risk….• Can we afford the consequence of failure? • Can we learn from the mistake? • Can we get back up and try again? • Do we own the risk in the first place?
David T. Loyd

JSC RISK MATRIX
51 2 3 4
1
2
5
4
3
Consequences
L
I
K
E
L
I
H
O
O
D
High – Mitigate; implement new
processes, change requirements,
or re-baseline
Moderate – Manage/consider
alternative processes, or Accept
Low – Manage within normal
processes; or Close
SEVERITY
5
LIKELIHOOD RATING
4
3
2
1
Very
Likely
Likely
Unlikely
Possible
Highly
Unlikely
Expected to happen. Controls have minimal to no effect.
Likely to happen. Controls have significant limitations or
uncertainties.
Could happen. Controls exist, with some limitations or
uncertainties.
Not expected to happen. Controls have minor limitations
or uncertainties.
Extremely remote possibility that it will happen. Strong
controls in place.
L
I
K
E
L
I
H
O
O
D
CONSEQUENCE Subcategories 1 2 3 4 5
PersonnelMinor injury;
Minor OSHA violation
Short-term injury; Moderate
OSHA violation
Long-term injury, impairment
or incapacitation;
Signif icant OSHA violation
Permanent injury or
incapacitation;
Major OSHA violation
Loss of life
System, Facility Minor damage to assetModerate impact or
degraded performanceLoss of non-critical asset Damage to a critical asset
Loss of critical asset or
emergency evacuation
EnvironmentMinor or non-reportable
hazard or incident
Moderate hazard or
reportable violation
Signif icant violation; Event
requires immediate
remediation
Major violation; Event causes
temporary w ork stoppageCatastrophic hazard
TECHNICAL Performance
Minor impact to mission
objectives or
requirements
Incomplete compliance w ith
a key mission objective
Noncompliance; Signif icant
impact to mission
Noncompliance; Major impact
on Center or Spaceflight
mission
Failure to meet mission
objectives
InfrastructureMinor impact or reduced
effectiveness
Moderate impact or damage
to infrastructure
Signif icant damage to
infrastructure or reduced
support
Mission delays or major
impacts to Center operations
Extended loss of critical
capabilities
WorkforceMinor impact to human
capital
Moderate impact to human
capital
Signif icant impact; Loss of
critical skillMajor impact; Loss of skill set Loss of Core Competency
COSTOrganizational or
CMO Impact
<2% Budget increase or
<$1M CMO Threat
2-5% Budget increase or
$1M-$5M CMO Threat
5-10% Budget increase or
$5M-10M CMO Threat
10-15% Budget increase or
$10M-$60M CMO Threat
>15% Budget increase or
>$60M CMO Threat;
SCHEDULE -- Minor milestone slipModerate milestone slip;
Schedule margin available
Project milestone slip; No
impact to a critical path
Major milestone slip; Impact to
a critical path
Failure to meet critical
milestones
HSE
(Health, Safety,
Environment)
CENTER
CAPABILITIES
NASA’s Risk Scorecard

5
4
3
2
1
1 2 3 4 5
CONSEQUENCE
2
2 22
1 1
Institutional Risk Management
L
I
K
E
L
I
H
O
O
D
L x CTitle
(Notional Risk Titiles)Org
L
I
K
E
L
I
H
D
Consequence
C
e
n
C
a
p
S
C
H
E
D
C
O
S
T
H
S
E
T
E
C
H
3 x 4 p Test system maintenance ## 3 2 2 4 4 2
4 x 5 p Mission essential resource limitations ## 4 4 5 2 1 4
4 x 3 p Equipment End-of-Life ## 4 3 1 1 3
4 x 3 p Building Refurbishments ## 4 3 3 1 1 2
5 x 5 p Comm Systems End-of-Life ## 5 5 4 3 5 5
4 x 4 p Building Maintenance Shortfall ## 4 3 3 4 2 2
3 x 4 p Asbestos abatement ## 3 2 3 2 4 3
4 x 4 p Core Capability Threat ## 4 4 3 1 4
4 x 4 p Water System-Repairs/Upgrades ## 4 4 4 4 2 3
5 x 4 r Research equipment failure threat ## 5 4 4 4Legend
p Top Center Risk (TCR)
r Proposed Top Center Risk (Proposed TCR)
March 12, 2018 9
• Risk management forums are active for individual programs and the institution, but risk assessment criteria is consistent.
• Though program and institutional operating budgets are separate, risks are cross-communicated to identify potential impacts.
David T. Loyd

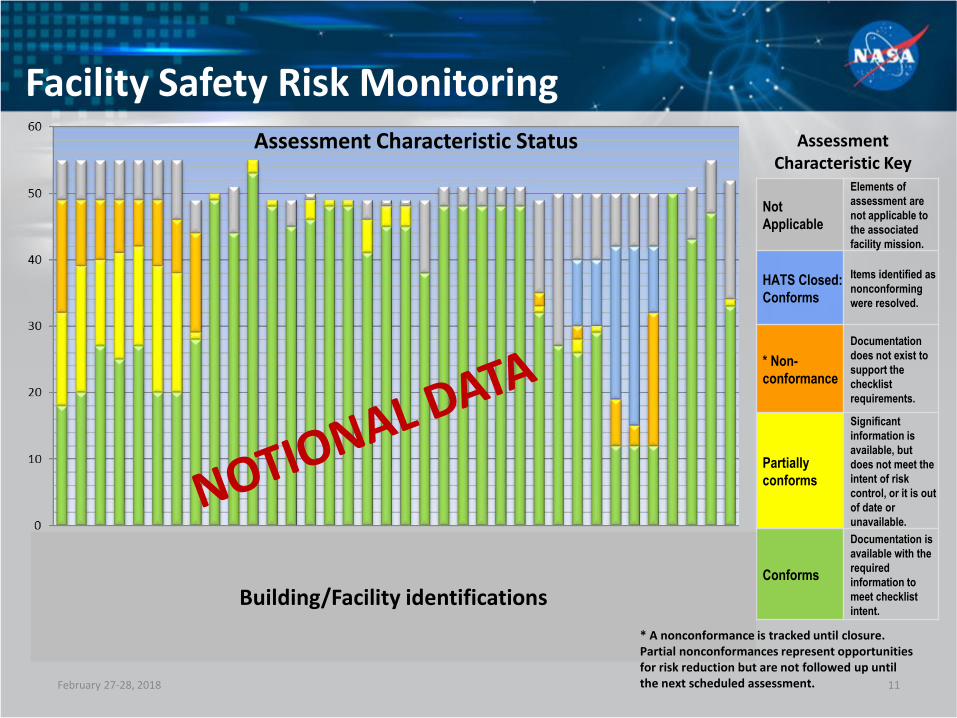
Process Measures for High-Risk Facilities• Industry and government organizations have recognized the value of monitoring leading indicators
to identify potential risk vulnerabilities.
• NASA has adapted this approach to assess risk controls associated with hazardous, critical, and complex facilities.
• NASA’s facility risk assessments integrate commercial loss control, OSHA Process Safety, API Performance Indicator Standard, and NASA Operational Readiness Inspection concepts to identify risk control vulnerabilities.
February 27-28, 2018 10
Examples of leading measure areas for high-risk facilities include:
Maintenance and system integrity conditions;
Operational qualifications; Challenges to safety systems
and monitoring equipment; Communication and reporting
system conditions; Accuracy of configuration
management; Maintenance of operational
procedures and emergency response plans.
February 27-28, 2018 11
Not
Applicable
Elements of
assessment are
not applicable to
the associated
facility mission.
HATS Closed:
Conforms
Items identified as
nonconforming
were resolved.
* Non-
conformance
Documentation
does not exist to
support the
checklist
requirements.
Partially
conforms
Significant
information is
available, but
does not meet the
intent of risk
control, or it is out
of date or
unavailable.
Conforms
Documentation is
available with the
required
information to
meet checklist
intent.
EllingtonField
MissionOperations
Engineering CODIRD
Assessment Characteristic Key
SA KAOA
NS
Building/Facility identifications
Facility Safety Risk MonitoringAssessment Characteristic Status
* A nonconformance is tracked until closure. Partial nonconformances represent opportunities for risk reduction but are not followed up until the next scheduled assessment.

Minimizing Human Error and Cultivating a Reduced Risk Environment
Rasmussen’s 3 Human Responses to Operator Information Processing
1. Skill-based: requires little or no cognitive effort.
2. Rule-based: driven by procedures or rules.
3. Knowledge-based: requires problem solving/decision making.
November 8, 2016 David T. Loyd |12
“The fewer rules a coach has, the fewer rules there are for players to break.”
John Madden
“Successful design is not the achievement of perfection but the minimization and accommodation of imperfection.”
Henry Petroski

TR
US
T L
EV
EL
an
d C
LA
RIT
Y
ISSUE RESOLUTION FORUMS
CL
OS
E C
AL
L
NO
NC
ON
FO
RM
AN
CE
Trust is what drives open reporting and dialog to assure the most information is available to inform successful decision-making.
13
Trust is the foundation of an effective Safety Culture
November 8, 2016 David T. Loyd

How Safety Culture Promotes Operational Excellence
• By advocating a pervasive Safety Culture, we can provide our workforce with:
– Clear emphasis on continuous learning.
– Encouragement to develop intuitive personal values.
– Guidelines for decision-making behavior that focuses on long-term success.
– Reinforcement to build trust by reporting and communicating concerns and ideas.
• Practicing an effective Safety Culture:
– Builds Skill-based and Knowledge-based response mechanisms,
– Reduces dependence on Rule-based response,
– And breaks down barriers to Trust.
November 8, 2016 David T. Loyd |14

The NASA Safety Culture
• Space-related tragedies have marked our safety culture evolution.
• It’s not possible to perpetuate a safety culture in space without taking care of each other on the ground and at home.
“I believe that this nation should commit itself to achieving the goal, before this decade is out, of landing a man on the moon and returning him safely to the earth.”
– John F. Kennedy address to Congress, May 25, 1962
David T. Loyd
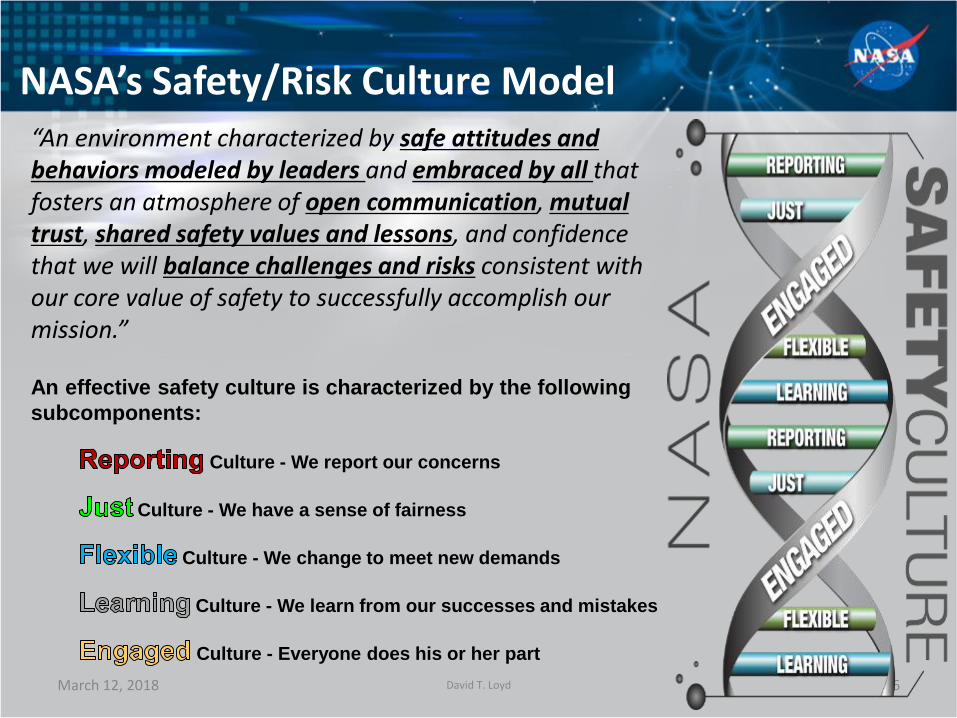
NASA’s Safety/Risk Culture Model
16
“An environment characterized by safe attitudes and behaviors modeled by leaders and embraced by all that fosters an atmosphere of open communication, mutual trust, shared safety values and lessons, and confidence that we will balance challenges and risks consistent with our core value of safety to successfully accomplish our mission.”
An effective safety culture is characterized by the following
subcomponents:
Culture - We report our concerns
Culture - We have a sense of fairness
Culture - We change to meet new demands
Culture - We learn from our successes and mistakes
Culture - Everyone does his or her part
March 12, 2018 David T. Loyd

Using the Safety Culture Model to Analyze NASA’s History
Reporting – With both tragedies, launch process deficiencies, such as O-ring susceptibility in cold temperatures (Challenger) and foam shedding (Columbia), were passively reported problems, yet were not considered serious hazards.
Just – Some engineers were reluctant to raise concerns when faced with a return of an “in God we trust - all others bring data” attitude.
Flexible – With both incidents, the Shuttle Program was experiencing schedule pressure challenges.
Learning – With “normalization of deviance,” O-ring burn-through and foam impact had become classified as “in-family” and as a negligible risk.
Engaged – NASA management lacked involvement in critical discussions. March 12, 2018
Columbia – February 1, 2003Challenger – January 28, 1986
17David T. Loyd

Deepwater Horizon – April 20, 2010Reporting – Procedures were subjected to last-minute
distribution, last minute decision.
Just – Concerns of rig workers regarding test results were muted, not heeded or explored .
Flexible – All involved seemed prepared to exercise flexibility, but this may be indicative of insufficient process discipline.
Learning – Invalid confidence in new slurry, vents from Mud-Gas Separator (MGS) allowed gas to enter rig spaces, insufficient planning for contingencies.
Engaged – Incorrect reading of pressure tests, lack of recognition or timely control action related to kicks, diverted flow through MGS instead of overboard, reluctance to activate Blow-Out Preventer (BOP), reluctance to activate the Emergency Disconnect System, BOP testing and maintenance.
20 April 2018 David T. Loyd |18
NASA Safety Culture Model Applied to Deepwater Horizon

20 April 2018 David T. Loyd |19
Safety Culture – Comparing Oil & Gas with NASA
NASA’s Safety Culture BSEE’s Nine Characteristics of a Strong Safety Culture
Reporting Culture – We report our concerns.
Hazard identification and risk management
Effective Safety and Environmental Communication
Environment for raising concerns
Just Culture – We have a sense of fairness. Respectful work environment
Flexible Culture – We change to meet new demands.
Work processes
Learning Culture – We learn from our successes and mistakes.
Continuous improvement
Inquiring attitude
Engaged Culture – Everyone does his or her part.
Personal accountability
Leadership commitment to safety values and actions
• In 2013, the Bureau of Safety and Environmental Enforcement (BSEE) released policy on Safety Culture emphasized for adoption across the Oil and Gas industry.
• The “Nine Characteristics of a Strong Safety Culture” are closely aligned with Safety Culture attributes adopted by NASA.

Bureau of Safety and Environmental Enforcement (BSEE) Nine Characteristics of a Strong Safety Culture
1. Leadership commitment to safety values and actions: leaders demonstrate a commitment to
safety and environmental stewardship in their decisions and behaviors. leaders visibly demonstrate this commitment through how they allocate resources within the organization and prioritize safety relative to production
2. Respectful work environment: trust and respect permeate the organization, with a focus on teamwork
and collaboration
3. Environment for raising concerns: a work environment is maintained in which personnel feel free to
raise safety and environmental concerns without fear of retaliation, intimidation, harassment, or discrimination
4. Effective safety and environmental communication: communications maintain a focus on safety
and environmental stewardship; knowledge and experience are shared throughout the organization.
5. Personal accountability: all individuals take personal responsibility for process and personal safety, as well
as environmental stewardship
6. Inquiring attitude: individuals avoid complacency and continuously consider and review existing conditions
and activities in order to identify discrepancies that might result in error or inappropriate action; workers are expected to question work practices as part of everyday conversations without hesitation
7. Hazard identification and risk management: issues potentially impacting safety and environmental
stewardship are promptly identified, fully evaluated, and promptly addressed or corrected commensurate with their significance
8. Work processes: the process of planning and controlling work activities is implemented in a manner that
maintains safety and environmental stewardship while ensuring use of the correct equipment, used in the correct way, for the correct work
9. Continuous improvement: opportunities to learn about ways to ensure safety and environmental
stewardship are sought out and implemented |20

Reducing Risk Vulnerabilities
• NASA, like the other hazardous industries, has suffered very catastrophic losses.
• Human error will likely never be completely eliminated as a factor in our failures.
• Acknowledging human frailty and the potential for failure bolsters our ability to manage risks and mitigate the worst consequences.
• Building an effective Safety Culture bolsters skill-based performance that minimizes risk and encourages operational excellence.
March 12, 2018 |21David T. Loyd

Exercise – Risk Mitigation Planning
NASA Johnson Space Center
HOUSTON, TEXAS

Risk Mitigation Strategies
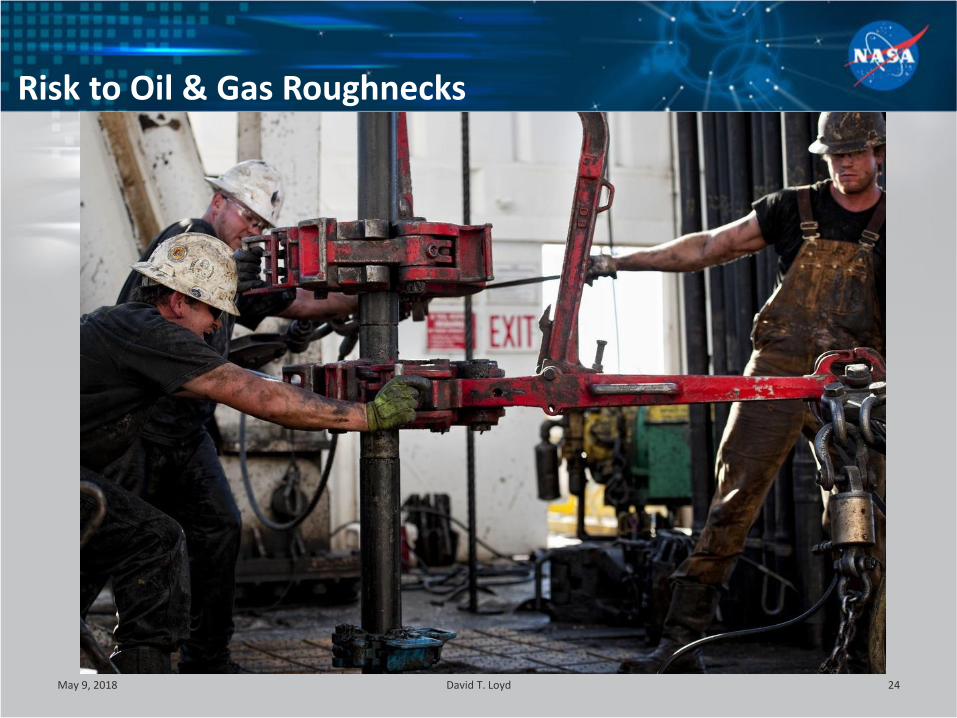
For each of the following workplace pictures:1. Identify at least one risk using any method you choose.
2. Determine potential severity the risk represents and the associated probability of occurrence.
3. Identify what parties share in the risk and should be consulted in managing it.
4. Identify necessary action to eliminate the risk.
5. Prepare a mitigation plan for reducing potential risk impact addressing either severity reduction or probability reduction.
6. Identify under what circumstance the risk could be accepted “as is”.
What would a strong safety cultural look like in this workplace?
May 9, 2018 David T. Loyd 23
May 9, 2018 David T. Loyd 24
Risk to Oil & Gas Roughnecks

Risk Mitigation Strategies
May 9, 2018 David T. Loyd 25
Risk
Statement
Pre-control
Risk Level
Risk
Owner(s)
Control
(Elimination)
Mitigation Plan Acceptable
Risk?
Probability Severity
Mechanical Impact – struck by rigging equipment.
Moderate High • Worker• Family• Company/
Employer• Regulation
Automation • Training• JHA• Procedures• Supervision• PPE
Not without mitigation.
Motor Vehicle accidents.
Moderate High • Worker• Family• Company/
Employer• Public• Regulation
Automated drivingTeleportation?
• Driver licensing• Seat belts• Defensive driver
training• Remote monitoring
and enforcement
Yes – with regulation penalties and claims costs.
Hazardous material exposure.
Moderate Moderate • Worker• Family• Company/
Employer• Regulation
• Gas monitoring• JHA• Supervision• Respiratory
Protection
Not without mitigation.
Risk to Oil & Gas Roughnecks

May 9, 2018 David T. Loyd 26
Risk to Astronaut Extravehicular Activity
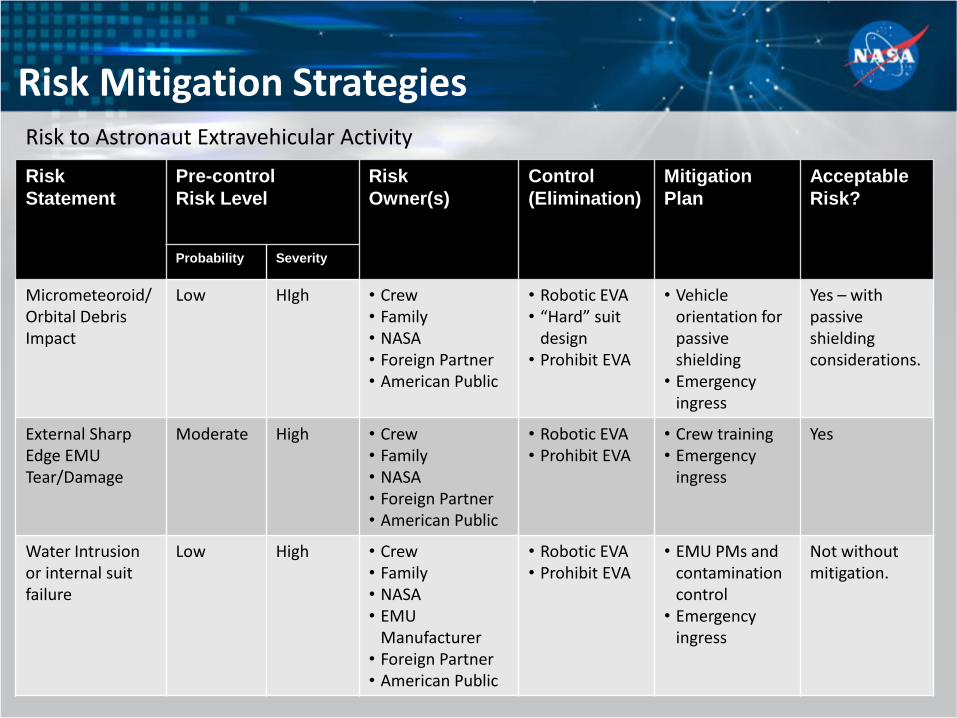
Risk Mitigation Strategies
May 9, 2018 David T. Loyd 27
Risk
Statement
Pre-control
Risk Level
Risk
Owner(s)
Control
(Elimination)
Mitigation
Plan
Acceptable
Risk?
Probability Severity
Micrometeoroid/Orbital Debris Impact
Low HIgh • Crew• Family• NASA• Foreign Partner• American Public
• Robotic EVA• “Hard” suit
design• Prohibit EVA
• Vehicle orientation for passive shielding
• Emergencyingress
Yes – with passive shielding considerations.
External Sharp Edge EMU Tear/Damage
Moderate High • Crew• Family• NASA• Foreign Partner• American Public
• Robotic EVA• Prohibit EVA
• Crew training• Emergency
ingress
Yes
Water Intrusion or internal suit failure
Low High • Crew• Family• NASA• EMU
Manufacturer• Foreign Partner• American Public
• Robotic EVA• Prohibit EVA
• EMU PMs and contamination control
• Emergency ingress
Not without mitigation.
Risk to Astronaut Extravehicular Activity

May 9, 2018 David T. Loyd 28
Risk to Bar and Restaurant Operations

Risk Mitigation Strategies
May 9, 2018 David T. Loyd 29
Risk
Statement
Pre-control
Risk Level
Risk
Owner(s)
Control
(Elimination)
Mitigation
Plan
Acceptable
Risk?
Probability Severity
Workplace Violence
Low HIgh • Worker• Customers• Family• Employer• Protective
Services
• Forced lobotomies.
• Surveillance• Security• Employee
training• Police
notification
Yes – only if the employer had not been aware of the potential for violence in the workplace.
Alcohol/Drug Abuse
Moderate Moderate • Worker• Customers• Family• Employer• Protective
Services
• Prohibit alcohol sales.
• Alcohollicensure
• Surveillance• Employee
training• Police
notification
Not without mitigation.
Foodborne illness Moderate Low • Worker• Customers• Family• Employer• Food supplier
• Limit/prohibit food availability.
• Municipal inspection
• Sanitation protocols
• Employee training
Not without mitigation.
Risk to Bar and Restaurant Operations