understanding rwanda’s merchandise export sector · understanding rwanda’s merchandise export...
TRANSCRIPT

www.laterite-africa.com
Understanding Rwanda’s merchandise export sector
June 25th, 2013
Presentation prepared for the UNU-Wider Conference
… and what we learned or didn’t learn about Learning-by-Exporting

www.laterite-africa.com
What is Laterite?
Laterite is an economic and social research firm with a presence in Rwanda, Malawi and Burundi

www.laterite-africa.com
What was our role in the Learning-to-Compete program?
1 2 A book A paper

www.laterite-africa.com
The objective of this presentation?
Provide you with some insights on Rwanda’s merchandise exports sector Highlight some structural points at the firm level with interesting implications for learning-by-exporting Hopefully spark some new thinking about learning-by-exporting
1
2
3

www.laterite-africa.com
Brief overview of Rwanda’s export sector ….
INTRO

www.laterite-africa.com
Rwanda has a very small exports sector … merchandise exports have been flat and only account for about 5% of GDP
0%
5%
10%
15%
20%
1965 1975 1985 1995 2005
% G
DP
Merchandise exports over GDP (1960-2010)

www.laterite-africa.com
Approximately 90% of that is commodity based …
11.7%
39.2%
49%
0.0% 20.0% 40.0%
Otherproducts
Minerals
Tea andCoffee
Breakdown of Rwanda's merchandise exports (2010)

www.laterite-africa.com
In fact Rwanda’s commodity and non-commodity export sectors are two completely different sectors and should be analyzed as such
91%
0% 30% 60% 90%
Other products
Minerals
Coffee and tea
Destinations of Rwanda's merchandise exports (2010)
DRC andEAC
Other Africa
Asia
Europe, US,Canada
www.laterite-africa.com
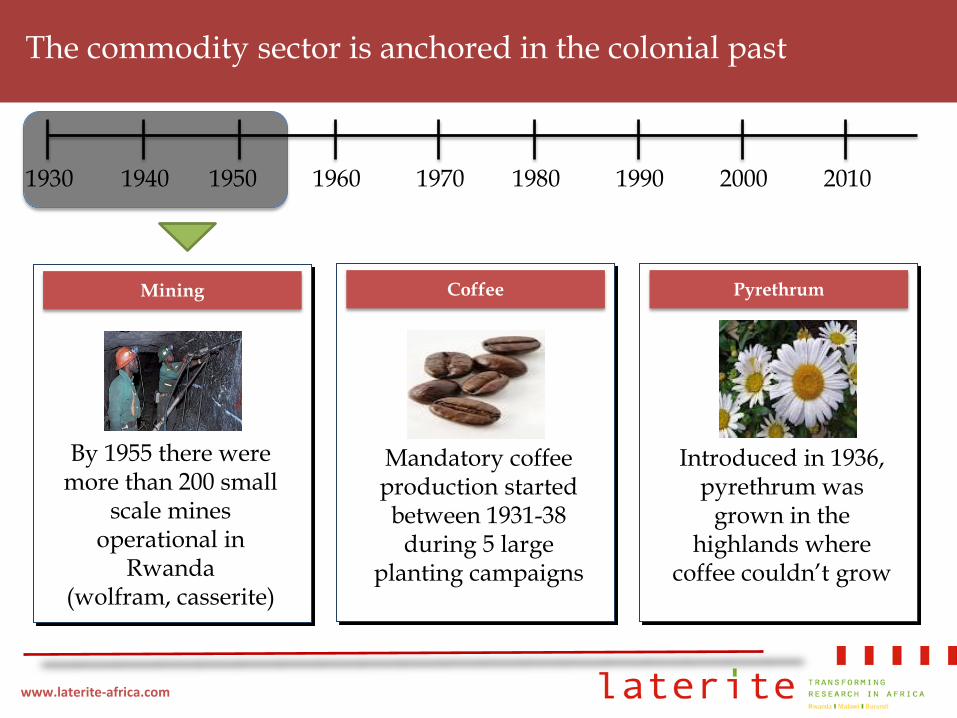
The commodity sector is anchored in the colonial past
1930 1940 1950 1960 1970 1980 1990 2000 2010
Coffee Pyrethrum
Mandatory coffee production started between 1931-38
during 5 large planting campaigns
Introduced in 1936, pyrethrum was
grown in the highlands where
coffee couldn’t grow
Mining
By 1955 there were more than 200 small
scale mines operational in
Rwanda (wolfram, casserite)

www.laterite-africa.com
The commodity sector is anchored in the colonial past (2)
1930 1940 1950 1960 1970 1980 1990 2000 2010
Tea
Tea production was started by European investors in the mid-50s and supported by development aid after
independence

www.laterite-africa.com
Yet has remained the main driver of exports growth (and new product discovery) over the past 20 years …
Product Category Total
exports Contribution to exports growth
(2000-2010) Established export products
170m 74.6%
New Export Discoveries
38m 19.5%
Intermittent 9m 4.3%
Incipient 4m 1.6%
New export products #products Share of new
products Value (USD)
Fully washed (specialty) and roasted coffee
1 41% 15.5m
Minerals (tungsten + chromium) 2 26% 9.8m

www.laterite-africa.com
Non-commodity exports … which are almost exclusively targeted at regional partners… are still in their infancy(US$32m in 2011!)
13%
1%
3%
8%
23%
53%
0% 20% 40% 60%
Other
Tanzania
Uganda
Kenya
Burundi
DRC
Share of manufacturing product exports (%)
Destination of Rwanda's manufacturing exports -excl. tea,
coffee, pyrethrum (average 2008-2010)
0%
2%
4%
6%
8%
10%
12%
14%
16%
18%
20%
2005 2007 2009 2011
Shar
e of
tota
l exp
orts
Share of non-commodity exports (2005-2011)

www.laterite-africa.com
These regional markets are however where the future of Rwanda’s export sector lies and where learning will take place ….
Tea (Europe +Asia)
Coffee (Europe + US)
Tin (Europe, Asia)
Beverages + Processed Food (EAC+DRC)
Construction materials + plastic tanks (EAC+DRC)

www.laterite-africa.com
It’s a sector that’s poised to take-off … Rwanda is experiencing the fastest pace of firm creation rate since the 1970s
TIMELINE OF CREATION OF MANUFACTURING FIRMS
1994 Genocide EAC entry
Rwanda’s industrial sector is relatively new
1972/3 Regional crisis
0
5
10
15
20
25
30
Num
ber o
f fir
ms

www.laterite-africa.com
Current growth is largely driven by regional investments
1930 1940 1950 1960 1970 1980 1990 2000 2010
Growth & EAC entry
• 30% of output comes from new firms created since 2005
ICM Rwanda Agribusiness
Bakhresa Grain Milling Master Steel
SteelRwa
Rwanda Mountain
Tea
Kigali Cement Company
Safintra
Rwanda Trading Company
Brasserie de Milles Collines
Total Output: ~
$128M

www.laterite-africa.com
There are very few exporters FINDING #1

www.laterite-africa.com
There are very few non-commodity exporters in Rwanda
Definition Non-
Exporters Commodity
exporters
Retail, wholesale, or
transport firms
Other exporters
Total number of exporters
1. Exports > 0 1170 27 50 43 120
2. Exports > USD$50,000 1223 26 18 24 68
3. Exports/sales > 10% 1234 26 14 17 57
Sampling frame: All firms that paid tax and social security in 2010

www.laterite-africa.com
Not only that, but the export orientation of exporters is low … can learning really happen with such low exports?
2% 3% 4% 5%
7% 8% 8%
10% 11% 11%
16% 20%
22% 33%
40% 50%
69%
0% 20% 40% 60% 80%
Ruliba ClaysUfametalUtexrwaBralirwaMutaraPembe
Aqua-SanSulfoRoto
InyangeRwanda Plastic Industries
BMCMaster Steel
KCCSteelrwa
Bakhresa Grain MillsSRC
Share of revenues that comes from exports (2011)
Plastic shoe maker …. exports exclusively to Burundi, where owner used to live and run a BATA shoe factor y All started in
2011, all owned by East African firms

www.laterite-africa.com
And there’s also a structural problem: in each sector there are only one or two producers, so it is hard to identify comparator firms!

www.laterite-africa.com
There is little switching in and out of the exports sector …
FINDING #2

www.laterite-africa.com
Firms in the commodity sector are “born global”; firms in the non-commodity sector are “born regional”
Firms switching in and out of the export sector is often used to test the learning-by-exporting hypothesis. There is however little evidence of switching in Rwanda’s export sector…
Firms in commodity sector are “born global” • All firms are 100% exporters • These firms are also literally global … owned by large US, EU and Indian groups
New non-commodity exporters are “born regional” • New investments by EAC group driving exports and manufacturing sector growth • Investments made with eye on Burundi and DRC markets

www.laterite-africa.com
Firms don’t always export by choice, it can be by default….
FINDING #3
www.laterite-africa.com
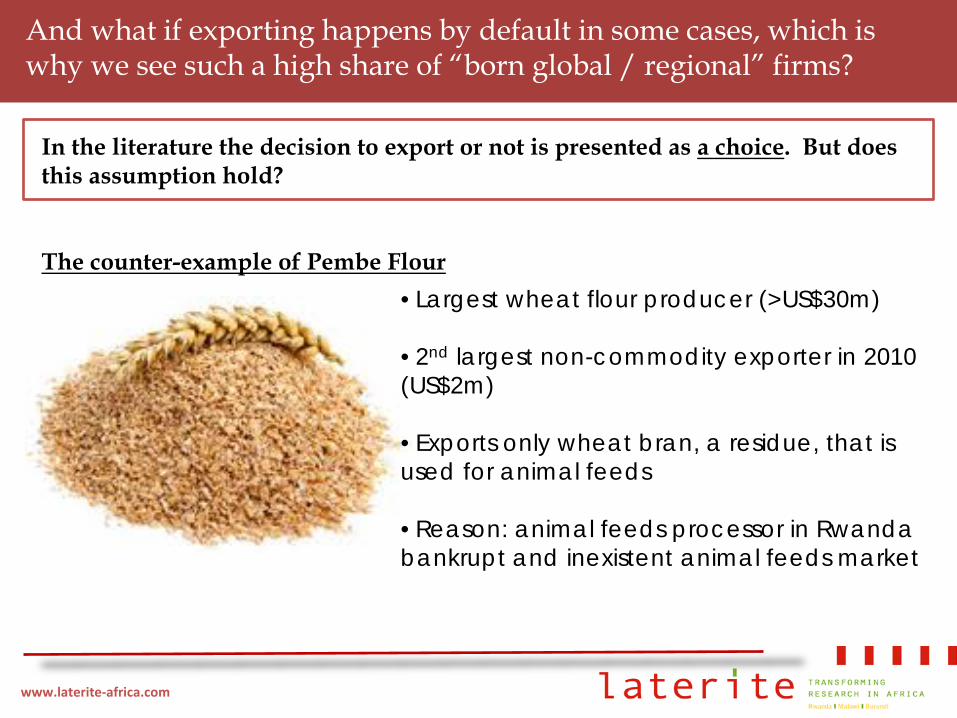
And what if exporting happens by default in some cases, which is why we see such a high share of “born global / regional” firms?
In the literature the decision to export or not is presented as a choice. But does this assumption hold? The counter-example of Pembe Flour Wheat flower producer,
• Largest wheat flour producer (>US$30m)
• 2nd largest non-commodity exporter in 2010 (US$2m)
• Exports only wheat bran, a residue, that is used for animal feeds
• Reason: animal feeds processor in Rwanda bankrupt and inexistent animal feeds market

www.laterite-africa.com
Traders play a key role because of export barriers
FINDING #4

www.laterite-africa.com
Traders are central to Rwanda’s regional exports sector … they are better at overcoming export barriers
Typically the LBE literature doesn’t take into account the role of traders. But isn’t that central to who learns?
The prevalent export model in Rwanda Producers
Trader
Distributers/retailers in DRC & Burundi
Sells goods
Who learns??

www.laterite-africa.com
Don’t forget that even in the formal sector, exports are sometimes informal
FINDING #5

www.laterite-africa.com
Rwanda’s informal trade networks are used by large firms to export to neighboring countries
How can the LBE model better adapt to informal trade networks? They’re bigger than you think ….
• Informal exports to Burundi and DRC are larger than formal exports! According to NBR: 60% of exports to DRC, 55% of exports to Burundi
The case of Minimex (turnover >US$10m)
Sells products to Small
traders in border market
DRC border
Products taken across at low cost by informal traders

www.laterite-africa.com
Supply is the biggest constraint FINDING #6

www.laterite-africa.com
Why do we assume learning on the sales side is greater than learning on the supply side?
The supply of raw material is the biggest constraint to growth in Rwanda’s manufacturing and agribusiness sectors (see book!) The costs and delays related to supplies decrease productivity and capacity utilization Developing effective international supply networks that are diversified, stable and based on established relationship can have a very high impact on productivity It also helps firms keep updated on the latest available inputs and industry best-standard This exposure to international markets on the supply side can therefore lead to learning
Our rationale
1
2
3
4
5

www.laterite-africa.com
Summary of highlights
There are very few exporters There is little switching Exporting is not always a choice Traders are central to the equation Formal firms can export through informal networks Supply matters most … so let’s study learning-by-importing
1
2
3
4
5
6