understanding school district budgets · pdf fileunderstanding school district budgets: ... of...
TRANSCRIPT

BudgetsUnderstanding School District
a guide for local leadersJANUARY 2005

About EdSourceIndependent and impartial, EdSource strives to advance the common good by developing and widely distributing trustworthy, useful information that clarifies complex K–12 education issues and promotes thoughtful decisions about California’s public school system.
A unique statewide nonprofit, EdSource is an invaluable resource for everyone who cares about California’s public schools.
About this publicationThis new guide updates one of EdSource’s most popular publications, Understanding School Budgets: As Simple as 1,2, 3. New administrators, schoolboard members, and interested teachers, parents, and community members have depended on this publication since 1988 to learn about schooldistrict budgeting and become more effective participants in finance-related decisions. This new version continues that tradition in the context of anew state accounting system and increasing pressure on schools to improve student performance.
Additional copies of this guide are available from EdSource for $8 (plus $2 shipping). Bulk discounts are given for orders of 10 or more. Orders can beplaced through the office or the EdSource website.
This report has been prepared byMary Perry, authorIsabel Oregón, research supportSusan Frey, editorUpdated from a report originally developed by Penny Howell and Barbara Miller.EdSource developed this publication in partnership with the Fiscal Crisis and Management Assistance Team (FCMAT).© Copyright 2005 by EdSource, Inc.

Understanding School District Budgets: A Guide For Local LeadersA school district budget is more than numbers. It is a record of a district’s past decisions and a spending plan forits future. It shows a district’s priorities whether they have been clearly articulated or simply occurred by default. Andit is a communications document that can tell constituents a lot about the district’s priorities and goals.
A school district budget can certainly be difficult to understand and even more challenging to describe. But behindthe volumes of mandatory reporting forms, accounting procedures, and jargon are some basic principles that canhelp bring clarity for those who develop school district budgets and for those who want to understand them.
Some California school districts use their budget documents to do more than just present financial data. Theydirectly connect their financial decisions to their goals for student, school, and district performance. At best thateffort can further those goals. At a minimum it can illuminate some of the obstacles to realizing them.
This guide provides an overview of the mechanics of the budget process and the documents most commonly usedto describe a district’s financial condition. It begins with a budget calendar and glossary that provide context for therest of the report. The guide reviews the information school district officials must use for responsible fiscal manage-ment, the inevitable adjustments districts must make in their budgets, and the oversight procedures the state hasput into place to ensure that districts remain solvent and maintain their financial health. Finally, this report exploressome ways that budget information can help decision makers evaluate how well district spending matches educa-tional goals, set priorities consistent with those goals, and plan expenditures that are aligned with that vision.
TABLE OF CONTENTS
District Budgeting Operates Within a Set Framework . . . . . . . . . . . . . . . . . . . . . . . . . . . . . . . . . . . . . . 4
Illustration #1: Major General Fund Revenue and Expenditure Categories . . . . . . . . . . . . . . . . . . . . . . 7
A District’s First Budgetary Responsibility Is To Be Fiscally Sound . . . . . . . . . . . . . . . . . . . . . . . . . . . . . 8
Illustration #2: Sample Combined General Fund . . . . . . . . . . . . . . . . . . . . . . . . . . . . . . . . . . . . . . . . . 9
Illustration #3: Sample First Interim Report. . . . . . . . . . . . . . . . . . . . . . . . . . . . . . . . . . . . . . . . . . . . 11
State Reporting and Oversight Requirements Establish Budget Standards . . . . . . . . . . . . . . . . . . . . . 14
District Warning Signs that Can Trigger Budget Disapproval . . . . . . . . . . . . . . . . . . . . . . . . . . . . . . . . 15
Budgets Can Link Finance Decisions to Performance and Priorities . . . . . . . . . . . . . . . . . . . . . . . . . . 17
Districts Track Budget Items Using the Standardized Account Code Structure (SACS) . . . . . . . . . . . . . 18
Illustration #4: Sample Program Summary, Certificated Salaries . . . . . . . . . . . . . . . . . . . . . . . . . . . . 19
Illustration #5: Sample Adopted Budget . . . . . . . . . . . . . . . . . . . . . . . . . . . . . . . . . . . . . . . . . . . . . . 20
Illustration #6: Sample Elementary Schools Budget. . . . . . . . . . . . . . . . . . . . . . . . . . . . . . . . . . . . . . 22

2 ● Understanding School District Budgets ● January 2005
The budget calendar for 2005–06: From start to finish
Fall 2004
Even as one school year starts,districts begin to discuss priorities,evaluate existing programs, and setparameters and goals to guide budgetdevelopment for the next year.
May 2005
The governor submits an official “May Revision” of his proposed statebudget that will update projectionsfor district revenues in the comingyear. The district staff uses this infor-mation to evaluate the preliminarybudget and make revisions. Mean-while, state leaders begin finalizingthe state budget.
June 2005
Final study sessions and mandatorypublic hearings precede the governingboard’s adoption of the budget. Thedeadline for adoption is July 1. Thedistrict then submits that budget tothe county superintendent.
October 2005–June 2006
State law requires that twice duringthis period the district staff prepare,the board review, and the countysuperintendent receive interim reportsthat update the district’s revenuesand expenditures and project themthrough the balance of the school
July–August 2005
The state budget is typically adoptedand signed by the governor sometimein July. (The state constitution calls forthe Legislature to adopt a state budgetby June 15 and the governor to sign itwithin 12 days, but it is usually later—in some years as late as September.)Once the state budget is signed, adistrict has 45 days to amend itsadopted budget. During this time, thedistrict also closes its books from theprevious year. The state’s official adop-tion of funding levels for education andthe district’s confirmation of its prior-year revenues, expenditures, andending balance are essential in orderto finalize the budget. By Aug. 15 thedistrict receives the review andcomments on the adopted budget bythe superintendent of the local countyoffice of education.
January–April 2005
The district adopts its budget calen-dar and reviews its guidelines forbudget development. Following thegovernor’s Jan. 10 release of aproposed state budget, district staffmembers present a discussion ofthe likely impact on the district.They should build into this discus-sion the projected costs of newdistrict initiatives and anticipatedsavings that can be realized fromdropping or changing currentprograms. They should also includeestimates of salary and benefitincreases based on existing commit-ments and potential collectivebargaining agreements. If thisprocess indicates that staff layoffsmay be necessary, preliminarynotices must be given to all certifi-cated staff members who might beaffected (teachers, counselors,
principals, etc.) by specific dates inMarch. This process needs to bedone carefully given the complexityinvolved in determining staff senior-ity and the severe impact layoffscan have on staff morale. A prelimi-nary budget document is typicallydeveloped during this time.
Every school district is simultaneously operating its current-year budget, evaluating its budget from the previous year, and developingits plans for the upcoming year. The following is a typical calendar for the development of a single year’s budget.

January 2005 ● Understanding School District Budgets ● 3
Glossary of Terms
Actuals The amount a district actually spent in a given period as opposed to original budget estimates.
Bond Interest and Redemption Fund An account maintained on a local education agency’sbehalf by the county auditor and used for repayment of bonds.
Cafeteria Fund A separate fund used by many districts to track the income and expenses related tofood service.
Debt Service Expenditures made to pay both principal and interest on borrowed funds, includ-ing bonds.
Direct Support Costs Services necessary to maintain instructional programs, including curricu-lum development, library, pupil support, transportation, and maintenance. Most support costsnot initially identified with a program may be accumulated and then transferred at a later dateas a direct support cost.
District Governing Board The official name for the local school board.
General Fund The primary, legally-defined fund used by the state and school districts to differ-entiate general revenues and expenditures from those placed in other funds for specific uses.
Indirect Costs Agencywide general administrative costs, including fiscal, personnel/human, anddata process services. Indirect costs benefit multiple objectives and cannot be readily identifiedwith a particular final cost objective.
Joint Powers Agreement (JPA) An agreement among local education agencies (and sometimesthe California Department of Education) to share services or responsibilities. A joint powersboard made up of representatives of the local education agencies governs the JPA.
Object Codes For revenues, the object code identifies the general source and type of funds. Forexpenditures, it identifies the type of item or service being purchased. District line-item budgetreports usually reflect fund and object-level information.
Other Outgo Includes outlays for debt service, transfers between funds within a district, andtransfers to other agencies.
Position Control A function that coordinates and authorizes positions in accordance withestablished district policies and procedures. This function is useful for budget development andthe preparation of salary projections within a district.
Restricted/Unrestricted In the General Fund budget, the designation of a revenue or expendi-ture as being for specific (restricted) or general (unrestricted) purposes. Some revenue limitsources may be posted as restricted and some categorical program sources (such as K–3 ClassSize Reduction) may be posted as unrestricted.
Special Education Local Plan Area (SELPA) Regional group for purposes of administeringSpecial Education services effectively and efficiently. Districts are organized in SELPAs. Some arecountywide, a single large district, or part of a district; and some combine several smaller districts.
Title I Provides funds for educationally disadvantaged students and is the largest of severalfederal programs included in the federal No Child Left Behind Act (NCLB).
TRANs (Tax Revenue Anticipation Notes) Short-term loans that school districts can use toaddress a cash flow problem created when expenditures must be incurred before tax revenuesare received.
year. The First Interim Report, dueDec. 15 to the county office of educa-tion, covers the period through Oct. 31,2005. The Second Interim Report, dueMarch 15, covers actual revenues andexpenditures through January 2006.With each interim report, the schooldistrict board states whether thedistrict’s fiscal condition is positive,qualified, or negative (will, may not, orwill not be solvent over the next threeyears), and the county superintendentofficially certifies that. These twointerim reports represent minimumlegal requirements. A Third InterimReport, due June 1, may be required.The district board can also call foradditional budget reviews or reportsat its discretion.
July–December 2006
Once the district’s books are closed,the final balances are reported to the state in October 2006 as part ofits annual reporting of unauditedactuals. Concurrently, the district mustretain an independent auditor whowill review the year-end financialstatements and deliver the annualaudit report on or before Dec. 15.

In California, the state and all schooldistricts operate on a fiscal year thatbegins July 1. The budget process,however, is virtually continuous. Inany given year, it begins in the fall ofthe preceding year with forecasts ofrevenues, expenditures, and studentenrollments. A preliminary budget isadopted prior to July 1 but generallycontinues to be adjusted. During theschool year, the district confirms itsfinancial status both officially and un-officially. After the books for thatyear are closed, the process ends withan audit certifying the accuracy of thedistrict records. The calendar on pages2–3 provides a basic timeline.
A district’s elected school boardholds final responsibility for adopt-ing the budget, and that budgetmust be balanced—i.e., allow thedistrict to meet its current and future financial obligations. Theboard’s role in fiscal accountabilitygoes beyond a simple vote, however.The board also sets policies thathelp guide both the budget develop-ment and financial management ofthe district. It is responsible for sup-porting and monitoring the imple-mentation of the budget as carriedout by the superintendent and dis-trict staff. And it sets the expecta-tions for how the district’s financialstatus and expenditure decisions willbe communicated to board membersand to the public.
A few basic realities create theframework within which district fi-nancial management and reportingoperate in California. They include: ● the concept of fund accounting,● the critical role that the number
of students plays, ● the process by which districts re-
ceive their revenues, and
● the recognition that personnelcosts dominate district expendi-ture decisions.
The fund accounting system—looking atthe whole pictureCalifornia school districts use a sys-tem called “fund accounting.” Allrevenues and expenditures are placedin one of several funds. The one thatis used to record most of a district’sday-to-day operations is the GeneralFund, which all districts are requiredto have.
Most of the district’s financialtransactions flow through theGeneral Fund. The largest part ofthe money is for general purposesand is categorized as unrestricted.Some of the revenues that go intothe General Fund, however, are re-stricted to specific uses, usually incompliance with state or federal reg-ulations. This includes most specialpurpose or categorical programs.There are dozens of these programs,such as Special Education, trans-portation, instructional materials,and Title I of the federal No ChildLeft Behind Act (NCLB) that sup-ports disadvantaged students.
General accounting guidelines re-quire that districts place certain rev-enues into governmental funds thatare separate from the General Fund.Most often, these revenues are to beused for purposes other than provid-ing K–12 instruction. In addition,districts have the option of settingup other funds outside the GeneralFund. These fall into the followinggeneral categories:● Special Revenue Funds, such as
Adult Education, Cafeteria, ChildDevelopment, Deferred Maintenance,and Charter Schools.
● Capital Project Funds, such asthe Building Fund, Capital Facili-ties, and State School BuildingLease-purchase.
● Debt Service Funds, such as TaxOverride, Debt Service, and BondInterest and Redemption Fund.
● Permanent Funds, such asFoundation Permanent Funds (en-dowments in which the main bal-ance is preserved but which produceongoing income the district uses). A district can also create Special
Reserve Funds that allow the schoolboard to set money aside for variousreasons, including anticipated ex-penses such as benefits for retiredemployees. The district retains theright to transfer that money—atwill—back to the fund or funds itcame from.
Some districts also establish separate proprietary and fiduciaryfunds. Proprietary funds track enter-prise activities for which the districtcharges a fee to external users. Forexample, a district could provideprofessional development services toteachers outside the district andcharge for that. Fiduciary funds areassets the district holds on behalf ofothers, such as pension funds foremployees. These cannot be used tosupport district programs.
Each fund is self-balancing andhas its own financial statement witha beginning balance, list of revenuesand expenditures, and ending bal-ance. The balances for all funds areshown on a district’s financial report.A district can temporarily borrowfrom one fund to supplement an-other. However, it generally mustrepay such loans by the end of thesame fiscal year. (If the loan is madewithin 120 days of the end of the
4 ● Understanding School District Budgets ● January 2005
District budgeting operates within a set framework

January 2005 ● Understanding School District Budgets ● 5
fiscal year, it does not have to be repaid until the following year.) In general, the California SchoolAccounting Manual recommendsthat a district transfer funds as littleas possible in order to simplify finan-cial recordkeeping and reporting.
Projecting the number of studentscomes first The primary focus of budget devel-opment each year is related toGeneral Fund revenues. They repre-sent the bulk of the operating moneyfor K–12 instruction, the centralpurpose of every district.
In California, a school districthas little control over most of itsrevenue sources. Instead, its incomeis affected by state-determinedfunding formulas and the manda-tory programs in which it must par-ticipate. Officials can also choose tooperate optional programs—suchas K–3 Class Size Reduction—forwhich the state provides a set levelof funding.
The number of students who at-tend school is critical to district rev-enues because most of this fundingis provided on a per-pupil basis, ad-justed for actual attendance. Thebudget process thus begins with acareful projection of the number ofstudents. However, the student countis not just a matter of how manychildren enroll each year. For mostfunding purposes, districts receiveincome based on the number whoactually attend class, referred to asthe average daily attendance (ADA).
The state uses a school district’sADA through April each year to de-termine its total general purpose(revenue limit) funding. Some spe-cial purpose (categorical) funding isbased on ADA as well.
Accurate projections of ADA arepivotal to the development of a
sound budget. First, a district mustestimate how many children will reg-ister for school. Most districts useseveral data sources to arrive at thisestimate, including census informa-tion, birth rate data by zip code,questionnaires sent home with cur-rent students, and sometimes theservices of demographers. Then thedistrict needs to look at past years tosee what the relationship typically isbetween its enrollment and its ADA.When districts estimate badly, it isoften because of unexpected eventslike a sudden economic downturn orperhaps the demolition of a largeapartment complex.
Changes in a district’s ADA canhave a significant impact on its rev-enues. To protect districts fromunanticipated reductions, the fund-ing is based on either their currentor prior year ADA, whichever isgreater. A district with ongoing de-clining enrollment will continue toreceive less money each year regard-less of its ability to reduce expenses.Some analysts estimate that whiledistricts lose a full unit of ADAfunding for each fewer student, theytypically save less than 70% of thatamount in terms of reduced costs.Conversely, the incremental cost ofeach additional student is about70% of the additional revenues adistrict receives. Thus, in general, adistrict with a growing populationbenefits financially. (One exceptioncan be “basic aid” districts. See thebox on page 6.)
The state largely determines revenue levelsEach district has a revenue limit—the per-pupil amount it receives forgeneral purposes—that makes upmost of its General Fund revenues.Revenue limit income is a combina-tion of local property taxes andstate funds.
The state calculates the revenuelimit amount separately for each district based both on its historicalfunding level and a set of adjust-ments that changes a bit each year. In most years, that includes a cost-of-living adjustment (COLA). Districtshave no control over their revenuelimit amount. In simple terms, a dis-trict multiplies its revenue limit by itsprojected ADA to determine its totalgeneral purpose funding.
In providing this funding foreach district, the state first appliesthe local property taxes designatedby law for that district. The differ-ence between those taxes and theamount due is covered with statefunds. If the local property taxes ex-ceed the amount due, the districtfalls into “basic aid” status. (See the
How ADA is calculated
A district’s ADA is calculated by dividingthe total number of days of studentattendance by the total number of daysin the regular school year. A studentattending every day would equal oneunit of ADA. The number of pupilsenrolled in the school is usually largerthan the ADA due to factors such asstudents moving, dropping out, or stay-ing home because of illness.

“Basic aid” school districts face some different challenges In a limited number of school districts—fewer than 80 in most years—revenues from local property taxes exceed the total revenue limit incomedue to a district based on the state formula. These districts are allowed to keep all of their property taxes but do not receive per-pupil generalpurpose funding from the state. They are called “basic aid” or “excess revenue” school districts and, for them, the process of projecting revenuesis somewhat different.
Many of these districts are very sure of their status as a basic aid district from one year to the next. In that case, their revenue projections dependon a solid analysis of the potential property tax revenues in a community, with particular attention to possible changes. An influx of students ina basic aid district does not trigger additional funding. The financial impact of enrollment increases and decreases is more nuanced and lessstraightforward in these districts.
A few districts go from year to year unsure of their basic aid status. They wait until almost the end of the year to see whether their total localproperty tax collections will exceed the product of their state-set per-pupil amount times their ADA. The California Department of Educationcertifies which districts are basic aid at the time of districts’ second principal apportionment, which occurs in June at the end of the schooland fiscal year. For these districts, predicting revenues and the impact of additional students is far from straightforward.
box below for a further explanationof basic aid.)
The rest of the General Fund in-come comes primarily from restrictedcategorical (special purpose) sup-port. This includes state programslike Economic Impact Aid andProfessional Development, federalcategorical programs like Title I, andprograms like Special Education thatreceive both state and federal funds. Adistrict’s special purpose income de-pends on the programs for which itqualifies. Some are based on studentcharacteristics, others on providingspecific programs, and a few on thedistrict’s size or location. For themost part, the California Departmentof Education handles the apportion-ment of both state and federal cate-gorical program funds.
The Legislature and governor,through the annual state budgetprocess, set the amount by whichrevenue limits will increase (or, inrare instances, be reduced). They maymake changes in statute that affectthe formula used to calculate them.In addition, they can adjust theamount and allocation process for
the numerous categorical programsas well as add or eliminate programs.
Districts also receive GeneralFund revenue from the state lottery,which has historically provided lessthan 2% of funds for schools. Alldistricts receive the same per-pupilamount from the lottery. Most of it isunrestricted, but a small portion mustbe used for instructional materials.
A final group of revenue sourcesis labeled “local miscellaneous in-come.” Parcel taxes, rental income,interest on investments, and charita-ble contributions all fall into thiscategory. In some districts suchsources represent substantial amounts,while in others they are almost non-existent. Districts choose whether to pursue these types of revenues,including asking local voters to passa parcel tax. They can also be ag-gressive in their management of as-sets in order to increase districtincome. Examples include maximiz-ing interest income on district ac-counts (including bond proceeds)and generating extra revenuesthrough the sale or lease of any sur-plus district properties.
Expense estimates begin with staff costsTypically about 85% of a district’sGeneral Fund is spent for staffsalaries and benefits—of whichteacher compensation is about two-thirds—making it crucial thatdistricts project staffing costs accu-rately. Three things affect thosecosts: the number of employeesneeded, the salaries they will receive,and the cost of employee benefits.
Generally, districts allocateteachers—and to some degree otherstaff—based on negotiated classsizes or other ratios of staff to stu-dents. Thus, a district’s first step indetermining staffing levels is get-ting an accurate count of how many students will attend school. Oncethat has been done, officials calculate how many teachers andother staff it will take to educatethose students. This calculation depends on the class sizes in the district and the preparation time for which teachers are paid. Both of these are negotiated as part of the collective bargaining agree-ment between the district and the teachers’ union.
6 ● Understanding School District Budgets ● January 2005

January 2005 ● Understanding School District Budgets ● 7
District participation in specialprograms usually requires extrastaffing, which often includes teach-ers on special assignment. Some dis-tricts use set formulas to adjustadministrative and service staff (e.g.,vice principals, counselors) based onsite-level student counts. Every dis-trict also employs a number of clas-sified staff—such as secretaries,
janitors, groundskeepers, cafeteriaworkers, and teachers’ aides—whohelp to keep the operation going.
Conservative estimates of stu-dent population and revenues willlead to conservative staffing commit-ments. If the projection proves to below, it may cause a sudden rush tohire at the start of a school year andperhaps necessitate moving children
around after the year begins. At thesame time, being conservative willprotect the district from overstaffing,which can have a disastrous financialimpact. While districts can add staffafter the school year begins, state law substantially limits their ability todismiss permanent teaching staff—even if they overestimated how manystudents they would have.
District budgets use standardized object codes to classify their General Fund revenues and expenditures.The following represent the maincategories into which both are placed.
REVENUESRevenue Limit Sources (8010–8099): includes base revenue limits, plus other funds such as Equalization, Summer School, Prior YearAdjustments, etc.
Federal Revenues (8100–8299): includes all money received for the No Child Left Behind Act (Title I, Title II, etc.) plus Special Educa-tion and other federal programs.
Other State Revenues (8300–8599): includes lottery and state categoricals (e.g., K–3 Class Size Reduction, Gifted and Talented Education (GATE), Economic Impact Aid).
Local Revenues (8600–8799): includes interest, donations and reimbursements, parcel taxes, rents and leases, and other local sources.
EXPENDITURESCertificated Salaries (1000–1999): includes teachers, certified pupil support, certified supervisors and administrators, etc.
Classified Salaries (2000–2999): includes instructional assistants, athletics staff, clerical and office, maintenance staff, classifiedsupervisors and administrators, etc.
Employee Benefits (3000–3999): includes Health and Welfare, Worker’s Compensation, and other employee benefits.
Books and Supplies (4000–4999): includes approved textbooks and core curricula material, books and other reference materials, mate-rials and supplies, etc.
Services and Other Operating Expenses (5000–5999): includes travel and conferences, dues and memberships, housekeeping services,rentals, leases, and repairs.
Capital Outlay (6000–6599): most commonly refers to site improvements, equipment, and equipment replacement.
Other Outgo (7100–7299): includes TRANs, payments to districts, and payments to county offices.
Direct Support/Indirect Costs (7400–7499): used to record transfers of direct support and indirect costs within or between funds.
Illustration #1Major General Fund Revenue and Expenditure Categories

8 ● Understanding School District Budgets ● January 2005
District officials must ensure thatthe district is able to meet its finan-cial commitments each year. Thus,they must temper the desire to inno-vate and invest in new priorities—orprovide raises to employees—with aclear-sighted evaluation of the district’s current and anticipated fiscal condition. Certainly this requires that the adopted budget be fiscally sound. Beyond that, it demands that district officials, mostnotably the school board, also moni-tor district revenues and expendi-tures throughout the year to ensurefiscal solvency.
Districts are required by law toreport their financial status to thepublic and to county office of edu-cation officials periodically inbudget, interim, and year-end finan-cial reports. Each of these can helpidentify emerging problems andavert a financial crisis.
Looking at an overview is the criticalfirst stepEach fund has its own line-itembudget that provides an importantoverview of revenue sources and ex-penditure decisions. A look at theline-item budget for the GeneralFund in particular reveals a lot aboutthe fiscal health of a district.
Examining the difference betweentotal revenues and total expendituresmay show whether a district is operat-ing with a deficit in any given year. Acomparison of fund balances fromyear to year can do the same. Transfersfrom other funds to the General Fund may indicate that the district is balancing its ongoing budget by borrowing from other funds.Transfers into those same funds may
mean that General Fund revenues aresubsidizing other operations, such asfacilities or a cafeteria program.
The line-item budget also pro-vides a quick assessment of whatproportion of the district’s revenuesare unrestricted (available for generalpurposes) and restricted (must beused for specified purposes). Expen-ditures are divided the same way.While these designations conformto state policy, they can also reflectlocal board decisions to restrict specific revenues or expenditures not required by the state.
In the General Fund, the classifi-cation “Designated for EconomicUncertainties” is sometimes referredto as “the reserve.”This is money setaside for major unforeseen expensesor revenue shortfalls.
The state requires districts tomaintain a reserve of between 2% and 5% of their General Fund expenditures (after deductingTransfers Out and Other Sources/Uses). The percentage depends onthe size of the district. The smal-lest districts (those with fewer than300 students) must keep a 5% re-serve, and the largest (those withmore than 30,000 students) are re-quired to keep 2%. Los AngelesUnified School District, the onlydistrict in the state with more than400,000 students, must keep a reserve of 1%.
In difficult budget years—suchas 2002 to 2004—it is much morechallenging for even the most consci-entious districts to make ends meet.Recognizing that, the state has occa-sionally relaxed for a limited timesome of its expectations in regard toboth fund transfers and reserves.
Interim reports help ensure solvencyduring the course of the yearInevitably the estimates used to cre-ate the original budget will changesomewhat as the year progresses.There are too many unknowns at thetime of budget adoption to expectanything else.
Sometimes, however, unantici-pated events create budget problemsthat are more extreme. For example, in2002 and 2003, midyear cuts in thestate’s education appropriations leftdistricts with less revenue than theyexpected. A shortfall between the dis-trict’s estimated and actual student at-tendance can also result in significantlosses in revenue. On the expenditureside, the cost of a new program maydramatically exceed estimates and aretroactive midyear settlement of em-ployee contracts can unexpectedly in-crease personnel costs.
Even the most skillfully preparedbudget is just a snapshot in time, andit is imperative that the assumptionsupon which it was based are reviewedregularly. Districts are required tocertify their financial condition twiceduring the school year, for the peri-ods ending Oct. 31 and Jan. 31.They do this by filing interim re-ports in a format specified by thestate. The school board must ap-prove the October information byDec. 15 and the January informationby March 15. If a district receives aqualified or negative certification onits Second Interim Report, it mustfile a third by June 1.
These reports compare the ongo-ing financial conditions to what wasprojected in the district’s originalbudget. Through this review of an-ticipated versus actual revenues and
A district’s first budgetary responsibility is to be fiscally sound

January 2005 ● Understanding School District Budgets ● 9
Categories Unrestricted Restricted Combined Unrestricted Restricted Combined
Revenues
Revenue Limit Sources 12,655,584 184,203 12,839,787 13,324,221 194,184 13,518,405
Federal 0 237,097 237,097 0 321,049 321,049
Other State 1,460,249 1,954,901 3,415,150 1,320,775 2,398,067 3,718,842
Local 1,273,460 160,454 1,433,914 540,000 18,329 558,329
Total Revenues 15,389,293 2,536,655 17,925,948 15,184,996 2,931,629 18,116,625
Expenditures
Certificated Salaries 8,464,623 1,292,345 9,756,968 8,659,378 1,245,717 9,905,095
Classified Salaries 1,877,446 417,000 2,294,446 1,882,116 453,069 2,335,185
Employee Benefits 2,051,617 310,877 2,362,494 2,078,292 311,879 2,390,171
Books & Supplies 394,109 210,620 604,729 614,776 1,124,528 1,739,304
Contracted Services 1,286,686 414,809 1,701,495 1,346,046 326,915 1,672,961
Capital Outlay 288,952 80,776 369,758 341,643 251,350 592,993
Other Outgo 59,115 92,528 151,643 95,751 119,254 215,005
Direct Support/Indirect Costs
Total Expenditures 14,422,578 2,818,955 17,241,533 15,018,002 3,832,712 18,850,714
Revenues Less Expenditures 966,715 (282,300) 684,415 166,994 (901,083) (734,089)
Other Sources/Uses 861,094 (314,885) 546,209 850,093 (491,391) 358,702
Net Increase/Decrease 105,621 32,585 138,206 (693,099) (409,692) (1,092,791)
BEGINNING BALANCE 1,724,929 377,107 2,102,036 1,830,550 409,692 2,240,242
Net Change 105,621 32,585 138,206 (683,099) (409,692) (1,092,791)
ENDING BALANCE 1,830,550 409,692 2,240,242 1,147,451 0 1,147,451
2005–06 Budget2004–05 Estimated Actual
The budget shows how much the district expects toreceive and spend for general purposes and for categorical programs.
Difference between total revenues and expenditures shows this district is operating with a deficit (at a loss).
A comparison of fundbalances from year to year can also show the deficit.
Beginning balance includes reserves.
Illustration #2: Sample School District2005–06 Combined General Fund

expenditures, districts certify whetherthey will be able to meet their obligations.
The school board is responsiblefor monitoring the interim reports toensure that the district remains on asolid financial footing throughout theyear. These interim reports includeupdates on staffing and student at-tendance, year-to-date accounting,and projections of future expenses.They can also shed light on potentialcash flow problems.
Once the school year has begun,reducing expenses can be quite diffi-cult because so much of the budgetis devoted to personnel. State lawmakes it nearly impossible for a dis-trict to reduce permanent certifi-cated staff midyear. Districts havemore flexibility in regard to classifiedstaff but still must provide themwith a 30-day notice prior to anylayoffs. Thus when a district discov-ers at the time of its interim reportthat it is facing a budget deficit, itsoptions are limited.
If the problem is a question ofcash flow in the short term—withexpenditures needing to be made before funds become available—dis-tricts can issue short-term tax rev-enue anticipation notes (TRANs).They may also borrow temporarilyfrom other funds, such as the build-ing fund or a special reserve. If theproblem is a more serious structuralimbalance between revenues and ex-penditures, districts with healthy re-serves often depend on them to getthrough the year—a short-term fix.
Collective bargaining agreements arecentral to spending decisionsWith so much of a district’s expendi-tures tied up in personnel, collectivebargaining agreements can have a dra-matic impact on a district’s budget,both in current and future years.
Contract provisions have both obvi-ous and subtle effects on a district’sability to align its expenditures withits priorities. An increase in salaryand benefits is just one facet of that.
Another significant factor is adistrict’s salary schedule. Most dis-tricts determine the salary level fortheir teachers and the majority ofother employees based on a schedulethat includes “steps” for years ofservice in the district and “columns”for the amount of education ortraining employees receive. Staffseniority usually has the greatest in-fluence on average salaries and thuson the percentage of the budget that is spent for personnel. In gen-eral, the base salary of most senior teachers is about twice as much asnew teachers.
The structure of the salary sched-ule and the amount of any salary in-crease has predictable multiyear costimplications. The district needs toconsider the long view in negotia-tions and budget development.
Another significant cost is em-ployee benefits including paid vaca-tions and holidays, sick leave, healthcare, life insurance, and retirementplans. The state requires some ofthese, such as retirement and work-ers’ compensation. Virtually everydistrict in the state pays for addi-tional employee benefits, but theyvary substantially in the amount theyspend, the manner in which theystructure them, and the extent towhich they expect employees to sharethe cost. All of these things must benegotiated. Controlling the cost ofbenefits can be crucial for a district’sfinancial health. Many districts use abenefits cap for this purpose, agree-ing in the employee contract to pay aset maximum per employee.
The contract provision with thenext greatest financial impact is ar-
10 ● Understanding School District Budgets ● January 2005
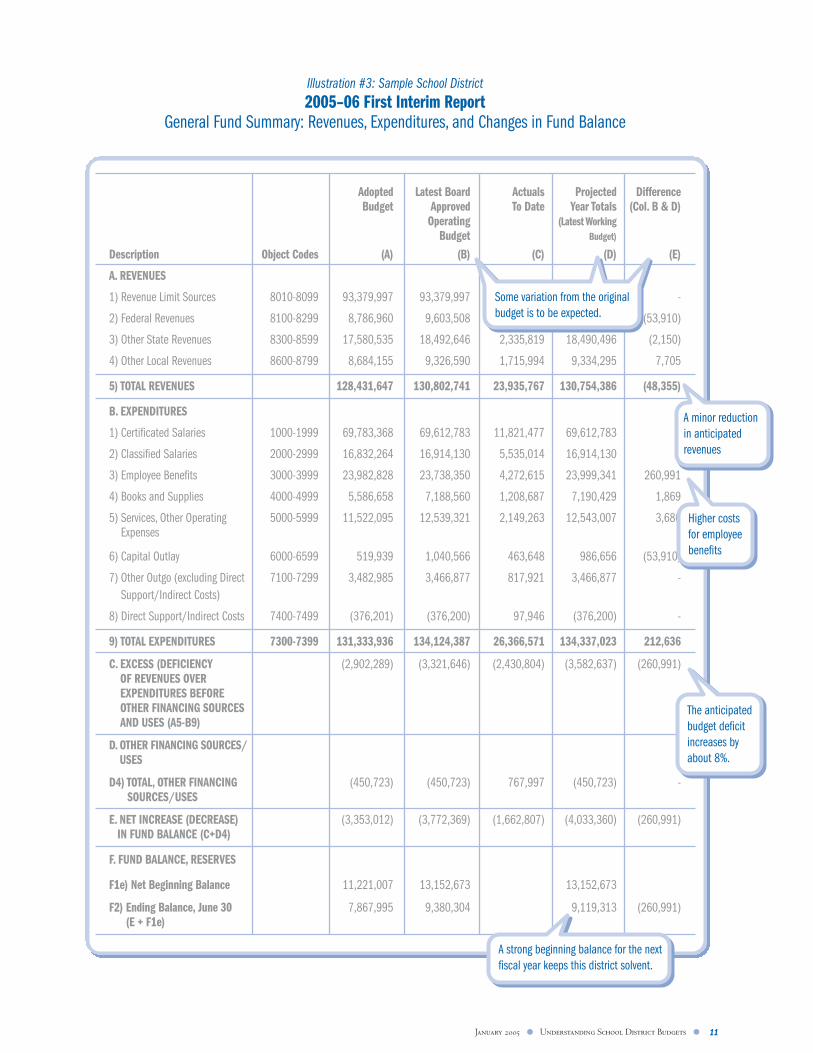
January 2005 ● Understanding School District Budgets ● 11
Adopted Latest Board Actuals Projected DifferenceBudget Approved To Date Year Totals (Col. B & D)
Operating (Latest WorkingBudget Budget)
Description Object Codes (A) (B) (C) (D) (E)
A. REVENUES
1) Revenue Limit Sources 8010-8099 93,379,997 93,379,997 18,057,774 93,379,997 -
2) Federal Revenues 8100-8299 8,786,960 9,603,508 1,826,179 9,549,598 (53,910)
3) Other State Revenues 8300-8599 17,580,535 18,492,646 2,335,819 18,490,496 (2,150)
4) Other Local Revenues 8600-8799 8,684,155 9,326,590 1,715,994 9,334,295 7,705
5) TOTAL REVENUES 128,431,647 130,802,741 23,935,767 130,754,386 (48,355)
B. EXPENDITURES
1) Certificated Salaries 1000-1999 69,783,368 69,612,783 11,821,477 69,612,783 -
2) Classified Salaries 2000-2999 16,832,264 16,914,130 5,535,014 16,914,130 -
3) Employee Benefits 3000-3999 23,982,828 23,738,350 4,272,615 23,999,341 260,991
4) Books and Supplies 4000-4999 5,586,658 7,188,560 1,208,687 7,190,429 1,869
5) Services, Other Operating 5000-5999 11,522,095 12,539,321 2,149,263 12,543,007 3,686Expenses
6) Capital Outlay 6000-6599 519,939 1,040,566 463,648 986,656 (53,910)
7) Other Outgo (excluding Direct 7100-7299 3,482,985 3,466,877 817,921 3,466,877 -Support/Indirect Costs)
8) Direct Support/Indirect Costs 7400-7499 (376,201) (376,200) 97,946 (376,200) -
9) TOTAL EXPENDITURES 7300-7399 131,333,936 134,124,387 26,366,571 134,337,023 212,636
C. EXCESS (DEFICIENCY (2,902,289) (3,321,646) (2,430,804) (3,582,637) (260,991)OF REVENUES OVER EXPENDITURES BEFORE OTHER FINANCING SOURCES AND USES (A5-B9)
D. OTHER FINANCING SOURCES/USES
D4) TOTAL, OTHER FINANCING (450,723) (450,723) 767,997 (450,723) -SOURCES/USES
E. NET INCREASE (DECREASE) (3,353,012) (3,772,369) (1,662,807) (4,033,360) (260,991)IN FUND BALANCE (C+D4)
F. FUND BALANCE, RESERVES
F1e) Net Beginning Balance 11,221,007 13,152,673 13,152,673
F2) Ending Balance, June 30 7,867,995 9,380,304 9,119,313 (260,991)(E + F1e)
Some variation from the original budget is to be expected.
A minor reduction in anticipated revenues
Higher costs for employee benefits
The anticipated budget deficit increases by about 8%.
A strong beginning balance for the next fiscal year keeps this district solvent.
Illustration #3: Sample School District2005–06 First Interim Report
General Fund Summary: Revenues, Expenditures, and Changes in Fund Balance

12 ● Understanding School District Budgets ● January 2005
guably class size because it relates sodirectly to how many teachers thedistrict must employ. Other thingssuch as retiree benefits, hours of em-ployment, preparation periods, leavepolicies, safety measures, and thetiming of pay adjustments can alsohave a substantial impact on a dis-trict’s bottom line.
While union negotiations are al-most always done in private, unionproposals and district responses, thesalary schedule, and the collectivebargaining agreement are public doc-uments. Further, with the passage ofa new state law in 2004, the districtsuperintendent and chief businessofficial are now required to certify inwriting that the costs incurred by thedistrict under a proposed collectivebargaining agreement can be metduring the term of the agreement. Itis critical to a district’s long-term fis-cal health that the multiyear impactof any collective bargaining agree-ment be analyzed before it is offi-cially adopted.
Under state law, employee con-tracts must be renegotiated at leastevery three years, but there is oftenan agreement that salary and benefitswill be negotiated annually. Somedistricts, however, commit to multi-year salary agreements.
Assessing a district’s financial conditiongoes beyond the General FundA number of expenses accounted foroutside of “regular K–12 educa-tion” can affect the district’s financialsolvency. The most obvious is facili-ties. For example, when the heatingsystem gives out, a district has to fixit. Absent funds set aside for such aneed, the money will come out ofthe General Fund. Several other fi-nancial obligations can also affect adistrict’s ongoing revenues or expen-ditures in unexpected ways.
Special Education requires local funds Special Education, which providesextra services for students with dis-abilities, is the largest categorical pro-gram in California in terms ofdollars. In the district’s General Fund,Special Education revenues and ex-penditures are accounted for in the re-stricted category. However, the lawrequires that the allocation of thoserevenues and many of the expendituredecisions occur outside of the localschool board’s budget authority.
The state provides the bulk ofSpecial Education funding as a rateper unit of ADA (based on the totalnumber of students in the district).The funds are then targeted to thosestudents identified as eligible forSpecial Education. However, thefunds do not go directly to the dis-trict but to a Special Education LocalPlan Area (SELPA). The governingboards of the SELPA’s member dis-tricts and agencies approve a plan forits governance, and their superinten-dents make sure the plan is imple-mented. It is up to the SELPA toallocate the funding based on formu-las that the member agencies haveformally approved. These formulasvary from one SELPA to another.
The law requires that SpecialEducation services be provided re-gardless of which agency pays forthem. Both the state and the federalgovernment provide substantialfunding, but not enough to cover theentire cost of the required services.All California school districts are ex-pected to contribute a portion oftheir unrestricted General Fundmoney to provide services to theirSpecial Education students. Whilethe amount the state and federal gov-ernments will contribute is set at thebeginning of each school year, thefull cost of services can be quite un-predictable as it is driven by student
needs. Further, the cost per studentvaries. And in some SELPAs, the for-mula may treat all districts uniformlyeven though their obligations vary.For these reasons, it is not unusualfor a district’s General Fund contri-bution to Special Education to ex-ceed its estimates. The resultingencroachment on a district’s operat-ing budget can become a source ofserious concern for district officials,particularly because it is not withinthe district’s direct control.
Joint powers agreements providemanagement optionsA SELPA is one example of a jointpowers agreement (JPA). Districtsparticipate together in JPAs in orderto provide specialized services moreeffectively and efficiently than theycan on their own. This can be for in-structional purposes, such as occupa-tional education programs; supportservices, such as transportation; orcentral administrative services, suchas accounting. Some districts haveused a JPA for the purpose of nego-tiating and managing employee bene-fits and other insurance purchases inorder to keep costs down.
The state has set clear guidelinesfor tracking JPA expenditures andrevenues so that they remain separatefrom district finances. This also en-sures that they are not counted twicein the statewide financial totals theCalifornia Department of Education(CDE) collects and reports.
Upcoming requirements for reportingretiree benefits could affect budgets More than half of the districts inCalifornia offer their retirees somehealth insurance benefits. New ac-counting rules issued by theGovernmental Accounting StandardsBoard (GASB) in June 2004 willsoon require districts to show these

January 2005 ● Understanding School District Budgets ● 13
and other similar post-employmentbenefits as liabilities on their finan-cial statements. The new require-ments under GASB 45, as the newlaw is commonly called, will bephased in. The largest districts mustcomply first. Beginning with the2007–08 school year, districts thathad revenues of more than $100million in 2000 will be the first tohave to meet the new rules.
In the past, many districts onlyreported the annual cost of retireebenefits in their financial statements.Under the new rules, districts willstill have to recognize those annualcosts as current expenses in theirbudgets and will also have to recog-nize future obligations as liabilitiesin their projections for future years.They will have some flexibility onhow they calculate the projectedcost based on assumptions aboutrisk and life expectancy, but theywill have to report the number ofretirees and active employees eligiblefor the services.
School Services of California, aschool-management consulting firm,reports that some districts wereshocked at the magnitude of theirfuture obligations when they wereaccounted for in this way. Districtsmay have to renegotiate some ofthese benefits for retirees with theirunions or face negative consequencesbecause of these accrued obligations.
Charter school finance is still evolvingCharter schools represent relativelynew entities in the school financesystem. In some instances a charterfunctions like a school within a dis-trict, but at other times it may actmore like a separate agency. Therules have evolved as these dual identities have become more clearly defined, but the funding processcontinues to change.
Most charter schools receivetheir funding as a uniform, setamount per pupil. One allocation is for general purposes and anotheris a “categorical block grant” that represents aggregate funding formore than 40 categorical programsschool districts can receive. All ofthese funds are discretionary andare distributed to charter schoolsbased on their ADA. The amountsvary depending on the age of theschool’s students, with the stateproviding more money as studentsget older.
Some specific financial issues—often the result of state regula-tions—challenge relations betweendistricts and charter schools. For ex-ample, in unified districts the rev-enue limit amount is the same for allstudents. However, districts passfunding on to their charter schoolsbased on the charter school grade-level apportionments. Thus, an ele-mentary charter is entitled to less perpupil than the district receives fromthe state, while a charter high schoolis entitled to substantially more.
State law also specifies a month-by-month allocation process for charter schools that is not fully syn-chronized with when districts receivefunding. This is especially true withproperty tax revenues because districtsdo not receive their property taxesuntil December each year. This type ofinconsistency creates cash flow prob-lems in some districts. Resolving dis-trict versus charter obligations forSpecial Education students and facili-ties can also be difficult.
Financial relationships are gen-erally negotiated as part of thechartering process, but disputes are still common. Districts are precluded from considering fiscalimpact in deciding whether to approvea charter.

14 ● Understanding School District Budgets ● January 2005
There is tremendous variation in thesize, location, and student diversity inCalifornia’s 985 school districts and58 county offices. While their budg-ets differ accordingly, all of themmust meet common state require-ments, such as budget deadlines, bal-anced budgets, and the responsibilityto invite public comment. In addi-tion, districts are required to submitspecific reports to the county super-intendent and to commission a finan-cial audit each year.
California has standardized manyschool district accounting and re-porting forms in an effort to furtherincrease accountability for the use ofpublic funds. One strong motivationwas to create an early warning systemto help avert a financial crisis, such asbankruptcy and/or the need for anemergency loan from the state. Mostof these apply to every local educa-tion agency (LEA). LEAs includecounty offices of education, schooldistricts, joint powers agencies, andcharter schools that receive theirfunding directly from the state.
In 1991 Assembly Bill (AB)1200 created a formal process of re-view and oversight that furtheredthese goals. The process requires thecounty superintendent to approve thebudget and monitor the financial sta-tus of each school district and JPA inits jurisdiction. County offices of ed-ucation today perform a similar func-tion in regard to many charterschools. The CDE, in turn, reviewsthe finances of county offices.
In 2004 lawmakers strengthenedthese fiscal accountability provisionswith the passage of AB 2756. Thenew law calls for the state to updatethe standards and criteria used for the fiscal oversight of LEAs.These new standards take effect in
2006–07. The law also made imme-diate changes in the process countyoffices use to review district budgetsand interim reports.
The county superintendent reviewsdistrict finances several times annuallyEach year, local LEAs submit to thecounty superintendent at least five finance-related documents for reviewthat are then submitted to the statesuperintendent of public instruction.They include the district’s preliminarybudget passed by July 1, the first andsecond interim reports, an unauditedfinancial report at the end of thebudget year, and the district’s annualaudit a few months later. (County offices submit their own budgets andreports directly to the state superin-tendent for a similar review.)
The process begins with thebudget adopted in July. Based on itsreview, the county superintendentapproves a district’s (or charterschool’s) budget, approves it condi-tionally, or disapproves it. Districtswith approved budgets proceed withthe implementation of their pro-grams as planned.
A conditional approval becamean option with the passage of AB2756 in 2004. In this case, thecounty superintendent submits tothe district governing board writtenrecommendations for revising thebudget, which may include specificbudget adjustments. The county su-perintendent can also appoint a fiscaladviser and/or convene a committeeto review those recommendations.The governing board of the districtmust submit a revised budget to thecounty office after holding a publichearing. The county at that pointmust either approve or disapprove thebudget. If the county finds that the
State reporting and oversight requirements establish budget standards
County superintendents can chooseone of three financial certifications
When reviewing interim reports, thesuperintendent of the local county officeof education issues one of three certifica-tions in regard to an LEA’s ability to meetits financial obligations for the currentfiscal year and the next two years:
Positive = the LEA will meet its obligations.
Qualified = the LEA may not be able tomeet its obligations.
Negative = the LEA will be unable to meet its obligations.

budget revisions were not sufficientor appropriate, it can use that as thebasis for a qualified or negative certi-fication at the time of the first in-terim report in December, even if therevised budget is ultimately approved.
In the case of a budget disap-proval, the county superintendentmust call for the formation of abudget review committee (BRC).With approval of the CDE, thecounty and district can agree to waivethis requirement. If the BRC iswaived or if both the BRC and thestate superintendent disapprove thebudget, the county superintendentmust, in consultation with the statesuperintendent and the district gov-erning board, develop and adopt abudget and fiscal plan for the district.The county superintendent may alsostay or rescind any action that is in-consistent with the adopted budget.
If a district does not submit abudget to the county superintendent,the county superintendent is to de-
velop a budget for that district bySept. 15 at district expense. Thestate superintendent is required toreport to the Legislature and thestate director of finance if any dis-trict does not have an adoptedbudget by Nov. 30.
The next official review occurswith the LEA’s First Interim Report.The county superintendent issues apositive, qualified, or negative certifi-cation based on this review. (See thebox on page 14.) The same processand reporting accompanies theSecond Interim Report. When a dis-trict receives a qualified or negativecertification, it loses some of its fi-nancial autonomy. Its collective bar-gaining agreements are subject tocounty office scrutiny prior to boardapproval, and it is prohibited fromincurring specific nonvoter-approvedfinancial obligations (such asTRANs). It will also have additionalreporting obligations, including aThird Interim Report due June 1.
District warning signs that can trigger budget disapprovalAB 2756, passed in 2004, requires the use of 15 predictors developed by the Fiscal Crisis and Management Assistance Team (FCMAT) as onebasis for evaluating a district’s adopted budget. If an external reviewer has found more than three of the following in evidence, the county super-intendent must withhold budget approval unless the district can provide adequate assurances that it is able to meet its financial obligations.The official list of 15 predictors is as follows:
1. Governance crisis
2. Absence of communication to educational community
3. Lack of interagency cooperation
4. Failure to recognize year-to-year trends
5. Flawed average daily attendance (ADA) projections
6. Failure to maintain reserves
7. Insufficient consideration of long-term bargaining agreement effects
8. Flawed multiyear projections
9. Inaccurate revenue and expenditure estimates
10. Poor cash flow analysis and reconciliation
11. Bargaining agreements beyond state cost-of-living adjustment (COLA)
12. No integration of position control with payroll
13. Limited access to timely personnel, payroll, and budget controldata and reports
14. Escalating General Fund encroachment
15. Lack of regular monitoring of categorical programs
These items are part of a comprehensive list: “FCMAT Predictors ofSchool Agencies Needing Intervention.” In its role as a financial adviser,FCMAT has found these to be the most common school agency prob-lems.The full list and further explanation is available at: www.fcmat.org
January 2005 ● Understanding School District Budgets ● 15

FCMAT helps with planning, managingDistricts with financial problemsoften receive help from the FiscalCrisis and Management AssistanceTeam (FCMAT). This state-fundedorganization is overseen by an advi-sory board made up of county officeand school district superintendents,plus an administrator from theCDE. Legislators (AB 1200) cre-ated FCMAT in order to provide assistance to districts with financialproblems or other managementneeds. FCMAT is establishing re-gional teams of experts that can beused as budget advisers when neededas part of the new review require-ments. It also provides training forschool business officials.
Particularly during difficult eco-nomic times, some school districtshave only avoided financial insol-vency by receiving emergency finan-cial support from the state. Whenthe state provides such a loan,FCMAT has a more official role. Itconducts an assessment of major op-erational areas in a district and thendevelops an improvement plan, pro-viding progress reports to both localand state authorities. The state also
appoints an administrator who, at aminimum, has veto power over dis-trict actions. When the amount ofthe loan exceeds a set threshold, thestate appointed administrator takescontrol of the district. The boardthen loses its decision-makingpower, and the district superinten-dent must be dismissed.
The audit provides a final check ofdistrict financial proceduresBy law, every school district musthire an independent auditor who re-views its financial records once thebooks are closed for a given schoolyear. Each district must submit itsaudit report to the county office ofeducation, the CDE, and the statecontroller.
The audit is an after-the-factlook at how the district operated. Ittells the governing board and thepublic about the integrity of the dis-trict’s financial systems and practices.Formally presented at a public meet-ing, the report includes a manage-ment letter that highlights anyconcerns or problems the auditorsfound—including serious “audit ex-ceptions”—plus recommendations
for addressing them. Districts mustthen provide information on whetherthe findings have been addressed andthe conditions corrected.
An audit is an advisory docu-ment intended to help a district im-prove its financial management. Theabsence of audit exceptions does notnecessarily mean a district has no fi-nancial worries. Similarly, a long listof recommendations does not meanthat district staff members are actingirresponsibly. The audit is intendedto provide important informationwith which to help evaluate a dis-trict’s operations and its future finan-cial health, but it is just one of manytools for doing that evaluation.
County offices have long been ex-pected to review district audits and report audit exceptions related to at-tendance, inventory of equipment,and internal controls. Beginning withthe 2004–05 school year, they arenow also required to inform the statesuperintendent of public instructionand the state controller’s office if anyaudits include exceptions related toinstructional materials, teacher mis-assignments, and school accountabil-ity report cards (SARCs).
16 ● Understanding School District Budgets ● January 2005

January 2005 ● Understanding School District Budgets ● 17
The budget documents and officialfinancial reports that districts pre-pare for the county office and statefollow prescribed governmental accounting conventions and state requirements. They must be ac-curate and thorough. But the formatneeded for consistent state reportingoften differs from what the lay public—including school boards andmany district officials—needs inorder to understand the significanceof the information.
While the official budget is im-portant for understanding a district’soverall fiscal condition, it leavesmany of the most important day-to-day questions about district decisionmaking unanswered. Districts canuse the same data they compile forthese official documents to create reports for their boards and the public that make school district finances clearer. These reports can illuminate a district’s fiscal condi-tion, provide important details related to specific schools and programs, look at change over time,and facilitate comparisons. In otherwords, they can describe how effec-tively the district is managing its resources to meet its priorities, address performance issues, and con-trol its future. The state’s account codestructure helps make this possible.
Districts can align priorities andresources with performance goals A budget document reveals a greatdeal about a district’s priorities, evenwhen those are not explicitly stated.Often such priorities become clearthrough a comparison with similardistricts. Wage levels are a good ex-ample. A district’s officials may be-lieve that having a generous salaryschedule will ensure that the district
has high quality teachers. They maydecide it is worth having largerclasses in order to accomplish thatgoal. Comparing both the salary lev-els and class sizes to those in otherdistricts should highlight that deci-sion. Another district may believethat having additional certificatedstaff work as coaches is more impor-tant than providing instructionalaides for teachers. That district mayhave a higher share of its expendi-tures in certificated salaries and alower share in classified salaries.
Some district policies are spelledout in budget documents. For exam-ple, a district may choose to allocatesupplies to school sites based on en-rollments, programs, or some otherformula. It may distribute counselingservices based on student characteris-tics rather than just the number ofstudents. Each strategy is likely to givesome schools an advantage and othersa disadvantage. Such trade-offs can beevaluated against the district’s goalsfor student performance. “Equal”services at a school with students whoare already behind might be counterto a district commitment to narrowthe achievement gap. On the otherhand, reducing the services or enrich-ment programs available to high-performing students may not makesense if the district’s highest priorityis to improve college admissions.
New ideas for improving educa-tion emerge constantly. Some aremandates from the state or federalgovernment, some are initiatives thatpromise additional funds, and someare supported by staff or communitybut depend on existing district re-sources. Some are “experiments” inthe truest sense of the word, and oth-ers are well proven. All, however, havesome fiscal impact. A thorough finan-
cial analysis can help ensure that suchinitiatives get the resources necessaryto be successful and that they do notinadvertently hurt other efforts.
Implementing new ideas can alsomean abandoning old ones. Someexperts suggest that districts directlylink any expenditure increase for anew program to an expenditure de-crease somewhere else. They alsocounsel against simply building on“what is” by using only new dollarsfor district priorities and assumingthat all other expenses will remainthe same.
SACS makes new analyses easierThe state’s standardized accountcode structure (SACS) provides allCalifornia school districts with auniform and comprehensive chart ofaccounts that they must use to cate-gorize each revenue and expenditure.This system, which was first intro-duced in the 1990s, represented amajor transition from previous ac-counting requirements.
As of the 2003–04 school year,all districts must report their finan-cial information electronically usingSACS. The uniform use of thesecodes is expected to dramatically im-prove the ability of school districtsand the state to analyze school ex-penditures and extract more usefulinformation for policymakers, edu-cators, and the public. Districts varyin how skilled and how motivatedthey are to change their budget re-porting and analysis practices to takeadvantage of these capabilities. (Seethe box on page 18 for a listing ofthese codes and their uses.)
Using the SACS categories, fi-nancial information can be displayedin a number of ways that connectrevenues and expenditures to specific
Budgets can link finance decisions to performance and priorities

18 ● Understanding School District Budgets ● January 2005
district goals and activities. Schooland department level data can add tothe sophistication of these budgetanalyses. SACS facilitates reportsand comparisons that were previ-ously extremely difficult or even im-possible. However, districts have
flexibility in the extent to which theyuse the system. They also vary intheir interest in going beyond re-quired reports and in their profes-sional capacity to do so.
For example, districts use SACS tobreak out their expenditures into gen-
eral categories of goals and functions.However, the system also facilitates thecreation of more detailed categoriesbased on the priorities and programsdistricts wish to examine more closely.For example, the state requires that adistrict track instruction expenditures
Districts track budget items using the standardized account code structure (SACS)
Category Major subcategories
Fund ● Governmental funds (including General Fund, Special Revenue, Capital Project, Debt Service, and Permanent funds)
● Proprietary funds ● Fiduciary funds
Resource ● Unrestricted resources ● Unrestricted resources with special reporting requirements● Restricted resources (including restricted revenue limit, federal,
state, and local resources)
Goal (Program) ● Instructional (including regular K–12 education, adult,specialized services, supplemental education, Special Education, regional occupational center/program, and nonagency)
● Other goals (e.g., community services and child care)● Undistributed
Function (Activity) ● Instruction● Instruction-related services (e.g., supervision, library, school
administration)● Pupil services (e.g., counseling, health services, transportation)● Ancillary services (e.g., athletics)● Community services● Enterprise (services provided for a fee)● General administration● Plant services (e.g., maintenance, rents)● Other outgo (e.g., debt service)
Object ● Revenues, including revenue limit sources, federal revenue,other state revenues (e.g., categorical programs, state lottery),and other local revenue
● Expenditures, including certificated salaries, classified salaries, employee benefits, books and supplies, capital outlay, and other outgo
School ● The district may assign a code for each school.
Explanation of use
Each fund is a self-balancing set of accounts recording financialresources and liabilities. Revenues and expenditures are postedin the fund that will be used to administer them.
This indicates whether the revenues come from general purposefunds or from a restricted source, such as a categorical program.
Expenditures are tracked by goal when applicable, which identi-fies the instructional setting or group of students receivingservices. Expenditures that cannot be directly assigned to a goalare coded to Goal 0000, Undistributed.
Functions track the general operational area and group togetherrelated activities. Many functions, such as instruction, serve avariety of goals.
For revenues, the object code identifies the general source andtype of funds. For expenditures, it identifies the type of item orservice being purchased. District line-item budget reports usuallyreflect fund and object-level information.
Districts must provide the capacity to include this field in theiraccounts, but state reporting at the school level is currentlyoptional.

(other than Special Education) usingthe 1000 function code. However,local districts can use codes1001–1099 to create their own in-struction categories that might be bygrade level, subject, or some other vari-able they want to be able to analyze.
When districts use these data inconjunction with traditional objectcodes—and with department or site-level information—they can performquite detailed analyses. Some districtslook at the differences in total supportthey are providing to elementary, mid-
dle, and high schools. Some examinehow particular categorical funds—such as Instructional Materials orEconomic Impact Aid—are distrib-uted. A few use SACS as the founda-tion for data systems sophisticatedenough to analyze all their expendi-
January 2005 ● Understanding School District Budgets ● 19
Description Adopted 2005–06 Actuals 2004–05
POSITIONS
K–5 Teachers 191.80 194.90
6–8 Teachers 69.60 71.60
ESL Teachers 4.00 4.00
Teacher On Spec Assignments 1.40 1.40
Sub Teacher Sick Leave 0.00 1.00
Certificated Salaries 266.80 272.90
EXPENDITURES
Teachers Salaries 640
K–5 Teachers 9,230,329 9,071,026
Science Teachers 550
Phys Ed Teachers 800
6–8 Teachers 3,605,642 3,694,492
Other Teacher Salaries 50 93,347
ESL Teachers 201,936 343,437
Teacher On Spec Assignment 83,059 136,556
Administrator Spec Assignment 120
Substitute Teacher—Vacant Positions 180,465
Substitute Teacher Sick Leave 456,391 355,366
Sub Teachers Curriculum Development 3,000 47,136
Subsitute Teachers—Jury Duty 2,810 5,796
Substitute Teachers—Negotiations 520
Substitute Teachers—Other 90 12,591
Substitute Teachers—Industrial 2,675 1,730
Teachers—Others 40,957
Certificated Salaries 13,586,622 13,984,888
Using SACS, a district can examine staffing assignments and costs in detail.
Salary data are based on actuals, not averages. Does this big decrease in costs indicate an influx of newly credentialed ESL teachers?
Illustration #4: Sample School District2005–06 Program Summary, Certificated Salaries

tures in a general category, such as theprofessional development of teachersor district office support services.These reports make it possible to ex-amine the amount of categoricalfunding, detail how the funds are used,and describe the full investment a dis-trict is making, including any en-croachment on unrestricted funds.
SACS also makes it possible tolook at the manner in which a partic-ular type of service is being distrib-uted. For example, a report aboutstudent support services, such ascounselors and school psychologists,
could illuminate which schools arereceiving the largest share of theseservices. Tracking these expendituresover time might show how the dis-trict’s investments have changed.Correlating those changes with be-havior records, test scores, and othermeasures could show a relationshipbetween the level of support servicesand student performance.
The development and analysis ofdetailed financial reports can help adistrict more readily estimate thetotal cost of its various activities andprograms. This can then be com-
pared to what the district has de-cided is most important—whetherthat is improving reading instructionin the early grades, addressing theachievement gap with English learn-ers, or improving the percentage ofstudents completing college prepara-tory courses. Is the level of fundingconsistent with district priorities?What other, lower-priority effortsmight the district be able to reduceor eliminate in order to make moreresources available? What would anexpansion of a current high-priorityprogram really cost?
20 ● Understanding School District Budgets ● January 2005
FTES ABC School Special Student Direct District Routine 2005–06 2004–052005–06 Education Transportation Instruction General Repair & Working 2nd Interim
Support Support Maintenance Budget Budget
Site Enrollment 749
Certified Salaries 229 1,870,226 1,628,444 0 1,901,883 285,094 0 16,203,377 16,423,129
Classified Salaries 99 278,835 536,519 232,434 291,967 1,249,021 202,922 4,265,860 4,258,751
Employee Benefits 691,333 683,649 114,862 276,303 868,030 81,778 6,048,670 5,452,052
Total Salary and Benefit Expense 328 2,840,394 2,848,612 347,296 2,470,153 2,402,145 284,700 26,517,907 26,133,932
Books & Supplies 38,291 16,745 24,333 336,857 161,607 39,500 1,051,481 2,020,938
Contract, Services and Other 170,268 908,413 446,706 437,686 938,529 87,400 3,886,633 4,264,560
Capital Outlay and Equipment 10,000 10,000 141,884
Other Outgo 2,554 0 0 100,512 (94,244) 0 14,331 38,093
Total Expenditures 3,061,507 3,773,770 818,335 3,345,208 3,408,037 411,600 31,480,352 32,599,407
Interfund Transfers to Other Funds
To Cafeteria Fund 25,000 25,000 57,306
To Deferred Maintenance Fund 157,402 157,402 130,000
Total Expenditures 3,061,507 3,773,770 818,335 3,345,208 3,590,439 411,600 31,662,754 32,186,713
Illustration #5: Sample School District2005–06 Adopted Budget
General Fund Expenditures by School and Program
Removed from this display are the expenditures for the other eight schools in the district.
Districtwide programs are accounted for separately.
Using object codecategories ties this report to the overall district budget.
Subtotals for personnel costs include benefits.
A comparison over time shows budget cuts.
January 2005 ● Understanding School District Budgets ● 21
Site-level budgeting and reporting canprovide valuable insightsWhile the state requires districts tohave a place for site-level informa-tion in their financial data under theSACS system, it does not requirethem to compile or report expendi-tures by individual school. Many experts, however, believe that school-level data is an essential part of acomplete budget report because itprovides information about expendi-tures at the point where they mostdirectly affect students—at theschool site.
The audiences for school-levelbudget information can be quite diverse. New parents may most appreciate a straightforward visualpresentation that provides basic sum-mary information. Staff will likelybe interested in the level of districtresources the school receives basedon student needs and in comparisonto other schools. District officials,including the school board, benefitfrom the most robust and nuancedinformation, including comparisons.They also need to be able to provideclear data to the media and to thosestaff—and community and parentadvocates—interested in broad dis-trictwide issues of accountability,equity, and funding adequacy.
School budget reports come in manyshapes and sizesWhen they are available, school-level budgets take many differentforms. The most comprehensiveones report the cost of every dis-trict resource that goes to theschool, including the actual salariesand benefits of all staff; the value ofshared resources, such as district of-fice business and maintenance serv-ices; and site-level discretionarybudgets, such as Title I funds,grants, and supplies.
Some districts only provideschool budgets that report on the ex-penditures over which the site hasdiscretion. Others will summarize theamount of discretionary funds andperhaps compare what variousschools receive, but they will not de-scribe how the sites spent the money.In many districts, the reports com-bine financial information with stu-dent demographics to help putcategorical funding for specific popu-lations—such as Special Educationand Title I—into perspective. In afew districts, reports also include per-formance information.
Concerns about equity among schoolsmay prompt more robust reportingBoth the state and federal govern-ments have begun holding districtsand schools accountable for improv-ing student performance. Critical tomeeting this expectation is their abil-ity to narrow the achievement gap byfocusing on the academic improve-ment of the lowest-performing stu-dents. Students from low-incomefamilies and those who need to learnEnglish are statistically more likelyto be in this group. Districts havedata that show the concentration ofthese students in each school.
Helping these students achievemore will require that they receive additional services targeted to their educational needs. It would follow thatschools serving high concentrations ofdisadvantaged students will need to receive the personnel and materialsnecessary to provide those services ifstudent performance is to improve.
However, public education hascome under increasing fire for notproviding even basic resources atsome of the schools that serve themost disadvantaged students. InCalifornia, a lawsuit charging thatthis was the state’s responsibility was

22 ● Understanding School District Budgets ● January 2005
Enrollment School X School Y School Z
Regular Education 368 379 307
Special Education Day Class 21 12
English Proficiency 145 102 27
Total Enrollment 534 481 346
School Budget FTE BUDGET FTE BUDGET FTE BUDGET
TeachersRegular Education 23.40 1,253,749 22.40 1,200,170 14.80 792,969
Other 3.00 160,737 1.00 53,579 2.00 107,158
Subs/ Temps 27,734 24,101 17,450
Librarians
Counselors/Guidance
Principals/Vice Principals 1.00 85,826 1.00 85,826 1.00 85,826
Clerical 1.38 43,763 1.50 48,808 1.44 45,357
Instructional Aides 2.63 67,597 0.63 15,731 2.13 54,922
Other Classified
Campus/Noon Duty Monitors 0.75 6,723 0.56 5,043 0.75 6,762
Operations, Other 2.00 58,657 2.00 56,924 2.00 58,455
Employee Benefits 492,990 422,910 343,174
Instructional Materials/Supplies 27,400 19,072 10,800
Services/ Other Operating Expenses 60,080 51,634 43,681
Capital Outlay 3,000
Subtotal Expenditures 2,288,256 1,983,798 1,566,554
Weighted Student Formula 2,226,426 1,847,990 1,541,163
Estimated Additional Enrollment 21.00 (61,830) 46.00 (135,808) 9.00 (25,391)
Other Resources
Title I 197,955 124,248 102,768
State Compensatory Education
School Improvement Program 45,623 41,327 28,353
Bilingual 39,778 23,704 7,629
Total Budget & Resources 2,571,612 2,173,077 1,705,304
Illustration #6: Sample School District2005–06 Elementary Schools Budget
Salary allocations are based on district averages.
Allocations from categorical funds
Enrollment and number of personnel help describe each school.

January 2005 ● Understanding School District Budgets ● 23
settled out of court in 2004. Thesettlement calls for additional over-sight of school districts to ensurethat the state’s lowest-performingschools have safe facilities, qualifiedteachers, and sufficient textbooks.
Site-level budgets may be a criti-cal component in districts’ ability toprove that they are meeting these newstate expectations. At a broader level,they are the only way districts canevaluate how equitably they are dis-tributing resources and either provethat schools are being treated fairly ormake changes to ensure that they are.
But some district accountingpractices can obscure rather than il-luminate these concerns. For exam-ple, rather than providing actualsalary data, many districts prepareschool budgets that give costs basedon multiplying the number of teach-ers and other staff by the averagesalaries in the district. Some fi-nancial experts question this practice,particularly as it relates to teachers.Counting every teacher as an equalresource can mask substantial differ-ences in the total staffing cost at dif-ferent schools, which would be anindicator of teacher experience andqualifications. For greater clarityabout teacher qualifications, some reformers advocate showing theamount of funding allocated toschools based on actual salariesrather than averages.
The importance of site-level discretionis a matter of opinionSome observers believe that school siteleaders need more control over expen-ditures so that they can better addressthe specific needs of their studentsand thus improve school performance.Others say that district, state, and fed-eral policymakers have an obligationto ensure that all schools operate at anoptimum level and should control the
distribution of resources to betterachieve that goal.
In California and throughout thecountry, new accountability systemsmake individual schools responsiblefor their success in improving stu-dent performance. Yet for the mostpart, school districts decide howmuch control schools have over theresources they receive.
Schools that participate in se-lected state and federal programscontrol at least a portion of theirbudget. In return for that, they mustcomplete a planning process calledthe “Single Plan for StudentAchievement.” Its stated purpose isto improve the academic perform-ance of all pupils, as measured by thestate’s standardized tests. This plan-ning process has taken the place ofearlier approaches to site-level im-provement planning in California,most notably the model previouslyrequired by the state’s SchoolImprovement Program.
The Single Plan is to be developedby a school site council made up ofthe principal, staff, parents, and com-munity members (with representativesof the latter two groups selected bytheir peers). It addresses how the par-ticular categorical funds will be used,but it does not necessarily look at theentire budget for a school. The districtis expected to not only pass the fundsthrough to the school, but also to re-view and approve the plans.
Trend reports confirm and improve thevalidity of budget assumptionsThe budget development processleans heavily on assumptions about adistrict’s students, revenues, and ex-penses. Examining trend reports canhelp improve the validity of these as-sumptions. By looking over districtbudgets for several years, it is possibleto identify patterns and past errors in

Free software helps make user-friendly budgets easier to developPart of making any budget document helpful to the general public is to also provide background information that puts the information intocontext. For example, an explanation of a program’s function and objectives should accompany a program budget. Easy-to-read charts andgraphs are also important.
Free budget software available to all California school districts provides examples of effective district, program, and school site budgets,templates for producing these types of reports, and suggested text for many of the reports, including programs common to most districts.
User-Friendly Budgets is available free from School Services of California through a grant from the Fiscal Crisis and Management AssistanceTeam (FCMAT) and the Girard Foundation. The CD-ROM includes both software templates and a wide variety of samples from districts through-out the state that have used the templates to present budget information.
Information about getting this software is available at: www.sscal.com/ufb.htm
24 ● Understanding School District Budgets ● January 2005
prediction. Is ADA consistently un-derestimated or overestimated? Hasthe district regularly projected less forutilities than it has spent? Are expen-ditures for health care benefits grow-ing at a faster rate than anticipated?
A sense of a district’s financialhistory—combined with an in-formed look at the future—can alsohelp make the opportunities forflexibility and new programs clearer.For example, a district may see sub-stantial changes in its staffing needsand categorical income as its stu-dent population gets older. On onehand, fewer students will be in sub-sidized small classes. On the otherhand, more will be in high schools,which are traditionally more expen-sive to operate. How might that demographic change affect the district’s revenues and its expendi-tures? Will it require a realignmentof priorities that could have far-reaching effects?
Financial forecasting—essentialto building and managing school dis-trict budgets—is increasingly requiredby the state as well. Collecting dataand developing assumptions are bothimportant steps in being able to makefinancial projections. Using comput-
erized accounting systems and SACSdata, district staff can develop “whatif ” scenarios that attach costs to suchproposals as program changes andsalary increases. This can help districtofficials weigh their options with aclearer picture of the fiscal impacts.
Getting beyond the complexitiespromotes better use of informationCalifornia’s school finance system isundeniably complicated. The chal-lenge of just complying with stateregulations for financial accountingand reporting is substantial. Yet suchcompliance is just the first step inbudgeting.
Districts that are committed toimproving student performance usefinancial information to facilitatetheir objectives. They make sure thatthey are funding the programs andpriorities they believe are most im-portant. They tie their expendituresto student and school informationabout demographics and per-formance in order to evaluate their“return on investment.” And theyproduce budget documents that illuminate their choices and theirchallenges, thus building public un-derstanding and support.
Such sophisticated budget re-porting may challenge the abilities ofdistrict office staff in some schooldistricts. In others, it may revealproblems with the status quo thatcould cause dissension among staff,community members, or the schoolboard. Ultimately, however, it can beinstrumental in ensuring that publicschools fulfill their responsibilities tostudents and taxpayers.

These resources can supplement the information indistrict budgets and help school board members and thepublic develop a more sophisticated approach to budgetevaluation and analysis.● The Education Data Partnership website at
www.ed-data.k12.ca.us provides fiscal data for everydistrict back to 1992–93. It also makes possible“apples to apples” comparisons of district financialstatistics, student demographics, teacher salaries,and student performance.
● The Annenberg Institute’s School Communities ThatWork project at www.schoolcommunities.org pro-vides tools that districts can use to examine theirschool-level allocations more systematically.
● The Fiscal Crisis and Management Assistance Team(FCMAT) at www.fcmat.org has a wealth of resourcesto help districts with their financial management.
● School board members in districts affiliated with theCalifornia School Boards Association (CSBA) can at-tend Masters in Governance workshops that includea comprehensive session on school finance.Information is available at: www.csba.org
● EdSource offers a large number of full-length reportsand shorter publications on school finance, account-ability and assessment, and other key education issues. In addition, we maintain a robust websitewith data, background information, and news onCalifornia education policy: www.edsource.org
To Learn More

4151 Middlefield Rd., Suite 100Palo Alto, CA 94303-4743Phone: 650/857-9604 Fax: 650/857-9618E-mail: [email protected] www.edsource.org