understanding spike buck harvest - texas · a spike is a male deer that is 1.5 years of age or...
TRANSCRIPT

Understanding Spike Buck Harvest
Twenty-six Years of Penned Deer Research at the Kerr Wildlife Management Area
by Bill Armstrong

V
Table of Contents
I. Introduction, Background, and Definitions
II. The Studies
III. Other Related Facts, Results and Discussions:
IV. Applying These Studies to Real World Management Programs
Other management concerns:
VI. Kerr Wildlife Management Area Penned Deer Studies, Publications 1977-1999
VII. Appendices A. Examples of gene interactions on phenotype and examples of changing gene
frequencies in populations B. —Effects of Genetics and Nutrition on Antler Development and Body Size of
White-tailed Deer“. C. —Heritabilities for Antler Characteristics and Body Weight in Yearling White-
Tailed Deer“ D. —Antler Characteristics and Body Mass of Spike- and Fork-antlered Yearling
White-tailed Deer at Maturity“ E. Updated antler characteristic frequency charts for —Effects of Genetics and
Nutrition on Antler Development and Body Size of White-tailed Deer“. F. Updated antler characteristics and body weight by age and yearling status
comparison charts for the bulletin,—Effects of Genetics and Nutrition on Antler Development and Body Size of White-tailed Deer“.
G. Genetic/Environmental Interaction study œ Antler characteristic and body weight trend charts.
Cover: The yellow ear tagged deer is a 3-year old deer that was a spike as a yearling. The larger deer is a 4-year old deer that was a fork-antlered yearling.
1
Understanding Spike Buck Harvest
by Bill Armstrong Kerr Wildlife Management Area
I. Introduction, Background, and Definitions
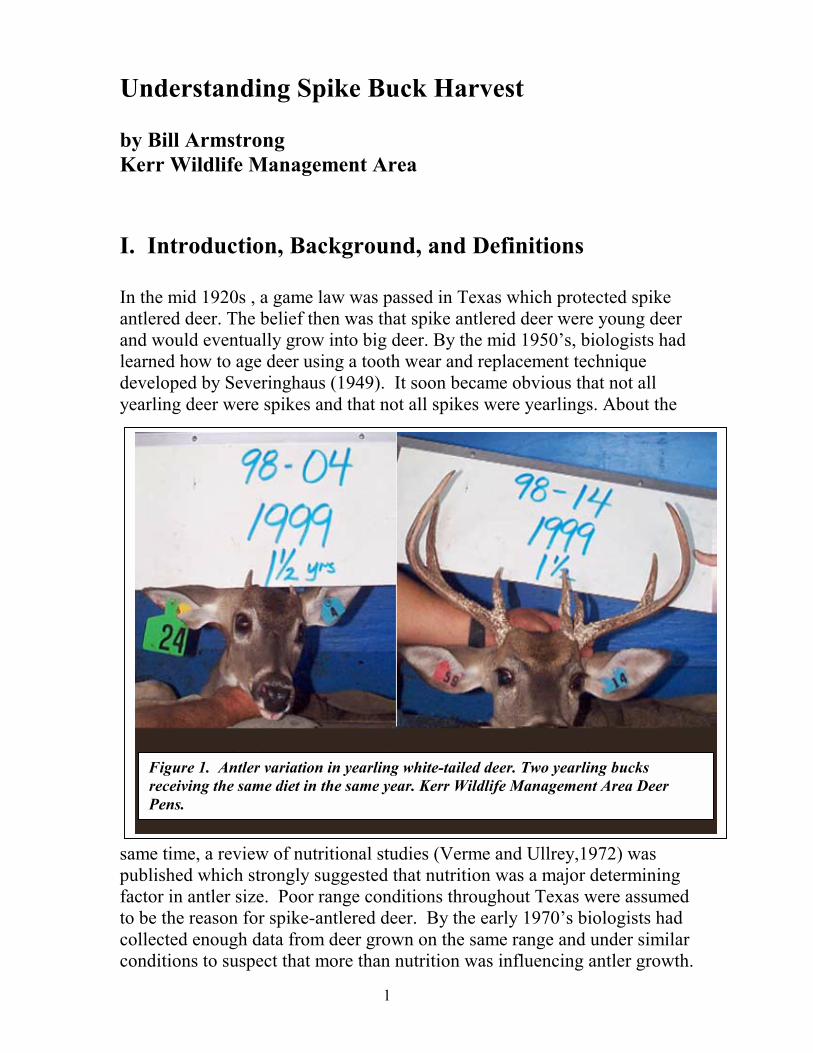
In the mid 1920s , a game law was passed in Texas which protected spike antlered deer. The belief then was that spike antlered deer were young deer and would eventually grow into big deer. By the mid 1950‘s, biologists had learned how to age deer using a tooth wear and replacement technique developed by Severinghaus (1949). It soon became obvious that not all yearling deer were spikes and that not all spikes were yearlings. About the
Figure 1. Antler variation in yearling white-tailed deer. Two yearling bucks receiving the same diet in the same year. Kerr Wildlife Management Area Deer Pens.
same time, a review of nutritional studies (Verme and Ullrey,1972) was published which strongly suggested that nutrition was a major determining factor in antler size. Poor range conditions throughout Texas were assumed to be the reason for spike-antlered deer. By the early 1970‘s biologists had collected enough data from deer grown on the same range and under similar conditions to suspect that more than nutrition was influencing antler growth.

2
Deer that were grown under similar range conditions exhibited a wide range of yearling antler characteristics (Figure 1). In 1974, a 16-acre research facility (now known as the Donnie E. Harmel Deer Research Facility) was constructed on the Texas Parks and Wildlife Department‘s Kerr Wildlife Management Area. Biologists began a long-term research program to understand why some deer produced big antlers and why some deer produced smaller antlers. Research was approached from two viewpoints: one was nutritional and one was genetic. The following is a review of over 26 years of research conducted at these pens and its real world management implications.
What is a Spike
A spike is a male deer that is 1.5 years of age or older and whose antlers are unbranched (Figure 2). It is not a fawn. Fawns may exhibit —bumps“ on
Figure 2. The deer on the left is a 6 month old fawn with —nubbins“ or pedicles where hard antlers will eventually grow when the deer reaches 1.5 years of age. —Nubbin bucks“ are not spikes. The buck on the left is a —nubbin“ buck. The deer on the right is a yearling spike.
their foreheads that are covered with skin. Older fawns may have a small amount of cartilage at the tip of the protrusion. Only in very rare instances

will a fawn have some hard bone tissue on their head. Many people call a fawn that has lost its spots a yearling, biologists do not. When biologists refer to yearlings, they are speaking of a deer that is between one to two years of age.
Why a penned deer facility
In order to study and isolate nutritional effects and genetic effects, biologists need to control diet and breeding and objectively analyze results. This can only be done with penned deer. There are simply too many variables in the natural world to identify and isolate biological causes. In 1973, biologists began gathering deer from throughout the state of Texas and placing them in holding pens. Only Texas deer were used in the research studies. The Pens were completed in August of 1974 and deer were moved from holding facilities and placed in the research pens (Figure 3).
Kerr WMA Deer Pens
2/3 ac breeding pens
RearingPen
RearingPen
RearingPen
Individual working pens
16 Acres
Figure 3. Diagram of the 16 acre deer pen research facility at the Kerr Wildlife Management Area.
In this penned facility, biologists placed a single sire in each breeding pen in October. Most fawns were born in late June or early July. Fawns were ear-tagged and tattooed with a unique number and matched to their dams. If there was a question as to the proper dam, DNA tests confirmed parentage or
3

4
the fawn was not used in the study. Since 1974, no deer have been added. All deer used in research have been born in the pens. Any deer born since 1974 has a pedigree record dating back to 1974.
Some basic deer biology.
Deer grow and lose their antlers yearly. Antler growth begins in March and is completed by the middle of September. During this period, antlers consist of growing bone tissue with a covering of skin commonly called velvet. In September, the velvet is shed leaving only hard bone tissue. This velvet loss is partly due to the production of the male hormone testosterone. The photoperiod or —length of daylight“ triggers production of this hormone.
As far as body growth is concerned, approximately 60 percent of deer growth takes place the first year of its life. Long bone growth in deer is essentially complete after 3 years. This is when a deer completes his —teen age“ years. For the first three years of life, a great deal of nutrient resources are allocated to body growth. After that time, more resources can be channeled into antler growth.
Some Genetic Terms, Principles, and Concepts used in this paper œ
Gene The ultimate unit of inheritance. Genes are attached to chromosomes and are in the germ cells. They control the various trails of an individual.
Two or more genes controlling a trait may be capable of occupying the same position on a chromosome. These genes are said to be alleles. . For example, a dominant gene (see below) along with its recessive form are a pair of
Two or more genes controlling atrait may be capable of occupying the same position on a chromosome. These genes are said to be alleles. For example, a dominant gene along with its recessive form are a pair of
alleles. If there are four genescapable of occupying the same position on a pair ofchromosomes, with each gene producing a little different affecton a trait, these are alleles.
5
alleles. If there are four genes capable of occupying the same position on a pair of chromosomes, with each gene producing a little different affect on a trait, these are alleles
Genes can be divided into two broad groups (1)Dominant genes --A gene or phenotype that is expressed in either the homozygous or heterozygous state. It is a gene that masks the expression of its allele or alleles (if more than two genes). Example: C = black, c = white; CC and Cc produce black coats, cc produces a white coat. Since black is a dominate gene, it takes precedence over white when both occur. Recessive c cannot express itself alone. There are grades of dominance among genes ranging from complete to incomplete to overdominance. (2)Recessive genes -- An allele or phenotype that is expressed only in the homozygous state. It is a gene whose expression is masked by a more dominant gene. When C is present, c cannot express itself phenotypically.
During reproduction individual genes are also referred to as gametes.
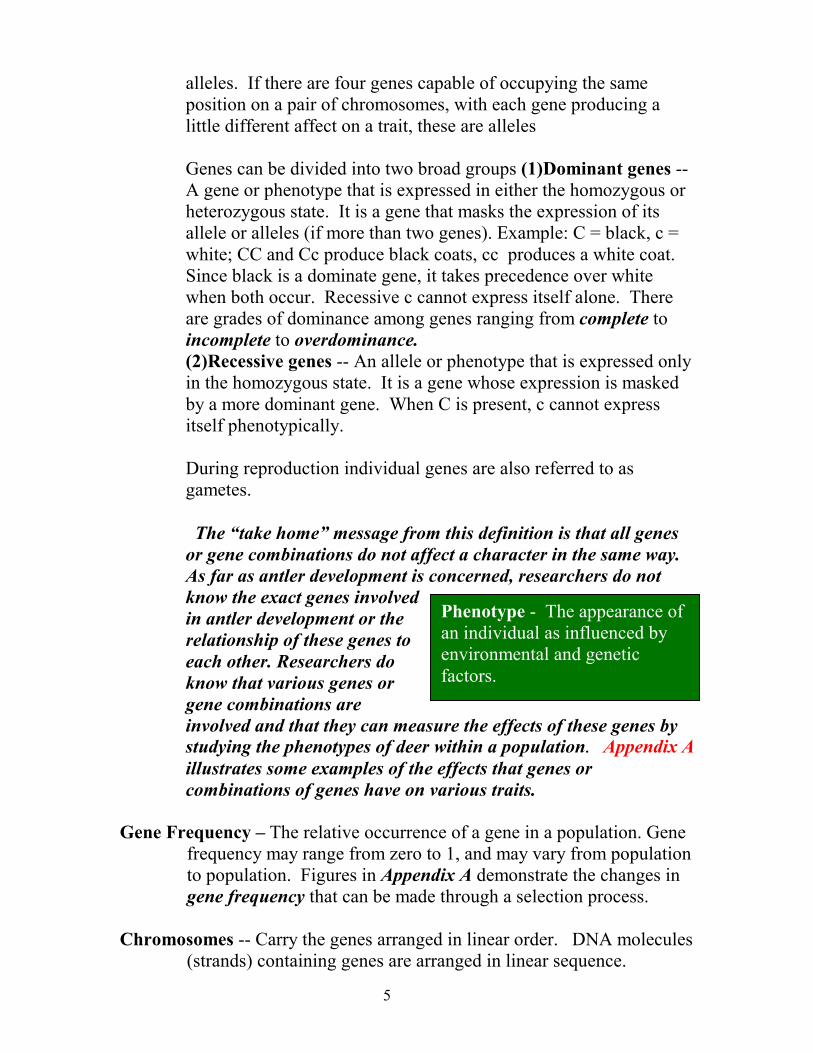
The —take home“ message from this definition is that all genes or gene combinations do not affect a character in the same way. As far as antler development is concerned, researchers do not know the exact genes involved in antler development or the relationship of these genes to each other. Researchers do know that various genes or gene combinations are involved and that they can measure the effects of these genes by studying the phenotypes of deer within a population. Appendix A illustrates some examples of the effects that genes or combinations of genes have on various traits.
Phenotype - The appearance of an individual as influenced by environmental and genetic factors.
Gene Frequency œ The relative occurrence of a gene in a population. Gene frequency may range from zero to 1, and may vary from population to population. Figures in Appendix A demonstrate the changes in gene frequency that can be made through a selection process.
Chromosomes -- Carry the genes arranged in linear order. DNA molecules (strands) containing genes are arranged in linear sequence.

6
Chromosomes in cells of animals are normally in pairs.
Backcross - A parent bred back to its offspring. Backcrossing can lead into reasonably high levels of inbreeding if practiced for too many generations.
Genotype - The genetic make up of an organism, in contrast to phenotype, which refers to physical appearance.
Phenotype - The appearance of an individual as influenced by environmental and genetic factors.
Heterozygosity, Heterozygous - Carrying both the dominant and the recessive gene of a pair of alleles, or two different genes of a series of multiple alleles. Example: T/ts, T/t, or ts/t, all are heterozygotes. If a T/ts mates with another T/ts, the possible offspring would be TT, T/ts, T/ts, and ts/ts. A variety of offspring would be produced.
Homozygosity - Carrying two of either the dominant or recessive genes of a pair of alleles, or carrying two identical genes of a series of multiple alleles. Examples: T/T, ts/ts, or t/t, are all homozygous genotypes. If a T/T mates with a T/T the possible offspring would be T/T, T/T, T/T, T/T. All the offspring would breed true.
Inbreeding -Mating between closely related individuals such as brother-sister, father-daughter, mother-son, and cousins. Intense inbreeding decreases heterozygosity, exposes undesirable genes and their effects, and generally produces weaker individuals. It must be practiced with caution.
The Need for Studying Populations and Not Individuals
Because body characteristics of deer are the product of both genetic and environmental influences, it is difficult to look at an individual and assign the cause of the size and shape of antlers to either genetics or environment. The cause of poor antler growth in an individual deer may be that the deer was sick during the antler growing period. This would be said to be an environmental cause. Or the cause may be that it simply does not possess the genetic material for growing good antlers. This would be a genetic

result. There are many reasons an individual deer looks the way it does. To overcome the inability to directly measure the roles of genetics or environment, researchers must study a large number of animals and apply the laws of statistical probability to determine observed results as being either random or predictable. Results presented in this report have been statistically tested by appropriate statistical methods. Sample sizes are listed with the title of a study. More detailed discussions of research studies are presented in the appendices.
Research deer
7

II. The Studies
Effects of Nutrition on Antler Development: 1974-1977 (33 deer)
In this study, a group of male fawns were placed on controlled diets and their antler production monitored for four years.
Nutrition plays an important role in antler development
There were four groups of deer used in the study. One group received a 16 % diet (High Protein) throughout the study. One group received an 8% diet (Low Protein) throughout the study. The diets of two other groups were switched yearly between high to low or low to high. All deer were fed four pounds of feed daily throughout the study with the exception of the 3rd year when all deer received five pounds a day. As a group, those deer receiving a high protein diet produced more antler mass than those deer that did not. The deer that remained on a high protein diet during the four year study grew better than those that did not (Figure 4). It was determined from this study that an
Figure 4. Above are two sets of antlers from two different deer. The deer on the left was raised on a low protein diet. The deer on the right on a high protein diet. Antler mass of deer grown on high protein diets was significantly greater than deer on low protein diets.
animal‘s diet was an important component in antler development. The results of this study are published in the 1989 Texas Parks and Wildlife bulletin, —Effects of Genetics and Nutrition on Antler Development and Body Size of White-tailed Deer“. Appendix B.
8
Role of Genetics in Antler Development: 1974-1984 (534 records, 298 sets of antlers)
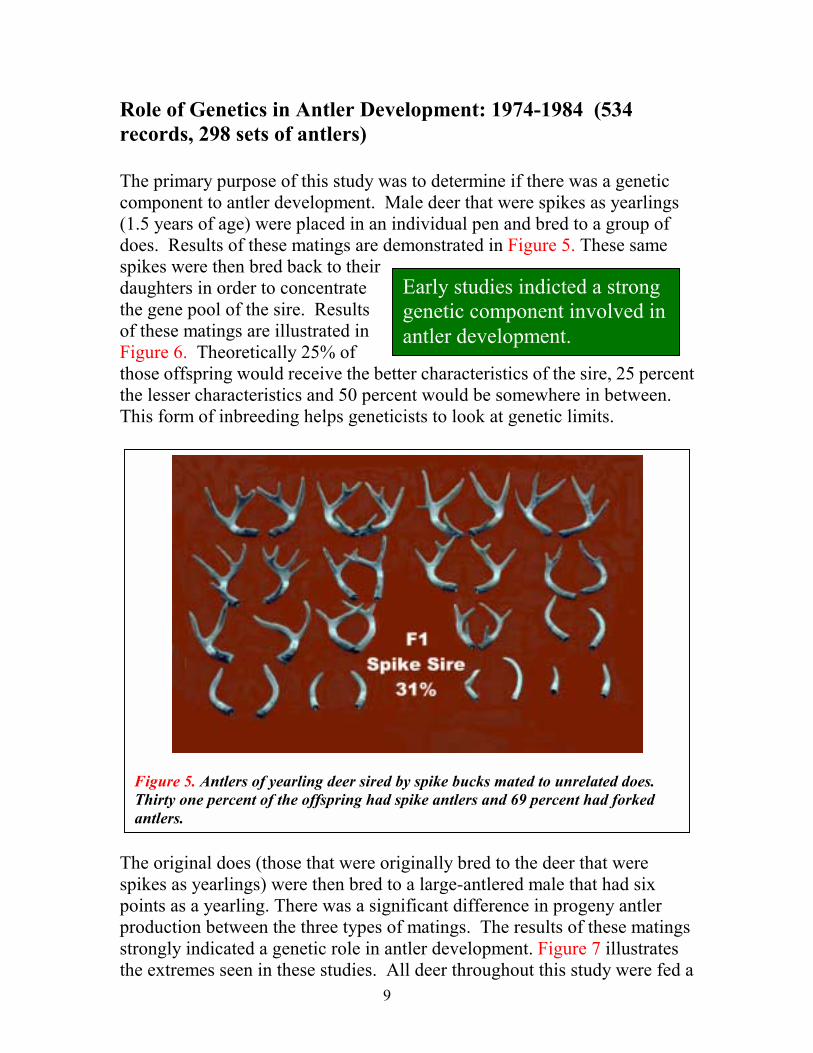
The primary purpose of this study was to determine if there was a genetic component to antler development. Male deer that were spikes as yearlings (1.5 years of age) were placed in an individual pen and bred to a group of does. Results of these matings are demonstrated in Figure 5. These same spikes were then bred back to their daughters in order to concentrate the gene pool of the sire. Results of these matings are illustrated in Figure 6. Theoretically 25% of those offspring would receive the better characteristics of the sire, 25 percent the lesser characteristics and 50 percent would be somewhere in between. This form of inbreeding helps geneticists to look at genetic limits.
Early studies indicted a strong genetic component involved in antler development.
Figure 5. Antlers of yearling deer sired by spike bucks mated to unrelated does. Thirty one percent of the offspring had spike antlers and 69 percent had forked antlers.
The original does (those that were originally bred to the deer that were spikes as yearlings) were then bred to a large-antlered male that had six points as a yearling. There was a significant difference in progeny antler production between the three types of matings. The results of these matings strongly indicated a genetic role in antler development. Figure 7 illustrates the extremes seen in these studies. All deer throughout this study were fed a
9

free choice 16 percent protein diet. Nutrition was not a factor. This study is also reported in the 1989 Texas Parks and Wildlife bulletin, —Effects of Genetics and Nutrition on Antler Development and Body Size of White-tailed Deer“( Appendix B).
Figure 6. Yearling antlers of deer sired by spike bucks mated back to their daughters (Backcrossed) in order to concentrate the gene pool of the sire. When spike bucks bred back to their daughters 60 percent were spike antlered and 40 percent were fork antlered.
10

Figure 7. Comparison of the best, average and worst sets of antlers for yearling deer based on three types of matings. The top row of antlers were sired by a fork-antlered male. The middle row are from yearling off spring of deer that were spikes as yearlings and the bottom row were sired by deer that were spikes as yearlings and were bred back to their daughters (inbreeding).
Sires of the yearlings in both the top and middle rows were bred to the same group of does.
When sires are bred back to their daughters, there is a concentration of the gene pool. Theoretically 25% should exhibit the better characteristics, 25% should the lesser characteristics and 50% should fall between those two extremes. From a research study point of view this helps researchers look at genetic extremes.
11

Spike vs. Fork-Antlered Yearlings: 1974-1984 (64 deer, 192 sets of antlers)
As researchers began to observe deer grown in the genetic determination study, it soon became evident that forked antlered yearlings grew larger antlers at maturity than did spike-antlered yearlings. By the end of the study, antler production records confirmed these observations. Antlers produced by fork antlered yearlings and spike-antlered yearlings were compared annually through 4.5 years of age. Fork-antlered deer produced almost twice the antler mass each year as their spike-antlered counterpathe 1989 Texas PaNutrition on AntleDeer“(Appendix B
From this analysisdetermined that an1.5 years of age windicator of futureto predict later antnecessary to —turn other words, from on yearling antler
Figure 8. All of the above sets of antlers are from 3 year old deer. Thetop row are antlers from deer that were forked as yearlings. The bottom set were from deer that were spikes as yearlings. All deer were fed a free choice 16% protein diet.
rt (Figure 8). Results of this study are also published in rks and Wildlife bulletin —Effects of Genetics and r Development and Body Size of White-tailed ).
, it was tler status at as a reliable antler production. From a research viewpoint, this ability ler quality at 1.5 years of age would shorten the time over“ a generation of deer from 4-5 years to 2 years. In this point on, researchers could select brood bucks based characteristics.
These early studies also suggested yearling antlers were a good indicator of future antler production.
12

Comparison of Spikes vs. Fork-Antlered Deer Grown Under Field Conditions: 1983- 1986 (8 Deer, 32 sets of antlers)
Another related study compared antler production under field conditions of deer that were spike or fork antlered as yearlings. This study was conducted in a 96 acre deer proof pasture over a four year period. Deer were —range grown“ without supplemental feed. Although small sample size prevented the two groups of deer from being statistically different, trend data indicated that antler production of fork antlered deer surpassed that of spike-antlered deer (Figure 9). Results of this study were reported in Federal Aid Performance Report W-109-R Job 38 : —The Effects of Genetics on Antler Development and Body Size Under Field Conditions“ (Appendix B). Figure 9. Antlers from 8 deer grown under range
condition from 1 to 4 years of age. The smaller antlers located next to the larger antlers are the yearling set. The larger set is the 4 year old set. Antlers in the box were from deer born in September.
13

Heritability Study: 1986-1990 (483 deer, 531 sets of antlers)
In 1986, a study was begun to determine the heritability of selected antler traits in white-tailed deer. Only yearling deer were used as brood bucks. All deer were fed a free choice 16% protein diet. All fawns were weaned in October. Selected sires were placed in breeding pens in October. Antler measurements as well as body weights were taken yearly for analysis. Heritability estimates were analyzed by three different statistical methods. It was determined from this study that antler traits are highly heritable (Figure 10). Results of this study are published in the scientific journal —Heredity“ (Appendix C).
If genetics is involved in antler development, then the next question is ,“How heritable are these traits?“
HERITABILITY-- An estimation of the degree by which a characteristic is controlled by heredity as compared to the influence of the environment and other factors. Mathematically it can be defined as actual gain divided by reach.
Example: A deer herd consists of 100 does whose body weight averages 100 pounds and 100 male deer whose average body weight is 100 pounds. (Actual weights in the population range between 85 and 130 pounds.) Now suppose those males breed those females and all the offspring grow up and their average body weight is 100 pounds. We could say that we had a 100 pound deer herd. Now let‘s further suppose that all males less than 110 pounds are removed from the population. If these 110 pound and over males breed those average 100 pound females and all the offspring grow up and weighed an average of 107 pounds, we could say there was a average gain of 7 pounds. Heritability is the measure of that gain. It is measured from 0 to 1 where 1 is a measure of a highly heritable trait and 0 is not a heritable trait. In this case, the gain was 7 pounds. The reach (the average weight of males after the less than 110 pound males were removed ) would have had to been 120 pounds (a reach of 20 lbs.) for the heritability to be .7. The reason reach had to be 20 pounds is because there was no selection for the does. The effects of the 20 lb. reach in the male population would be cut in half by not selecting for any reach in the females). The reach for the herd was, therefore, really 10 pounds (male reach /2). When heritability studies were conducted on antler mass, number of points, spread basal circumference and main beam length, these traits in white-tailed deer were found to be moderately to highly heritable.
14

Heritability Estimates: A trait is either inherited or not. If it is inherited, then the question becomes — How much of the expression of a trait is due to genetics and how much is due to environment ?. Is it highly heritable, moderately heritable, or not much ? “. Properly collected data can be analyzed to determine how heritable a particular trait is. Also, if a trait is heritable (greater than 0), then selection can be used to change that trait. How quickly you get measurable results depends on how heritable a particular trait is. Different statistical methods are used to analyze the data to make estimates of heritability. Depending upon sample size, statistical method used, and research design, varying heritability estimates can result. Geneticists often argue about statistical methods, research design, and sample size. There are reasons for that. Each statistical test has its own assumptions and biases. The variance, means and progeny tests were conducted on the designed heritability study conducted at the Kerr Wildlife Management Area deer pens and published in the scientific journal “Heredity“. The study was designed so that these statistical methods would be appropriate for analysis.(see Appendix C).
Heretability estimates calculated from a 5 year genetic research study at the Kerr Wildlife
Management Area and published in the Journal of Heredity
Antler characteristics Heritability Environment
Number of points .46 .54 Spread .42 .58 Basal circumference .72 .28 Main beam length .47 .53 Weight .75 .25
Body Characteristics
Birth Weight .00 1.00 Yearling weight .59 .41
Figure 10. Heritability estimates from a 5-year genetic research study at the Kerr Wildlife Management Area and published in the July , 1994 issue of Heredity.
15

If antler traits are heritable, then selection for deer with desirable antler traits as brood bucks will result. If the selection process removes large antlered deer and leaves only small antlered deer to become sires, then a reduction in antler size will result. If the selection process removes small antlered deer and allows only large antlered deer to become the brood bucks, then an increase in antler size will result. Figure 11 demonstrates the selection process and the results of heritability.
Results of SELECTION
4 generations of deer
All antlers from 3 year old deer
Fork Sire x Fork Dam Spike Sire x
Spike Dam
Figure 11. Comparison of 4 generations of deer. Antlers on the left illustrate the gain made through selection. All antlers are from three year old deer. The top set was a fork-antlered yearling out of a fork antlered sire. This deer was bred to a doe from a fork antlered sire(Generation 1). One of his sons was then picked to be a sire (Generation 2). This buck was then bred to a doe from a fork antlered sire. One of his sons was picked to be a sire and bred toa doe from a fork antlered sire (Generation 3). The result was the deer with the bottom set of antlers (Generation 4). Antlers on the right illustrate just the opposite. The top set was a spike yearling which was bred to a doe from aspike. One of his sons was picked as a sire and bred to a doe from a spike sire. This was done for 4 generations. The last set of antlers at the bottom was the final result.
16
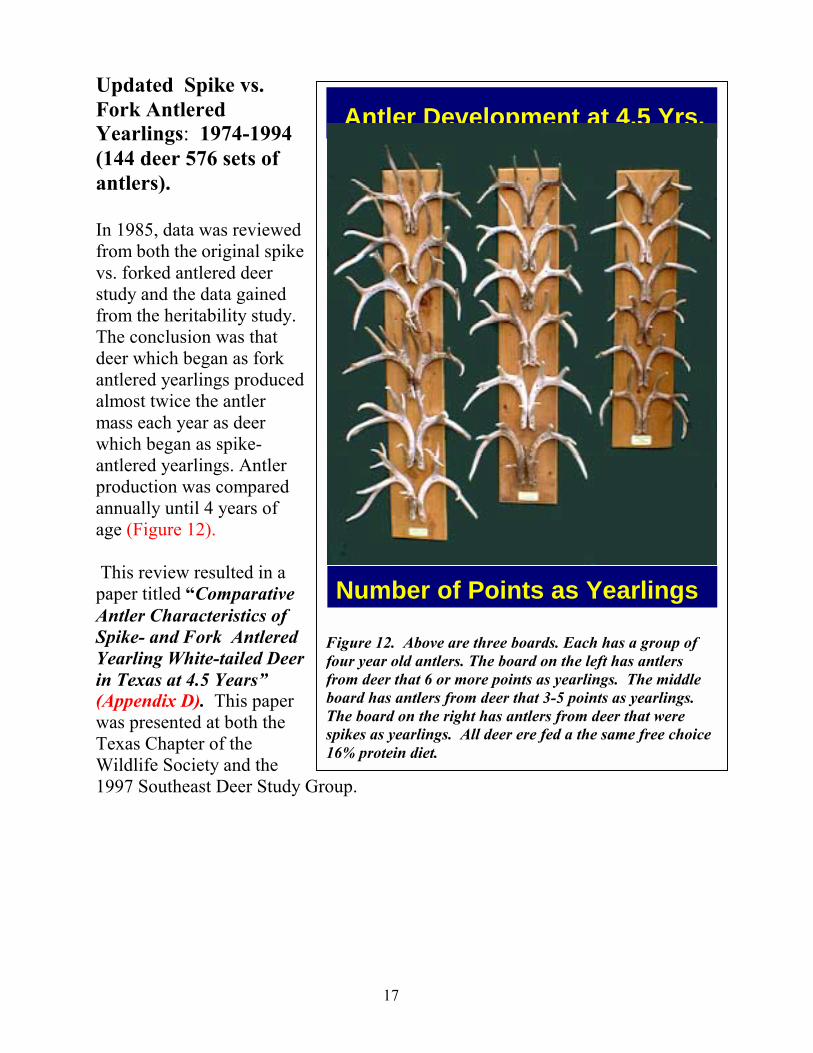
Updated Spike vs. Fork Antlered Yearlings: 1974-1994 (144 deer 576 sets of antlers).
In 1985, data was reviewed from both the original spike vs. forked antlered deer study and the data gained from the heritability study. The conclusion was that deer which began as fork antlered yearlings produced almost twice the antler mass each year as deer which began as spike-antlered yearlings. Antler production was compared annually until 4 years of age (Figure 12).
This review resulted in a paper titled —Comparative Antler Characteristics of Spike- and Fork Antlered Yearling White-tailed Deer in Texas at 4.5 Years“ (Appendix D). This paper was presented at both the Texas Chapter of the Wildlife Society and the
Antler Development at 4.5 Yrs.
6 points6 points or moreor more
3 to 53 to 5 pointspoints
SpikesSpikes
Number of Points as Yearlings
Figure 12. Above are three boards. Each has a group of four year old antlers. The board on the left has antlers from deer that 6 or more points as yearlings. The middle board has antlers from deer that 3-5 points as yearlings. The board on the right has antlers from deer that were spikes as yearlings. All deer ere fed a the same free choice 16% protein diet.
1997 Southeast Deer Study Group.
17

Updated Spike vs. Fork antlered Yearlings: 1974-1994 (825 antler sets from 346 deer)
Also after the completion of the heritability study, more deer had been added to the data set started in 1974. As a result, tables originally presented in the 1989 Texas Parks and Wildlife bulletin, —Effects of Genetics and Nutrition on Antler Development and Body Size of White-tailed Deer“ were updated by John Williams using the larger sample sizes. Updated frequency distribution charts comparing antler points at 1.5 years to later years are presented in Appendix E. Comparisons of antler characteristics and body weight at 1.5 œ 4.5 years of age to yearling status were updated for 104 deer (Appendix F).
Figure 13 summarizes updated data for antler and body weights based on age and yearling point status.
Age Spikes Avg (N) 3-5 Points Avg (N)
6 or More Points Avg (N) Total
1.5 51.0 (84) 135.5 (104) 264.6 (154) 342
2.5 255.4 (47) 453.3 (61) 638.1 (119) 227
3.5 443.1 (35) 744.0 (38) 1039.5 (79) 152
4.5 548.9 (30) 942.5 (25) 1289.1 (49) 104
1.5 93.3 (88) 104.2 (104) 116.4 (154) 346
2.5 117.3 (48) 133.2 (61) 145.2 (120) 229
3.5 130.2 (35) 155.1 (38) 168.5 (79) 152
4.5 142.7 (30) 163.0 (25) 179.0 (49) 104
Figure 13. Average body weight and antler weight at 1.5, 2.5, 3.5, and 4.5 years of age for 346 white-tailed deer classified according to total antler points at 1.5 years.
18

Spike Line Herd 1974- 2000 (67 males through 1999) (145 sets of antlers)
Since 1974, a breeding herd of deer was maintained separate from other studies. The deer in this herd were selectively bred to produce small antlers. All deer in this study receive a free choice 16% protein diet. No formal report on the results of this study was published although data on this herd was recorded in yearly Federal Aid Reports. The spike-line herd illustrates how selection for poor antlers can influence antler production. Each year the male producing the poorer antler characteristics is selected as a sire. This herd provides a stark comparison to those deer being produced in the Genetic/Environmental Interaction study in which only the best males are selected as sires (Figures 14 and 15).
Percent Antler Point Production From 50 Spike LIne Yearling Deer 1986-1999
0 20 40 60 80
100
2 3 4 5 Number of Yearling Points
Perc
ent
n = 39
n = 7 n = 1 n = 3
Figure 14. Spike Line Deer. This group of deer was established to demonstrate the effects of no spike harvest on future antler quality. All deer in this study were fed a 16% protein diet. 78 percent of male deer were spikes as yearlings.
19

Figure 15. A spike line sire at 2.5 years. All deer used in this study were fed 16% protein, free choice diet. These deer produced small antlers with few points. Body weights were also significantly less than their forked antler cohorts. In Texas, spikes were protected from the mid 1920‘s until the early 80‘s by general law although some counties under the Texas Parks and Wildlife Department‘s regulatory authority were allowed spike harvest beginning in the late 60‘s.
Protecting these types of deer and allowing them to become the —brood bucks“ can be a contributing factor in reduction of antler size in a deer herd.
20
Antler Characteristics and Body Mass of Spike- and Fork-Antlered Yearling White-tailed Deer at Maturity: 1994-1998 (144 deer)
This study compared antler characteristics and body mass of 144 white-tailed deer at 4.5 years of age that were reared in the pens from 1973 to 1990. All yearling deer were classified as yearlings (spike, fork, 3-5 points and 6 or more points) and live body weight recorded. At 4.5 At 4.5 years of age , deer that years of age the gross Boone and were forked as yearlings Crockett score (GBC) was produced 3 feet more B&C measured. The average GBC score than deer that were spikes score of adult deer that were as yearlingsfork-antlered yearlings was 127.8 while spike-antlered yearlings measured 89.9. Adults that were fork-antlered yearlings also had greater tine lengths and beam circumferences at each of the four GBC measurement positions. At 4.5 years of age, mean body weight was also greater for the fork-antlered group (78.7 kg) than for the spike-antlered group (66.7 kg). Average GBC scores of adults that had 6 or more points as yearlings (134.0) exceeded that of adults that were spike-antlered as yearlings by 44 GBC points. These results show that classifying yearlings as spike- or fork-antlered is useful in predicting antler characteristics and body mass at maturity. This project was an extension of the original Ott study completed in 1990 (Appendix D). It was conducted by Dr. Jim Ott, Dr. John Baccus and Scott Roberts of Southwest Texas State University.
A further analysis of Boone and Crockett scores comparing antler points at 1.5 years to B&C scores at 4.5 was made by Eugene Fuchs. Results of this analysis are illustrated in Figures 16, 17, and 18.
21

Figure 16. Each board contains a set of antlers ranging in age from 1.5 on the bottom to 5.5 years on top. Each antler represents the average Boone and Crockett score for that category. For example, for those deer that were spikes as yearlings and lived to be five years of age, the average B&C was 95. For those deer that were 3-5 points as yearlings, the average B&C at three years of age was 103. For those deer that were 6 or more points as yearlings, the average B&C at 2 years of age was 100. For spike antlered deer to make a 100 B&C class deer it would take 5 hunting seasons. For a 6 or more point yearling, it would take 2 hunting seasons.
22

Mean Boone & Crockett scores for 4.5 year old white-tailed deer based on antler
points as yearlings160
139.27140 n= 140 129.75
120 113.7
100 90.48
80
60
40
20
0 2 3-5 6-7 8-10
n=43
n=22 n=44
n=31
Points at 1.5 years
Figure 17 Boone and Crockett scores at 4.5 years for 140 deer based on the number of yearling points.
B&
C S
core
KWMA DEER PENS GROSS BOONE & CROCKETT SCORES FOR 143 BUCKS @ 4.5 YEARS OLD
CLASSIFIED AS SPIKES, 3 - 5 POINTS, OR 6 OR MORE POINTS AT 1.5 YEARS.16% PROTEIN AD. LIB.
GBC Score <70 70 80 90 100 110 120 130 140 150 160 No. Pts.Spike n=44 9 4 6 10 10 4 1
@ 3 - 5 n=33 3 3 9 5 6 5 1 1 1.5 Yr. 6 or more n=66 3 1 13 11 10 16 7 5
Figure 18. Gross Boone and Crockett scores at 4.5 years classified by points as yearlings. In this data set of 143 deer , no deer that was a spike as a yearling scored above 130 with only one being in the 120 class.
23

Genetic/Environmental Interaction: 1992-2000 (41 sires, 137 dams, 217 yearling antler sets)
Since 1983, wildlife biologists of the Texas Parks and Wildlife Department have been collecting white-tailed deer age, weight, and antler data from hunter harvested deer throughout the Edwards Plateau. Analysis of this data has demonstrated that in years with good nutritional range conditions, fewer spikes were in the harvest. It also indicated those years in which range conditions were poor, there were more spikes in the harvest. Range nutrition was affecting antler production. However, this same data also indicated that even under poor range conditions, there were some deer that produced good antlers. It also demonstrated that under good range conditions, there were always some spike-antlered deer. From these data biologists concluded that there were three types of yearling deer on the Data from the range (1) deer that always —Genetic/Environmental Interactions“produce fork antlers even study indicates the best time to harvestunder adverse conditions, spikes and make genetic gain is during (2) deer that always periods of nutritional stress such asproduced poor antler even under good drought or when starting a habitat conditions and (3) deer management program before the that in good years range has had a chance to recover. produced forked-antlers and in poor years produce spike-antlers. Biologists named this third group of deer, —swing deer“. From a management point of view, swing deer slow management gains because poor genetic traits are masked in good years. Researchers reasoned that if there was a genetic basis for these deer, then the frequency of —swing deer“ in a population could be reduced through a selection program and more rapid antler improvement would result. A study titled, “Genetic/ Environmental Interaction in White-tailed Deer” was initiated to see if swing deer could be reduced or eliminated from a population.
In this study, fawns were weaned in October and were placed on an 8% protein ration in which daily intake was also highly restricted (approximately ² normal intake) to duplicate drought effects. The deer were raised on this limited ration until they completed their antler growth the following October. They were then placed on a 16% ad lib ration and their antler production will be monitored until they are four years old (this portion
24
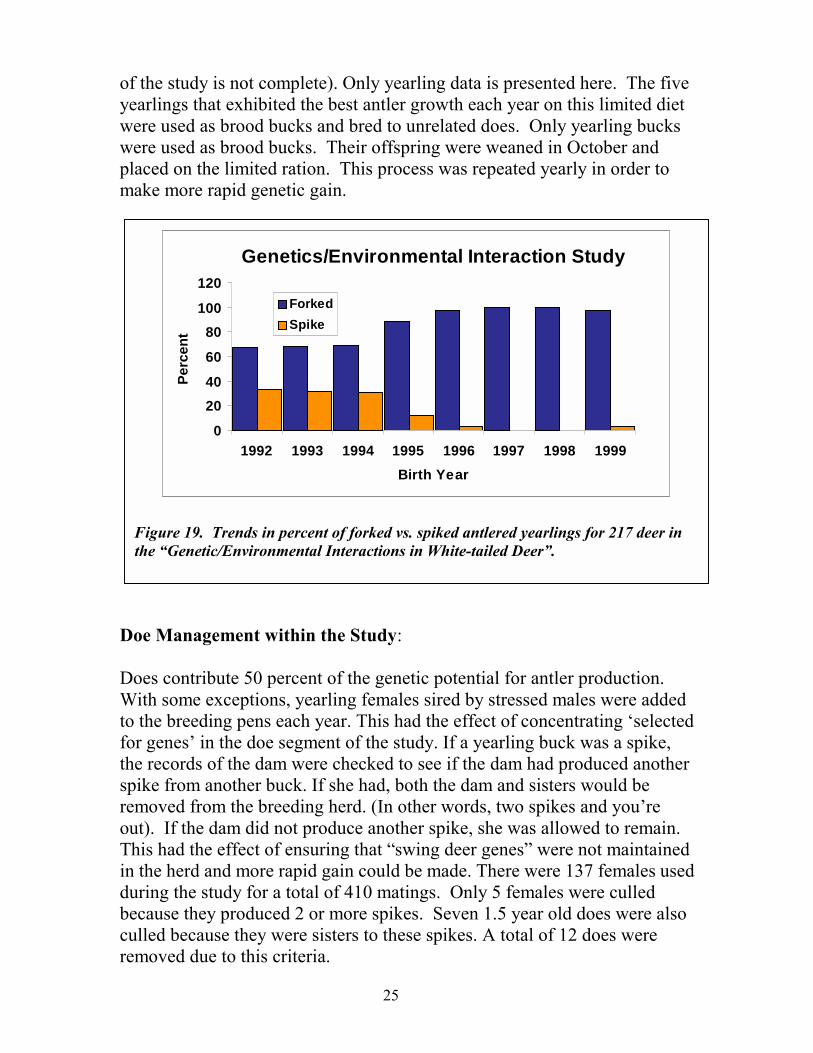
of the study is not complete). Only yearling data is presented here. The five yearlings that exhibited the best antler growth each year on this limited diet were used as brood bucks and bred to unrelated does. Only yearling bucks were used as brood bucks. Their offspring were weaned in October and placed on the limited ration. This process was repeated yearly in order to make more rapid genetic gain.
Genetics/Environmental Interaction Study
0
20 40
60
80 100
120
1992 1993 1994 1995 1996 1997 1998 1999 Birth Year
Perc
ent
Forked Spike
Figure 19. Trends in percent of forked vs. spiked antlered yearlings for 217 deer in the —Genetic/Environmental Interactions in White-tailed Deer“.
Doe Management within the Study:
Does contribute 50 percent of the genetic potential for antler production. With some exceptions, yearling females sired by stressed males were added to the breeding pens each year. This had the effect of concentrating ”selected for genes‘ in the doe segment of the study. If a yearling buck was a spike, the records of the dam were checked to see if the dam had produced another spike from another buck. If she had, both the dam and sisters would be removed from the breeding herd. (In other words, two spikes and you‘re out). If the dam did not produce another spike, she was allowed to remain. This had the effect of ensuring that —swing deer genes“ were not maintained in the herd and more rapid gain could be made. There were 137 females used during the study for a total of 410 matings. Only 5 females were culled because they produced 2 or more spikes. Seven 1.5 year old does were also culled because they were sisters to these spikes. A total of 12 does were removed due to this criteria.
25

The deer pens can only hold a limited number of deer. An additional, 27 does were removed for numbers control. Criteria for this removal was based on age, past fawn production and survival, state of health, and genetic (antler) potential of the offspring. In yearling does, antler potential was determined from family history. As the study progressed, there were fewer spikes and more 6 and 8 point yearlings with larger antler mass being produced. This allowed for a higher degree of selection each year for numbers control. By the end of the study, does with histories of producing less than 6 point yearlings were some of those deer selected for removal and are included in the 27 figure.
The yearling breeding trials were completed in 2000 (Figures 19 and 20). The fawns born in 1999 will be monitored until 2003 when they will be 4 years of age.
Data from this study indicate a Data from this study suggests the genetic/nutritional interaction that best time to harvest spikes and governs —swing deer“. It also make genetic gain is during suggests the best time to harvest droughts or other periods ofspikes and make genetic gain is nutritional stress.during droughts or other periods of nutritional stress. One of the best times to harvest swing deer is when starting a habitat management program on unmanaged ranches when deer numbers may be excessive and herd reduction is needed to improve habitat. Removing poorly performing stressed deer at this time will not only help accelerate genetic gains but will also remove deer for habitat improvement.
Yearly reports of this study are published in Federal Aid Performance report W-127-R Job 96: “Genetic/Environmental Interactions in White-tailed Deer“. Appendix G contains yearling antler and body weight trend charts for this study. Because this study is still an ongoing study, a more complete analysis of the data will be presented after 2003 and will contain data for 2, 3, and 4-year-old deer.
26

Ant
ler w
t. gr
ams
G enetic / E nvironm ental In teraction S tudy
350
300
Average Antle r W eight -250 Yearling deer
200
150
100
50
0 92 93 94 95 96 97 98 99
B irth Y ear
n= 31
n= 29
n= 33
n= 21
n= 25
n= 31
n= 26
n= 18
Figure 20. . Trend in average yearly antler weights of yearling deer used in the genetic/ environmental interaction study. Sample size —n=“ is listed for each year. There was a total of 214 yearling males used in the antler weight analysis. Antler weights increased over 300% from 1992 to 1999. Kerr Wildlife Management Area.
27

Presence or Absence of Brow Tines as a Predictor for Future Antler Characteristics in a Quality Deer Management Program
Antler development based on presence of brow tines at 1, 2, 3 and 4 years of age was compared. Antlers were collected from 1974-1997 from the various penned deer studies. Antlers were categorized as to number of points on the —basic frame“, if no brow tines
Figure 21. Examples of two yearling deer. One has brow tines and one does not.
were present, if only one brow tine was present, or if both brow tines were present (Figure 21). Data was analyzed based on the absence or presence of one or both —brow tines“ and compared to antler weight (mass), body weight, antler points, antler basal circumference, antler spread, main beam length and gross Boone and Crockett score at 1.5, 3.5 and 4.5 years of age. We examined antlers from 217 deer (N=651 sets) for which at least the first three sets of antlers were available and 168 deer (N=672 sets) for which at least the first four sets of antlers were available. Results showed that 89% of the bucks without brow tines at 3.5 and 4.5 years of age were spikes as yearlings (Figure 22). All bucks with five or more points as yearlings had both brow tines at maturity. All bucks without brow tines at 4.5 years of age had none when they were yearlings. One hundred percent of yearling bucks that had both brow tines had both brow tines at 3.4 and 4.5 years of age. This study was conducted by Kathy McGinty and presented at the 1999 Southeast Deer Study Group.
89% of the bucks without brow tines at 3.5 and 4.5 years of age were spikes as yearlings
In a related analysis, antler production based on the presence or absence of brow tines within cohorts was compared. At 1.5 years of age (yearling status) the live body weight of bucks without brow tines averaged 12 pounds lighter than bucks with one brow tine and 20 pounds lighter than bucks with
28

both brow tines. In all comparisons, deer within their cohort that did not produce brow tines had smaller bodies, less antler mass, and fewer points than their counter parts (Figure 23). A more detailed discussion of results of this study are presented in Appendix H. Data from this study was complied by Kathy McGinty and presented at the 22nd Annual meeting of the Southeast Deer Study Group œ 1999.
Browtine status at 4.5 compared to yearling status
100
80
60
40
20
89
58
26
11 17
30 8 8
0 0
63
Spikes 3 points 4 points 5+ points89 % of the
deer that had no BT @4.5 were spikes at
less deer that 5 or
produced 2 1.5
100 % of the deer that had 1 BT @4.5 were 4 points or
100 % of the
more points at 1.5
browtine @ 4.5
0 No BT @ 4.5 1 BT @ 4.5 2 BT @ 4.5
Figure 22. Browtine status at 4.5 years compared to yearling status.
Antler Weight (gms) 1500
1200
900
600
300
0
spike >2 no bt >2 1 bt >2 2 bt
set 1 set 2 set 3 set 4
AGE
Figure 23. Comparison of antler weights by age class to their yearling status.
Ant
ler W
eigh
t (gm
s)
29

Genetic Variability of Kerr Area Deer Penned Deer Herd and Free-Ranging Deer in Texas: Dr. Rodney Honeycutt œ Texas A&M University
Dr. Honeycutt investigated the genetic variability or heterozygosity, of deer herds across the state. Kerr Area deer pen data were compared to the results obtained from free-ranging deer. It was found that the KWMA penned deer exhibited a higher degree of genetic variability than some free-rangingof breeding trials.
DNA Research: Dr. Loren S
Dr. Skow and his graduate studentwhite-tailed deer utilizing DNA saherd annually. The geneological rmade this research possible.
Genetic Research: Dr. Loren
The rationale for this study is that is somewhat different from that ofto be genes expressed in antlers ththerefore not identified in human ato identify the mRNA‘s from genethose with maintenance (main beagrowth (apoptosis). The analysis (fork line) and slow growing (spikidentity of the genes that are respoThis study may also lead to the diswith application to bone healing in
It was found that the KWMA penned deer exhibited a higher degree of geneticvariability than some free-ranging herds in East Texas even after 20+ years of breeding trials.
herds in East Texas even after 20+ years
kow, Texas A&M University
s have developed genetic markers for mples obtained from the Kerr Area deer ecords associated with this herd have
Skow, Texas A&M University
the composition of bone in antler material long bones; consequently there are likely at will not be expressed in other bones and nd mouse genome analysis. The goal is s associated with rapid antler growth, m), and those that cause an inhibition of of gene expression in rapidly growing e line) deer may provide a clue as to the nsible for these different phenotypes. covery of growth promoting substances humans and animals.
30
Effects of Early Weaning on Fawn Survival: 1984-1986 (38 deer)
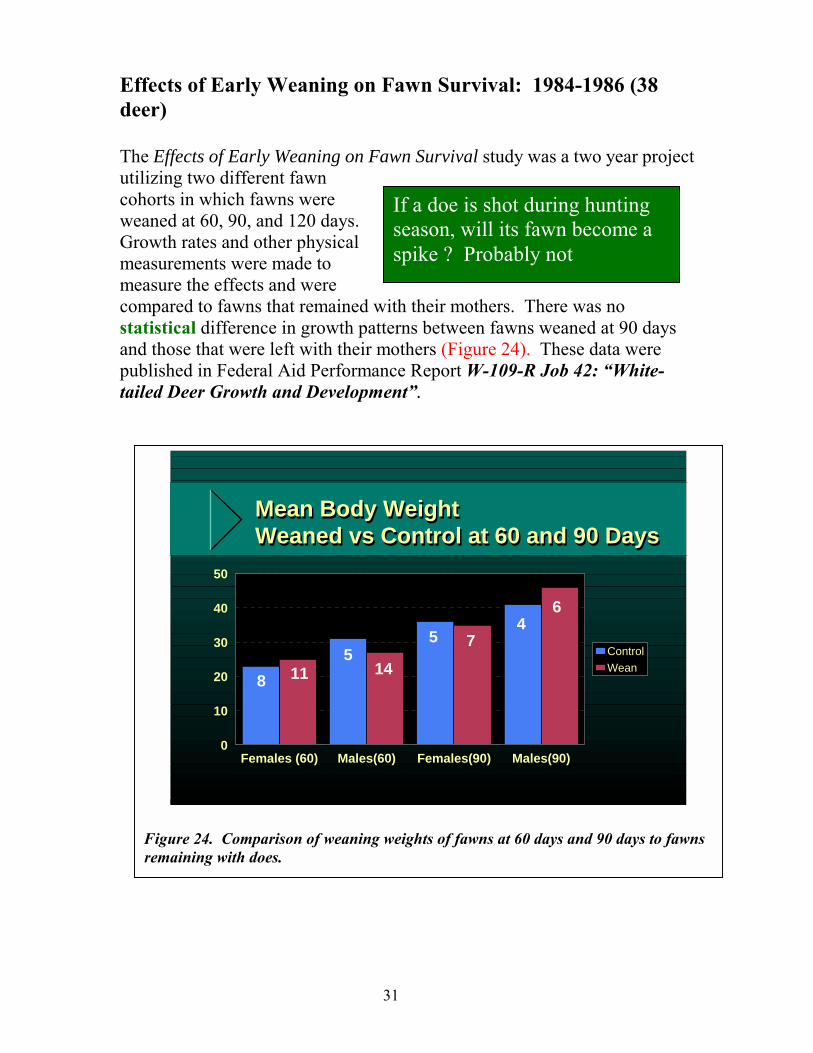
The Effects of Early Weaning on Fawn Survival study was a two year project utilizing two different fawn cohorts in which fawns were weaned at 60, 90, and 120 days. Growth rates and other physical measurements were made to measure the effects and were compared to fawns that remained with their mothers. There was no statistical difference in growth patterns between fawns weaned at 90 days and those that were left with their mothers (Figure 24). These data were published in Federal Aid Performance Report W-109-R Job 42: —White-tailed Deer Growth and Development“.
If a doe is shot during hunting season, will its fawn become a spike ? Probably not
Mean Body WeightWeaned vs Control at 60 and 90 DaysMean Body Weight Weaned vs Control at 60 and 90 Days
Females (60) Males(60) Females(90) Males(90) 0
10
20
30
40
50
Control Wean
4 6
75
14 5
118
Figure 24. Comparison of weaning weights of fawns at 60 days and 90 days to fawns remaining with does.
31

III. Other Related Facts, Results and Discussions:
Environmental influences vs. genetic traits: The way a deer looks is called its phenotype (Figure25). A deer is a product of both environmental and genetic traits. If a deer breaks a leg and walks with a limp that would be an environmental effect. If it receives a limited, poor quality diet, its antler production may be poor. That would also be an environmental effect. If two deer were grown under the exact environmental conditions and one grows big antlers and one grows little antlers, the difference could very well be genetic. When judging antler production on a range grown deer, it is difficult to know how much of the antler growth can be attributed to genetics and how much can be attributed to environment. Its antler growth is the result of an interaction of both genetic and environmental influences. In penned deer studies, as many environmental effects are controlled as strictly as possible in order to more accurately determine how much of a trait can be attributed to genotype.
Figure 25. Phenotypic characteristics such as antlers and body weight of white-tailed deer are heritable characteristics which are influenced by both genetics and nutrition and the interaction of the two factors.
32

Role of the Doe: The doe carries 50% of the genetic material for antler development (Figure 26). In the deer pens, some does consistently produced small antlered offspring and some consistently produced large antlered offspring. When spike-antlered males were bred to —spike-antlered“ females (does that consistently produced spike-antlered offspring), the offspring were often spikes at 1 and 2 years of age with a few being spikes at 3. When females from fork-antlered sires were bred to fork-antlered males, the offspring were often large-antlered.
From the moment of conception, the doe not only contributes to the genetic makeup of the offspring, she also begins to influence fawn
Figure 26. Does contribute 50% of the genetic material for antler development. From a genetic prospective, there are —spike“ does and —fork-antlered“ does.
development through maternal effects. Such things as her nutritional status, health, and physical condition, may affect the fetus. After birth, such things as milk production, or mothering ability may affect growth of the offspring. No formal studies were conducted dealing directly with these environmental factors in the Kerr WMA deer pen research. However, data were analyzed to see if age of doe or time of birth were influencing factors in the Kerr results.
33

Age of Doe: Early in the studies, the effect of the age of does on antler production became a concern. The hypothesis was that young does would
PERCENT SPIKE / FORKED ANTLERSBASED ON AGE OF DOE
KWMA DEER PENS
1 2 3+
Age of Doe
0
20
40
60
80
Per
cent
Spike Fork
73 % of Spikes Born
Were From 3+ Does
Figure 27. Percent spike vs. forked-antler yearlings produced based on age of the doe. No formal studies were conducted to determine how the age of the doe affected spike antlers. However, the percentage of does by age classes producing spikes was similar to the percentage producing fork-antlered offspring.
produce spikes and older does would produce fork-antlered offspring. The reasoning was that young does lacked the physical development to provide for adequate nutritional needs of fawn development. No studies were specifically designed to determine the effect of dam age on antler production. However, a review of data from the deer pen studies indicated that age of the doe had no effect. When age of doe was analyzed by individual study, no relationship of age to spike production was found. It did show that large numbers of spikes were produced by all age classes when spike sires (original genetic study and the Spike Line Study) were used and relatively few spikes were produced when forked-antlered sires were used (Figures 27 - 28).
34

Percent Spikes Produced By Age Class And By Study
Orig. Spike Fork Heritability Stress New Spike STUDY
0
20
40
60
80
100
120
PER
CEN
T
Age Of Doe 2 3 4-6 7+
0 0 0
Spike Sires
Fork Sire
Spike Sires
Fork Sires
Fork Sires stress diet
Figure 28. Percent spikes produced by age class and by study. Each colored bar represents an age class of doe deer. For instance, the yellow bar represents 2 year old does whose fawn was a spike as a yearling. Regardless of age, all does in spike line studies (using spike antlered sires) produced a large percent of spike offspring. In other studies using fork-antlered yearling sires, relatively few spike-antlered offspring were produced.
35

Time of Birth: Also, early in the studies, the time of birth was a concern. It was hypothesized that fawns born in late August or September would be
PERCENT SPIKE/FORKED ANTLERSBy BIRTH DATE
KWMA Deer Pens
Before July 15 After July 15
Month
0
20
40
60
80
100
Per
cent
Fork Spike
84 % OF ALL SPIKES WERE BORN BEFORE JULY 15
Figure 29. Percent of spike vs. fork antlered yearlings born before July 15 vs. after July 15th at the Kerr WMA research pens. Statewide studies have shown that 95% of the fawns born in Texas are born before July 15. Late fawns are usually considered to be born after August 1.
spikes just by virtue of their late birth date. A review of data from deer pen studies indicated that over 84% of the spikes were born before July 15th
(Figure 29). A 3-year, statewide study in Texas indicated that 95% of Texas deer are born before July 15th. (Traweek, 1995) Certainly if a fawn is born extremely late in the year there can be developmental
A 3-year, statewide study in Texas indicated that 95% of Texas deer are born before July 15th
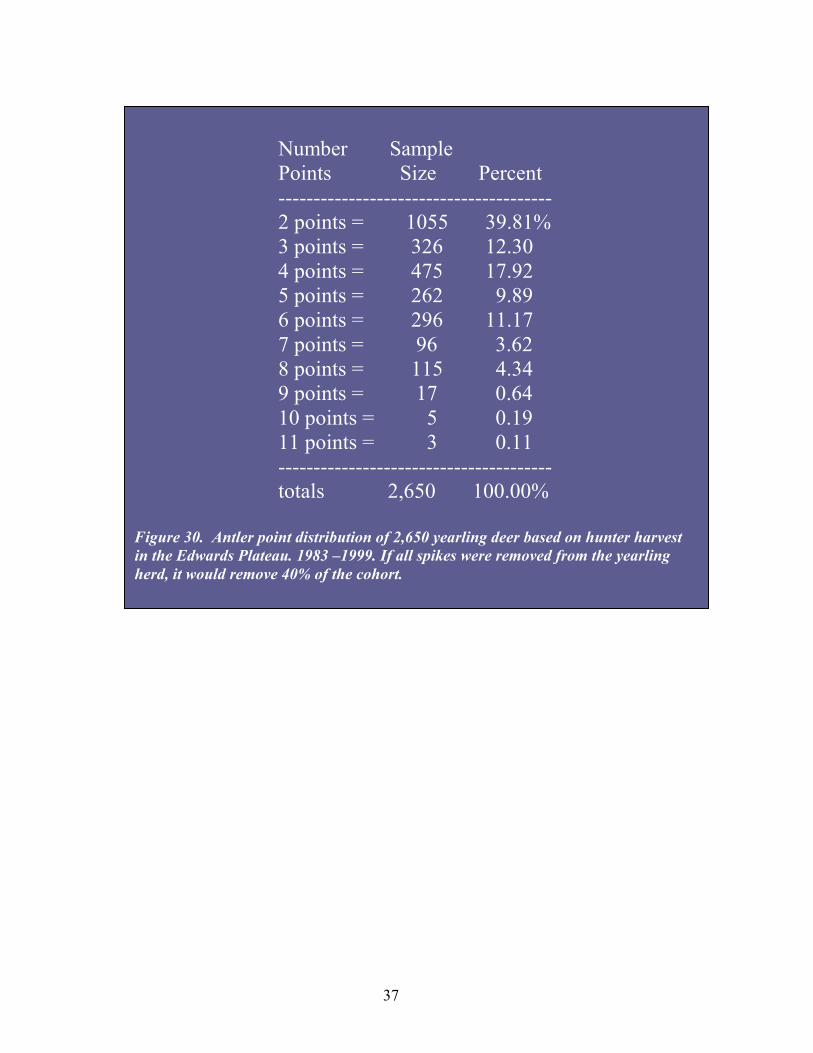
problems. However, the vast majority of deer in Texas are not born late. Hill Country data suggest that 40% of the yearling herd are spikes (Figure 30) (also see Removal of a cohort - Figure 31). If only 5% of the herd is born after July 15th (many of which are not spikes), then the vast majority of spikes is not the result of late birth.
36
---------------------------------------
---------------------------------------
Number Sample Points Size Percent
2 points = 1055 39.81% 3 points = 326 12.30 4 points = 475 17.92 5 points = 262 9.89 6 points = 296 11.17 7 points = 96 3.62 8 points = 115 4.34 9 points = 17 0.64 10 points = 5 0.19 11 points = 3 0.11
totals 2,650 100.00%
Figure 30. Antler point distribution of 2,650 yearling deer based on hunter harvest in the Edwards Plateau. 1983 œ1999. If all spikes were removed from the yearling herd, it would remove 40% of the cohort.
37

Removal of a Cohort of Deer: Some biologists were concerned that the harvest of spikes would result in eliminating a cohort of bucks if all spikes were removed. There would be no older age class deer available for harvest in future years. A review of harvest data in the Edwards Plateau and the Cross Timbers regions of Texas indicated that approximately 60% to 80% of the yearling buck harvest is fork-antlered. More fork-antlered yearlings are being harvested than spikes. On a regional basis, hunter numbers are relatively fixed. By shifting the hunting pressure from fork-antlered yearlings to the spikes, more quality antlered yearlings could be protected and grown to maturity (Figures 32 and 33).
A cohort of deer is an age group of deer that were born in the same year. These deer would have been grown under similar environmental conditions.
80 81 82 83 84 85 86 91 92 93 94 95 96
YEAR
0
20
40
60
80
100
120
PER
CEN
T
Forked Spike
Percent Spikes in Harvest Edwards Plateau - Yearlings
Average Forked 58% Spike 42%
Figure 31. Percent yearling spikes in the harvest. Data was collected in the Edwards Plateau. Data are representative of harvest in counties with a two buck bag limit. No data was available for 1987-1990. Average harvest of spike antlered deer was 42 percent. Average harvest for fork-antlered deer was 58%.
38

Percent Spikes in Harvest Cross Timbers - Yearlings
80 81 82 83 84 85 86
YEAR
0 20
40 60 80
100
120
P E R C E N T
Forked Spike AVERAGE 21%79%
Figure 32. Percent yearling spikes in the harvest. Data were collected in the Cross Timbers region of Texas. Data are representative of harvest in counties with a one buck bag limit.
Stress study yearlings grown on a limited low protein diet.
If hunting pressure was shifted from forked- antlered yearlings to spike antlered yearlings, more deer with quality antlers would be added to the herd.
39

Short Spike Vs. Long spike: There is an erroneous belief that short spikes are the result of poor nutrition and that long spikes are the result of
Figure 33. Shown are two complete sets of antlers from 2 deer. One set is from a deer that was a yearling with short spike antlers (the one on the left). The other is from a yearling with long spike antlers. For a better comparison of antler size see Figure 35 (age). The short spike board is the same in both figures.
genetics. The belief is that to improve the quality of the herd, one needs to remove bucks with long spikes and protect the bucks with short spikes. There is no evidence to support this belief. In the Figure 33 above, both sets of antlers are a result of genetic and environmental influences. To improve antler development, both should be removed. Shorter spikes produce less mass of antler later in life than longer spikes. Some biologists say — shoot the small spike first and don‘t let the long spike get away.“
Management of populations vs. individuals: Because individuals are the product of both genetic and environmental influences, it is difficult to look at an individual and assign the cause of its antler growth to either genetics or environment. The cause of poor antler growth may be that the deer was sick during the antler growing period (Environmental) or the cause
40

may be that it simply does not possess the proper genes for growing good antlers (Genetic). There are many reasons an individual deer looks they way it does. All that a manager really knows is that a particular yearling deer was grown under similar range conditions as all other yearling deer. He also knows that in comparison with other yearlings, the individual deer did or did not produce comparable antlers. If it produced less than average antlers, it should be removed. Those yearling bucks that did produce should become the breeders. Removal of poor antlered deer should reduce the gene frequency for those genes that contribute to poor antler production and increase the odds that offspring will carry those genes that produce larger antlered deer. There is no guarantee that an individual deer will have large antlers, but the population as a whole will. Therefore, management should be based on managing the herd as a population and not managing an individual.
Catching research deer at the Kerr Area Deer Pens
41

IV. Applying these studies to real world management programs
There were several major lessons learned from these studies.
1. Antler quality within a cohort of yearling deer reared under similar conditions exhibited a wide range of points, mass, main beam length, and circumference.
2. Deer grown on a 16% protein diet grew larger antlers than deer that were grown on an 8% protein diet.
3. Antler traits of yearling deer were a reasonable predictor of future antler growth. Older age class deer without brow tines were usually spikes as yearlings.
4. Antler traits are heritable and that both the buck and doe contribute genetic material for antler growth.
5. Selection for quality antlered deer to remain in a breeding population while at the same time removing poor quality antlered deer results in improved antler traits of future populations. The nutritional-environment study suggests that the best time to select for quality yearlings is during a drought period. Those deer that produced the best antlers under stress are the ones to be protected.
6. Deer antlers tend to get larger as a deer grows older until about six years of age. After six years antlers tend to get smaller.
7. All antler growth is genetically based and environmentally influenced. It is critical to understand that nutrition and age allows the genetic potential of an individual to be expressed.
8. Management programs should be based on the entire population and not necessarily on an individual animal‘s performance.
Management for large antlered deer, therefore, is a combination of three management strategies. They are management for nutrition (habitat), management for genetic potential (harvest selection), and
42

management for age (allowing bucks to mature). Nutritional management is manipulation of deer numbers in relation to available food supply while management for genetic potential and age have more to do with manipulation of deer herd composition or structure. Nutritional management is a separate management issue from herd composition. Some say that habitat management should take place before herd management. The two can and should be managed for at the same time. One does not necessarily take precedence over the other.
Nutrition Management (Habitat): One of the basics for habitat management includes the balancing of proper animal numbers to available food supply (Carrying capacity). This insures that deer receive adequate amounts of and variety of nutritious foods to reach their genetic antler potential a deer inherits. As far as habitat improvement is concerned, the really important issue is how much of a particular plant is eaten over a given period of time. If a plant is bitten too frequently and not allowed to recover, plant (and subsequently, categories of plants) will die and be replaced by less palatable plants. Usually, if over 75% of the leaves are eaten during a growing season, the plant will die. Therefore, as far as habitat management is concerned, the numbers of deer on the range in relation to the quantity of vegetation is the important factor. If you have a range that will support 100 browse eating animals and 20 are male deer and 80 are female deer or if 80 are males and 20 are females, the range will be healthy. The total of 100 animals is the important factor to the plants. A plant does not care whether it is being bitten by a male or female. There are ways to increase food supply and nutrition on ranges. These include the use of rotational grazing systems, prescribed fire and noxious brush control. The Texas Parks and Wildlife Department, The Texas Agricultural Extension Service, and the Natural Resources Conservation Service have literature and personnel to assist landowners in managing for land health. Land health means quality nutrition for white-tailed deer.
Land health means quality nutrition for white-tailed deer.
Herd Management: The remainder of the nutrition, genetic, age equation has to do with the manipulation of the deer herd.
Genetic Potential: Each year a deer herd will produce a given number of offspring (fawns). This cohort of deer will be reared under a given set of
43

environmental conditions. Some will produce good antlers at 1.5 years, some will not. In poor nutritional years, there will be fewer quality antlered yearlings and more lesser quality antlered yearlings. In good nutritional years, the reverse will be true. The point to remember is that all the yearlings within a cohort were grown under similar conditions. Each year the poorer antlered portion of that cohort should be removed. This could be the bottom ³, 1/3,
or ², depending on the antler quality level a manager wishes to achieve and how quickly he wishesremove only spikes. Gain in this casremove five point or less yearlings. nutritional years (Genetic/Environmsevere the selection process, the mohas 200 animals composed of 100 msuppose those 100 males bred thosecrop, the 100 does would produce 1severe selection program, we removbut still had 100 females, the herd wa severe selection process with onlydoes, we would still produce 100 fabetter antlered bucks. Half the fawnfemales. If we then removed the oldherd composed of better quality antcharacteristics are heritable, antler iscenario but illustrates the point of deer manager seeking rapid gain. Aremoval of the lesser antlered yearli—roll over“ the deer herd over a numantlered bucks for removal. It is mudoes. In both cases, it will take fromto insure that most does are from be
Obviously the older a buck, the easiThe problem is knowing the age of poor three or four year old deer or iillustrates this point. The best time the animal is 1 year old and has a mOnce a deer becomes 2 to 3 years ofloses its identify as far antler potentwould be the buck with no brow tin
4
The more severe the selection process, the more rapid the gain.
to attain it. For instance, a manger may e will be slower than if he decides to More gain will be made in those poorer ental Interaction Study). The more re rapid the gain. Let‘s suppose a range ales and 100 females. Let‘s also
100 females. With a 100 percent fawn 00 fawns. If through a moderately ed 50 bucks with poor quality antlers ould still produce 100 fawns. If we had 10 males left to breed but still had 100
wns. Those fawns would be from the s would be males and half would be er females, we would now have a base lered genes. Because antler mprovement will occur. This is a severe selection and is a real alternative to a less severe scenario would be the ngs and a planned harvest of does and ber of years. It is easy to select poor ch harder to recognize —poor-antlered“ 8 to 10 years to —roll over“ the doe herd tter-antlered males.
er it is to judge that animal‘s potential. the buck about to be removed. Is it a s it a quality yearling. Figure 34 to remove a deer from the range is when inimal number of points (2,3,4,5, etc.). age and produces 3 or more points, it ial is concerned. An exception to this e. The odds are that it was a spike as a 4
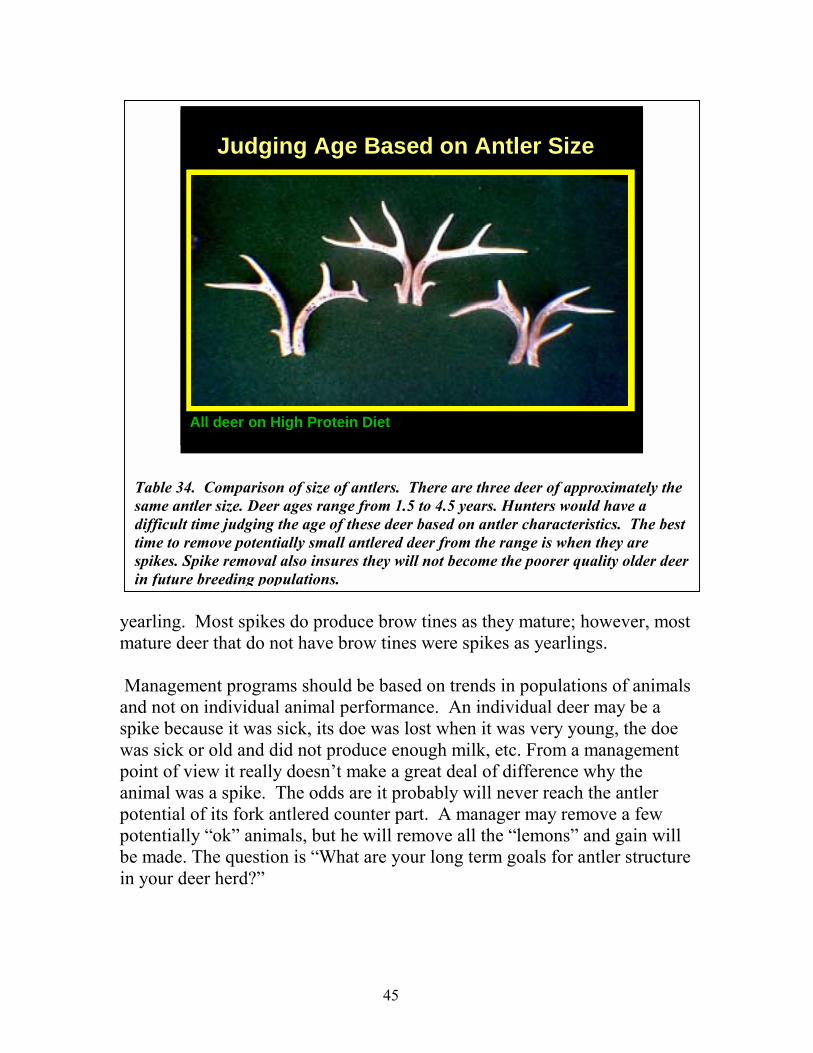
Table same adifficutime tospikesin futu
yearlingmature
Managand notspike bwas sicpoint ofanimal potentiapotentiabe madin your
Judging Age Based on Antler Size
All deer on High Protein Diet
Forked Antlered Yearling
3.5 Years old Spike as Yearling
4.5 Years old Spike as Yearling
34. Comparison of size of antlers. There are three deer of approximately the ntler size. Deer ages range from 1.5 to 4.5 years. Hunters would have a lt time judging the age of these deer based on antler characteristics. The best remove potentially small antlered deer from the range is when they are
. Spike removal also insures they will not become the poorer quality older deer re breeding populations.
. Most spikes do produce brow tines as they mature; however, most deer that do not have brow tines were spikes as yearlings.
ement programs should be based on trends in populations of animals on individual animal performance. An individual deer may be a ecause it was sick, its doe was lost when it was very young, the doe k or old and did not produce enough milk, etc. From a management view it really doesn‘t make a great deal of difference why the was a spike. The odds are it probably will never reach the antler l of its fork antlered counter part. A manager may remove a few lly —ok“ animals, but he will remove all the —lemons“ and gain will
e. The question is —What are your long term goals for antler structure deer herd?“
45

Age Management: Another manipulation of the deer herd is the management for age or rather age structure manipulation. All genetic and environmental factors being equal, older age males have larger antlers than
Figure 35. Effects of Age on antler development. There are three complete sets of antlers from three different deer in this slide. The bottom set is the yearling set of antlers. Notice that antlers grow larger until 7 years of age.
younger males until about 6-7 years of age (Figure 35). Age structure management usually starts with the management of sex ratios. Most biologists recommend management for 1 buck to one or two does. This serves two functions. One is to add more older age class male deer to the harvest, and the other is to slow reproduction to make herd numbers more manageable for habitat management purposes (Figure 36). By maintaining skewed buck to doe ratios (high doe numbers), production will be greater and more deer will require harvesting to maintain deer at carrying capacity. Unmanaged harvest is usually of older age class animals, which results in greater numbers of older age class deer harvested and difficulty in maintaining an older age structure. By maintaining a less skewed buck to
46

Example 1 Example 2
Carrying capacity = 120 deer Carrying Capacity 120 deer Buck to doe ratio = 1:1 Buck to doe ratio 1:5 Percent Fawn crop = 100% Percent Fawn Crop 100%
Spring Population = 120 Spring Population = 120
Males = 60 Males = 20 Females = 60 Females = 100
Fawns Born = 60 Fawns Born = 100 Male Fawns = 30 Male Fawns = 50 Female Fawns = 30 Female Fawns = 50
Excess Deer = 60 Excess Deer = 100 Total males 90 Total males 70 Total females 90 Total females 150
Population after harvest Population after harvest Males = 60 (90-30) Males = 20 (70-50) Females = 60 (90-30) Females = 100 (150-50)
Harvest is 30 antlered males Harvest is all 20 antlered males plus 30 male fawns
Figure 36: Examples of the effects of buck to doe ratios on age structures of the harvest
doe ratio (High buck numbers), production is slowed. The requirement to remove excessive numbers of deer is lessened which makes it easier to add age. Besides manipulating buck to doe ratios, a more desirable age structure can be added to the herd by removing a percent of the herd from the —younger, bottom end (spike and 4 points)“ and a percent from the —older, top end“ of the herd. Harvest pressure is removed for the middle age classes and age can be more easily added to the herd.
47

An example of Managing for Age through spike harvest
From 1972-1982, hunters on the Kerr WMA could harvest any deer (either-sex hunts). Hunters preferred large-antlered bucks over does and small bucks. The selection for mature bucks made it difficult to create a buck herd with an older age structure. As a result, only 62 of the 460 bucks (13.5%) harvested during the period were 4.5 or older. Either-sex hunts removed few does because of hunter‘s preference for bucks.
In 1983, special doe and spike buck hunts were added to help control the age and sex distribution by allowing some hunters to kill only antlerless deer or spike bucks. The combination of either-sex hunting, antlerless deer hunts, and spike buck hunts created an older herd and an improvement in antler quality. From 1990-2000, there were 411 bucks harvested of which 106 (25.8%) were at least 4.5 years old.
The question is — How does a manager handle the problem of managing for proper sex ratios and the need to remove as many poor antlered deer as possible without skewing sex ratios?“ The answer is simple. When starting a quality antler program calculate the proper number of deer a range should carry for habitat improvement. From this carrying capacity number, calculate how many does should be on this range if it were at a desired buck to doe ratio (somewhere between 1:1 to1:2). You now know the base number of does that you want to carry on your range. Remove does to that base number. Calculate the number of poor antlered males and other males that need to be removed to achieve the desired buck to doe ratio. Now forget about buck to doe ratios. Remove the calculated percent of the quality males and all the poor-antlered males. Don‘t worry about skewing the buck to doe ratio but be sure you remove at least enough males to achieve carrying capacity. Remember the example of 10 good bucks and 100 does producing 100 fawns. Half those fawns will be males and half will be females. The next year‘s buck to doe ratio will be closer to a one to one and less poor antlered males will be in the population. Because of the heritability of antler quality, over a period of years, the need to cull severely will lessen and more mature, better antlered males will be in the population. The population will begin to move to the desired buck to doe ratio. On the Kerr Wildlife Management Area, hunters are allowed to harvest any buck with 4 points or less and bucks with an antler spread that is wider than their ears. This insures that yearling bucks with the best antlers remain in the breeding population. Special antlerless hunts are also held to remove surplus does.
48
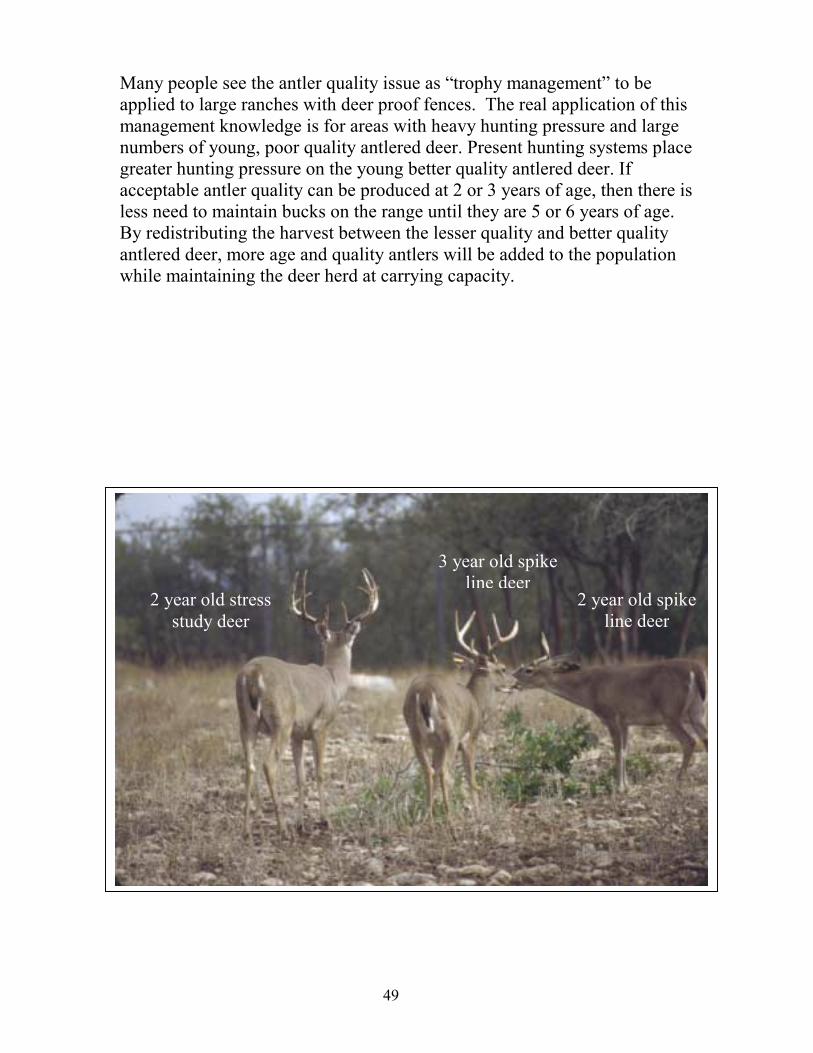
Many people see the antler quality issue as —trophy management“ to be applied to large ranches with deer proof fences. The real application of this management knowledge is for areas with heavy hunting pressure and large numbers of young, poor quality antlered deer. Present hunting systems place greater hunting pressure on the young better quality antlered deer. If acceptable antler quality can be produced at 2 or 3 years of age, then there is less need to maintain bucks on the range until they are 5 or 6 years of age. By redistributing the harvest between the lesser quality and better quality antlered deer, more age and quality antlers will be added to the population while maintaining the deer herd at carrying capacity.
2 year old stress study deer
49
2 year old spikeline deer
3 year old spikeline deer

V. Other management concerns:
The Brood Buck: One often asked question to biologists is, —Do I need to buy a brood buck to produce big deer on my ranch?“ The answer is simply —No, you do not“. In most cases, it‘s simply a waste of time and money. There are a couple of reasons for this answer.
Do I need to buy a brood buck to produce big deer on my ranch.“ The answer is simply —No, you do not“
(Reason 1) Most populations of deer contain animals with good genetic potential (Figure 30). With a combination of good habitat management and selective harvest (phenotypic selection), substantial herd improvement can occur. Obviously larger ranches with more animals to choose from have a statistical advantage for gain. However, smaller ranches (500 to 1500 acres) can usually do a better job of selection than larger ranches simply because with fewer animals, selection can be more intense.
(Reason 2) A buck grown under a controlled set of conditions (a pen with pelleted feed) or a buck from a different habitat type may not perform well under a changed set of conditions. For example, it is known that it takes 2 parts calcium to 1 part phosphorus to grow bone tissue. If a range produces adequate amounts of calcium but not enough phosphorus, not all the calcium can be utilized for bone growth. We do not know the exact genes involved in antler growth but let us hypothesize that a set of genes affects phosphorus absorption and storage. In a pen situation where more than adequate phosphorus was present, the antlers would look good. Now suppose that this deer were placed on a phosphorus poor range and the deer did not get adequate phosphorus. This deer would not produce good antlers. In a ranchers‘ term, the deer —fell apart“ without extra phosphorus. The ability to utilize phosphorus efficiently may be genetic while not having adequate phosphorus is nutritional. These traits would be passed to its offspring. In management, the selection for those animals that perform well under range conditions on a given ranch under a given set of environmental conditions is important for antler production. Selecting for those animals that perform well under less than optimal conditions is an important component in genetic selection.
(Reason 3) A male deer contributes 50% of the genetic material for antler development. We don‘t know what genes/alleles contribute to antler development. However, lets suppose that a male has a set of allelic genes
50

that consists of two genes. One for a large amount of mass we will call —M“, and the other gene may be for a small amount of mass that we will call little (m). We will also assume
Two or more genes controlling a trait may that big —M“ is dominate be capable of occupying the same position over little —m“s. The on a chromosome. These genes are said tofemale also contributes be alleles. For example, a dominant gene 50% and let‘s assume her along with its recessive form are a pair of genes for antler mass alleles. If there are four genes capable ofwere —mm“. If male Mm occupying the same position on a pair of and female mm bred, chromosomes, each gene producing a little then the phenotypic range different affect on a trait, these are alleles.of possible offspring
would be either Mm, or mm. Some good quality offspring or some poor quality offspring could be produced. Those poor quality offspring must then be removed from the population. If an Mm male and an Mm female bred, the possible genes of the offspring would be MM, Mm, Mm, mm. In this scenario, three deer with good mass potential would be produced and one deer with poor mass potential would be produced. The MM deer would always produce good phenotypic offspring. However, the Mm may not always produce big antlered offspring. As more MM deer are produced, the overall population of deer will be improved for mass. Again the important factor in producing a herd with good antlers is the selection process to eliminate small antlered offspring and leave good antlered offspring. Older does must also be removed to insure that younger does are from the better quality males. Selection is the more important part of the management process; no matter who the original sire was. Most ranges have enough genetic variability to produce quality deer with selection. In geneticists terms selection is increasing the gene frequency for large antlers (Appendix A).
The following actual example demonstrates the effectiveness of a —high quality brood buck“.
In 1993, a 4.5 years old buck was used as a sire on a select group of does. This buck at 7.5 years had 22 points, an outside spread of 30.25 inches, and an inside spread of 26.125 inches. His gross Boone & Crockett score was 205 gross and 193 net.
This mating produced 11 male fawns in 1994. At 1.5 years the antler development of these bucks was as follows: (1) one had 7 points,(2) one had 6 points, (3) one had 3 points and (4) eight were spikes. All of these yearling offspring were grown on an 8% limited diet. They were then
51

placed on a free choice 16% diet. At 2.5 years, four had 8 points, three had 7 points, three had 6 points and one had 4 points. At 3.5 years, two had 9 points, five had 8 points, and four had 7 points. Antler production of the offspring from this 200 class buck was well below average for a simple reason. The reason is that the select group of does were spike line does from the spike line study. Speculation: The buck was probably relatively heterozygous for most of its antler traits. When bred to does which were mostly homozygous for spike antlers, a large number of the offspring became homozygous for poor antlers.
Bringing in —trophy bucks“ once the selection process has begun will probably dilute the gain made from selection and the process will need to begin again.
Ranch Size: I own less than 200 acres. Can I manage my herd? Yes, but with conditions. Example: A 10,000-acre ranch may have 50 deer blinds (1 per 200 acres). A 200-acre ranch may have 1 blind. It would require fifty 200-acre ranches to equal 10,000 acres. From a hunting pressure view point, each blind has equal potential for harvest. If 200 deer need to be harvested from each of the 10,000-acre areas, harvest would be 4 deer per blind. The only real difference between the two 10,000 acre areas is that the 10,000-acre ranch can be managed under one hunting philosophy while on the 200 acre tracts, 50 owners would need to have somewhat similar management philosophies.
I own less than 200 acres. Can I manage my herd?
If all tracks were 100 acres in size and had 1 blind, harvest should be 2 deer per blind. If the tract size was 50 acres, harvest should be 1 deer per blind. If all tracts were harvesting spikes and limiting fork-antlered deer, quality deer could be produced on small acreages. In the 50 acre example, not all landowners could harvest a forked-antlered male each year.
The condition for the above example is that cooperative organizations of landowners with similar objectives need to be formed to distribute harvest over a large area. Since most deer‘s home range is about 1 square mile, an effective area for some measurable degree of management success would be a cooperative of two to three square miles. Obviously, larger acreages improve the degree of management possible.
52

Inbreeding: Managers are often concerned about the harvest of spikes and the effects of possible inbreeding within a deer proof fence situation. Inbreeding is not a problem on the vast majority of Texas ranches as Figure 37 indicates. In the first example, there are 10 males and 20 females. If these deer were enclosed in a 300-acre deer proof pasture, it would take over 20 years for inbreeding to become a concern. On a 1,500-acre ranch, no appreciable incidence of inbreeding would occur. No deer proof fence has existed in Texas for a 20 year period without some ingress of deer taking place which will cause an outcrossing of deer and a reduction of inbreeding. Not all inbreeding is necessarily bad. In fact, inbreeding with selection can positively affect a population. Most domestic breeds of cattle, sheep, goats, hogs, chickens, dogs, cats, etc. are the result of inbreeding. In wild populations undesirable traits caused by inbreeding would soon be eliminated. Inbreeding of 20% or less is considered acceptable in most wild populations.
Sires Dams
Dams % Change
per generation
Sires% Change
per generation
% change per
generation
% Change in 20 years
10
20
40
50
20
40
80
100
0.63
0.31
0.16
0.13
1.25
0.63
0.31
0.25
1.88
0.94
0.47
0.38
18.75
9.38
4.69
3.75
Inbreeding of 20% or less is considered acceptable
Table 37. Reduction in heterozygosity (inbreeding) according to Lush.
53

VI. Kerr Wildlife Management Area Penned Deer Studies, Publications and Associates 1977-1999
Technical Papers
Armstrong, W. E., E. Fuchs, and J. Williams. 1999. The Kerr Wildlife Management Area penned deer research studies - application for quality management. Abstracts of the 22nd Annual Southeast Deer Study Group Meeting. Fayetteville, Arkansas. 70 pp.
Butts, G.L., D. E. Harmel, R. L. Cook, and W. E. Armstrong. 1978. Fawning dates of known-age white-tailed deer and their management implications. Proceedings of the Annual. Conference of Southeastern Association of. Fish and Wildlife Agencies 32:335-338.
DeWoody, J. A. 1994. Isolation and characterization of microsatellite markers in white-tailed deer. Master‘s Thesis, Texas A&M University, College Station.
DeWoody, J. A., R. Honeycutt, and L. Skow. 1994. A panel of genetic markers in white-tailed deer. P. 18 In Abstracts of the 17th Annual Southeast Deer Study Group Meeting. Charlottesville, VA. 78 pp.
DeWoody, J. A., R. L. Honeycutt, and L. C. Skow. 1995. Microsatellite markers in white-tailed deer. Journal of Heredity 86:317-319.
Harmel. D. E. 1983. Effects of genetics on antler quality and body size in white-tailed deer. Pages 339-348 In R. D. Brown, ed. Antler Development in Cervidae. Caesar Kleberg Wildl. Research Inst., Texas A&I Univ., Kingsville.
Harmel, D E. 1983. Genetic implications of deer proof fencing In S. Roberson,(ed.) Deer-Proof Fencing. Caesar Kleberg Wildl. Research Inst., Texas A&I Univ., Kingsville.
Harmel, D. E., J .D. Williams, and W .E. Armstrong. 1989. Effects of Genetics and Nutrition on Antler Development and Body Size of White-tailed Deer. PWD-BK-7100-155. Texas Parks and Wildl. Dept. Austin. 55 pp.
Harmel, D. E., W. E. Armstrong, E. R. Fuchs, E. L. Young and K. D. McGinty. 1998. The Kerr Area penned deer research facility. Pp. 40-45 In D. Rollins (ed.). The Role of Genetics in White-tailed Deer Management. Texas A&M Univ. System and Texas Chapter of The Wildlife Society. College Station. 102 pp.
Hendrick, P. 1998. Comparison of antler measurements and body weights of fork-antlered as a yearling and spike-antlered as a yearling white-tailed deer at age 1.5 years. Masters Thesis. Southwest Texas State University, San Marcos, Texas.
54

Kerchoff, R. 1999. Comparison of antler measurements and body weights of fork-antlered as a yearling and spike-antlered as a yearling white-tailed deer at age 2.5 years. Masters Thesis. Southwest Texas State University, San Marcos, Texas.
McGinty, K., E. Fuchs, and J.Williams. 1999. Presence or absence of brow tines as a predictor for future antler characteristics in a quality deer management program. Abstracts of the 22nd Annual Southeast Deer Study Group Meeting. Fayetteville, Arkansas. 70 pp.
Ott, J. R., S. W. Roberts, J. T. Baccus, D. E. Harmel, E. Fuchs and W. E. Armstrong. 1997. Comparative antler characteristics of spike- and fork-antlered yearling white-tailed deer in Texas at age 4.5 years. Proceedings of the 51st Ann. Conference of . Southeastern Association of Fish and Wildlife Agencies. 10 pp.
Ott, J. R., J. T. Baccus, D. E. Harmel, E. Fuchs and W. E. Armstrong. 1998. Reliability of yearling antler characteristics as predictors of antler quality and body mass at ages 2.5, 3.5, and 4.5 years in Texas white-tailed deer. Abstracts of 21st Annual Southeast Deer Study Group. Jekyll Island, Georgia.
Ott, J. R., J. T. Baccus, S. W. Roberts, D. E. Harmel, E. Fuchs and W. E. Armstrong. 1997. The comparative performance of spike- and fork-antlered yearling white-tailed deer: the basis for selection. Pp. 22-32 In D. Rollins (ed.). The Role of Genetics in White-tailed Deer Management. Texas A&M Univ. System and Texas Chapter of The Wildlife Society. College Station, Texas. 102 pp.
Ott, J. R., J. T. Baccus, S. W. Roberts, D. E. Harmel, E. Fuchs and W. E. Armstrong. 1998. Reliability of yearling antler characteristics as predictors of antler quality and body mass at ages 2.5, 3.5, and 4.5 years in Texas white-tailed deer. Abstracts of 21st Annual Southeast Deer Study Group. Jekyll Island, Georgia.
Ott, J. R., J. T.Baccus, S. Roberts, P. Hendrix, R. Kirchof, L. Poor, D. Harmel, E. Fuchs, and W. E. Armstrong. 1999. Predicting gross Boone and Crockett scores and live body mass at ages 2.5, 3.5, and 4.5 years in white-tailed deer on the basis of the previous year‘s antler characteristics and body mass. Abstracts of the 22nd Annual Southeast Deer Study Group Meeting. Fayetteville, AR. 70 pp.
Roberts, S. W. 1996. Comparison of antler characteristics and body weights of forked-antlered as a yearling to spike-antlered as a yearling white-tailed deer in Texas at age 4.5 years. MS Thesis
Skow, L. C., R. L. Honeycutt, J. D. Williams, A. DeWoody, and D. E. Harmel. 1995. Characterization of six PCR-based genetic markers in white-tailed deer. P. 29. In Abstracts of the 18th Annual Southeast Deer Study Group Meeting. San Antonio. 62 pp.
Skow, L. C., D. Honeycutt, R. L. Galagher, E. L. Young, and R. L. Honeycutt. 1999. Evaluation and use of bovid/ovid microsatellite markers for studies of white-tailed deer. Transactions of the 64th North American Wildlife and Natural Resources Conference. In Press.
55

Templeton, J. W., R. M Sharp, J. D. Williams, D. S Davis, D.E. Harmel, W. E. Armstrong, and S. E. Wardroup. 1982. Single dominant major gene effect on the expression of antler point number in the white-tailed deer. In: R. D. Brown (ed.), Antler Development in Cervidae, p. 469. Caesar Kleberg Wildlife Research Institute, Kingsville, TX.
Williams, J. D. and D. E. Harmel. 1984. Selection for antler points and body weight in white-tailed deer. Proceedings of the Annual Conference of the Southeast Association of Fish and Wildlife Agencies 38:43-50.
Williams, J. D., D. E. Harmel, kW. E. Armstrong, and S. E. Wardroup. 1983. Antler development in the white-tailed deer. Page 468 In R. D. Brown (ed.), Antler Development in Cervidae, p. 469. Caesar Kleberg Wildlife Research Institurte, Kingsville, TX.
Williams, J. D., W. F. Krueger, and D. E. Harmel. 1994. Heritabilities for antler characteristics and body weight in yearling white-tailed deer. Heredity 73:78-83.
Williams, J. D., W. F. Krueger, and D. E. Harmel. 1994. Heritabilities for antler characteristics and body weight in yearling white-tailed deer. In: The Sixteenth Annual Southeast Deer Study Group Meeting. Jackson, MS. 60 pp.
Williams, J., E. Fuchs, W. E. Armstrong, and D. Frels. 1999. The effects of genetic selection during nutritional stress on antler production. Abstracts of the 22nd Annual Southeast Deer Study Group Meeting. Fayetteville, AR. 70 pp.
Popular Articles
Armstrong, W. E., D. E. Harmel, W. F. Harwell, and E. L. Young. 1994. The management of spike bucks. Making Tracts for Texas Wildlife. Vol. 3:3. PWD BR N7100-191. Texas Parks and Wildlife Department. Austin. 8 pp.
Baxter, D., D. E. Harmel, W. E. Armstrong, and G. Butts. 1977. Spikes versus fork-antlered bucks. Texas Parks and Wildlife Magazine. Vol. 35(3):6-9.
Cox, J. 1980. Big Charlie Was No Ordinary Deer. PWD-LF-C2000-106. Texas Parks and Wildlife Department. Austin. 2 pp.
Harmel, D. E. 1981. Nutrition and heredity are the keys to big bucks. Texas Parks and Wildlife Magazine Vol. 39(7):24-26.
Williams, J. D. 1994. Genetic implications of several white-tailed deer management schemes. Texas Trophy Hunters. 19(6):33-38.
Williams, J. D. 1994. Are white-tailed deer antler characteristics inherited? Texas Trophy Hunters, 19(5):82-83,98-99,111.
56

Williams, J. D. 1994. Spikes are not inferior-or, are they? Texas Trophy Hunters. 19(4):96-99.
Federal Aid Reports
Davis, D. S. 1982. Effectiveness of Anthrax vaccine. Texas Parks and Wildlife Department. Progress report: Federal Aid Project No. W-109-R-6, Job 43. 8 pp.
Harmel, D. E., K.D. McGinty, and J.A. Johnston. Genetic selection in white-tailed deer. Texas Parks and Wildlife Department. Progress report: Federal Aid Project No. W-127-R-2, Job 61. 26 pp.
Harmel, D. E. 1983. White-tailed deer growth and development. Texas Parks and Wildlife Department. Progress report: Federal Aid Project No. W-109-R-6, Job 42. 14 pp.
Harmel, D. E. 1986. The effects of genetics on antler development and body size under field conditions. Texas Parks and Wildlife Department. Progress report: Federal Aid Project No. W-109-R-9, Job 38. 4 pp.
Harmel, D. E. 1985. Antler formation of white-tailed deer. Texas Parks and Wildlife Department. Progress report: Federal Aid Project No. W-109-R-7, Job 16. 47 pp.
Harmel, D. E., E. Fuchs, and K. D. McGinty. 1998. Genetic/Environmental interaction in white-tailed deer. Texas Parks and Wildlife Department. Progress report: Federal Aid Project No. W-127-R-6, Job 96. 18 pp.
Traweek, M. S. and S. E. Wardroup . 1995. White-tailed deer breeding chronology and reproduction. Texas Parks and Wildlife Department. Progress report: Federal Aid Project No. W-127-R-3, Job 95. 44 pp.
List of Professional Associates
The following is a list of college and university professors who have been directly associated with research projects at the Kerr Area deer pens.
W. F. Krueger, PhD, Professor of Poultry Science, Texas A&M University
Donald S. Davis, PhD Associate Professor of Wildlife and Fisheries Sciences and Veterinary Pathobiology, Texas A&M University
Joe W. Templeton, PhD Professor of Veterinary Pathobiology and Genetics, Texas A&M University
Loren C. Skow, PhD Professor of Veterinary Anatomy and Public Health, of Genetics and of Medical Biochemistry and Medical Genetics, Texas A&M University
57
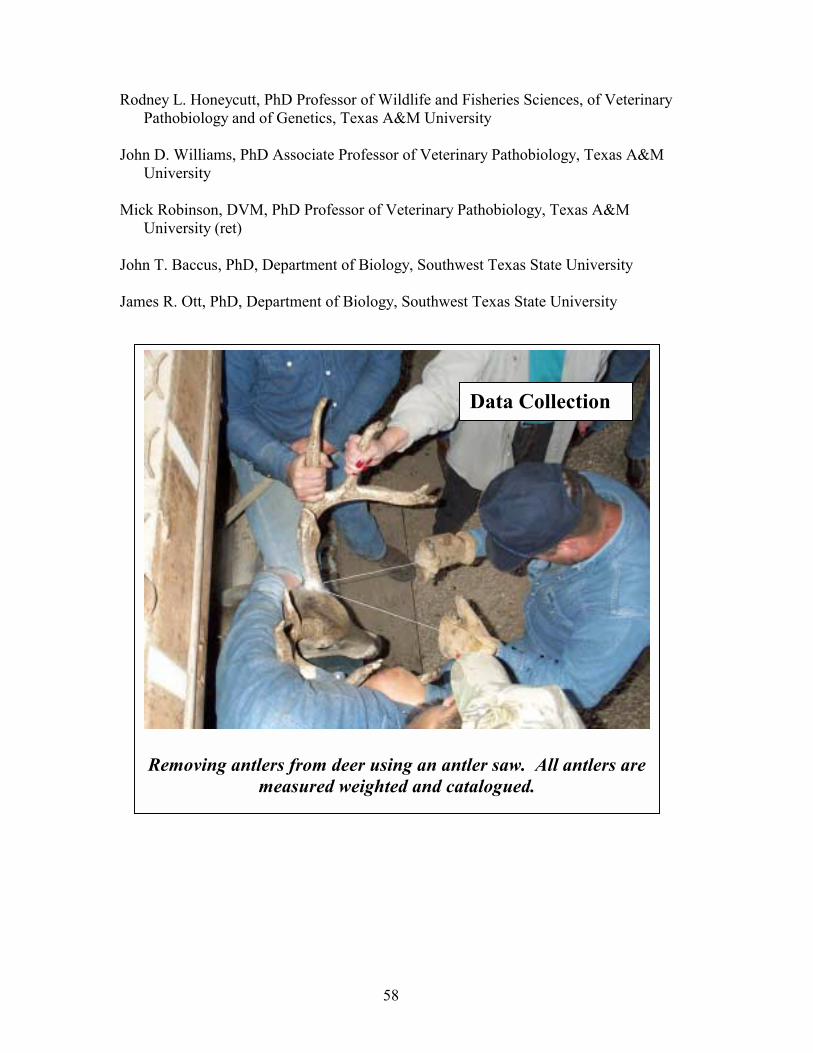
Rodney L. Honeycutt, PhD Professor of Wildlife and Fisheries Sciences, of Veterinary Pathobiology and of Genetics, Texas A&M University
John D. Williams, PhD Associate Professor of Veterinary Pathobiology, Texas A&M University
Mick Robinson, DVM, PhD Professor of Veterinary Pathobiology, Texas A&M University (ret)
John T. Baccus, PhD, Department of Biology, Southwest Texas State University
James R. Ott, PhD, Department of Biology, Southwest Texas State University
Data Collection
Removing antlers from deer using an antler saw. All antlers are measured weighted and catalogued.
58

59

Polled(Male/Female)
Horned(Male/Female)
P P pp
P/p P/p P/p P/p
P/p
VII. Appendices
Appendix A - Examples of effects of genes on the phenotype as well as selection for gene frequency
Short Horned Cattle an example of Complete Dominance
P/P
PolledPolled (Male/Female)(Male/Female)
P/PP/P p/p
HornedHorned (Male/Female)(Male/Female)
p/pp/p
PP PP pp
P/pP/p P/pP/p P/pP/p P/pP/p
All the P/pP/p would be polled but would not necessarily breed true.
Figure A-1 An example of complete dominance in short horned cattle.
In short horn cattle, the —P“ gene is dominate over the —p“ gene. Whenever a —P“ exists in the P/P or Pp alelle then the short horn would be polled. The only time a an animal would be horned is when it has two —pp“ recessive genes The problem in a selection of a sire in breeding whose objective is to breed for animals without horns is that the effects of the little —p“ are often hidden in an animal that has both the —Pp“ genes and is bred to another animal with the same genotype.
1 - A

Short Horn Cattle - Change in Gene Frequency in 5 generations with selective removal horned cattle
each generation
0.8
0.6
0.4
0.2
0
Polled PP Polled Pp Horned
0.25 0.5 0.25
1
0.44 0.44 0.11
2
0.56 0.38 0.06
3
0.64 0.32 0.04
4
0.69 0.28 0.03
5
Figure A-2 Change in gene frequency in 5 generations with selective removal of horned cattle each generation
The above chart illustrates how the percent of gene frequency changes over time with the selective removal of horned cattle each generation and allowing only polled animals left to breed. Notice that after 5 generations 69 percent of the herd was —PP“ with only three percent horned cattle in the population. If a horned bull was allowed to breed the —PP“ cows in the 5th generation all of the offspring would become —Pp“ and the selection process would need to begin again.
2 - A

Figure A-3 Effect of selection on gene frequency in short horned cattle
In the above short horn cattle examples, only two genes were involved but there were three genotypes and two phenotypes. This figure illustrates how the percent of —P“ and the percent of —p“ in the population changed over five generations. This is the change in gene frequency due to selection.
3 - A

Parents X RR Red
rr White
rRGametes
XF1 Rr Roan
Rr Roan
Male Gametes
R
r
R Female Gametes
RR Red
Rr Roan
Rr Roan
r
rr White
Red Roan White
Figure A-4. An example of incomplete dominance. In this case, homozygous animals were either red or white. Heterozygous animals were roan colored. If two roan colored animals bred, the offspring could be red, white, or roan. If a large number of offspring were produced, the probability would be that ³ would red, ³ white, and ² roan.
4 - A

Parents
prPRGametes
X PPRR
Polled Red pprr
Horned White
xF1 PpRr Polled Roan
PpRr Polled Roan
Male Gametes PR Pr
Female Gametes pR pr
PR PPRR Polled Red
PPRr Polled Roan
PpRR Polled Red
PpRr Polled Roan
Pr PPRr Polled Roan
PPrr Polled White
PpRr Polled Roan
Pprr Polled White
pR PpRr Polled Red
PpRr Polled Roan
ppRR Horned Red
ppRr Horned Roan
pr PpRr
Polled Roan Pprr
Polled White ppRr
Horned Roan Pprr
Horned White
Figure A-5. An example of two genes controlling two traits in short horned cattle.
5 - A

Parents
Gametes
F1 x
apAP
X
Male Gam etes AP Ap
Female Gametes aP ap
AP
Ap
aP
ap
Sapphire Aleutian Silver Standard
Figure A-6. Coat color in mink. An example of two genes controlling one trait. If a dominant A and a dominant P were present, the minkwould be a standard color. If a dominant A and a double recessive pwere present, the animal would be silver. If a double recessive a and a dominant P are present then the hair coat would be aleutian. Finally if both a and p were double recessive the coat color would be sapphire.
6 - A

Male FemaleXX
y XX
XX Xy XX Xy
Sex determination from the sex chromosome
notypeGeGenotype
SpSpeerrmm EgEgggChromosChromosoomeme XXX yy XX XX
XyMaleMale XyXy
FemaleFemale XXXX
priOfOffsfsprinngg
All XX offspring would be females and all Xy offspring would be males
XXXX XyXy XXXX XyXy
Figure A-7. Sex determination.
7 - A

Appendix B
Effects of Genetics and Nutrition On Antler Development and Body Size
Of White-tailed Deer
by
Donnie E. Harmel John D. Williams
William E. Armstrong
* Reproduced from PWD-BK-7100-155-2/90.
FA Report Series No. 26. A contribution of Federal Aid (P-R) Projects W-56-D, W-76-R, W-109-R, and W-14-C
Texas Parks and Wildlife Department Wildlife Division
1988 Revised 1989
1 - B

Foreword
The harvest of male white-tailed deer having only 2 —points“, also known as —spike bucks“, has been a controversial subject among landowners, hunters, and biologists over the years. The role of nutrition on body size and antler development had been previously investigated by many researchers; however, the role of genetics had not been investigated. In 1973, the Texas Parks and Wildlife Department initiated research to investigate the roles of these 2 aspects on body size and antler development in white-tailed deer. Dr. John D. Williams provided the data base, statistical analysis, and data interpretation through an interagency agreement with the Texas A & M University Agricultural Experiment Station. This project was funded under the Federal Aid in Wildlife Restoration Act, a sportsmen funded program, which apportions revenues collected as manufacturers‘ excise taxes on sporting arms, pistols, ammunition, and archery equipment to the states and territories for the conservation and management of wild birds and mammals.
Many people participated in the field studies over the period of years. Special acknowledgments are due to Robert L. Cook, who was in on the initial research planning, George W. Litton, Regional Director for Wildlife, Dr. R.M. Robinson, Gregg Butts, Joe Johnston, John M. Edinburgh, Susan Wardroup, Melvin J. Anderegg, Don M. McCarty and Bobbye Ficke. A special thanks goes to the many wildlife biologists and wildlife technicians, too numerous to name, who assisted in catching and handling deer for data collections over the years.
2 - B
TABLE OF CONTENTS
FOREWORD ............................................................................................................. 71 LIST OF TABLES ..................................................................................................... 73 LIST OF FIGURES.................................................................................................... 76 ABSTRACT................................................................................................................. 1 INTRODUCTION........................................................................................................ 2 NUTRITION PHASE I ................................................................................................ 3 Body Weights .................................................................................................... 4 Antler Characteristics ........................................................................................ 4 NUTRITION PHASE II............................................................................................. 11 GENETIC PHASE..................................................................................................... 17
Short History of Sires Used in the Genetic Phase ........................................... 18 Sire # 73046 - —Leroy“ ........................................................................... 18 Sire # 73041............................................................................................ 18 Sire # 73023 - —Rona“............................................................................. 18 Sire # 73009 - —Little Abbey“................................................................. 18 Sire # 73069 - —Little Murph“ ................................................................ 18 Sire # 73068............................................................................................ 19 Sire # 75064 - —Murph Jr.“ .................................................................... 19 Sire # 77037 - —Scrawny“ ....................................................................... 19 Sire # 73005 - —Big Charlie“ .................................................................. 20
Total Deer Produced ........................................................................................ 21 Body Weight vs. Total Antler Points............................................................... 23 Total Antler Points Between Age Classes....................................................... 23 Correlation Between Body Weight and Antler Measurements ....................... 25 Progeny Averages for the Nine Sires .............................................................. 28 Progeny Averages for Spike and Fork Line .................................................... 29 Back-Cross vs. Non-Inbred (Spike Line) ........................................................ 30 Comparison of 64 Deer.................................................................................... 30 Comparison of 26 Spike-Antlered Deer .......................................................... 32 Comparison of 38 Fork-Antlered Deer............................................................ 34
HERITABILITY ESTIMATES................................................................................. 36 CONCLUSIONS........................................................................................................ 38 Literature Cited and Selected References .................................................................. 39 Appendix I: Data Used in This Study ....................................................................... 40 Appendix II: Publications Resulting From This Study............................................. 41
3 - B

LIST OF TABLES
Number
1. High (16%) and low (8%) protein diets used in Kerr Wildlife Management Area antler development studies
2. Individual measurements for 5 white-tailed deer fed a 16% protein diet for 4 years (HHHH) Individual measurements for 4 white-tailed deer fed an 8% protein diet for 4 years (LLLL)
3. Individual measurements for 4 white-tailed deer fed a 16% and 8% protein diet alternately for 4 years (HLHL)
4. Individual measurements for 4 white-tailed deer fed an 8% and 16% protein diet alternately for 4 years (LHLH)
5. Average antler measurements and body weight for white-tailed deer fed a high (16%) or low (8%) protein diet continuously or alternately for 4 years
6. Measurements for 9 white-tailed deer that were spike-antlered at 1.5 years of age
7. Measurements for 7 white-tailed deer that were fork-antlered at 1.5 years of age
8. Average antler measurements and body weights of bucks classified as spike- or fork-antlered at 1.5 years of age
9. Definitions and symbols used for antler measurements and body weight
10. Mean body weight and antler measurements for 9 white-tailed deer sires at 1.5, 2.5, and 3.5 years of age
11. Total progeny (223 males, 205 females) produced by 9 sires during the period 1975 œ 1980
12. Classification of 55 inbred (FX > 0) and 58 non-inbred (FX = 0) progeny from 9 sires as spike- or fork-antlered at 1.5 years of age
13. Average live body weight (lbs) versus total antler points for 64 male white-tailed deer at 1.5, 2.5, and 3.5 years of age
14. Frequency distribution of total antler points for 64 white-tailed deer at 1.5 and 2.5 years of age
4 - B

15. Frequency distribution of total antler points for 64 white-tailed deer at 1.5 and 3.5 years of age
16. Frequency distribution of total antler points for 64 white-tailed deer at 2.5 and 3.5 years of age
17. Correlation between body weight and antler measurements for 64 (26 spike- and 38 fork-antlered) white-tailed deer at 1.5 years of age
18. Correlation between body weight and antler measurements for 64 (26 spike- and 38 fork-antlered) white-tailed deer at 1.5 and 2.5 years of age
19. Correlation between body weight and antler measurements for 64 (26 spike- and 38 fork-antlered) white-tailed deer at 1.5 and 3.5 years of age
20. Correlation between body weight and antler measurements for 64 (26 spike- and 38 fork-antlered) white-tailed deer at 2.5 years of age
21. Correlation between body weight and antler measurements for 64 (26 spike- and 38 fork-antlered) white-tailed deer at 2.5 and 3.5 years of age
22. Correlation between body weight and antler measurements for 64 (26 spike- and 38 fork-antlered) white-tailed deer at 3.5 years of age
23. Mean body weight and antler measurements for 1.5-year-old progeny from 9 white-tailed deer sires
24. Mean body weight and antler measurements for 2.5-year-old progeny from 9 white-tailed deer sires
25. Mean body weight and antler measurements for 3.5-year-old progeny from 9 white-tailed deer sires
26. Comparison of body weight and antler measurements between the —fork line“ and —spike line“ at 1.5, 2.5, and 3.5 years of age
27. Comparison of body weight and antler measurements between non-inbred (FX = 0) and back-cross or inbred (FX > 0) progeny at 1.5, 2.5, and 3.5 years of age
28. Average live body weight for 64 white-tailed deer at 1.5, 2.5, and 3.5 years of age
29. Average main beam length for 64 white-tailed deer at 1.5, 2.5, and 3.5 years of age
5 - B

30. Average antler weight for 64 white-tailed deer at 1.5, 2.5, and 3.5 years of age
31. Average basal circumference for 64 white-tailed deer at 1.5, 2.5, and 3.5 years of age
32. Average main beam spread for 64 white-tailed deer at 1.5, 2.5, and 3.5 years of age
33. Distribution of antler points at 2.5 and 3.5 years of age for 26 deer that were spike-antlered at 1.5 years
34. Average live body weight at 1.5, 2.5, and 3.5 years of age for 26 deer that were spike-antlered at 1.5 years
35. Average main beam length at 1.5, 2.5, and 3.5 years of age for 26 deer that were spike-antlered at 1.5 years
36. Average total antler weight at 1.5, 2.5, and 3.5 years of age for 26 deer that were spike-antlered at 1.5 years
37. Average basal circumference at 1.5, 2.5, and 3.5 years of age for 26 deer that were spike-antlered at 1.5 years
38. Average main beam spread at 1.5, 2.5, and 3.5 years of age for 26 deer that were spike-antlered at 1.5 years
39. Average live body weight at 1.5, 2.5, and 3.5 years of age for 38 deer that were fork-antlered at 1.5 years
40. Average main beam length at 1.5, 2.5, and 3.5 years of age for 38 deer that were fork-antlered at 1.5 years
41. Average total antler weight at 1.5, 2.5, and 3.5 years of age for 38 deer that were fork-antlered at 1.5 years
42. Average basal circumference at 1.5, 2.5, and 3.5 years of age for 38 deer that were fork-antlered at 1.5 years
43. Average main beam spread at 1.5, 2.5, and 3.5 years of age for 38 deer that were fork-antlered at 1.5 years
44. Heritability estimates, using regression of offspring on sire, for body weight and antler measurements for 1.5-, 2.5-, and 3.5-year-old white-tailed deer
6 - B

LIST OF FIGURES
Number
1. Diagram of research pens used in this study
2. Average main beam length for white-tailed deer fed a high (H) or low (L) protein diet continuously or alternately for 4 years
3. Average basal circumference for white-tailed deer fed a high (H) or low (L) protein diet continuously or alternately for 4 years
4. Average total antler points for white-tailed deer fed a high (H) or low (L) protein diet continuously or alternately for 4 years
5. Average total antler weight for white-tailed deer fed a high (H) or low (L) protein diet continuously or alternately for 4 years
6. Average main beam spread for white-tailed deer fed a high (H) or low (L) protein diet continuously or alternately for 4 years
7. Average live body weight for white-tailed deer fed a high (H) or low (L) protein diet continuously or alternately for 4 years
8. Antlers of 3.5-year-old bucks, all of which received a 16% protein ration ad libitum
9. Average main beam length for white-tailed deer that were classified as spike- or fork-antlered at 1.5 years of age
10. Average basal circumference for white-tailed deer that were classified as spike- or fork-antlered at 1.5 years of age
11. Average total antler points for white-tailed deer that were classified as spike- or fork-antlered at 1.5 years of age
12. Average total antler weight for white-tailed deer that were classified as spike- or fork-antlered at 1.5 years of age
13. Average main beam spread for white-tailed deer that were classified as spike- or fork-antlered at 1.5 years of age
14. Average live body weight for white-tailed deer that were classified as spike- or fork-antlered at 1.5 years of age
7 - B

15. The —fork line“ sire and a —spike line“ sire, both deer at 3.5 years of age
16. Sire # 73005, —Big Charlie“, of the —fork line“
17. —A&M Charlie“, father of —Big Charlie“
18. —Salty“, maternal grandfather of —Big Charlie“
19. —Spike line“ sire # 73041 at 5.5 years of age
20. Offspring of —spike line“ sire #73041 at 5.5 years of age
21. Phenotypic characteristics such as antlers and body weight of white-tailed deer are heritable characters, which are influenced by both genetic and nutrition and the interaction of the 2 factors
8 - B
Effects of Genetics and Nutrition on Antler Development and Body Size of White-tailed Deer
By
Donnie E. Harmel Texas Parks and Wildlife Department
Kerr Wildlife Management Area Hunt, Texas 78024
John D. Williams Texas A&M University
College Station, Texas 77843
William E. Armstrong Texas Parks and Wildlife Department
Kerr Wildlife Management Area Hunt, Texas 78024
ABSTRACT
In 1973, an experiment to determine the relationship between antler development, nutrition and genetics was begun by the Texas Parks and Wildlife Department in the research facilities at the Kerr Wildlife Management Area, Hunt, Texas. This research covers a period from 1973-1985, during which body weights and antler measurements (main beam spread and lengths, basal circumference, total antler points, and weight) were collected from 150 different male white-tailed deer. One hundred thirty-eight of these deer were produced by single male matings on the Kerr Wildlife Management Area during the period 1974-1981. Management was maintained as constant as possible and except for the nutrition portion, all deer were fed a 16% protein diet ad libitum. Twelve sires and 66 dams were used and 505 different sets of antlers were measured (150 at 1.5, 115 at 2.5, 90 at 3.5, 79 at 4.5, 54 at 5.5 and 17 at 6.5 or more years of age). Results indicate that (1) body weight and antler characteristics respond in direct proportions to the quality of their diet, (2) antler characteristics and body weight are phenotypic characters that are influenced both by genetics and nutrition, (3) yearling spike-antlered deer are inferior to fork-antlered yearlings with regard to body weight and antler characteristics and will remain so in succeeding years, (4) most deer which are spike-antlered as yearlings will not be spike-antlered in later years, but will continue to be inferior to their fork-antlered cohorts, and (5) body weight and antler characteristics appear to be highly heritable characters. We conclude from these results that spike-antlered white-tailed deer should not receive differential protection.
9 - B

INTRODUCTION
In the 1960‘s and 1970‘s the Texas Parks and Wildlife Department received substantial criticism from landowners and hunters concerning the harvest of spike bucks. Opponents of spike buck harvest maintained that spike bucks must be protected to ensure adequate numbers of bucks in future harvests, while proponents of spike buck harvest contended that these deer are inferior animals and should be removed from the herd or receive no differential protection.
Other studies have been concerned with the relationship between nutrition and the formation of spike antlers with little or no emphasis on genetics. The influence of genetics on antler formation had not been investigated. This study attempts to evaluate nutrition and genetics as contributing factors to antler formation. These penned deer studies were conducted on the Kerr Wildlife Management Area located 13 miles west of Hunt, Texas in a 16-acre research facility consisting of 6 2/3-acre pens, 3 4-acre pens and 24 small individual pens (Fig 1). All deer involved in these studies were fed a commercial pelleted ration and provided free-choice water. The original deer were native Texas white-tailed deer which were obtained from various locations in the State. No additional deer were added after the fall of 1974 and the herd was maintained as a —closed“ herd.
This study was divided into 3 phases, 2 nutritional and 1 genetic, with the following objectives:
1. To determine factors which contribute to antler formation in the white-tailed deer.
2. To determine the effect of nutrition level on antler formation and body weight.
3. To determine if deer that were spike-antlered at 1.5 years have the same potential for antler development and body weight in later years as deer that were fork-antlered at 1.5 years.
4. To estimate the influence of genetics on antler characteristics.
10 - B
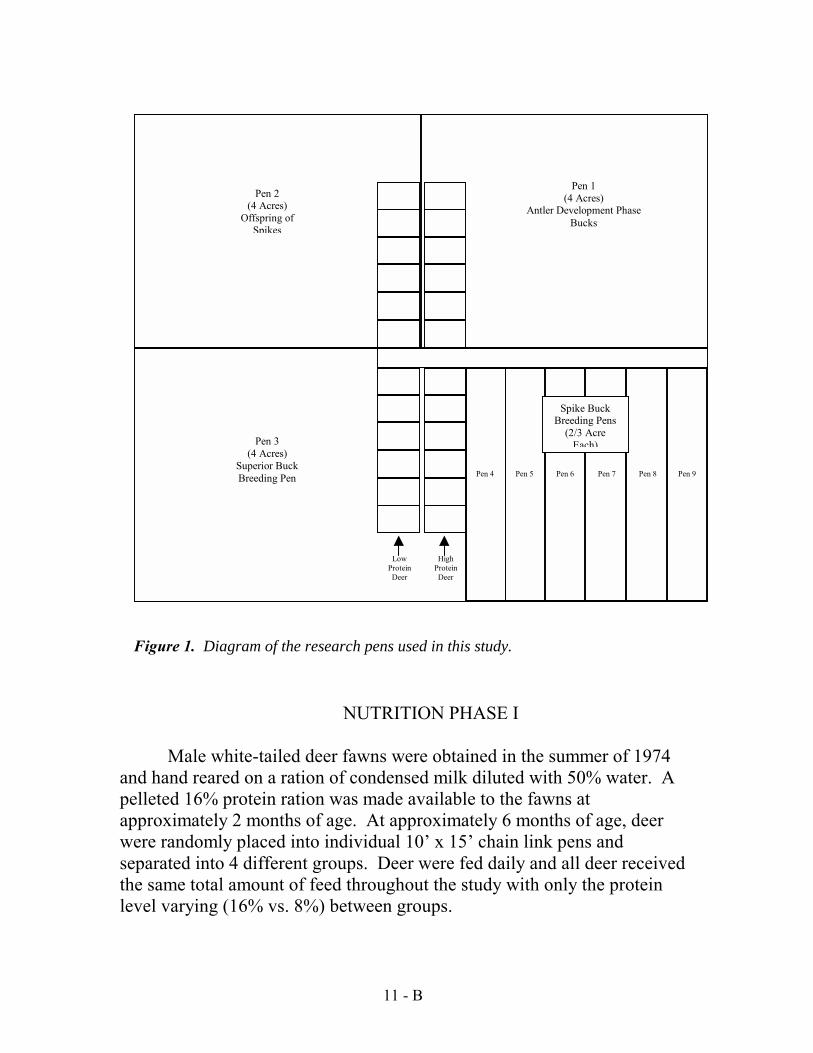
Pen 1 Pen 2 (4 Acres)
(4 Acres) Antler Development Phase Offspring of Bucks
Spikes
Pen 3 (4 Acres)
Superior Buck Breeding Pen Pen 4 Pen 5 Pen 7 Pen 6
Spike Buck Breeding Pens
(2/3 Acre Each)
Pen 8 Pen 9
Low Protein Deer
High Protein Deer
Figure 1. Diagram of the research pens used in this study.
NUTRITION PHASE I
Male white-tailed deer fawns were obtained in the summer of 1974 and hand reared on a ration of condensed milk diluted with 50% water. A pelleted 16% protein ration was made available to the fawns at approximately 2 months of age. At approximately 6 months of age, deer were randomly placed into individual 10‘ x 15‘ chain link pens and separated into 4 different groups. Deer were fed daily and all deer received the same total amount of feed throughout the study with only the protein level varying (16% vs. 8%) between groups.
11 - B
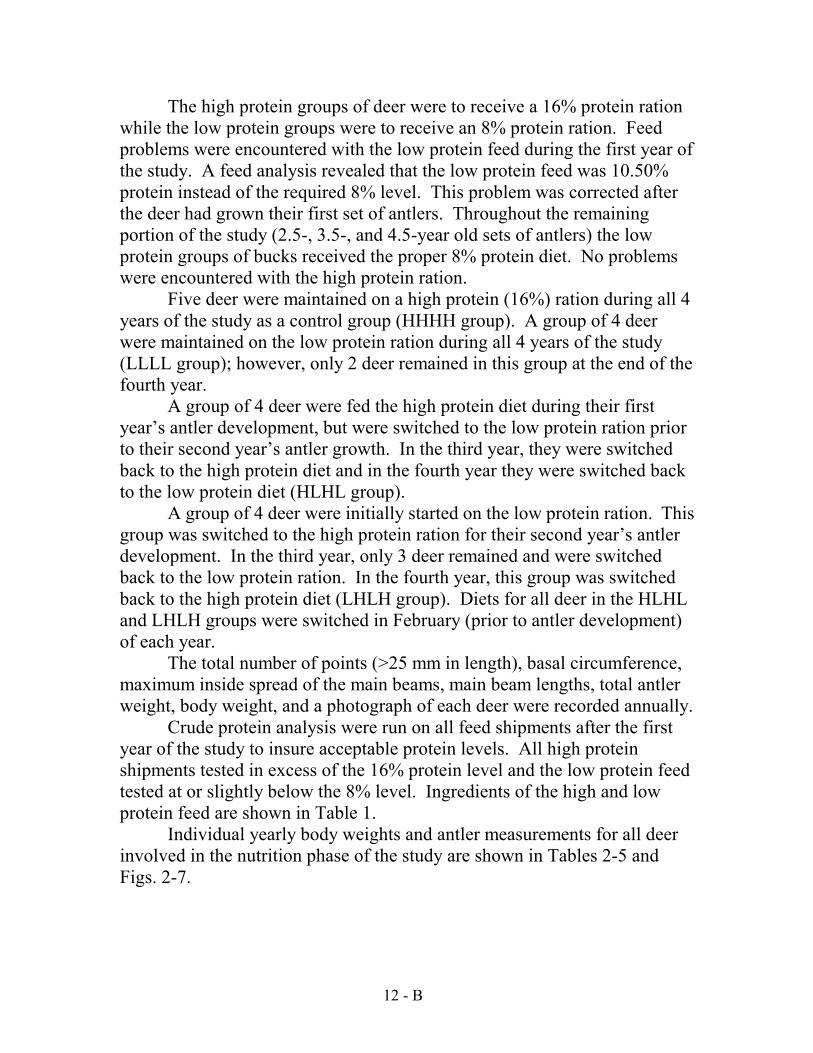
The high protein groups of deer were to receive a 16% protein ration while the low protein groups were to receive an 8% protein ration. Feed problems were encountered with the low protein feed during the first year of the study. A feed analysis revealed that the low protein feed was 10.50% protein instead of the required 8% level. This problem was corrected after the deer had grown their first set of antlers. Throughout the remaining portion of the study (2.5-, 3.5-, and 4.5-year old sets of antlers) the low protein groups of bucks received the proper 8% protein diet. No problems were encountered with the high protein ration.
Five deer were maintained on a high protein (16%) ration during all 4 years of the study as a control group (HHHH group). A group of 4 deer were maintained on the low protein ration during all 4 years of the study (LLLL group); however, only 2 deer remained in this group at the end of the fourth year.
A group of 4 deer were fed the high protein diet during their first year‘s antler development, but were switched to the low protein ration prior to their second year‘s antler growth. In the third year, they were switched back to the high protein diet and in the fourth year they were switched back to the low protein diet (HLHL group).
A group of 4 deer were initially started on the low protein ration. This group was switched to the high protein ration for their second year‘s antler development. In the third year, only 3 deer remained and were switched back to the low protein ration. In the fourth year, this group was switched back to the high protein diet (LHLH group). Diets for all deer in the HLHL and LHLH groups were switched in February (prior to antler development) of each year.
The total number of points (>25 mm in length), basal circumference, maximum inside spread of the main beams, main beam lengths, total antler weight, body weight, and a photograph of each deer were recorded annually.
Crude protein analysis were run on all feed shipments after the first year of the study to insure acceptable protein levels. All high protein shipments tested in excess of the 16% protein level and the low protein feed tested at or slightly below the 8% level. Ingredients of the high and low protein feed are shown in Table 1.
Individual yearly body weights and antler measurements for all deer involved in the nutrition phase of the study are shown in Tables 2-5 and Figs. 2-7.
12 - B
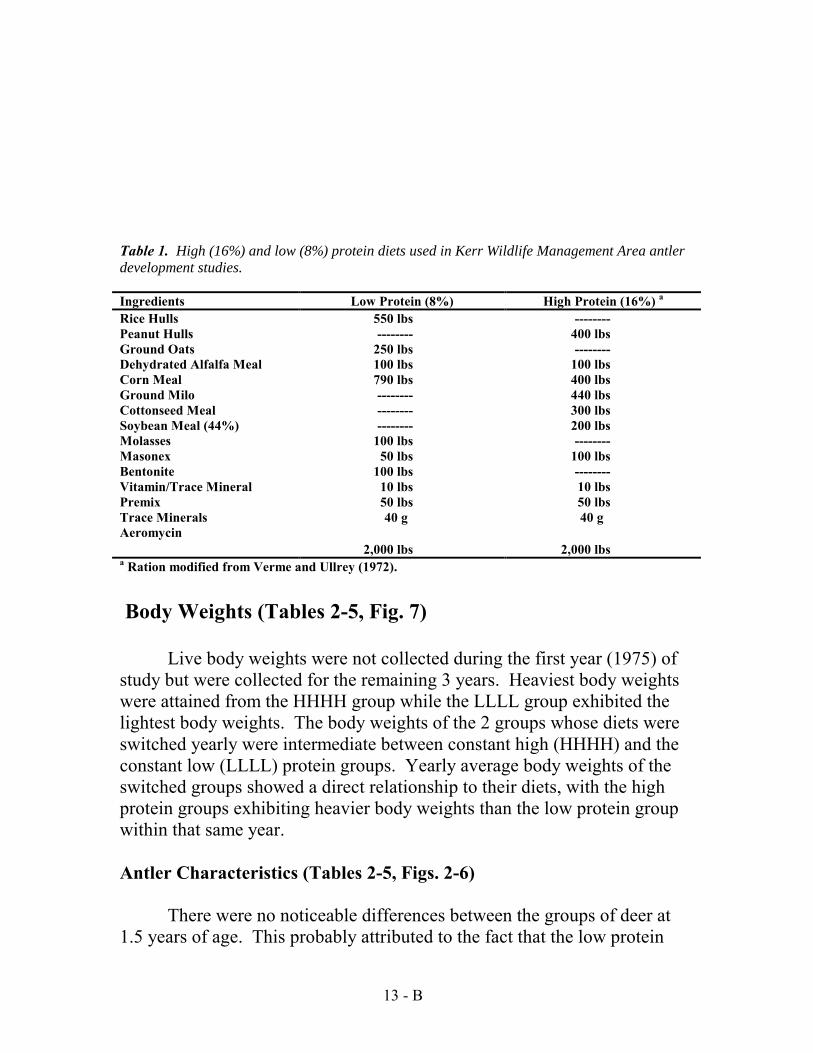
Table 1. High (16%) and low (8%) protein diets used in Kerr Wildlife Management Area antler development studies.
Ingredients Low Protein (8%) High Protein (16%) a
Rice Hulls Peanut Hulls Ground Oats Dehydrated Alfalfa Meal Corn Meal Ground Milo Cottonseed Meal Soybean Meal (44%) Molasses Masonex Bentonite Vitamin/Trace Mineral Premix Trace Minerals Aeromycin
550 lbs -------- 250 lbs 100 lbs 790 lbs --------
----------------
100 lbs 50 lbs 100 lbs 10 lbs 50 lbs
40 g
2,000 lbs
-------- 400 lbs -------- 100 lbs 400 lbs 440 lbs 300 lbs 200 lbs -------- 100 lbs -------- 10 lbs 50 lbs
40 g
2,000 lbs a Ration modified from Verme and Ullrey (1972).
Body Weights (Tables 2-5, Fig. 7)
Live body weights were not collected during the first year (1975) of study but were collected for the remaining 3 years. Heaviest body weights were attained from the HHHH group while the LLLL group exhibited the lightest body weights. The body weights of the 2 groups whose diets were switched yearly were intermediate between constant high (HHHH) and the constant low (LLLL) protein groups. Yearly average body weights of the switched groups showed a direct relationship to their diets, with the high protein groups exhibiting heavier body weights than the low protein group within that same year.
Antler Characteristics (Tables 2-5, Figs. 2-6)
There were no noticeable differences between the groups of deer at 1.5 years of age. This probably attributed to the fact that the low protein
13 - B

groups of deer were receiving a 10.5% protein diet instead of the required 8% level.
The LHLH group exhibited the greatest antler development in all categories at 2.5 years of age while the LLLL group exhibited the smallest measurements. The HHHH group exhibited the second largest antler measurements in all categories except inside main beam spread, where the HLHL group surpassed them. The HLHL group exhibited the third largest antler measurements in the remaining categories.
The HLHL group exhibited superior measurements in main beam spread, main beam length and antler weight for the 3.5-year old age class. The LLLL group had the most number of points while the LHLH group had the largest basal circumference.
The 2 remaining deer in the LHLH group exhibited superior antler development in all antler characteristics while the 2 remaining deer in the LLLL group exhibited the poorest antler development.
During the last 3 years of the study, the group of deer that were on the continuous high protein ration (HHHH) was superior to the continuous low protein group (LLLL) in all morphological characteristics. The 2 groups whose diets were alternately switched from year to year exhibited intermediate morphological characteristics with individual deer performance depending upon the yearly diet. Deer in these groups responded to the quality of their diets, with some deer while on the high protein ration exceeding deer in the HHHH group. This variability among deer would indicate some genetic influence on the ability to exhibit phenotypic characteristics. If a deer receives a poor nutritional diet during the first few years of life and if the nutritional quality is later improved, antler development will respond accordingly. Likewise, if the quality of the ration is lowered, antler quality will also decrease. If maximum potential body weights are to be achieved, a high level of nutrition is needed throughout the deer‘s life. The HHHH group achieved the largest body weights when compared to the switched groups and the LLLL groups (Table 6). Deer on fluctuating diets probably will not achieve their maximum body weight potential because skeletal development may be retarded during periods of poor nutrition. Antler development, however, will respond according to the quality of the diet.
14 - B

Table 2. Individual measurements for 5 white-tailed deer fed a 16% protein diet for 4 years (HHHH).
Basal Main Main beam circumference Antler beam Body
Protei Age length (mm) (mm) Total weight spread weight Id n % (years) right left right left points (g) (mm) (lbs)
92-57 16 1.5 176 170 61 69 6 150 240 ---16 2.5 315 300 67 65 6 313 341 148 16 3.5 453 460 92 89 8 642 374 177 16 4.5 502 444 94 91 8 743 368 188
91-54 16 1.5 170 140 50 59 2 59 233 ---16 2.5 338 315 68 74 6 330 325 135 16 3.5 413 450 93 92 8 693 321 160 16 4.5 447 435 95 95 8 839 335 164
84-42 16 1.5 250 264 90 70 5 225 297 ---16 2.5 340 351 74 75 6 450 364 165 16 3.5 425 445 95 97 9 755 375 184 16 4.5 420 375 97 96 9 802 394 153
66-45 16 1.5 256 245 68 81 8 220 210 ---16 2.5 370 366 76 77 8 475 320 153 16 3.5 445 440 91 93 9 732 350 163 16 4.5 370 375 88 88 9 521 330 149
61-45 16 1.5 206 184 68 68 5 144 165 ---16 2.5 363 359 91 87 8 591 269 155 16 3.5 380 443 95 99 7 764 290 183 16 4.5 433 425 96 95 8 693 330 169
15 - B

Table 3. Individual measurements for 4 white-tailed deer fed an 8% protein diet for 4 years (LLLL).
Basal Main Main beam circumference Antler beam Body
Protei Age length (mm) (mm) Total weight spread weight Id n % (years) right left right left points (g) (mm) (lbs)
67-45 10 8 8 8
1.5 2.5 3.5 4.5
204 230 403 257
185 236 405 280
75 60 84 70
72 60 85 72
6 4 8 8
162 175 600 209
293 291 351 310
---104 150 129
38-32 10 8 8 8
1.5 2.5 3.5 4.5
173 315 425 312
250 319 387 314
75 75 95 83
85 80 90 72
6 8
10 7
207 352 620 219
251 312 356 312
---113 129 116
98-40 10 8
1.5 2.5
216 270
192 256
71 75
82 70
6 6
152 240
265 258
---117
98-42 10 8
1.5 2.5
142 223
129 226
62 60
58 61
4 5
56 166
190 274
---126
Table 4. Individual measurements for 4 white-tailed deer fed a 16% and 8% protein diet alternately for 4 years (HLHL).
Basal Main Main beam circumference Antler beam Body
Protei Age length (mm) (mm) Total weight spread weight Id n % (years) right left right left points (g) (mm) (lbs)
70-51 16 8
16 8
1.5 2.5 3.5 4.5
230 370 454 500
205 392 450 490
73 73 88 90
86 72 90 87
2 7 8
10
131 447 801 842
328 383 390 445
---127 144 138
94-35 16 8
16 8
1.5 2.5 3.5 4.5
235 351 435 403
253 340 425 414
85 74 94 92
67 75 94 92
6 6 8 8
187 328 681 674
236 304 357 381
---116 161 156
57-51 16 8
16 8
1.5 2.5 3.5 4.5
180 317 445 389
230 266 435 344
67 80
115 85
59 73 90 92
4 7 8 9
153 355 847 535
270 277 351 346
---123 161 143
82-14 16 8
16 8
1.5 2.5 3.5 4.5
---258 430 389
---311 428 382
---64 90 85
---63 86 87
---5 8 8
---205 601 498
---392 510 480
---105 134 132
16 - B

Table 5. Individual measurements for 4 white-tailed deer fed an 8% and 16% protein diet alternately for 4 years (LHLH).
Basal Main Main beam circumference Antler beam Body
Protei Age length (mm) (mm) Total weight spread weight Id n % (years) right left right left points (g) (mm) (lbs)
53-32 10 16 8
16
1.5 2.5 3.5 4.5
177 349 391 450
201 352 431 423
68 89
107 105
91 93
106 105
5 7 7 9
159 460 623 719
245 407 423 408
---128 121 137
93-64 10 16 8
16
1.5 2.5 3.5 4.5
252 417 475 490
267 424 440 487
73 88
107 124
77 87
105 115
5 8 9
10
224 578 882
1059
341 385 390 445
---127 139 157
60-58 10 16 8
1.5 2.5 3.5
126 396 415
149 350 434
67 78 88
69 76 87
2 8 8
75 465 621
---310 327
---128 162
85-44 10 16
1.5 2.5
236 332
217 334
67 85
81 85
6 7
158 433
302 429
---144
Table 6. Average antler measurements and body weight for white-tailed deer fed a high (16%) or low (8%) protein diet continuously or alternately for 4 years.
Sampl e
Size
Protei n %
Age (years)
Main beam length (mm)
Basal circumferenc
e (mm) Total points
Antler weight
(g)
Main beam
spread (mm)
Body weight (lbs)
5 5 5 5
16 16 16 16
1.5 2.5 3.5 4.5
206.10 341.70 435.40 422.60
68.40 75.40 93.60 93.40
5.20 6.80 8.20 8.40
159.60 428.20 717.20 719.60
229.00 323.80 342.00 351.40
---151.20 173.40 164.60
4 4 2 2
10 8 8 8
1.5 2.5 3.5 4.5
136.38 259.38 405.00 290.75
72.50 67.63 88.50 74.25
5.50 5.75 9.00 7.50
144.25 233.25 610.00 214.00
249.75 283.75 353.50 311.00
---115.00 139.50 122.50
3 4 4 4
16 8
16 8
1.5 2.5 3.5 4.5
222.17 325.63 437.75 415.00
68.67 71.75 93.38 88.75
4.00 6.25 8.00 8.75
157.00 333.75 732.50 637.25
278.00 339.00 402.00 413.00
---117.75 150.00 142.25
4 4 3 2
10 16 8
16
1.5 2.5 3.5 4.5
203.13 365.88 431.00 462.50
74.13 85.13
100.00 112.25
4.50 7.50 8.00 9.50
154.00 484.00 708.67 889.00
296.00 382.75 380.00 426.50
---127.67 140.67 147.00
17 - B

Basa
l Circ
umfe
renc
e (m
m)
Mai
n Be
am L
engt
h (m
m)
HHHH LLLL HLHL LHLH
500 450 400 350 300 250 200 150 100 50 0
1.5 2.5 3.5 4.5 Age (Years)
Figure 2. Average main beam length for white-tailed deer fed a high (H) or low (L) protein diet continuously or alternately for 4 years.
HHHH LLLL HLHL LHLH
120
100
80
60
40
20
0 1.5 2.5 3.5 4.5
Age (Years)
Figure 3. Average basal circumference for white-tailed deer fed a high (H) or low (L) protein diet continuously or alternately for 4 years.
18 - B

Tota
l Ant
ler W
eigh
t (g)
To
tal A
ntle
r Poi
nts
HHHH LLLL HLHL LHLH
10 9 8 7 6 5 4 3 2 1 0
1.5 2.5 3.5 4.5 Age (Years)
Figure 4. Average total antler points for white-tailed deer fed a high (H) or low (L) protein diet continuously or alternately for 4 years.
HHHH LLLL HLHL LHLH
900
800
700
600
500
400
300
200
100
0 1.5 2.5 3.5 4.5
Age (Years)
Figure 5. Average total antler weight for white-tailed deer fed a high (H) or low (L) protein diet continuously or alternately for 4 years.
19 - B

Live
Bod
y W
eigh
t (lb
s)
Mai
n Be
am S
prea
d (m
m)
HHHH LLLL HLHL LHLH
450
400
350
300
250
200
150
100
50
0 1.5 2.5 3.5 4.5
Age (Years)
Figure 6. Average main beam spread for white-tailed deer fed a high (H) or low (L) protein diet continuously or alternately for 4 years.
HHHH LLLL HLHL LHLH
180
160
140
120
100
80
60
40
20
0 1.5 2.5 3.5 4.5
Age (Years)
Figure 7. Average live body weight for white-tailed deer fed a high (H) or low (L) protein diet continuously or alternately for 4 years.
20 - B

NUTRITION PHASE II
A group of 16 bucks born in 1973 were maintained on the 16% high protein diet (Table 1) ad libitum to demonstrate the long term effect of good nutrition on antler development and body size. Nine of these bucks were spike-antlered yearlings (1.5-years-old) and 7 were fork-antlered. Their yearling antler status, spike- or fork-antlered, was used for grouping in successive years. Antler development and body weights of the spike-antlered group versus the fork-antlered group were compared each year to determine if the spike-antlered group remained inferior to the fork-antlered group in later years.
All bucks were captured during the last 2 weeks of October and the first week of November each year. The total number of points (>25 mm in length), basal circumference, maximum inside spread of the main beams, main beam lengths, total antler weight, body weight (1.5 and 2.5 years were not recorded), and a photograph of each deer were recorded annually.
Throughout the 6-year study, the spike-antlered group was consistently smaller in body size and antler development than the fork-antlered group (Tables 7-9, Figs. 9-14). Antlers of the spike-antlered group generally averaged approximately half the weight of the fork-antlered group within each year. In all other measurements, the fork-antlered group also surpassed the spike-antlered group throughout the 6-year study. One particular buck in the spike-antlered group never produced more than 4 points.
These data do not support the old belief that spike bucks should be protected during the hunting season with the idea that they will be the good quality bucks in future years. Even though some spike bucks develop into quality animals, on the average they will not in later years equal deer that had forked antlers as yearlings (Fig.8). Therefore, spike bucks should not receive differential protection during the hunting season.
21 - B
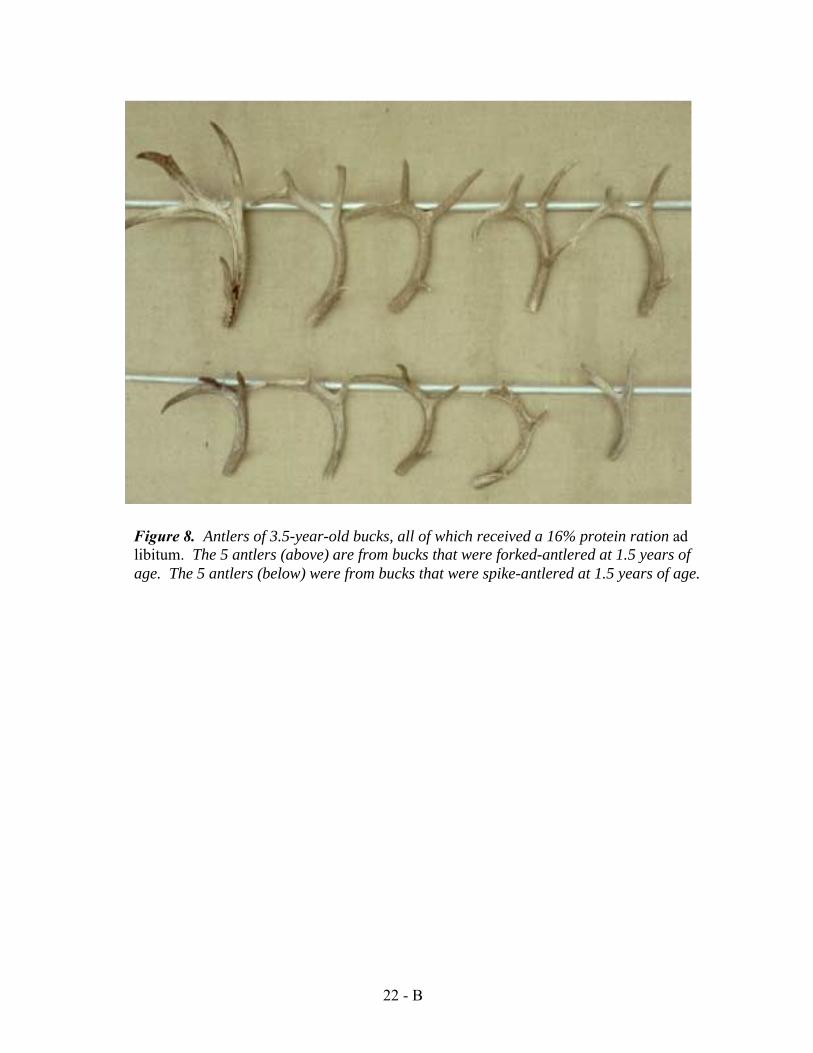
Figure 8. Antlers of 3.5-year-old bucks, all of which received a 16% protein ration ad libitum. The 5 antlers (above) are from bucks that were forked-antlered at 1.5 years of age. The 5 antlers (below) were from bucks that were spike-antlered at 1.5 years of age.
22 - B

Table 7. Measurements for 9 white-tailed deer that were spike-antlered at 1.5 years of age.
Basal Main Main beam circumference Antler beam Body
Age length (mm) (mm) Total weight spread weight Id (years) right left right left points (g) (mm) (lbs)
63-68 1.5 67 151 35 47 2 32 --- ---2.5 261 250 62 65 7 223 276 ---3.5 410 402 75 77 9 499 390 155 4.5 460 445 87 92 9 673 373 157
73-41 1.5 152 144 56 53 2 73 --- ---2.5 232 234 69 71 4 242 275 ---3.5 246 258 70 69 4 222 325 145 4.5 340 330 88 89 3 374 341 166 5.5 382 383 88 87 4 530 350 160 6.5 328 358 88 88 4 542 350 164
00-70 1.5 --- --- --- --- 2 --- --- ---2.5 345 332 81 82 9 430 305 ---3.5 469 455 86 87 8 806 372 179 4.5 435 430 98 100 8 751 344 191
5.5 473 436 117 116 10 901 252 174 73-09 1.5 82 84 51 45 2 30 --- ---
2.5 315 309 76 73 6 374 260 ---3.5 330 361 80 80 7 452 355 167 4.5 430 460 101 97 8 731 395 193 5.5 470 485 101 101 7 802 410 189
6.5 408 422 95 95 7 740 392 188 73-46 1.5 61 21 36 10 2 6 --- ---
2.5 355 367 78 78 7 517 298 ---3.5 410 410 80 80 8 532 385 ---4.5 460 456 91 91 9 698 438 169 5.5 470 468 89 88 8 690 456 159
6.5 394 412 96 94 9 747 417 163 73-23 1.5 100 111 42 44 2 29 --- ---
2.5 325 332 83 81 8 533 --- ---3.5 425 430 89 90 8 733 356 175 4.5 493 475 98 98 8 1041 366 191 5.5 491 487 97 99 8 1003 345 177
00-40 1.5 95 159 62 54 2 58 --- ---2.5 235 292 73 74 6 335 324 ---3.5 398 398 88 85 7 561 360 163 4.5 422 437 104 108 8 764 395 185
73-69 1.5 44 42 36 35 2 9 --- ---2.5 245 238 64 66 4 225 258 ---3.5 315 302 73 72 5 383 297 114 4.5 340 325 90 87 6 524 300 140 5.5 404 396 90 94 5 737 345 141
23 - B

00-41 1.5 --- --- --- --- 2 --- --- ---2.5 365 319 84 88 10 622 353 ---3.5 480 435 103 109 9 918 407 216
Table 8. Measurements for 7 white-tailed deer that were fork-antlered at 1.5 years of age.
Basal Main Main beam circumference Antler beam Body
Age length (mm) (mm) Total weight spread weight Id (years) right left right left points (g) (mm) (lbs)
73-05 1.5 --- --- --- --- 6 --- --- ---2.5 470 465 90 93 11 1049 423 ---3.5 554 550 109 107 10 1842 458 211 4.5 620 610 116 115 10 1864 464 216 5.5 624 600 120 118 11 2105 475 209 6.5 577 571 123 119 15 2258 484 216
73-07 1.5 262 235 66 64 4 163 --- ---2.5 352 383 87 89 8 --- --- ---3.5 --- --- --- --- --- --- --- 177 4.5 --- --- --- --- --- --- --- 205 5.5 513 490 112 99 6 967 391 182
6.5 506 469 107 99 6 832 375 185 19-73 1.5 223 220 68 65 5 179 --- ---
2.5 435 429 85 84 8 614 338 ---3.5 493 480 97 95 8 971 438 157 4.5 535 530 115 114 10 1308 470 177 5.5 524 496 107 110 9 1060 463 172 6.5 507 517 105 107 8 1093 450 173
00-81 1.5 --- --- --- --- 4 --- --- ---2.5 385 405 87 89 7 628 371 ---3.5 540 515 100 97 8 1175 395 178 4.5 557 523 114 112 8 1345 441 204 5.5 600 573 112 108 9 1476 485 204 6.5 532 551 116 104 8 1383 471 202
73-34 1.5 160 111 52 52 4 66 --- ---2.5 283 277 78 75 7 370 313 ---3.5 386 386 87 85 8 570 355 170 4.5 460 440 100 98 9 798 351 202 5.5 475 404 101 105 9 722 340 182 6.5 457 402 103 100 8 680 335 182
73-04 1.5 237 329 54 62 4 104 --- ---2.5 392 388 83 86 8 534 427 ---3.5 496 507 100 104 8 1106 444 164 4.5 560 545 124 112 10 1494 455 182
07-07 1.5 231 242 58 63 6 146 --- ---2.5 312 302 67 78 8 376 324 ---3.5 --- --- --- --- --- --- --- 141 4.5 --- --- --- --- --- --- --- 169
24 - B

Table 9. Average antler measurements and body weights of bucks classified as spike- or fork-antlered at 1.5 years of age.
Group Sampl e size
Age (years)
Main beam length (mm)
Basal circumference
(mm) Total points
Antler weight
(g)
Main beam
spread (mm)
Body weight (lbs)
Fork Spike
Fork Spike
Fork Spike
Fork Spike
Fork Spike
7 2.5 9 2.5
7 3.5 9 3.5
7 4.5 8 4.5
5 5.5 6 5.5
5 6.5 3 6.5
377.0 297.3
418.0 360.7
436.2 369.0
430.8 359.7
423.0 386.3
84.4 8.1 75.1 6.8
98.1 8.4 82.9 7.2
112.0 9.4 95.0 7.4
109.2 8.8 97.3 7.0
108.3 9.0 92.7 6.7
595.2 389.0
1132.8 567.3
1361.8 694.5
1266.0 777.2
1249.2 676.3
366.0 297.1
494.6 385.2
538.0 421.1
528.1 445.4
508.9 387.0
------
171.1 164.2
193.6 174.0
189.8 166.7
191.6 171.7
Spike Fork
Mai
n Be
am L
engt
h (m
m)
450
400
350
300
250
200
150
100
50
0 2.5 3.5 4.5 5.5 6.5
Age (Years)
Figure 9. Average main beam length for white-tailed deer that were classified as spike- or fork-antlered at 1.5 years of age.
25 - B

Spike Fork
120 Ba
sal C
ircum
fere
nce
(mm
) 100
80
60
40
20
0 2.5 3.5 4.5 5.5 6.5
Age (Years)
Figure 10. Average basal circumference for white-tailed deer that were classified as spike- or fork-antlered at 1.5 years of age.
Spike Fork
10
9
8
Tota
l Ant
ler P
oint
s
7 6 5 4 3 2 1 0
2.5 3.5 4.5 5.5 6.5 Age (Years)
Figure 11. Average total antler points for white-tailed deer that were classified as spike- or fork-antlered at 1.5 years of age.
26 - B
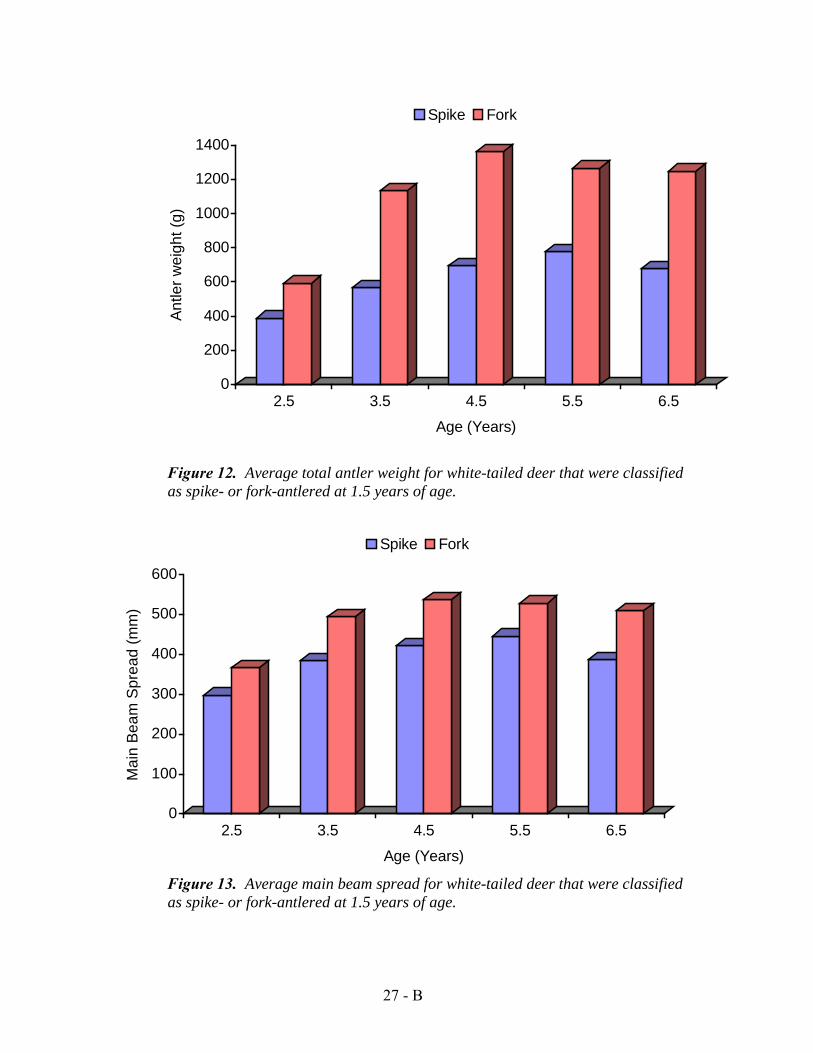
Mai
n Be
am S
prea
d (m
m)
Antle
r wei
ght (
g)
Spike Fork
1400
1200
1000
800
600
400
200
0 2.5 3.5 4.5 5.5 6.5
Age (Years)
Figure 12. Average total antler weight for white-tailed deer that were classified as spike- or fork-antlered at 1.5 years of age.
Spike Fork
600
500
400
300
200
100
0 2.5 3.5 4.5 5.5 6.5
Age (Years)
Figure 13. Average main beam spread for white-tailed deer that were classified as spike- or fork-antlered at 1.5 years of age.
27 - B

Spike Fork Li
ve B
ody
Wei
ght (
lbs)
200
175
150
125
100
75
50
25
0 2.5 3.5 4.5 5.5 6.5
Age (Years)
Figure 14. Average live body weight for white-tailed deer that were classified as spike- or fork-antlered at 1.5 years of age.
GENETIC PHASE
Six bucks that were born in 1973 and were spike-antlered as yearlings were bred to groups of doe deer in 2/3-acre deer pen enclosures. The purpose was to produce a genetic line of deer known as the —spike line“. Some of the doe fawns born from these matings were maintained in the pens with their sire for a —back-cross“ mating for the purpose of concentrating the genes for antler development in the female.
Six to 8 single male breeding pens were used each year. Five to 7 does were placed with each buck. All deer were individually marked, using color coded plastic ear tags (Harmel 1983). All fawns were individually ear-tagged and tattooed at birth, and a card file pedigree record was maintained. A pelleted 16% protein ration similar to the one described by Verme and Ullrey (1972) was provided ad libitum (Table 1) to all deer involved in the study.
All male fawns were weaned at 6 to 8 months of age and placed in a 4-acre enclosure. During the last week of October and the first week of November of each year, the male deer were weighed and their antlers removed to 1 to 2 cm above the base. Antler measurements taken at this time included: total number of points (>25 mm in length), maximum inside
28 - B

spread of main beams, basal circumference, main beam lengths, and total antler weight (Table 10). Photographs of each deer were recorded annually.
As the study progressed, some of the original spike line sires died and 2 replacement sires were added to the breeding pens. These replacement sires also had spike antlers as yearlings and were F-1 sons of original sires.
In 1976, a large-bodied, 10-point, 3.5-year-old buck was noted in the pens. This deer had 6 antler points as a yearling and much of his genetic history was known. The decision was made to add this deer to the study as a —fork line“ sire and compare his F-1 and back-cross offspring to those sired by the spike brood bucks (spike line).
Table 10. Definitions and symbols used for antler measurements and body weight.
Symbola Definition 1. WT Live body weight (lbs) 2. MB Length of main beam (mm) 3. AW Total antler weight (g) 4. BC Basal circumference of main beam (mm) 5. SP Maximum inside spread of main beams (mm) 6. TP Total number of points 7. FORK Genetic line of deer produced by a sire with 6 antler points at 1.5 years 8. SPIKE Genetic line of deer produced by a sire with 2 antler points at 1.5 years a Age of buck at time of measurement may be appended to the symbol (WT01 = body weight at 1.5 years of age).
Short History of Sires Used in the Genetic Phase
Sire #73046 œ —Leroy“ Leroy was picked up as a fawn near Sisterdale, Texas in Kendall
County during the summer of 1973. He was bottle-raised by a private individual, and produced very poor spike antlers as a yearling. Leroy was used as a brood buck from October 21, 1974 to January 30, 1980, and was sent to Texas A & I University for research purposes on February 27, 1980.
Sire #73041 Sire 73041 was picked up as a fawn in Brazos County, Texas and
bottle-reared. He produced spike antlers as a yearling, and was used as a brood buck from October 21, 1974 until his death on October 21, 1979. Sire 73041 never produced a set of antlers with more than 4 points. He maintained a distinct red winter fair coat, and passed this characteristic on to many of his offspring.
29 - B

Sire #73023 œ —Rona“ The parents of this sire originated in Walker County, Texas. Rona
was born in 1973 and was reared at the Texas A&M University deer pens. He was fed a horse and mule feed diet while growing his first set of antlers. These first antlers were spikes with a small 15mm projection extending from the base of the right antler. Rona was used as a brood buck from October 21, 1974 until his death on October 30, 1978.
Sire # 73009 œ — Little Abbey“ The dam of this sire was transferred from the Abilene, Texas zoo to
the Kerr Wildlife Management Area on June 5, 1973. Little Abbey was born on June 16, 1973. He was reared by his dam, and fed a horse and mule feed ration (protein content unknown) while growing his first set of antlers. He was used as a brood buck from October 21, 1974 until his death on February 9, 1980.
Sire #73069 œ —Little Murph“ The dam of this sire was moved from the Midland, Texas zoo to the
Kerr Wildlife Management Area on June 6, 1973. Little Murph (Fig. 15) was born on July 22, 1973, and reared by his dam. Although he was fed a high protein ration (in excess of 16%), he produced a poor set of spike antlers as a yearling. Little Murph was used as a brood buck from October 21, 1974 until his death on October 13, 1978. None of his 4 offspring produced forked antlers as yearlings.
Figure 15. The 2 deer on the right were used as herd sires. The larger deer is "Big Charlie" and the smaller deer on the right is "Little Murph." Big Charlie was used as the "fork line” sire and Little Murph was 1 of the 8 sires used in the “spike line.” Both deer are the same age.
30 - B

Sire #73068 This buck was born in Kerr County, Texas and bottle-reared. He
produced spike antlers as a yearling and was used as a brood buck from November 15, 1974 until his death on February 17, 1978.
Sire #75064 œ —Murph Jr.“ Murph Jr. was born on June 11, 1975 at the Kerr Wildlife
Management Area and was the son of Little Murph (73069). He was fed the standard high protein diet and produced spike antlers as a yearling. Murph Jr. produced a set of antlers at 2.5 years which had 4 points and was similar in conformation to his sire. He was used as a brood buck from October 26, 1977 until his death on July 18, 1980.
Sire #77037 œ —Scrawny“ Scrawny was born July 14, 1977 and was a back-cross to Sire 73068.
As a yearling, Scrawny‘s antlers were 10mm and 9mm in length and too short to remove without damaging his skull. He was used as a brood buck beginning November 16, 1978.
Sire #73005 œ —Big Charlie“ Big Charlie (Fig . 16) was born
on June 18, 1973 in the Kerr Wildlife Management Area deer pens, and produced 6 points as a yearling. At 3.5 years, Big Charlie had 10 points and weighed 211 lbs. He was the son of —A&M Charlie“ (Fig. 17), a buck which was picked up as a fawn in Milam County, Texas and reared in the Texas A&M University deer pens. A&M Charlie had 8 points at 1.5, 2.5, and 3.5 years of age. When A&M Charlie died at 3.5 years of age, his field dressed weight was 176 lbs. Big Charlie‘s maternal grandfather, —Salty“, (Fig. 18) originated in a captive herd in Maverick County near Eagle Pass, Texas. Salty was a large-bodied deer and grew large sets of antlers while in captivity.
Figure 16. "Big Charlie," #73005, was used as the "fork line" sire. At 6.5 years of age he weighed 216 lbs.
31 - B
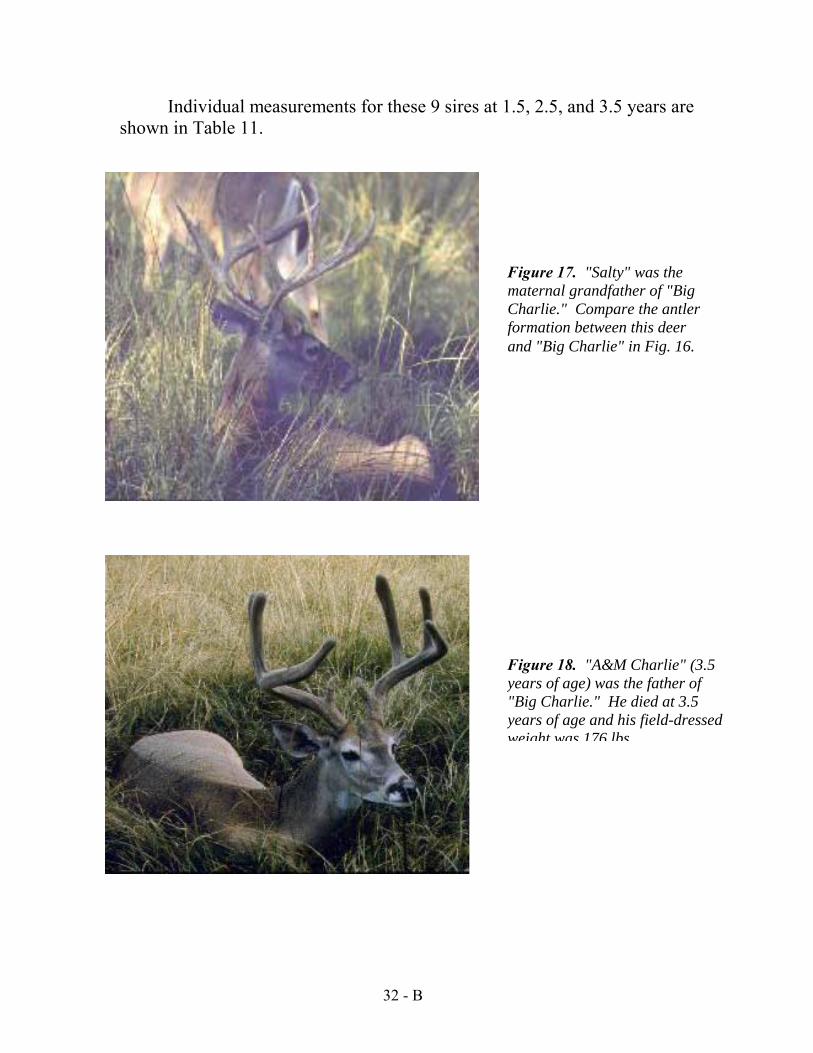
Individual measurements for these 9 sires at 1.5, 2.5, and 3.5 years are shown in Table 11.
Figure 17. "Salty" was the maternal grandfather of "Big Charlie." Compare the antler formation between this deer and "Big Charlie" in Fig. 16.
32 - B
Figure 18. "A&M Charlie" (3.5 years of age) was the father of "Big Charlie." He died at 3.5 years of age and his field-dressedweight was 176 lbs

Table 11. Mean body weight and antler measurements for 9 white-tailed deer sires at 1.5, 2.5, and 3.5 years of age.
Sire Age WT MB AW BC SP TP
73005 1.5 --- --- --- --- --- 6 2.5 --- 467.5 524.50 91.5 423 9 3.5 211 572.0 921.00 108.0 458 10
73009 1.5 --- 63.5 15.05 48.0 --- 2 2.5 --- 312.0 187.00 74.5 260 6 3.5 167 345.5 226.00 80.0 355 7
73023 1.5 --- 105.5 14.30 43.0 --- 2 2.5 --- 328.5 266.50 82.0 325 8 3.5 175 427.5 366.50 89.5 356 8
73041 1.5 --- 148.0 36.60 54.5 --- 2 2.5 --- 233.0 121.00 70.0 275 4 3.5 145 252.0 111.00 69.5 325 4
73046 1.5 --- 41.0 3.45 23.0 --- 2 2.5 --- 361.0 258.50 79.5 298 8 3.5 --- 410.0 266.00 80.0 385 8
73068 1.5 --- 109.0 15.85 41.0 --- 2 2.5 --- 255.5 111.50 63.5 276 7 3.5 155 406.0 249.50 76.0 390 9
73069 1.5 --- 43.0 4.25 35.5 --- 2 2.5 --- 241.5 112.50 65.0 258 4 3.5 114 308.5 191.50 72.5 297 5
75064 1.5 104 151.0 23.00 43.5 133 2 2.5 134 320.0 128.00 67.5 245 4 3.5 130 380.0 184.50 76.5 133 5
77037 1.5 82 9.5 --- 50.0 59 2 2.5 103 74.0 10.75 54.0 --- 2 3.5 94 264.0 99.40 65.5 334 4
33 - B

Total Deer Produced
The 9 sires produced 428 progeny (223 males and 205 females) during the 6 breeding seasons (Table 12). There were 505 sets of antlers available for analysis (Appendix I). These consisted of 150 sets at 1.5, 115 at 2.5, 90 at 3.5, 79 at 4.5, 54 at 5.5, 16 at 6.5, and 1 at 7.5 years of age. Pedigree records were available for 113 of the yearling age class and inbreeding coefficients were calculated. The classification as spike- or fork-antlered at 1.5 years of age for non-inbred and back-cross progeny is shown in Table 13.
There were 64 deer with body weight and antler measurements at 1.5, 2.5, and 3.5 years of age. Only these 64 were used in the analysis because this allowed a more valid comparison between measurements for the 3 age classes.
Table 12. Total progeny (223 males, 205 females) produced by 9 sires during the period 1975-1980.
Sire 1975
M F 1976
M F 1977
M F1978
M F1979
M F1980
M F Total
M F
73005 73009 73023 73041 73046 73068 73069 75064 77037
-- --3 4 1 5 2 4 6 1 1 6 4 2 -- ---- --
-- --5 8 7 6 5 6 6 4 5 8 3 1 -- ---- --
11 11 5 5 3 6 6 2
32 0 6 4 -- ---- ---- --
13 15 3 7
10 6 7 7 2 2 -- ---- --7 11 -- --
27 13 9 5 -- --6 7 1 6 -- ---- --15 11 6 8
26 17 1 1 -- ---- ---- ---- ---- --8 3 1 3
77 56 26 30 21 23 26 26 17 13 12 18 7 3
30 25 7 11
Total 17 22 31 33 33 28 42 48 64 50 36 24 223 205
34 - B

Table 13. Classification of 55 inbred (FX > 0) and 58 non-inbred (FX = 0) progeny from 9 sires as spike- or fork-antlered at 1.5 years of age.
Classification at age 1.5 Spike-antlered
N % Fork-antlered
N % Total
progeny
73005 FX = 0 FX > 0
1 2
4 20
22 8
96 80
23 10
73009 FX = 0 FX > 0
0 9
0 69
2 4
100 31
2 13
73023 FX = 0 FX > 0
0 1
0 20
2 4
100 80
2 5
73041 FX = 0 FX > 0
2 9
50 60
2 6
50 40
4 15
73046 FX = 0 FX > 0
2 1
15 50
11 1
85 50
13 2
73068 FX = 0 FX > 0
1 4
100 67
0 2
0 33
1 6
73069 FX = 0 FX > 0
4 0
100 0
0 0
0 0
4 0
77064 FX = 0 FX > 0
6 4
86 100
1 0
14 0
7 4
77037 FX = 0 FX > 0
1 0
50 0
1 0
50 0
2 0
35 - B

Body Weight vs. Total Antler Points
There was a linear relationship between the total number of antler points and body weight within an age class (Table 14). At 1.5 years, the 26 deer which had spike antlers weighed an average of only 97.9 lbs, while deer with 8 or more antler points had an average body weight of over 140.0 lbs. This linear relationship between total antler points and body weight at 1.5, 2.5, and 3.5 years for these 64 deer is shown in Table 29. Table 29 also shows that spike-antlered deer are not only smaller at 1.5 years, but remain small at 2.5 and 3.5 years. The 26 deer that were spike-antlered at 1.5 averaged only 118.08 lbs at 2.5, while the 38 that were fork-antlered at 1.5 had a body weight of 142.97 lbs, a differential of 24.89 lbs. This differential between the back-cross (FX > 0) and the non-inbred (FX = 0) individuals was 0.87, 6.21, and -0.01 lbs at 1.5, 2.5, and 3.5 years respectively (Table 28).
Table 14. Average live body weight (lbs) versus total antler points for 64 male white-tailed deer at 1.5, 2.5, and 3.5 years of age.
Total 1.5 years 2.5 years 3.5 years points N Weight N Weight N Weight
2 26 97.9 4 105.0 2 108.5 3 2 114.0 2 123.0 -- --4 6 117.5 9 119.0 5 115.8 5 9 106.0 2 137.5 4 133.8 6 10 110.9 6 127.2 4 148.0 7 6 124.8 5 124.2 4 148.0 8 3 140.0 29 140.3 25 150.4 9 1 141.0 4 142.0 9 150.9
10 1 152.0 2 145.5 8 153.3 11 -- -- -- -- 2 168.5 12 -- -- -- -- -- --13 -- -- 1 179.0 1 166.0
Total 64 109.4 64 132.9 64 146.3
Total Antler Points Between Age Classes
The 26 deer that were spike-antlered as yearlings developed antlers that ranged from 2 to 8 points at 2.5 years of age; however, 21 of the 26 had less than 8 antler points. Thirty-one of the 38 that had forked antlers at 1.5 years had 8 or more antler points at 2.5. These data indicate that the probability of a 1.5-year-old spike buck having 8 or more antler points at 2.5 years is 0.19 while the probability of a 1.5 year old fork-antlered deer having
36 - B

8 or more antler points at 2.5 is 0.82 (Table 15). Only 1 deer had less antler points at 2.5 than at 1.5 and only 4 of the 26 had spike antlers at 2.5. All 4 of these 2.5-year-old spike bucks were spike antlered at 1.5.
Thirty-six of the 38 (94.7%) deer that were fork-antlered at 1.5 had 8 or more antler points at 3.5 (Table 16). However, 17 of the 26 that were spike-antlered at 1.5 had less than 8 points at 3.5. If all spikes had been removed at 1.5, then 94.7% of the remaining deer would have had 8 or more antler points at 3.5. Without removing the spike bucks, only 70.3% of the 3.5 year old deer would have had 8 or more antler points. Again, only 1 deer had less antler points at 3.5 than at 1.5 years and all 3.5 year old spike bucks were spike-antlered at 1.5. These data indicate that the probability of a fork-antlered yearling having 8 or more antler points at 3.5 years was 0.95 while the probability of a spike-antlered yearling having 8 or more antler points at 3.5 years was only 0.35.
Table 15. Frequency distribution of total antler points for 64 white-tailed deer at 1.5 and 2.5 years of age. Total points Total antler points at 1.5 years of age at 2.5 years 2 3 4 5 6 7 8 9 10 11+ Total deer
12+ 1 1 11 0 10 1 1 2 9 1 1 2 4 8 5 3 6 6 6 3 29 7 2 1 2 5 6 4 1 1 6 5 1 1 2 4 8 1 9 3 2 2 2 4 4
Total deer 26 2 6 9 10 6 3 1 1 0 64
37 - B

Table 16. Frequency distribution of total antler points for 64 white-tailed deer at 1.5 and 3.5 years of age.
Total points at 2.5 years 2 3
Total antler points at 1.5 years of age 4 5 6 7 8 9 10 11+ Total deer
12+ 11 10 9 8 7 6 5 4 3 2
2 7 3 3 4 5
2
1
1
1 4 1
1 2 6
1 1 3 1 4
3 2 1
1 1 1
1
1
1 2 8 9
26 4 4 4 5 0 2
Total deer 26 2 6 9 10 6 3 1 1 0 64
There was also a linear trend between the total antler points at 2.5 and 3.5 years of age (Table 17). There were only 2 animals that had less antler points at 3.5 than at 2.5 years and they were both 10-point deer, which dropped back to 8 points. There were only 4 spike-antlered deer at 2.5 and only 2 spike-antlered deer at 3.5 years. Therefore, if removal of spike bucks is being considered in the management of a deer herd, it is imperative that they be removed at 1.5 years. It will be shown later that although the deer with spike antlers at 1.5 may have more antler points at 2.5 and 3.5, they will be below the average for their age class. All the deer with less than 6 antler points at 3.5 had 4 or less at 2.5 (Table 17), while 14 of the 15 deer that had 4 or less points at 2.5 were spike-antlered at 1.5 (Table 15).
Table 17. Frequency distribution of total antler points for 64 white-tailed deer at 2.5 and 3.5 years of age. Total points Total antler points at 1.5 years of age at 2.5 years 2 3 4 5 6 7 8 9 10 11+ Total deer
12+ 1 1 11 1 1 2 10 6 2 8 9 8 1 9 8 2 1 1 5 14 2 25 7 1 3 4 6 1 1 2 4 5 4 4 4 2 1 2 5 3 0 2 2 2
Total deer 4 2 9 2 6 5 29 4 2 1 64
38 - B

Correlation Between Body Weight and Antler Measurements
The simple correlations between measurements at the 3 age classes are given in Tables 18 through 23 for all deer as well as for the spike- and fork-antlered groups. Significant correlations (P<0.05) for n=26, 64, and 38 are 0.38, 0.25, and 0.31, respectively. For P<0.01 the significant values are 0.49, 0.32, and 0.40, respectively. Although the correlations are greater between variables at 1.5 years, there is a strong positive relationship between 1.5- and 3.5-year measurements (Table 20). Within an age class, (Tables 18, 21, and 23) there is very little difference between the correlation coefficients for fork- and spike-antlered deer.
Table 18. Correlation between body weight and antler measurements for 64 (26 spike- and 38 fork-antlered) white-tailed deer at 1.5 years of age.
WT01 MB01 AW01 BC01 SP01 TP01
WT01 All Spike Fork
1.00 1.00 1.00
0.72 0.59 0.58
0.75 0.43 0.69
0.73 0.57 0.62
0.70 0.57 0.57
0.66 0.00 0.52
MB01 All Spike Fork
0.72 0.59 0.58
1.00 1.00 1.00
0.88 0.91 0.84
0.85 0.79 0.56
0.89 0.90 0.64
0.80 0.00 0.75
AW01 All Spike Fork
0.75 0.43 0.69
0.88 0.91 0.84
1.00 1.00 1.00
0.85 0.85 0.81
0.77 0.81 0.61
0.88 0.00 0.83
BC01 All Spike Fork
0.73 0.57 0.63
0.85 0.79 0.56
0.85 0.85 0.81
1.00 1.00 1.00
0.81 0.74 0.46
0.76 0.00 0.57
SP01 All Spike Fork
0.70 0.57 0.57
0.89 0.90 0.64
0.77 0.81 0.61
0.81 0.74 0.46
1.00 1.00 1.00
0.68 0.00 0.43
TP01 All Spike Fork
0.66 0.00 0.52
0.80 0.00 0.75
0.88 0.00 0.83
0.76 0.00 0.57
0.68 0.00 0.43
1.00 1.00 1.00
39 - B

Table 19. Correlation between body weight and antler measurements for 64 (26 spike- and 38 fork-antlered) white-tailed deer at 1.5 and 2.5 years of age.
WT01 MB01 AW01 BC01 SP01 TP01
WT02 All Spike Fork
0.85 0.65 0.84
0.70 0.60 0.45
0.67 0.33 0.50
0.69 0.39 0.54
0.66 0.53 0.41
0.64 0.00 0.36
MB02 All Spike Fork
0.71 0.46 0.65
0.80 0.54 0.76
0.69 0.33 0.57
0.64 0.25 0.46
0.71 0.48 0.55
0.66 0.00 0.48
AW02 All Spike Fork
0.75 0.53 0.65
0.86 0.74 0.81
0.85 0.63 0.75
0.77 0.54 0.65
0.73 0.64 0.53
0.80 0.00 0.63
BC02 All Spike Fork
0.75 0.57 0.67
0.81 0.72 0.64
0.78 0.65 0.69
0.78 0.48 0.77
0.74 0.74 0.40
0.67 0.00 0.48
SP02 All Spike Fork
0.63 0.50 0.51
0.66 0.49 0.50
0.57 0.36 0.39
0.63 0.45 0.44
0.72 0.63 0.56
0.51 0.00 0.24
TP02 All Spike Fork
0.52 0.29 0.27
0.74 0.52 0.52
0.61 0.32 0.39
0.64 0.38 0.22
0.66 0.45 0.31
0.69 0.00 0.52
Table 20. Correlation between body weight and antler measurements for 64 (26 spike- and 38 fork-antlered) white-tailed deer at 1.5 and 3.5 years of age.
WT01 MB01 AW01 BC01 SP01 TP01
WT03 All Spike Fork
0.78 0.66 0.69
0.60 0.61 0.22
0.56 0.41 0.31
0.65 0.43 0.47
0.63 0.56 0.33
0.52 0.00 0.17
MB03 All Spike Fork
0.62 0.50 0.47
0.70 0.48 0.64
0.61 0.28 0.54
0.58 0.31 0.39
0.65 0.43 0.56
0.62 0.00 0.55
AW03 All Spike Fork
0.71 0.49 0.61
0.80 0.69 0.70
0.83 0.58 0.75
0.77 0.57 0.66
0.73 0.61 0.59
0.77 0.00 0.66
BC03 All Spike Fork
0.69 0.54 0.62
0.72 0.66 0.54
0.71 0.60 0.68
0.74 0.46 0.82
0.70 0.68 0.45
0.59 0.00 0.53
SP03 All Spike Fork
0.44 0.28 0.33
0.51 0.18 0.54
0.49 0.18 0.45
0.51 0.28 0.47
0.60 0.41 0.63
0.48 0.00 0.44
TP03 All Spike Fork
0.51 0.37 0.20
0.68 0.50 0.30
0.58 0.33 0.33
0.66 0.44 0.26
0.66 0.41 0.36
0.65 0.00 0.42
40 - B

Table 21. Correlation between body weight and antler measurements for 64 (26 spike- and 38 fork-antlered) white-tailed deer at 2.5 years of age.
WT02 MB02 AW02 BC02 SP02 TP02
WT02 All Spike Fork
1.00 1.00 1.00
0.71 0.55 0.57
0.76 0.58 0.61
0.75 0.50 0.67
0.64 0.59 0.47
0.57 0.36 0.28
MB02 All Spike Fork
0.71 0.55 0.57
1.00 1.00 1.00
0.87 0.88 0.82
0.81 0.69 0.72
0.79 0.64 0.75
0.74 0.67 0.48
AW02 All Spike Fork
0.76 0.58 0.61
0.87 0.88 0.82
1.00 1.00 1.00
0.88 0.83 0.84
0.69 0.60 0.58
0.77 0.74 0.64
BC02 All Spike Fork
0.75 0.50 0.67
0.81 0.69 0.72
0.88 0.83 0.84
1.00 1.00 1.00
0.72 0.71 0.53
0.67 0.51 0.41
SP02 All Spike Fork
0.64 0.59 0.47
0.79 0.64 0.75
0.69 0.60 0.58
0.72 0.71 0.53
1.00 1.00 1.00
0.56 0.36 0.34
TP02 All Spike Fork
0.57 0.36 0.28
0.74 0.67 0.48
0.77 0.74 0.64
0.67 0.51 0.41
0.56 0.36 0.34
1.00 1.00 1.00
Table 22. Correlation between body weight and antler measurements for 64 (26 spike- and 38 fork-antlered) white-tailed deer at 2.5 and 3.5 years of age.
WT02 MB02 AW02 BC02 SP02 TP02
WT03 All Spike Fork
0.87 0.82 0.82
0.66 0.72 0.36
0.67 0.73 0.43
0.72 0.66 0.53
0.63 0.72 0.40
0.54 0.50 0.15
MB03 All Spike Fork
0.56 0.54 0.31
0.85 0.89 0.71
0.76 0.81 0.65
0.71 0.66 0.55
0.72 0.65 0.59
0.74 0.64 0.63
AW03 All Spike Fork
0.70 0.57 0.53
0.80 0.82 0.65
0.91 0.93 0.83
0.83 0.78 0.74
0.69 0.68 0.54
0.78 0.76 0.64
BC03 All Spike Fork
0.69 0.50 0.62
0.70 0.63 0.54
0.77 0.77 0.71
0.91 0.84 0.84
0.66 0.71 0.43
0.61 0.44 0.42
SP03 All Spike Fork
0.42 0.19 0.31
0.56 0.34 0.56
0.56 0.37 0.53
0.56 0.50 0.40
0.78 0.74 0.73
0.48 0.28 0.38
TP03 All Spike Fork
0.53 0.38 0.16
0.71 0.68 0.36
0.69 0.71 0.43
0.64 0.47 0.36
0.54 0.38 0.26
0.84 0.87 0.47
41 - B

Table 23. Correlation between body weight and antler measurements for 64 (26 spike- and 38 fork-antlered) white-tailed deer at 3.5 years of age.
WT03 MB03 AW03 BC03 SP03 TP03
WT03 All Spike Fork
1.00 1.00 1.00
0.51 0.69 0.12
0.66 0.74 0.41
0.69 0.68 0.52
0.45 0.46 0.21
0.51 0.53 0.03
MB03 All Spike Fork
0.51 0.69 0.12
1.00 1.00 1.00
0.85 0.85 0.82
0.70 0.63 0.56
0.65 0.49 0.65
0.73 0.24 0.49
AW03 All Spike Fork
0.66 0.74 0.41
0.85 0.85 0.82
1.00 1.00 1.00
0.82 0.81 0.78
0.64 0.52 0.63
0.73 0.80 0.49
BC03 All Spike Fork
0.69 0.68 0.52
0.70 0.63 0.56
0.82 0.81 0.78
1.00 1.00 1.00
0.63 0.58 0.50
0.59 0.48 0.33
SP03 All Spike Fork
0.45 0.46 0.21
0.65 0.49 0.65
0.64 0.52 0.63
0.63 0.58 0.50
1.00 1.00 1.00
0.50 0.35 0.38
TP03 All Spike Fork
0.51 0.53 0.03
0.73 0.74 0.49
0.73 0.80 0.49
0.59 0.48 0.33
0.50 0.35 0.38
1.00 1.00 1.00
Progeny Averages for the Nine Sires (Tables 24 - 26)
Data for the 64 progeny are compared at 1.5, 2.5, and 3.5 years. None of the sires represented in the spike line produced averages which were comparable to the 15 progeny produced by the sire of the fork line (73005).
42 - B
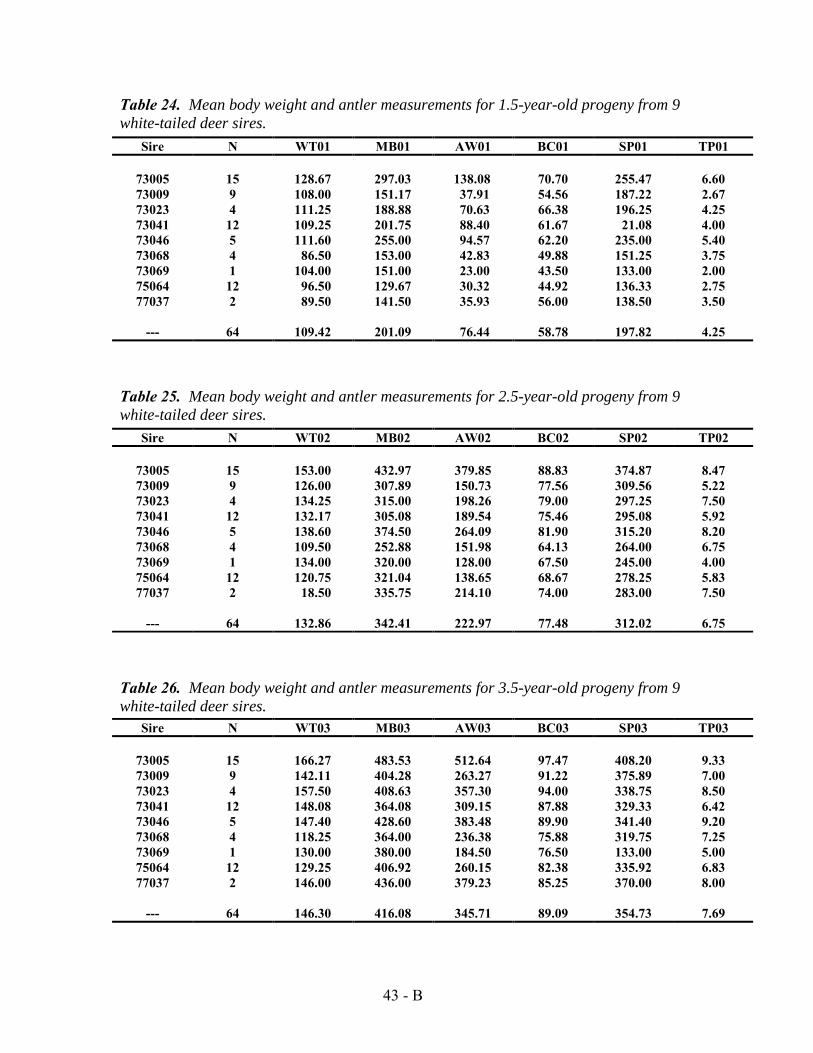
Table 24. Mean body weight and antler measurements for 1.5-year-old progeny from 9 white-tailed deer sires.
Sire N WT01 MB01 AW01 BC01 SP01 TP01
73005 15 128.67 297.03 138.08 70.70 255.47 6.60 73009 9 108.00 151.17 37.91 54.56 187.22 2.67 73023 4 111.25 188.88 70.63 66.38 196.25 4.25 73041 12 109.25 201.75 88.40 61.67 21.08 4.00 73046 5 111.60 255.00 94.57 62.20 235.00 5.40 73068 4 86.50 153.00 42.83 49.88 151.25 3.75 73069 1 104.00 151.00 23.00 43.50 133.00 2.00 75064 12 96.50 129.67 30.32 44.92 136.33 2.75 77037 2 89.50 141.50 35.93 56.00 138.50 3.50
--- 64 109.42 201.09 76.44 58.78 197.82 4.25
Table 25. Mean body weight and antler measurements for 2.5-year-old progeny from 9 white-tailed deer sires.
Sire N WT02 MB02 AW02 BC02 SP02 TP02
73005 15 153.00 432.97 379.85 88.83 374.87 8.47 73009 9 126.00 307.89 150.73 77.56 309.56 5.22 73023 4 134.25 315.00 198.26 79.00 297.25 7.50 73041 12 132.17 305.08 189.54 75.46 295.08 5.92 73046 5 138.60 374.50 264.09 81.90 315.20 8.20 73068 4 109.50 252.88 151.98 64.13 264.00 6.75 73069 1 134.00 320.00 128.00 67.50 245.00 4.00 75064 12 120.75 321.04 138.65 68.67 278.25 5.83 77037 2 18.50 335.75 214.10 74.00 283.00 7.50
--- 64 132.86 342.41 222.97 77.48 312.02 6.75
Table 26. Mean body weight and antler measurements for 3.5-year-old progeny from 9 white-tailed deer sires.
Sire N WT03 MB03 AW03 BC03 SP03 TP03
73005 15 166.27 483.53 512.64 97.47 408.20 9.33 73009 9 142.11 404.28 263.27 91.22 375.89 7.00 73023 4 157.50 408.63 357.30 94.00 338.75 8.50 73041 12 148.08 364.08 309.15 87.88 329.33 6.42 73046 5 147.40 428.60 383.48 89.90 341.40 9.20 73068 4 118.25 364.00 236.38 75.88 319.75 7.25 73069 1 130.00 380.00 184.50 76.50 133.00 5.00 75064 12 129.25 406.92 260.15 82.38 335.92 6.83 77037 2 146.00 436.00 379.23 85.25 370.00 8.00
--- 64 146.30 416.08 345.71 89.09 354.73 7.69
43 - B

Progeny Averages for Spike and Fork Line
The averages for the spike line were consistently lower than for the fork line (Table 27). The differences were approximately 20 lbs. for body weight and 2 antler points. However, the most pronounced difference is in antler weight.
Table 27. Comparison of body weight and antler measurements between the "fork line" and "spike line" at 1.5, 2.5, and 3.5 years of age.
FORK SPIKE
N 15 49
WT01 128.67 103.53
MB01 297.03 171.71
AW01 138.08
57.08
BC01 70.70 55.13
SP01 255.47 180.18
TP01 6.66 3.53
FORK SPIKE
N 15 49
WT02 153.00 126.69
MB02 432.97 314.69
AW02 379.85 174.95
BC02 88.83 74.00
SP02 374.87 292.38
TP02 8.47 6.22
FORK SPIKE
N 15 49
WT03 166.27 140.18
MB03 483.53 395.43
AW03 512.64 294.61
BC03 97.47 86.53
SP03 408.20 338.37
TP03 9.33 7.18
Back-Cross vs. Non-Inbred (Spike Line)
Since only one of the fork line deer was a back-cross, only data for the spike line are compared (Table 28). Of the 49 in the spike line, 4 could not be used due to incomplete information concerning the dam. Data for the 45 remaining are compared in Table 28. These data show very little difference between the F-1 and back-cross progeny. This is not surprising since all progeny were used without selection and there was no progeny testing used to select the dams. If both the dam and sire were heterozygous for a trait, then a back-cross without selection would not concentrate a specific genetic combination.
44 - B
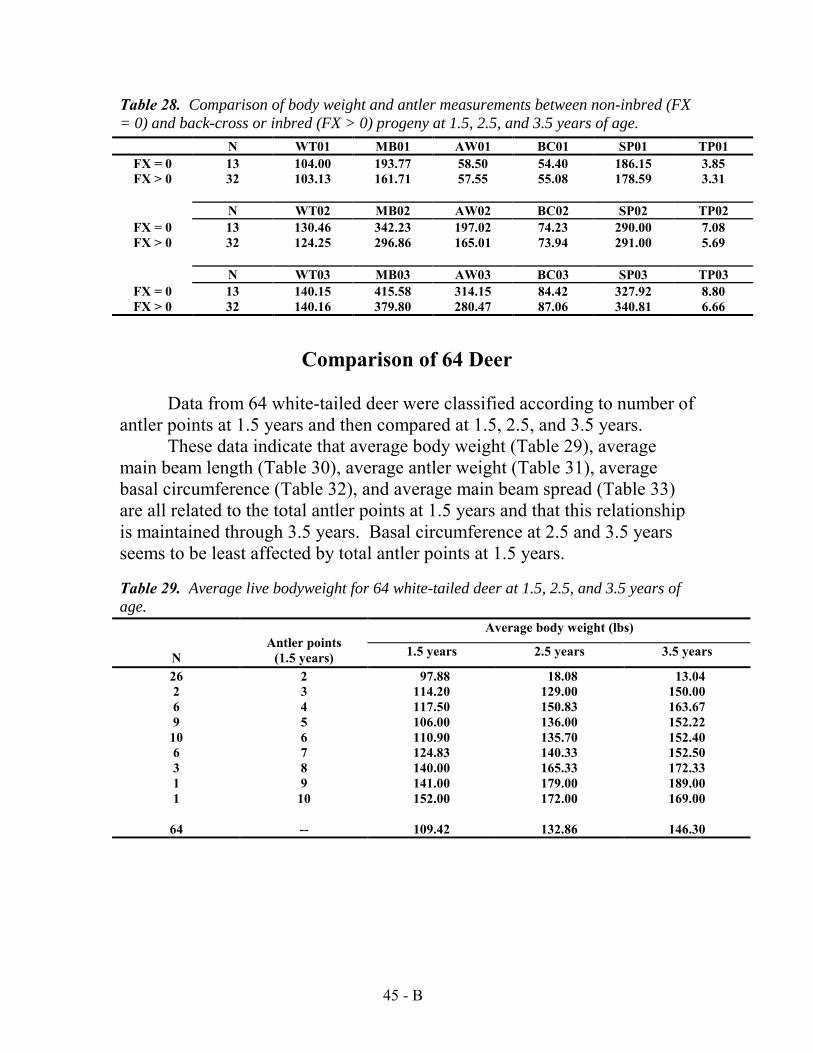
Table 28. Comparison of body weight and antler measurements between non-inbred (FX = 0) and back-cross or inbred (FX > 0) progeny at 1.5, 2.5, and 3.5 years of age.
FX = 0 FX > 0
N 13 32
WT01 104.00 103.13
MB01 193.77 161.71
AW01 58.50 57.55
BC01 54.40 55.08
SP01 186.15 178.59
TP01 3.85 3.31
FX = 0 FX > 0
N 13 32
WT02 130.46 124.25
MB02 342.23 296.86
AW02 197.02 165.01
BC02 74.23 73.94
SP02 290.00 291.00
TP02 7.08 5.69
FX = 0 FX > 0
N 13 32
WT03 140.15 140.16
MB03 415.58 379.80
AW03 314.15 280.47
BC03 84.42 87.06
SP03 327.92 340.81
TP03 8.80 6.66
Comparison of 64 Deer
Data from 64 white-tailed deer were classified according to number of antler points at 1.5 years and then compared at 1.5, 2.5, and 3.5 years.
These data indicate that average body weight (Table 29), average main beam length (Table 30), average antler weight (Table 31), average basal circumference (Table 32), and average main beam spread (Table 33) are all related to the total antler points at 1.5 years and that this relationship is maintained through 3.5 years. Basal circumference at 2.5 and 3.5 years seems to be least affected by total antler points at 1.5 years.
Table 29. Average live bodyweight for 64 white-tailed deer at 1.5, 2.5, and 3.5 years of age.
Average body weight (lbs)
N Antler points
(1.5 years) 1.5 years 2.5 years 3.5 years
26 2 97.88 18.08 13.04 2 3 114.20 129.00 150.00 6 4 117.50 150.83 163.67 9 5 106.00 136.00 152.22
10 6 110.90 135.70 152.40 6 7 124.83 140.33 152.50 3 8 140.00 165.33 172.33 1 9 141.00 179.00 189.00 1 10 152.00 172.00 169.00
64 -- 109.42 132.86 146.30
45 - B

Table 30. Average main beam length for 64 white-tailed deer at 1.5, 2.5, and 3.5 years of age.
Average main beam length (mm)
N Antler points
(1.5 years) 1.5 years 2.5 years 3.5 years
26 2 121.04 282.04 369.52 2 3 161.50 345.00 380.25 6 4 226.17 370.33 416.50 9 5 220.00 343.56 414.22
10 6 252.70 385.30 457.50 6 7 310.75 429.50 489.33 3 8 321.17 328.33 491.50 1 9 376.00 517.50 596.50 1 10 331.50 45.00 452.00
64 -- 201.09 342.41 416.08
Table 31. Average antler weight for 64 white-tailed deer at 1.5, 2.5, and 3.5 years of age.
Average antler weight (g)
N Antler points
(1.5 years) 1.5 years 2.5 years 3.5 years
26 2 28.56 123.28 230.73 2 3 47.70 168.80 216.13 6 4 65.56 251.78 327.51 9 5 76.02 247.67 393.64
10 6 103.36 269.46 419.57 6 7 150.18 353.50 482.82 3 8 201.67 362.22 589.88 1 9 179.25 630.85 765.70 1 10 209.95 454.55 558.65
64 -- 76.44 222.97 345.71
Table 32. Average basal circumference for 64 white-tailed deer at 1.5, 2.5, and 3.5 years of age.
Average basal circumference (mm) Antler points 1.5 years 2.5 years 3.5 yearsN (1.5 years)
26 2 47.40 68.98 82.44 2 3 58.75 74.25 79.25 6 4 62.08 82.08 90.50 9 5 65.00 79.17 93.22
10 6 64.95 82.65 91.95 6 7 71.83 86.00 95.50 3 8 74.17 91.67 105.33 1 9 72.50 105.50 110.00 1 10 79.00 88.50 99.50
64 -- 58.78 77.48 89.09
46 - B

Table 33. Average main beam spread for 64 white-tailed deer at 1.5, 2.5, and 3.5 years of age.
Average main beam spread (mm)
N Antler points
(1.5 years) 1.5 years 2.5 years 3.5 years
26 2 141.77 275.20 326.12 2 3 199.00 290.50 298.50 6 4 226.17 355.17 356.67 9 5 215.33 311.89 373.00
10 6 239.10 325.20 358.60 6 7 257.67 380.17 425.33 3 8 275.00 339.33 392.33 1 9 270.00 339.00 430.00 1 10 250.00 368.00 385.00
64 -- 197.83 312.02 354.73
Comparison of 26 Spike-Antlered Deer
Data from 26 male white-tailed deer which were spike-antlered at 1.5 years (Tables 34-39) were classified according to total antler points at 2.5 years and compared at 1.5, 2.5, and 3.5 years. These date indicate that although 35% produced 8 or more points at 3.5 years, they were not of the same quality as those which were fork-antlered at 1.5 years (Tables 40-44). Eleven, or 42% produced 5 or less antler points at 3.5 years.
Table 34. Distribution of antler points at 2.5 and 3.5 years of age for 26 deer that were spike-antlered at 1.5 years.
Total antler points
N 1.5 years 2.5 years 3.5 years
4 2 2 2,2,4,4 2 2 3 4,6 8 2 4 4,4,5,5,5,5,7,8 1 2 5 6 4 2 6 6,7,7,8 2 2 7 8,8 5 2 8 8,8,8,9,9
47 - B

Table 35. Average live body weight at 1.5, 2.5, and 3.5 years of age for 26 deer that were spike-antlered at 1.5 years.
Average body weight (lbs)
N Antler points
(2.5 years) 1.5 years 2.5 years 3.5 years
4 2 85.75 105.00 105.00 2 3 100.00 123.00 136.50 8 4 97.00 117.88 132.13 1 5 120.00 142.00 161.00 4 6 103.50 113.75 130.00 2 7 97.50 116.50 142.50 5 8 99.40 126.20 138.20
26 -- 97.88 118.08 131.04
Table 36. Average main beam length at 1.5, 2.5, and 3.5 years of age for 26 deer that were spike-antlered at 1.5 years.
Average main beam length (mm)
N Antler points
(1.5 years) 1.5 years 2.5 years 3.5 years
4 2 38.75 160.88 275.75 2 3 48.00 255.25 325.75 8 4 126.25 295.19 372.38 1 5 232.50 358.50 466.00 4 6 155.13 281.38 354.63 2 7 107.25 292.25 401.75 5 8 163.70 349.80 437.20
26 -- 121.04 282.04 369.52
Table 37. Average total antler weight at 1.5, 2.5, and 3.5 years of age for 26 deer that were spike-antlered at 1.5 years.
Average antler weight (g)
N Antler points
(1.5 years) 1.5 years 2.5 years 3.5 years
4 2 6.68 35.80 100.26 2 3 6.50 91.28 185.58 8 4 31.45 121.02 214.72 1 5 50.85 191.50 317.15 4 6 41.65 134.75 262.15 2 7 23.40 148.18 268.98 5 8 33.00 176.89 321.06
26 -- 28.56 123.28 230.73
48 - B

Table 38. Average basal circumference at 1.5, 2.5, and 3.5 years of age for 26 deer that were spike-antlered at 1.5 years.
Average basal circumference (mm)
N Antler points
(1.5 years) 1.5 years 2.5 years 3.5 years
4 2 38.38 56.75 69.50 2 3 41.25 63.50 80.25 8 4 47.19 69.13 81.00 1 5 53.50 90.50 105.00 4 6 54.00 73.38 90.63 2 7 52.50 67.75 81.00 5 8 48.90 73.40 85.50
26 -- 47.40 68.98 82.44
Table 39. Average main beam spread at 1.5, 2.5, and 3.5 years of age for 26 deer that were spike-antlered at 1.5 years.
Average main beam spread (mm)
N Antler points
(1.5 years) 1.5 years 2.5 years 3.5 years
4 2 78.75 203.67 286.25 2 3 111.50 281.50 340.50 8 4 139.25 273.25 31.75 1 5 231.00 392.00 385.00 4 6 175.50 275.50 340.00 2 7 118.50 263.50 339.00 5 8 172.80 299.80 347.20
26 -- 141.77 275.20 326.12
Comparison of 38 Fork-Antlered Deer
Data from 38 male white-tailed deer that were fork-antlered at 1.5 years (Tables 40-44) were classified according to total antler points at 2.5 years and compared at 1.5, 2.5, and 3.5 years. Table 16 indicates that 36, or 95% of these deer produced 8 or more points at 3.5 years and none produced less than 6 antler points. When Tables 35-39 are compared with Tables 40-44, the deer that were fork-antlered at 1.5 years averaged 25.7 lbs greater body weight at 3.5 years, 78.41 mm longer main beam length, 193.66 g heavier total antler weight, 11.2 mm greater basal circumference, and 48.2 mm wider main beam spread.
49 - B

Table 40. Average live body weight at 1.5, 2.5, and 3.5 years of age for 38 deer that were fork-antlered at 1.5 years.
Average body weight (lbs)
N Antler points
(1.5 years) 1.5 years 2.5 years 3.5 years
1 4 101.00 128.00 139.00 1 5 108.00 133.00 143.00 2 6 126.00 154.00 179.50 3 7 101.00 129.33 146.33
24 8 118.71 143.25 157.96 4 9 115.75 142.00 147.00 2 10 120.50 145.50 154.00 1 13 141.00 179.00 189.00
38 -- 117.32 142.97 156.74
Table 41. Average main beam length at 1.5, 2.5, and 3.5 years of age for 38 deer that were fork-antlered at 1.5 years.
Average main beam length (mm)
N Antler points
(1.5 years) 1.5 years 2.5 years 3.5 years
1 4 164.00 220.00 322.50 1 5 129.50 338.00 387.50 2 6 238.00 420.50 355.25 3 7 197.67 330.50 410.83
24 8 270.08 387.19 454.13 4 9 236.38 401.25 498.13 2 10 278.25 388.00 440.25 1 13 376.00 517.50 596.50
38 -- 255.86 383.72 447.93
Table 42. Average total antler weight at 1.5, 2.5, and 3.5 years of age for 38 deer that were fork-antlered at 1.5 years.
Average antler weight (g)
N Antler points
(1.5 years) 1.5 years 2.5 years 3.5 years
1 4 53.50 70.20 168.00 1 5 28.00 171.25 211.10 2 6 79.25 292.50 236.43 3 7 55.30 163.73 307.58
24 8 121.39 299.05 449.98 4 9 84.63 290.35 456.10 2 10 132.47 388.98 481.23 1 13 179.25 630.85 765.70
38 -- 107.94 291.18 424.39
50 - B

Table 43. Average basal circumference at 1.5, 2.5, and 3.5 years of age for 38 deer that were fork-antlered at 1.5 years.
Average basal circumference (mm)
N Antler points
(1.5 years) 1.5 years 2.5 years 3.5 years
1 4 61.50 67.50 84.50 1 5 60.00 82.00 82.00 2 6 63.50 82.50 87.25 3 7 57.67 73.17 86.17
24 8 68.92 84.79 95.44 4 9 62.38 83.00 92.25 2 10 66.00 79.25 94.75 1 13 72.50 105.50 10.00
38 -- 66.57 83.29 93.64
Table 44. Average main beam spread at 1.5, 2.5, and 3.5 years of age for 38 deer that were fork-antlered at 1.5 years.
Average main beam spread (mm)
N Antler points
(1.5 years) 1.5 years 2.5 years 3.5 years
1 4 228.00 227.00 355.00 1 5 142.00 290.00 302.00 2 6 241.50 350.50 326.00 3 7 183.67 281.00 334.00
24 8 242.79 341.38 380.50 4 9 253.50 376.25 397.25 2 10 230.00 339.50 381.00 1 13 270.00 339.00 430.00
38 -- 236.18 336.24 374.32
51 - B

HERITABILITY ESTIMATES
This study was not designed to estimate the heritability of body weight and antler measurements. The high correlations between first- and third-year measurements indicate that these traits are highly heritable. The phenotypic resemblance between father and son, evident in the photographs (Figs 19-20), also indicate that these traits are highly heritable. According to Falconer (1960):
In experimental and domesticated populations, the parents are often a selected group and consequently the phenotypic variance among the parents
is less than that of the population as a whole and less than that of the offspring. The regression of offspring on parents, however, ibecause the covariance is reducparents, so that the slope of the regression of offspring on one pof offspring on mid-parent is a v
Heritability estimates wersire and are shown in Table 45. errors due to small numbers of iphenotypic selection for the masegment of the breeding popula
-
Figure 19. Sire #73041 at 5.5 years produced 4 noninbred and 15 inbred offspring, one of which is pictured in Fig. 20, also at 5.5 years of age.
s not affected by the selection of parents ed to the same extent as the variance of the regression line is unaltered. Thus the arent is a valid measure of ½ h(2), and that alid measure of h(2). e calculated using regression of offspring on These estimates have very large standard ndividuals per sire and because there was no le. This lack of selection in the female tion would not reduce the phenotypic
52 - B
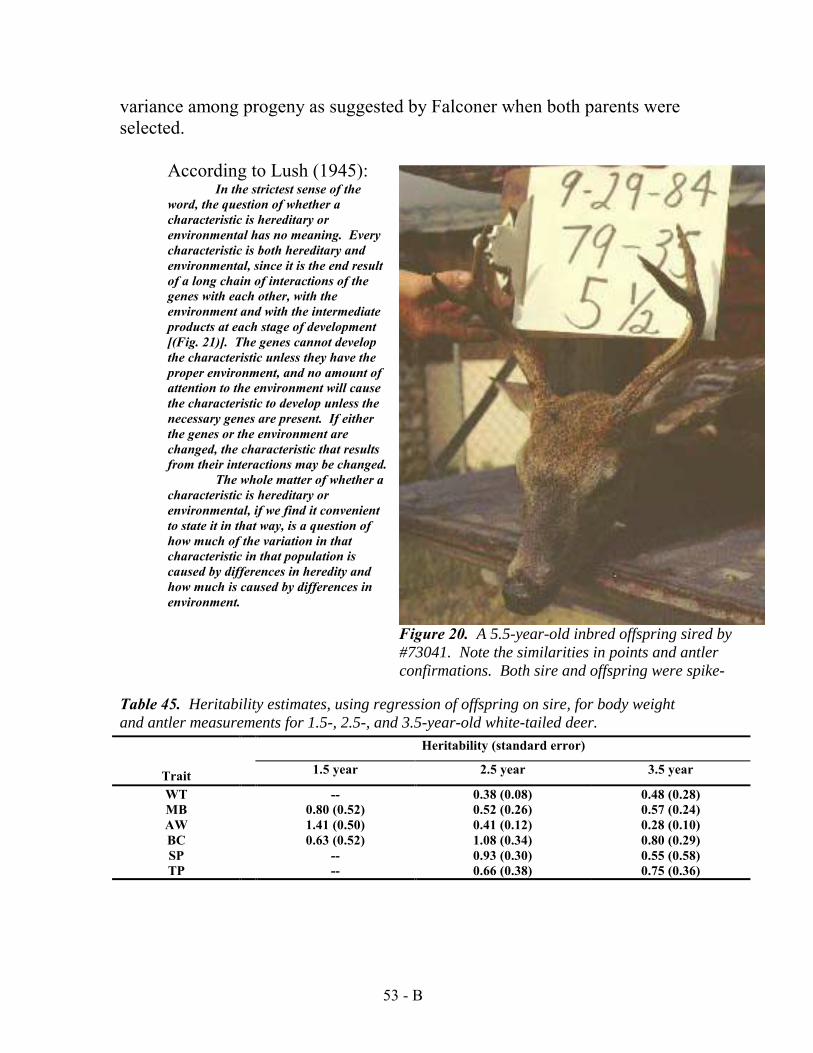
variance among progeny as suggested by Falconer when both parents were selected.
According to Lush (1945): In the strictest sense of the
word, the question of whether a characteristic is hereditary or environmental has no meaning. Every characteristic is both hereditary and environmental, since it is the end result of a long chain of interactions of the genes with each other, with the environment and with the intermediate products at each stage of development [(Fig. 21)]. The genes cannot develop the characteristic unless they have the proper environment, and no amount of attention to the environment will cause the characteristic to develop unless the necessary genes are present. If either the genes or the environment are changed, the characteristic that results from their interactions may be changed.
The whole matter of whether a characteristic is hereditary or environmental, if we find it convenient to state it in that way, is a question of how much of the variation in that characteristic in that population is caused by differences in heredity and how much is caused by differences in environment.
Table 45. Heritability estimates, using regand antler measurements for 1.5-, 2.5-, and
Trait 1.5 year
WT --MB 0.80 (0.52) AW 1.41 (0.50) BC 0.63 (0.52) SP --TP --
5
Figure 20. A 5.5-year-old inbred offspring sired by#73041. Note the similarities in points and antler confirmations. Both sire and offspring were spike-
ression of offspring on sire, for body weight 3.5-year-old white-tailed deer.
Heritability (standard error)
2.5 year 3.5 year
0.38 (0.08) 0.48 (0.28) 0.52 (0.26) 0.57 (0.24) 0.41 (0.12) 0.28 (0.10) 1.08 (0.34) 0.80 (0.29) 0.93 (0.30) 0.55 (0.58) 0.66 (0.38) 0.75 (0.36)
3 - B

CONCLUSIONS
1. Body weight and antler characteristics (main beam spread and lengths, basal circumference, total antler points, and weight) in white-tailed deer respond in direct proportions to the quality of their diet.
2. Antler characteristics and body weight of white-tailed deer are heritable characters and influenced by both genetics and nutrition.
3. Yearling white-tailed deer with spike antlers are inferior to fork-antlered yearlings with regard to body weight and antler characteristics and will remain so in succeeding years.
4. There is a positive correlation between body weight and total antler points in yearling deer.
5. Spike-antlered deer should not receive differential protection. 6. Most deer which are spike-antlered as yearlings will not be spike-antlered
in later years, but will continue to be inferior to their fork-antlered cohorts.
Figure 21. Phenotypic characteristics such as antlers and body weight of white-tailed deer are heritable characters, which are influenced by both genetics and nutrition and the interaction of the
54 - B
Literature Cited and Selected References
Barr, A., J.H. Goodnight, J.P. Sall, and J.T. Helwig. 1982. SAS Users Guide: Statistics. SAS Inst. Inc., Raleigh, N.C. 584 pp.
Falconer, D.S. 1960 Introduction to quantitative genetics. The Ronald Press Co., New York.
French, C.E., L.C. McEwen, N.D. Magruder, R.H. Ingram, and R.W. Swift. 1955. Nutritional requirements of white-tailed deer for growth and antler development. Pa. State Univ., Agric. Exp. Sta. Bull. 600. 50 pp.
______, _______, _______, _______, and ______. 1956. Nutrient requirements for growth and antler development in the white-tailed deer. J. Wildl. Manage. 20:221-232.
Gill, L.J. 1978. Design and analysis of experiments in the animal and medical sciences. Vol. 2. Iowa State Univ. Press, Ames, Iowa. 302 pp.
Gottschalk, J.S. 1972. The German hunting system, West Germany, 1968. J. Wildl. Manage. 36:110-118.
Harmel, D.E. 1983. Effects of genetics on antler quality and body size in white-tailed deer. Pages
339-348 in R.D. Brown, ed. Antler development in cervidae. Caesar Kleberg Wildl. Res. Inst., Texas A & I Univ., Kingsville, Texas.
Lerner, I.M. 1950. Population genetics and animal improvement. Cambridge Univ. Press, Cambridge, Mass.
Lush, Jay. 1945. Animal breeding plans. Iowa State Univ. Press. Ames, Iowa.
Magruder, N.D., C.E. French, L.C. McEwen, and R.W. Swift. 1957. Nutritional requirements of white-tailed deer for growth and antler development II. Pa. State Univ. Agric. Exp.
Sta. Bull. 628. 21 pp.
Smith, M.H., M.N. Manloce and R.L. Marchinton. 1976. Use of population genetics for the management of fish and wildlife populations. Trans. N.Am. Wildl. Nat. Resour. Conf. 41:119-133.
________, R.K. Chesser, E.G. Cothran, and P.E. Johns. 1982. Genetic variability and antler growth in a natural population of white-tailed deer. Pages 365-387 in R.D. Brown, ed. Antler development in cervidae. Caesar Kleberg Wildl. Res. Inst., Texas A & I Univ., Kingsville, Texas.
Templeton, J.W., R.M. Sharp, J. Williams, D. Davis, D. Harmel, W. Armstrong, and S. Wardroup. 1983. Single dominant major gene effect on the expression of antler point number in the white-tailed deer. Abstract page 469 in R.D. Brown, ed. Antler development in cervidae. Caesar Kleberg Wildl. Res. Inst., Texas A & I Univ., Kingsville, Texas.
Verme, L.J., and D.E. Ullrey. 1972. Feeding and nutrition of deer. Pages 275-291 in The digestive
55 - B

physiology and nutrition of ruminants. Vol. 3. Practical Nutr. D.C. Church. Corcallis, Ore. 350 pp.
Williams, J.D., D.E. Harmel, W.E. Armstrong, and S.E. Wardroup. 1983. Antler development in the white tailed deer. Abstract page 468 in R.D. Brown, ed. Antler development
in cervidae. Caesar Kleberg Wildl. Res. Inst., Texas A & I Univ., Kingsville, Texas.
Appendix I Data Used in This Study
Definition of Variables
Variable Description OBS Sequence number BDATE Birth date BWT Birth Weight BYR Birth year PROGID Progeny identification number SIREID Sire identification number DAMNID Dam identification number YEAR Year of measurement WT Body weight (lbs) SPREAD Maximum inside main beam spread (mm) MBLEFT Length of left antler main beam (mm) MBRITE Length of right antler main beam (mm) BCLEFT Basal circumference of left antler (mm) BCRITE Basal circumference of right antler (mm) PTSL Total points of left antler PTSR Total points of right antler AWTL Total weight of left antler (g) AWTR Total weight of right antler (g) TPTS Total antler points SET Year of age of deer for antler development
(1 = 1.5 years, etc.)
56 - B

Appendix II Publications Resulting From This Study
Baxter, D., D.E. Harmel, W.E. Armstrong, and G. Butts. 1977. Spikes versus fork-antlered bucks. Texas Parks and Wildlife Magazine. Vol. 35(3):6-9.
Butts, G.L., D.E. Harmel, R.L. Cook, and W.E. Armstrong. 1978. Fawning dates of known-age white-tailed deer and their management implications. Proc. Ann. Conf. S.E. Assoc. Fish and Wildl. Agencies 32:335-338.
Cox, J., and D.E. Harmel. 1980. Big Charlie was no ordinary deer. Texas Parks and Wildlife Magazine. Vol. 38(4):24-26.
Harmel, D.E. 1981. Nutrition and heredity are the keys to big bucks. Texas Parks and Wildlife Magazine. Vol. 39(7):2-7.
_________. 1983. Effects of genetics on antler quality and body size in white-tailed deer. Pages 339-348 in R.D. Brown, ed. Antler development in cervidae. Caesar Kleberg Wildl. Res. Inst., Texas A & I Univ., Kingsville, Texas.
_________. 1983. Genetic Implications of Deer Proof Fencing in Sheila Roberson, ed. Deer-Proof
Fencing. Caesar Kleberg Wildl. Res. Int., Texas A & I Univ., Kingsville, Texas.
Williams, J.D., D.E. Harmel. 1984. Selection for antler points and body weight in white-tailed deer.
Proc. Annu. Conf. Southeast. Assoc. Fish and Wildlife Agencies. 38:43-50. 1984.
57 - B
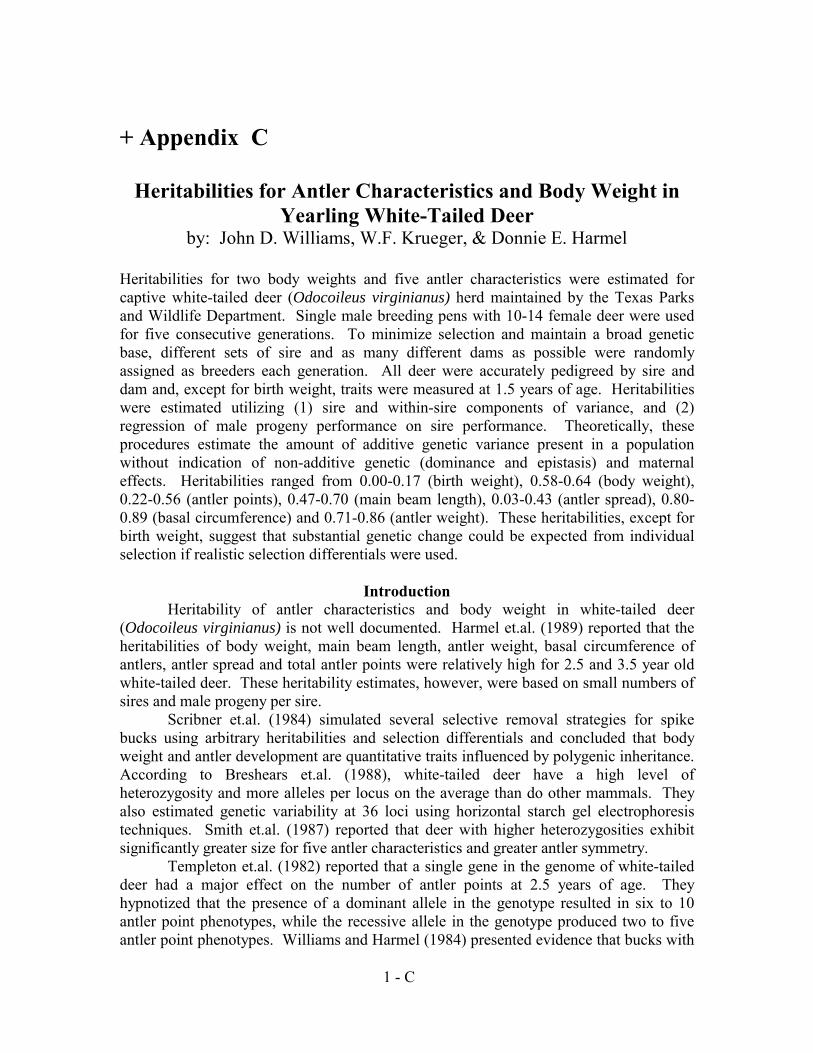
+ Appendix C
Heritabilities for Antler Characteristics and Body Weight in Yearling White-Tailed Deer
by: John D. Williams, W.F. Krueger, & Donnie E. Harmel
Heritabilities for two body weights and five antler characteristics were estimated for captive white-tailed deer (Odocoileus virginianus) herd maintained by the Texas Parks and Wildlife Department. Single male breeding pens with 10-14 female deer were used for five consecutive generations. To minimize selection and maintain a broad genetic base, different sets of sire and as many different dams as possible were randomly assigned as breeders each generation. All deer were accurately pedigreed by sire and dam and, except for birth weight, traits were measured at 1.5 years of age. Heritabilities were estimated utilizing (1) sire and within-sire components of variance, and (2) regression of male progeny performance on sire performance. Theoretically, these procedures estimate the amount of additive genetic variance present in a population without indication of non-additive genetic (dominance and epistasis) and maternal effects. Heritabilities ranged from 0.00-0.17 (birth weight), 0.58-0.64 (body weight), 0.22-0.56 (antler points), 0.47-0.70 (main beam length), 0.03-0.43 (antler spread), 0.80-0.89 (basal circumference) and 0.71-0.86 (antler weight). These heritabilities, except for birth weight, suggest that substantial genetic change could be expected from individual selection if realistic selection differentials were used.
Introduction Heritability of antler characteristics and body weight in white-tailed deer
(Odocoileus virginianus) is not well documented. Harmel et.al. (1989) reported that the heritabilities of body weight, main beam length, antler weight, basal circumference of antlers, antler spread and total antler points were relatively high for 2.5 and 3.5 year old white-tailed deer. These heritability estimates, however, were based on small numbers of sires and male progeny per sire.
Scribner et.al. (1984) simulated several selective removal strategies for spike bucks using arbitrary heritabilities and selection differentials and concluded that body weight and antler development are quantitative traits influenced by polygenic inheritance. According to Breshears et.al. (1988), white-tailed deer have a high level of heterozygosity and more alleles per locus on the average than do other mammals. They also estimated genetic variability at 36 loci using horizontal starch gel electrophoresis techniques. Smith et.al. (1987) reported that deer with higher heterozygosities exhibit significantly greater size for five antler characteristics and greater antler symmetry.
Templeton et.al. (1982) reported that a single gene in the genome of white-tailed deer had a major effect on the number of antler points at 2.5 years of age. They hypnotized that the presence of a dominant allele in the genotype resulted in six to 10 antler point phenotypes, while the recessive allele in the genotype produced two to five antler point phenotypes. Williams and Harmel (1984) presented evidence that bucks with
1 - C

less than six antler points at 1.5 years of age are genetically inferior for both quality of antlers and body weight, and that there was a positive phenotypic correlation between these two characteristics.
The objective of this study was to obtain heritability estimates for two body weights and five antler characteristics in white-tailed deer. All heritability estimates, except birth weight, were calculated from data collected from male white-tailed deer at 1.5 years of age. This appears to be an optimal age to evaluate the breeding value of white-tailed deer (Williams and Harmel, 1984).
Methods Male white-tailed deer with known antler and body weight measurements taken at
1.5 years of age were used as breeders and, depending upon the availability of dams, five to six single male breeding pens were used each year. Ten to 14 dams were placed in each breeding pen to ensure that a reasonable number of male progeny would be produced by each sire. The female breeders were maintained as a group in their respective pens until fawns were born. Since the breeding pens consisted of six adjacent 0.27 ha enclosures surrounded by a 2.44 m chain link fence, there should have been little pen effect which would appear as a genetic effect.
Males and females were randomly selected from a pedigree population maintained at the Kerr Wildlife Management Area, Hunt, Texas. Different sires were used in breeding pens in each of five consecutive breeding seasons to minimize selection and to maintain a broad genetic base among male breeders. Breeding females were assigned to single male pens at random to simulate random mating as much as possible. Because of a shortage of females, the same female breeders often were used in more than one year.
At birth, offspring were ear-tagged and tattooed, and birth weight (BW) was collected upon verifying the dam. Although it is common for white-tailed deer to allow fawns other than their own to nurse, the females were watched very closely during the fawning season and all fawns were assigned to a dam within 24 h of birth. This procedure of carefully observing both the dams and fawns on a daily basis leads to increased confidence in the accuracy of fawn pedigree. In a companion project, DNA fingerprinting has not uncovered any error in assignment (unpublished data).
All dams and fawns were moved from the breeding pens to a 1.62 ha pen at birth where they were maintained as a group until weaning. Progeny were reared to 1.5 years of age at which time body weight (WT) and antler measurements were taken. All antlers were removed 1-2 cm above the base, permanently marked and stored for future evaluation. Antler measurements taken included number of antler points (PT) over 25 mm in length, maximum inside spread (SP) of main beam, basal circumference (BC) of main beam, main beam (MB) length and total antler weight (AW). Birth weight (BW) and (WT) were measured in kilograms; (SP), (MB), and (BC) in millimeters; and (AW) in grams.
All fawns were weaned at 4-6 months of age, placed in a 1.62 ha pen, and fed ad libitum for the remainder of the study. The feed used was a pelleted 16 percent protein diet containing recommended levels of minerals and vitamins (Verme & Ullrey, 1972). All sires, dams and progeny received the same 16 percent protein dietary formulation ad libitum during the study and the same facilities were used each year.
2 - C

Statistical methods used to estimate heritability Heritabilities were estimated utilizing three different statistical methods. Since all
sires and some of the dams were replaced each year, the year to year variation would be confounded with genetic differences among annual breeder replacements. Therefore, year and pen differences for each of the traits were assumed to be random with mean zero and not included in any of the models used to estimate heritability. All statistical analyses were performed with the aid of the Statistical Analysis System (SAS, 1985). Method 1
The first method utilized hierarchical analysis of variance where sire (v 2/S) and within sire (v 2/E) components of variance were estimated. The statistical model utilized was Y(ik)=u+s(i)+e(ik), where Y(ik) is a measurement from the ikth offspring, u the population mean, s(i) the affect of the ith sire, and e(ik) the uncontrolled environmental and genetic deviations attributable to individuals within sire groups. All effects were assumed to be random, normal and independent with expectations equal to zero (Becker, 1984).
Heritability was estimated using the equation h 2/S=4v 2/S/(v 2/S + v 2/E).
The variance component v 2/S theoretically contains ³ of the additive (A) genetic variance plus 1/16 of the additive X additive (AA) genetic variance and 1/64 of the AAA genetic variance (Lerner, 1958; Falconer, 1960). The AA and AAA type interactions represent epistatic effects of additive gene loci which contribute to the additive genetic variance. Method 2
The second method of estimating heritability utilized regression of mean performance of male progeny (O) on sire (S) performance. The statistical model was Z(i)=b(os)X(i)+e(i), where Z(i) is the mean of all male offspring for the ith sire, X(i) is the observation on the ith sire, b(os) is the regression of Z on X, and e(i) is the error associated with the Zs (Becker, 1984) The resulting estimate of heritability is derived from the equation h(2)=2b(os). Method 3
This method was a modification of method 2 and regressed individual performance of male progeny on the record of the sire to yield another estimate of heritability. Although the regression of offspring on parent estimate of heritability is derived differently than the variance component method, both methods 2 and 3 estimate all of the additive (A) genetic variance and a portion of the epistatic effect (AA and AAA interaction) of additive genes interacting with additive genes and contributing to the additive genetic variance influencing a trait in the population. Neither method gives an estimate of dominance, non-additive epistatic effect, or maternal effect.
Results
The total sires and dams producing offspring in each of the five generations as well as the total male and female progeny reaching 1.5 years of age are shown in Table 1.
3 - C

In 1987, dam and progeny mortality was high because of extremely wet weather
conditions resulting in health problems.
Yearly mean performance values for each of the sever traits from male progeny
asicsith
Table 2. Mean values of five antler measurements at 1.5 years and two body weig for white-tailed deer male progeny for five consecutive years.
Progeny means by years ----------------------------------------------------------
1986 1987 1988 1989 1990 Trait (40)* (19) (22) (38) (27) Birth weight (kg) 2.50 2.90 2.75 2.77 2.45 Body weight (kg) 47.10 52.63 49.75 53.48 52.17
(1.5 years) Antler points 5.03 6.22 5.45 5.92 6.26 Main beam length 235.78 264.31 248.43 261.42 298.72 (mm) Spread (mm) 204.33 221.44 207.18 231.68 239.07 Basal circumference 61.13 70.22 61.98 69.24 72.31 (mm) Antler weight (g) 158.54 242.87 179.92 228.90 280.47
• * Number of male progeny reaching 1.5 years of age.
Table 1. Total white-tailed deer sires and dams used as breeders and progeny surviving to 1.5 years of age for each of five generations. Total progeny Total Total ------------------------------------------Year sires dams Males Females 1986 6 30 40 31 1987 6 15 19 8 1988 6 26 22 29 1989 5 32 38 34 1990 5 24 27 27 Total 28 127* 146 129 • * A total of 78 different females were used as breeders; however, some were used in
two or more breeding seasons.
re presented in Table 2. Similarly, the mean values for the corresponding traits in the res are presented in Table 3. The annual sire means for each of the traits varied onsiderably from year to year (Table 3) and, although no selection was intended for the res in the breeding pens, their individual and cumulative mean performance for each of e traits at 1.5 years of age exceeded that of their male progeny at the same age. The
4 - C

pooled within-year standard deviations and corresponding coefficients of variation for each of the means are large (Table 4). Part of this variation may be the result of the limited number of sires used as breeders each year.
Table 3. Mean values of five antler measurements at 1.5 years and two body weights of sires for five consecutive years.
Means by years ----------------------------------------------------------1986 1987 1988 1989 1990
Trait (6)* (6) (6) (5) (5) Birth weight (kg) 3.1 2.3 2.4 3.2 2.5 Body weight (kg) 52.0 59.5 50.0 57.5 56.3 (1.5 years) Antler points 5.3 7.6 6.0 7.4 7.2 Main beam length (mm) 222.1 301.8 268.9 299.9 328.8 Spread (mm) 220.5 291.6 222.5 262.0 273.8 Basal circumference(mm) 63.9 81.6 63.5 74.0 73.3 Antler weight (g) 196.5 372.6 197.1 299.2 304.4 * Number of sires utilized in breeding pens in each of the five years. Data were collected at birth and 1.5 years of age.
Table 4. Means, standard deviations (SD) and coefficients of variation (CV, %) for five antler measurements at 1.5 years and two body weights for white-tailed deer sires and progeny pooled for five consecutive years. Standard deviations and coefficients of variation are pooled within years.
Sires Progeny --------------------------- ---------------------------
Mean SD CV(%) Mean SD CV(%) Birth weight (kg) 2.69 0.51 19.16 2.64 0.47 17.65 Body weight (kg) 54.52 7.08 12.99 50.71 5.55 10.95 (1.5 years) Antler points 6.63 1.91 28.86 5.72 1.93 33.79 Main beam length(mm) 281.91 61.94 21.97 259.84 67.56 26.00 Spread (mm) 251.67 52.79 20.98 220.67 61.47 27.86 Basal circumference(mm) 70.57 10.15 14.38 66.60 8.96 13.45 Antler weight (g) 268.23 103.60 38.62 213.61 104.54 48.94
With the exception of birth weight (0.17), antler points (0.22) and antler spread (0.03), the heritabilities estimated from variance component analysis (method 1) are considered high (Table 5). When confidence limits are placed around the estimates for WT, MB, BC and AW, the lower limits are positive (P<0.05). When regression of individual progeny performance and mean progeny performance on sire performance are
5 - C

used to estimate heritability (methods 2 and 3), all estimates, except birth weight, are high. Placing confidence limits around these would be strongly positive (P<0.05). It is postulated that birth weight, at least in this population, is under strong maternal and environmental influence. Because of cost and facility limitations the experimental design could not be extended to obtain a valid estimate of maternal influences; however, rough computations, not reported here, suggest that significant maternal and environmental
Table 5. The heritabilities (h(2)), standard errors (SE) and lower confidence limits, for five antler measurements, birth weight and 1.5 year old body weight in white-tailed deer.
Heritabilities and standard errors . Variance Regression of offspring on sires .
Traits component Family means All progeny a(h 2/S) (SE) (h (2)) (SE) (h (2)) (SE)
(method 1) (method 2) (method 3) Birth weight 0.17 0.26 0.04 0.16 -0.13 0.16 Body weight 0.64* 0.33 0.58* 0.14 0.59* 0.12 (1.5 years) Points 0.22 0.23 0.56* 0.20 0.46* 0.14 Main beam length 0.49 0.34 0.70* 0.22 0.47* 0.14 Spread 0.03 0.24 0.43* 0.18 0.42* 0.16 Basal circumference 0.80* 0.35 0.89* 0.16 0.72* 0.12 Antler weight 0.71* 0.34 0.86* 0.18 0.75* 0.14 a[4v 2/S/(v 2/S + v 2/E) *CL(1)>0.00, where CL(1) is lower confidence limit of h(2) at 95% level. CL(1)= h(2)-(1.645 x SE).
effects contribute to the variance for birth weight with resultant low heritability.
Discussion Smith et.al. (1976, 1982), Scribner et.al. (1984), Chesser & Smith (1987) and Breshears (1988) recognized that body weight and antler characteristics were moderately to highly heritable, but did not determine heritabilities. Harmel et.al. (1989), using data collected from 1973 to 1985, reported heritabilities for length of main beam, antler weight and basal circumference in 1.5 year old deer of 0.80, 1.41 and 0.63 respectively. Estimates presented in this study, from a different data set, were 0.47-0.70 (MB), 0.71-0.86 (AW) and 0.72-0.89 (BC). Harmel et.al. (1989) also reported heritabilities for birth weight, main beam length, antler weight, basal circumference, antler spread and antler points of 2.5 and 3.5 year-old male deer which were similar to those in Table 5. Therefore, age of deer may not be a significant factor when estimating heritabilities for white-tailed deer. Five antler traits (PT, MB, SP, BC, AW) and WT at 1.5 years in this study were classified as intermediate to highly heritable.
Additive variance is the variance of breeding value, and is an important component of variance since it is the chief cause of resemblance between relatives and of
6 - C

the response of the population to selection (Falconer, 1960). The effectiveness of individual selection to change a phenotypic trait is related to the amount of additive genetic variance present, or the size of the heritability. If non-additive genetic variance (dominance and epistasis) is important, more sophisticated breeding systems must be employed to take advantage of this source of genetic variation. We were unable to obtain reliable sire x dam interaction mean squares. Templeton et.al. (1982) reported a dominant allele with a major effect on phenotypic expression of from six to 10 antler points, and a simple recessive allele contributing to expression of from two to five points.
The heritability of birth weight in white-tailed deer is low and appears to follow a pattern observed in other mammals where maternal effects appear to influence significantly birth weight. Falconer (1960) states that maternal effects are a frequent source of environmental differences between families, especially in mammals because the young are subjected to the maternal environment during the first stages of life. Johansson and Rendel (1968) present evidence that maternal environment has a considerable influence on the birth weight of calves; however, differences resulting from maternal environment tend to decrease with rising levels of nutrition of the dam. Clutton-Brock et.al. (1989) and Gomendio et.al. (1990) have recognized the importance of maternal influence in red deer (Cervus elaphas L.). They note that such factors as the lactating ability of the mother, number of progeny produced, sex ratio of calves at birth and plane of nutrition not only affect the newly born calf, but the condition of the mother as well. Lerner (1958) lists several factors that induce maternal effects between dam families. These include cytoplasmic inheritance, maternally provided nutrition, passive transmission of either pathogens or of antibodies from dam to offspring and imitative behaviour. Falconer (1960) adds the age and size of dams to this list. From a selection point of view, heritability of birth weight in white-tailed deer appears to be a poor variable to use because it is subject to a large number of environmental factors that affect prenatal and postnatal development. One must conclude that birth weight in this population of white-tailed deer is not highly heritable (h(2) = 0.00-0.17).
White-tailed deer are believed to possess a high level of heterozygosity (Smith et.al., 1976); Breashears et.al., 1988; Scribner et.al, 1984, 1989; Scribner & Smith, 1990). A review of papers by Carr et.al. (1986), Derr (1991), Derr et.al. (1991) and Ballinger et.al. (1992) suggests considerable genetic variation in the genome of white-tailed deer populations. Scribner et.al. (1984) used arbitrary selection differentials and heritabilities to model a population of white-tailed deer and reported that individual selection could be effective in altering the phenotypic characteristics of a population. They did not take into account the direction and magnitude of genetic correlations. In our study, the magnitude of the heritabilities are large for all traits except BW, indicating that there is considerable genotypic variability in this population. It would follow that there would be ample genetic variability for mass selection to be effective.
Acknowledgments Since appreciation is expressed to G.W. Litton for his support and
encouragement, to all the Kerr Wildlife Management Area staff, especially Joe Johnston, for day to day care of the deer, and to all those who assisted in the data collection process. This study was funded by the Texas Parks and Wildlife Department (Federal Aid Project W-109-R) and the Texas Agricultural Experiment Station (IP-6666).
7 - C

References Ballinger, S.W., L.H. Blankenship, J.W. Bickham, and S.M. Carr. 1992.
Allozyme and mitochondrial DNA analysis of a hybrid zone between white-tailed and mule deer in West Texas. Biochem. Genet., 30: 1-11.
Becker, W.A. 1984. Manual of Quantitative Genetics, 4th edn. Academic Enterprises, Pullmann, WA.
Breshears, D.D., M.H. Smith, E.G. Cothran, and P.E. Johns. 1988. Genetic variability in white-tailed deer. Heredity, 60:139-146.
Carr, S.M., S.W. Ballinger, J.N. Derr, L.H. Blankenship, J.W. Bickham. 1986. Mitochondiral DNA analysis of hybridization between sympatric white-tailed deer and mule deer in West Texas. Proc.Natl. Acad. Sci. U.S.A., 83:9576-9580.
Chesser, R.K. and M.H. Smith. 1987. Relationship of genetic variation to growth and reproduction in the white-tailed deer. In: Wemmer, C. (ed) Biology and Management of the Cervidae, pp. 168-177. Smithsonian Institution Press, Washington, D.C.
Clutton-Brock, T.H., S.D. Albon, and F.E. Guinness. 1989. Fitness costs of gestation and lactation in wild mammals. Nature, 337:260-262.
Derr, J.N. 1991. Genetic interactions between white-tailed and mule deer in the Southwestern United States. J. Wildl. Management, 55:228-237.
Derr., J.N., D.W. Hale, D.L. Ellsworth, and J.W. Bickham. 1991. Fertility in an F(1) male hybrid of white-tailed deer x mule deer. J Reprod. Fert., 93:111-117.
Falconer, D.S. 1960. Introduction to Quantitative Genetics. Ronald Press, New York. Gomendio, M., T.H., Clutton-Brock, S.D. Albon, F.E. Guinness and M.J.
Simpson. 1990. Mammalian sex ratios and variation in costs of rearing sons and daughters. Nature, 343:261-263.
Harmel, D.E., J. D. Williams, W.E. Armstrong. 1989. Effects of genetics and nutrition on antler development and body size of white-tailed deer. Final Report, Texas Parks and Wildlife, Hunt, Texas.
Johansson, I. and J. Rendel. 1968. Genetics and Animal Breeding . Freeman, San Francisco.
Lerner, I.M. 1958. The Genetic Basis of Selection. Wiley, New York. SAS Institute Inc. 1985. SAS User‘s Guide: Statistics version 5.SAS
Institute, Cary, N.C. Scribner, K.T. and M.H. Smith. 1990. Genetic variability and antler
development. In: Bubenik, G.A. and Bubenik, A.B. (eds) Horns Pronghorns, and Antlers, pp. 460-476. Springer, New York.
Scribner, K.T., M.H. Smith, and P.E. Johns. 1984. Age, condition, and
8 - C
genetic effects on incidence of spike bucks. Proc. Annu. Conf. Southeast Assoc. Fish and Wildlife Agencies, 38:23-32.
Scribner, K.T., M.H. Smith, and P.E. Johns. 1989. Environmental and genetic components of antler growth in white-tailed deer. J. Mammal., 70:284-291
Smith, M.H., R.K. Chesser, E.G. Cothran, P.E. Johns. 1982. Genetic variability and antler growth ina natural population of white-tailed deer. In: Brown, R.D. (ed) Antler Development in Cervidae, pp. 365-387. Caesar Kleberg Wildlife Research Institute, Kingsville, TX.
Smith, M.H., H.O. Hillestad, M.N. Manlove, and R.L. Marchington. 1976. Use of population genetics data for the management of fish and wildlife populations. Trans. North Am. Wildlife Nat. Resources Conf., 41:119-133.
Smith, M.H., K.T. Scribner, O.E. Rhodes Jr., and P.E. Johns. 1987. Genetics and antler development. Proc 18th Congr. Int. Union Game Biol., 1:323-326. Swait Press, Krakow, Poland.
Templeton, J.W., R.M. Sharp, J. D. Williams, D.S. Davis, D.E. Harmel,W.E. Armstrong, and S.E. Wardroup. 1982. Single dominant major gene effect on the expression of antler point number in the white-tailed deer. In: Brown, R.D. (ed), Antler Development in Cervidae, p. 469. Caesar Kleberg Wildlife Research Institute, Kingsville, TX.
Verme, L.J., and D.E. Ullrey. 1972. Feeding and nutrition of deer. In: The Digestive Physiology and Nutrition of Ruminants, vol. 3, Practical Nutrition, pp. 275-291. D.C. Church, Corvallis, OR.
Williams, J.D. and D.E. Harmel. 1984. Selection for antler points and body weight in white-tailed deer. Proc. Annu. Conf. Southeast Assoc. Fish and Wildlife Agencies, 38:43-53.
9 - C
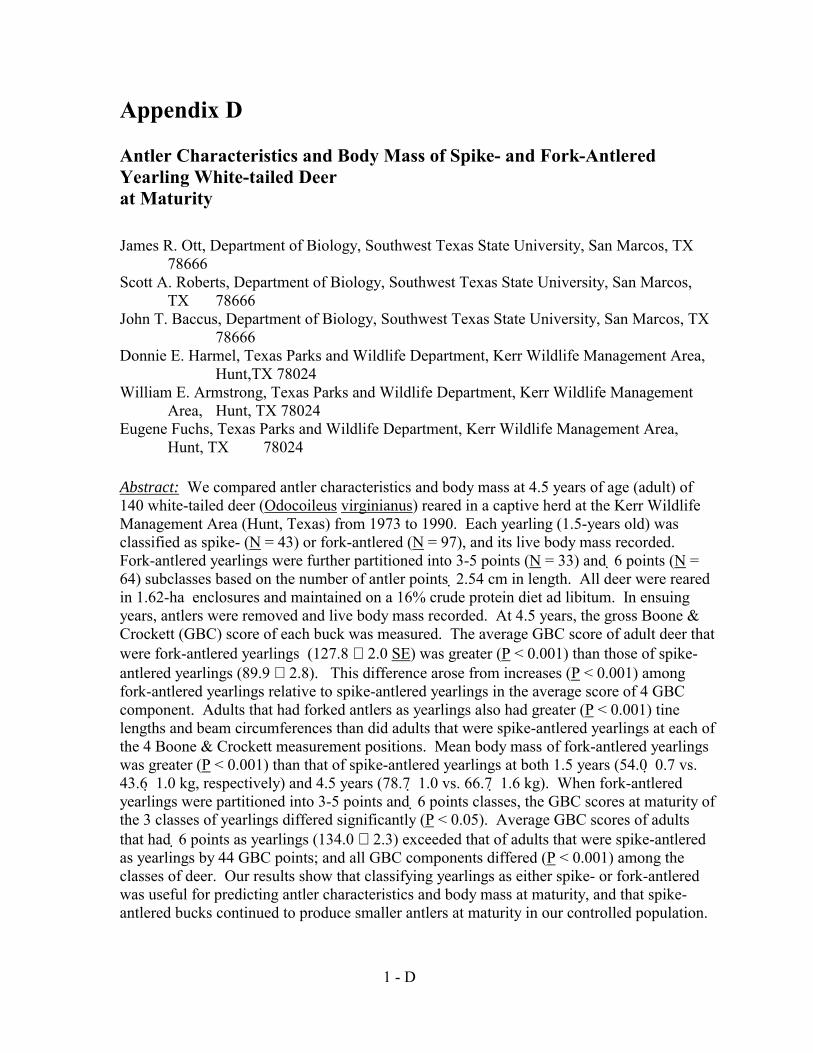
Appendix D
Antler Characteristics and Body Mass of Spike- and Fork-Antlered Yearling White-tailed Deer at Maturity
James R. Ott, Department of Biology, Southwest Texas State University, San Marcos, TX 78666
Scott A. Roberts, Department of Biology, Southwest Texas State University, San Marcos, TX 78666
John T. Baccus, Department of Biology, Southwest Texas State University, San Marcos, TX 78666
Donnie E. Harmel, Texas Parks and Wildlife Department, Kerr Wildlife Management Area, Hunt,TX 78024
William E. Armstrong, Texas Parks and Wildlife Department, Kerr Wildlife Management Area, Hunt, TX 78024
Eugene Fuchs, Texas Parks and Wildlife Department, Kerr Wildlife Management Area, Hunt, TX 78024
Abstract: We compared antler characteristics and body mass at 4.5 years of age (adult) of 140 white-tailed deer (Odocoileus virginianus) reared in a captive herd at the Kerr Wildlife Management Area (Hunt, Texas) from 1973 to 1990. Each yearling (1.5-years old) was classified as spike- (N = 43) or fork-antlered (N = 97), and its live body mass recorded. Fork-antlered yearlings were further partitioned into 3-5 points (N = 33) and 6 points (N = 64) subclasses based on the number of antler points 2.54 cm in length. All deer were reared in 1.62-ha enclosures and maintained on a 16% crude protein diet ad libitum. In ensuing years, antlers were removed and live body mass recorded. At 4.5 years, the gross Boone & Crockett (GBC) score of each buck was measured. The average GBC score of adult deer that were fork-antlered yearlings (127.8 ∀ 2.0 SE) was greater (P < 0.001) than those of spike-antlered yearlings (89.9 ∀ 2.8). This difference arose from increases (P < 0.001) among fork-antlered yearlings relative to spike-antlered yearlings in the average score of 4 GBC component. Adults that had forked antlers as yearlings also had greater (P < 0.001) tine lengths and beam circumferences than did adults that were spike-antlered yearlings at each of the 4 Boone & Crockett measurement positions. Mean body mass of fork-antlered yearlings was greater (P < 0.001) than that of spike-antlered yearlings at both 1.5 years (54.0 0.7 vs. 43.6 1.0 kg, respectively) and 4.5 years (78.7 1.0 vs. 66.7 1.6 kg). When fork-antlered yearlings were partitioned into 3-5 points and 6 points classes, the GBC scores at maturity of the 3 classes of yearlings differed significantly (P < 0.05). Average GBC scores of adults that had 6 points as yearlings (134.0 ∀ 2.3) exceeded that of adults that were spike-antlered as yearlings by 44 GBC points; and all GBC components differed (P < 0.001) among the classes of deer. Our results show that classifying yearlings as either spike- or fork-antlered was useful for predicting antler characteristics and body mass at maturity, and that spike-antlered bucks continued to produce smaller antlers at maturity in our controlled population.
1 - D

______________________________________________________
Proc. Annu. Conf. Southeast. Assoc. Fish and Wildl. Agencies 51:400-413
The relative expression of antler traits and overall antler quality in white-tailed deer changes with age (Sauer 1984). However, because antler development is physiologically linked to body maintenance and growth (French et al. 1956, Moen 1978), the expression of antler traits can be correlated with body mass within (Severinghaus and Moen 1983, Williams et al. 1983) and among (Williams and Harmel 1984) age-classes and with body condition within age-classes (Smith et al. 1983). Given the linkage between body condition and the expression of antler traits, it is axiomatic that variation in the nutritional quality of forage included in the diet plays a significant role in generating variation in antler trait expression (Teer et al. 1965, Ullrey 1983).
Antler size and body mass vary also as a function of an individual‘ multilocus genotype, as demonstrated by the finding of significant heritabilities for body mass and antler traits at 1.5 years of age (Harmel et al. 1989, Williams et al. 1994,--but see Lukefahr and Jacobson (In press). Moreover, antler quality can vary as a function of heterozygosity within an age-class (Smith et al. 1983; Scribner et al. 1984, 1989; Scribner and Smith 1990).
At the population level, antler quality varies temporally within populations (Smith et al. 1983, Scribner et al. 1989) and spatially among populations with differences in habitat quality (Scribner et al. 1984, Shea et al. 1992a). Within the yearling age-class, the production of spike antlers in white-tailed deer is influenced by parental genotypes (Harmel 1983, Smith et al. 1983, Harmel et al. 1989, Williams et al. 1994) and nongenetic factors, such as maternal effects (Lukefahr and Jacobson, In press), and parturition date (Knox et al. 1991, Shea et al. 1992b, but see Causey 1990).
While there is general agreement that the incidence of spike-antlered yearlings varies temporally and spatially within and among populations within a region, and among regions, data directly addressing the relative importance of genetic and environmental factors in the production of spike-antlered yearlings in natural populations are nonexistent. Moreover, data addressing this issue in controlled populations are both scant and contradictory (Williams et al. 1994; Lukefahr and Jacobson, In press). As a result, there is disagreement concerning the relative roles of environmental and genetic variation in the production of spike-antlered yearlings in the scientific and especially the popular literature, which is readily accessible to the land manager (Brothers and Ray 1982, Kroll 1991, Armstrong et al. 1995). Thus, the management decision to protect or remove spike-antlered bucks in natural or high-fenced populations remains controversial throughout the southeastern United States (Jacobson and White 1985, Armstrong et al. 1995).
Two central questions must be addressed to resolve this controversy. First, do yearling spike bucks continue to exhibit smaller antlers and reduced body masses at later ages compared to their nonspike counterparts, and second, to what extent are antler and body mass traits heritable? The competing hypotheses regarding question one are (1) spike-antlered yearlings continue to express smaller antlers and lower body mass than fork-antlered yearlings in subsequent age-classes (Armstrong et al. 1995) and (2) spike-
2 - D

antlered bucks exhibit compensatory growth in body mass and antler characteristics and thus recover in later age-classes (Jacobson and White 1985). We provide comparative data on body mass and antler characteristics of antler quality of spike- and fork-antlered yearlings reared under controlled environmental conditions to 4.5 years of age.
We chose the Boone & Crockett scoring system (Boone and Crockett 1982) to compare antler characteristics of spike- and fork-antlered yearling white-tailed deer at 4.5 years of age for 3 reasons. First, the controversy surrounding the management of spike-antlered bucks is ultimately about the overall quality of antlers produced by each class of deer. Antler traits such as total mass and main beam length, length and/or number of points, symmetry, and inside and outside spread influence observer perceptions of the overall quality of antlers produced by mature white-tailed deer. No one element of antler conformation summarizes overall antler quality, and perceptions of quality vary among observers due to differences in the relative weighting assigned to individual components, differences in environmental context (e.g., variation among local or regional population averages for the above traits), and differences in observer experience. As a consequence, the notion of antler quality varies in spatial, temporal, and social contexts. The Boone & Crockett scoring system provides a standardized metric for summarizing overall antler quality and the relative contribution of each component of antler quality. Second, the Boone & Crockett system is widely used for comparison in the popular white-tailed deer literature perused by private and public managers and especially hunters (the end recipient of management objectives). Third, white-tailed deer managers, guides, and hunters are adept at estimating gross Boone & Crockett (GBC) scores under field conditions.
The authors thank Texas Parks and Wildlife Department personnel for logistical support, J. D. Williams of Texas A&M University for his guidance, and C. A. DeYoung, E. C. Hellgren, E. M. Silverfine, R. J. Warren, and an anonymous reviewer for editorial comments on the manuscript. This project was funded by the Texas Parks and Wildlife Department (Federal Aid Project W-109-R).
METHODS
Herd history and composition of the data set We examined case records of 140 male white-tailed deer reared from 1973 to
1990 in a pedigreed white-tailed deer herd at the Kerr Wildlife Management Area, a facility owned and operated by the Texas Parks and Wildlife Department, near Hunt, Kerr County, Texas. The Kerr deer herd was established in 1974 from stock obtained throughout Texas and is thus representative of Texas white-tailed deer. The herd has been maintained as a closed breeding population to study genetic and environmental contributions to variation in antler and body traits of white-tailed deer. The foundation stock consisted of 6 buck fawns obtained in 1973 from the following locations: Brazos, Kendall, Kerr, and Walker counties, and Abilene, and Midland, Texas. Bred does (sires unknown) of independent parentage were live-trapped throughout Texas and used as foundation females. Importantly, the Kerr herd has been shown to exhibit a level of heterozygosity that as of 1996 was comparable to natural deer herds throughout Texas (R. L. Honeycutt, unpubl. data).
3 - D
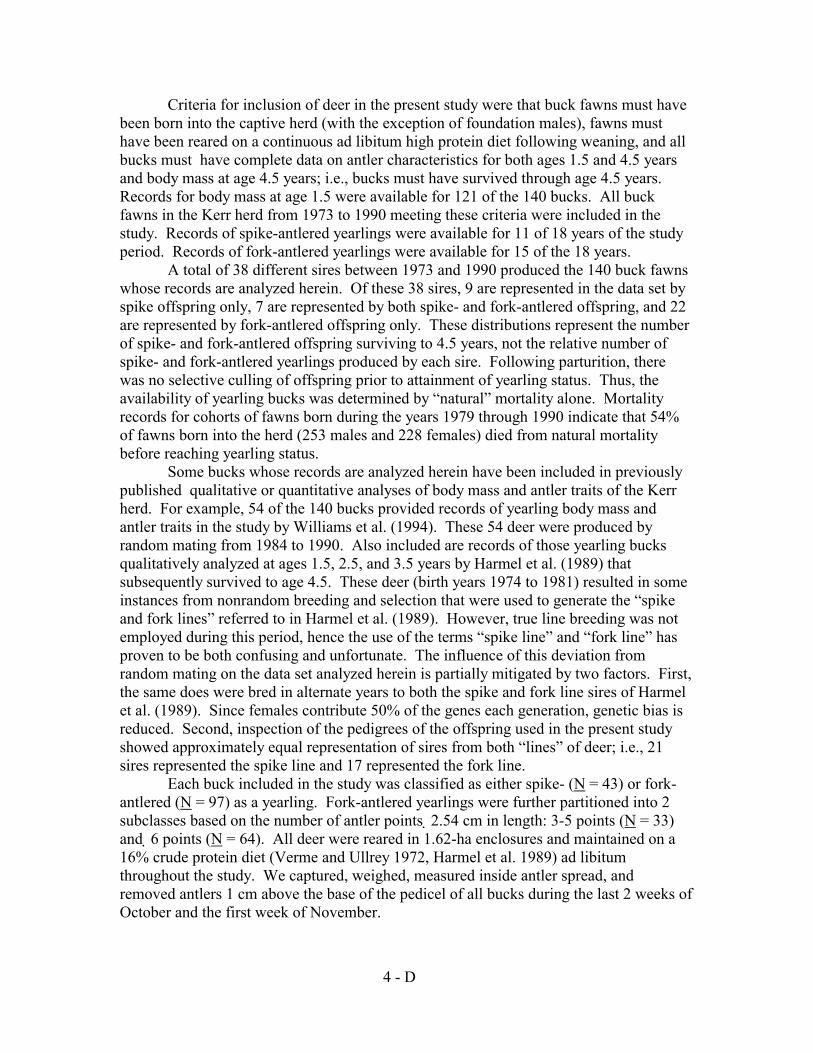
Criteria for inclusion of deer in the present study were that buck fawns must have been born into the captive herd (with the exception of foundation males), fawns must have been reared on a continuous ad libitum high protein diet following weaning, and all bucks must have complete data on antler characteristics for both ages 1.5 and 4.5 years and body mass at age 4.5 years; i.e., bucks must have survived through age 4.5 years. Records for body mass at age 1.5 were available for 121 of the 140 bucks. All buck fawns in the Kerr herd from 1973 to 1990 meeting these criteria were included in the study. Records of spike-antlered yearlings were available for 11 of 18 years of the study period. Records of fork-antlered yearlings were available for 15 of the 18 years.
A total of 38 different sires between 1973 and 1990 produced the 140 buck fawns whose records are analyzed herein. Of these 38 sires, 9 are represented in the data set by spike offspring only, 7 are represented by both spike- and fork-antlered offspring, and 22 are represented by fork-antlered offspring only. These distributions represent the number of spike- and fork-antlered offspring surviving to 4.5 years, not the relative number of spike- and fork-antlered yearlings produced by each sire. Following parturition, there was no selective culling of offspring prior to attainment of yearling status. Thus, the availability of yearling bucks was determined by —natural“ mortality alone. Mortality records for cohorts of fawns born during the years 1979 through 1990 indicate that 54% of fawns born into the herd (253 males and 228 females) died from natural mortality before reaching yearling status.
Some bucks whose records are analyzed herein have been included in previously published qualitative or quantitative analyses of body mass and antler traits of the Kerr herd. For example, 54 of the 140 bucks provided records of yearling body mass and antler traits in the study by Williams et al. (1994). These 54 deer were produced by random mating from 1984 to 1990. Also included are records of those yearling bucks qualitatively analyzed at ages 1.5, 2.5, and 3.5 years by Harmel et al. (1989) that subsequently survived to age 4.5. These deer (birth years 1974 to 1981) resulted in some instances from nonrandom breeding and selection that were used to generate the —spike and fork lines“ referred to in Harmel et al. (1989). However, true line breeding was not employed during this period, hence the use of the terms —spike line“ and —fork line“ has proven to be both confusing and unfortunate. The influence of this deviation from random mating on the data set analyzed herein is partially mitigated by two factors. First, the same does were bred in alternate years to both the spike and fork line sires of Harmel et al. (1989). Since females contribute 50% of the genes each generation, genetic bias is reduced. Second, inspection of the pedigrees of the offspring used in the present study showed approximately equal representation of sires from both —lines“ of deer; i.e., 21 sires represented the spike line and 17 represented the fork line.
Each buck included in the study was classified as either spike- (N = 43) or fork-antlered (N = 97) as a yearling. Fork-antlered yearlings were further partitioned into 2 subclasses based on the number of antler points 2.54 cm in length: 3-5 points (N = 33) and 6 points (N = 64). All deer were reared in 1.62-ha enclosures and maintained on a 16% crude protein diet (Verme and Ullrey 1972, Harmel et al. 1989) ad libitum throughout the study. We captured, weighed, measured inside antler spread, and removed antlers 1 cm above the base of the pedicel of all bucks during the last 2 weeks of October and the first week of November.
4 - D

Gross Boone and Crockett score was computed for each adult buck based on the formula: GBC = Γ MB + Γ GN + Γ HN + SP + Γ NTPTS; where Γ MB = combined lengths of the main beams of the right and left antlers; sum GN = total length of tines G1 to GN on both the left and right antlers; ΓHN = total beam circumferences H1 to H4 at the 4 measurement positions for both left and right beams; SP = maximum inside spread between the antlers; and Γ NTPTS = total length of all nontypical points. Nontypical points were used in computing GBC scores at 4.5 years but were not further analyzed because so few deer of either class expressed such points. All measurements were recorded in mm by means of a flexible steel tape and were converted to inches to compute GBC scores (standardly expressed in inches). Both right and left antlers were measured for all deer to yield the summations sum MB, Γ GN, and Γ HN. A preliminary comparison of right and left antler characteristics showed no significant bilateral asymmetry. Tests of normality and homogeneity of variances showed that no transformations were required for any dependent variables analyzed herein.
Statistical Analyses
Gross Boone and Crockett scores at 4.5 years and live body mass at 1.5 and 4.5 years were compared between spike- and fork-antlered yearlings by analysis of variance (ANOVA). Separate ANOVAs tested the null hypotheses that each of the 4 GBC components did not differ at maturity between the 2 classes of yearling deer. Two further ANOVAs were conducted to determine if the subcomponents of Γ GN and ΓHN differed between the 2 classes of bucks.
We used ANOVA to determine whether GBC scores at 4.5 years and live body weights of yearlings and adults differed among deer that had spike antlers, antlers with 3-5 points, or antlers with 6 points as yearlings. The null hypothesis that each GBC component did not differ at maturity among the 3 classes of yearling deer was then tested using ANOVAs followed by comparison of means. Tukey‘s studentized range test ( = 0.05) was used for all means comparisons.
RESULTS Gross Boone & Crockett Scores and Body Mass of Yearlings at Maturity
Spike-antlered yearlings produced GBC scores at maturity (4.5 years old) that were less than those of fork-antlered yearlings (x = 89.9 2.8 [SE], N = 43, and 127.8 ∀2.0, N = 97 respectively; F1,138 = 115.9; P < 0.001). The distribution of GBC scores of the 2 classes of bucks overlapped minimally, and the production of —near trophy class“ (∃120 GBC) and —trophy class“ (∃ 130 GBC) bucks differed markedly between spike- and fork-antlered yearlings (Fig. 1). Most fork-antlered yearlings (62%) produced GBC scores ∃120 at 4.5 years, whereas only 2.3% of spike-antlered yearling had similar scores. All trophy-class bucks developed from fork-antlered yearlings. Spike-antlered yearlings also weighed less than fork-antlered yearlings at 1.5 years of age (x = 43.6 ∀ 1.0 kg, N = 34 and x = 54.0 0.7 kg, N = 87 respectively; F1,119 = 63.6; P < 0.001) and at
5 - D

4.5 years of age (x = 66.7 ∀ 1.6 kg, N = 43 and x = 78.7 ∀ 1.0 kg, N = 97; F1,136 = 44.4; P < 0.001 (Fig. 2).
0 2 4 6 8
10 12 14 16 18 20
45 55 65 75 85 95 105
115
125
135
145
155
165
Gross Boone & Crockett Score
Freq
uenc
y Freq Spikes Freq. Forks
Figure 1. Distribution of gross Boone and Crocket (GBC) scores for white-tailed deer at 4.5 years of age that as yearlings were spike-antlered (N=43) or fork-antlered (n=97) in the Kerr deer herd, Kerr County, Texas, 1973-1990.
0
5
10
15
20
25
30
30
35
40
45
50
55
60
65
70
Body Mass (kg)
Freq
uenc
y
Spike freq @ 1.5 Fork freq. @ 1.5
A
0 2 4 6 8
10 12 14 16 18 20
45
50
55
60
65
70
75
80
85
90
95 100
Body Mass (kg)
Freq
uenc
y
Spike freq @ 4.5 Fork freq @ 4.5
B
Figure 2. Distribution of body mass of (A) spike-antlered (N=34) and forked-antlered (N=87) yearling white-tailed-deer at 1.5 years of age and (B) spike-antlered (N=43) and fork-antlered (N=97) yearlings at 4.5 years of age in the Kerr deer herd, Kerr County, Texas.
6 - D

Components of GBC Scores of Yearlings at Maturity
At maturity, fork-antlered yearlings produced higher scores than did spike-antlered yearlings for all 4 GBC components (P < 0.001 for all comparisons, Table 1). These results indicate that the 42% increase in GBC scores at maturity for fork-antlered yearling bucks (38 inches of additional antler) arose from differences in every component of GBC score. Most notably, the total length of tines produced by fork-antlered bucks
ebeininF
Table 1. Comparison of Gross Boone & Crockett (GBC) component scores (in inches) between spike-antlered (N = 43) and fork-antlered (N = 97) yearling white-tailed deer at 4.5 years of age in the Kerr deer herd, Kerr County, Texas, 1973-1990.
Spike antlered Fork antlered GBC Component1 x SE x SE % increase2
P > F 3333MB 31.8 0.7 39.0 0.5 + 22.6
<0.001 3333GN 21.1 1.6 41.8 1.1 + 97.6
<0.001 3333HN 22.2 0.5 28.1 0.4 + 26.5
<0.001 SP 14.4 0.4 16.5 0.3 + 14.3
<0.001 1 Components are: 3333MB = combined length of right and left main beams; 3333GN = combined length of all tines on the right and left antler; 3333HN = combined circumference of the 4 measurement positions of both the right and left antler; and SP = maximum inside spread between right and left antlers. 2 Percent increase relative to spike score = [(fork antlered - spike antlered)/spike antlered] *100.
xceeded that of spike-antlered bucks by an average of 98%. This difference arose ecause of significant increases in the length of tines produced by fork-antlered bucks at ach measurement position (P < 0.001 for all comparisons, Fig. 3). Similarly, the 26% crease in total circumference scores for adult fork-antlered bucks arose from significant creases in circumference at all measurement positions (P < 0.001 for all comparisons, ig. 4).
7 - D

-5
0
5
10
15
20
25
G1 G2 G3 G4
Tine Position
Tine
Len
gth
Fork mean @ 4.5 Spike mean @ 4.5
97
97
94
37 41
37
25
2
Figure 3. Average SE total length of tines at measurement positions G1 to G4 on the main beam (Γ left + right antlers) at 4.5 years of age for spike- and fork-antlered yearlings in the Kerr deer herd, Kerr County, Texas, 1973-1990. Numbers above SE bars indicate the number of individuals in which total length of tines was greater than 0 at each measurement position. Total tine length is expressed in inches.
4
5
6
7
8
9
H 1 H 2 H 3 H 4
C irc u m fe re n c e
Circ
umfe
renc
e
F o rk M e a n @ 4 .5 S p ik e M e a n @ 4 .5
Figure 4. Mean SE circumference as a function of measurement positions (H1 to H4) along the main beam at 4.5 years of age for spike- and fork-antlered yearling white-tailed deer in the Kerr deer herd, Kerr County, Texas, 1973-1990. Circumference is the sum of right and left antlers in inches. Sample size = 43 and 97 at all measurement positions for spike and fork-antlered yearlings, respectively.
8 - D
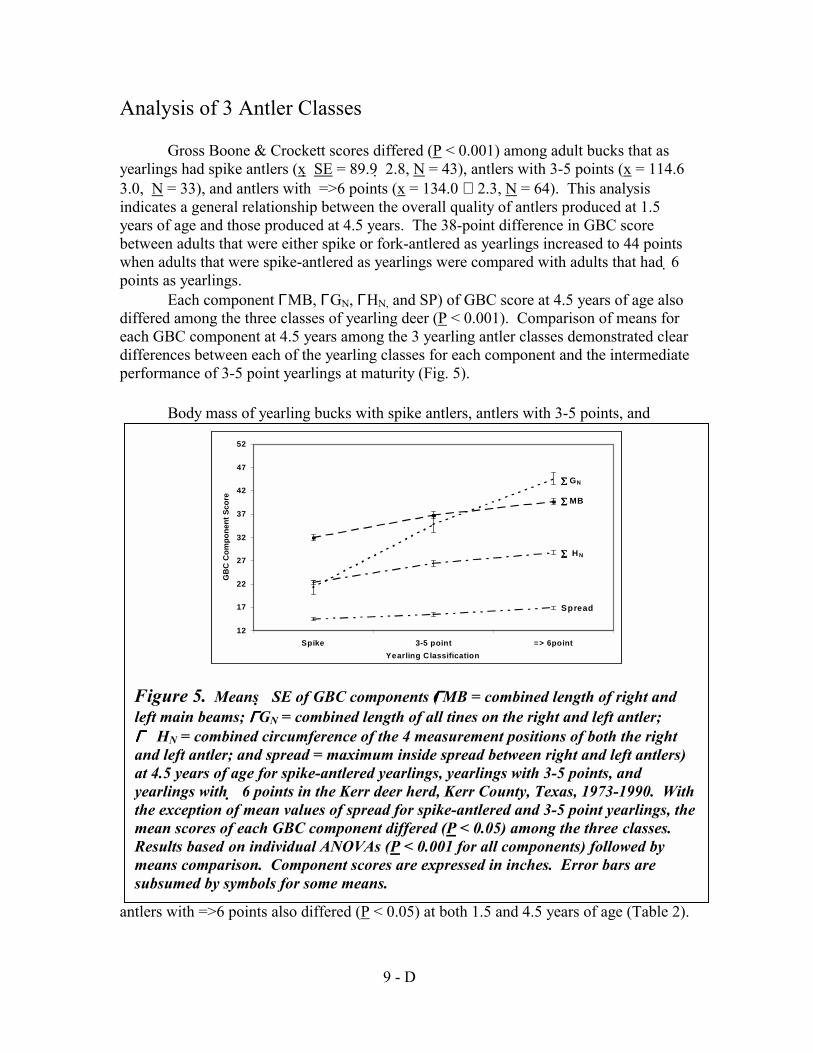
Analysis of 3 Antler Classes
Gross Boone & Crockett scores differed (P < 0.001) among adult bucks that as yearlings had spike antlers (x SE = 89.9 2.8, N = 43), antlers with 3-5 points (x = 114.6 3.0, N = 33), and antlers with =>6 points (x = 134.0 ∀ 2.3, N = 64). This analysis indicates a general relationship between the overall quality of antlers produced at 1.5 years of age and those produced at 4.5 years. The 38-point difference in GBC score between adults that were either spike or fork-antlered as yearlings increased to 44 points when adults that were spike-antlered as yearlings were compared with adults that had 6 points as yearlings.
Each component ΓMB, ΓGN, ΓHN, and SP) of GBC score at 4.5 years of age also differed among the three classes of yearling deer (P < 0.001). Comparison of means for each GBC component at 4.5 years among the 3 yearling antler classes demonstrated clear differences between each of the yearling classes for each component and the intermediate performance of 3-5 point yearlings at maturity (Fig. 5).
Body mass of yearling bucks with spike antlers, antlers with 3-5 points, and
12
17
22
27
32
37
42
47
52
Spike 3-5 point => 6point Yearling Classification
GB
C C
ompo
nent
Sco
re
∑∑∑∑ GN
∑∑∑∑ MB
∑∑∑∑ H N
Spread
Figure 5. Means SE of GBC components (ΓΓΓΓMB = combined length of right and left main beams; ΓΓΓΓGN = combined length of all tines on the right and left antler; ΓΓΓΓ�HN = combined circumference of the 4 measurement positions of both the right and left antler; and spread = maximum inside spread between right and left antlers) at 4.5 years of age for spike-antlered yearlings, yearlings with 3-5 points, and yearlings with 6 points in the Kerr deer herd, Kerr County, Texas, 1973-1990. With the exception of mean values of spread for spike-antlered and 3-5 point yearlings, the mean scores of each GBC component differed (P < 0.05) among the three classes. Results based on individual ANOVAs (P < 0.001 for all components) followed by means comparison. Component scores are expressed in inches. Error bars are subsumed by symbols for some means.
antlers with =>6 points also differed (P < 0.05) at both 1.5 and 4.5 years of age (Table 2).
9 - D

At maturity, spike-antlered yearlings attained only 83% of the live body mass achieved at maturity by yearlings with =>6 points.
Table 2. Live body mass (kg) at 1.5 and 4.5 years of age for yearling bucks with spike antlers, antlers with 3 -5 points, or antlers with 6 points in the Kerr deer herd, Kerr County, Texas, 1973-1990.
Yearling classification
Spike antlers 3 - 5 points ∃∃∃∃6 points
Body mass (1.5 years)1
x SE N
43.6A 1.0 34 48.6B 1.0 26 56.3C 0.8 61
Body mass (4.5 years) x SE N
66.7A 1.6 43 75.4B 2.0 33 80.5C 1.1 64
1 Results based on ANOVA followed by means comparison using Tukey‘s studentized range test. For 1.5 years, F 2, 118 = 56.5, P < 0.0001; for age 4.5 years, F 2, 136 = 25.8, P < 0.0001). Means followed by different letters within a year-class are significantly different at P < 0.05.
DISCUSSION
Traditionally, participants in the controversy regarding alternative protocols to employ in managing spike bucks have considered yearling bucks to fall neatly into two categories: spike or fork antlers (Brothers and Ray 1982 , Kroll 1991, Armstrong et al. 1995). We tested and rejected the long-standing controversial hypothesis that spike- and fork-antlered yearling bucks do not differ at maturity in antler characteristics and body weights. Direct comparison of spike- and fork-antlered yearling bucks at 4.5 years of age after being reared under controlled conditions demonstrated unequivocally that mean antler quality and body mass of spike-antlered yearlings at maturity were less than for fork-antlered yearlings. Fork-antlered yearlings reared during a 18-year study in the Kerr Wildlife Management Area captive deer herd consistently produced GBC scores and body masses that averaged nearly 1.4- and 1.2-x greater than those of spike-antlered yearlings, respectively. Thus, classifying yearling white-tailed bucks as either spike- or fork-antlered is a reliable tool for predicting overall antler quality and live body mass at maturity.
Our results were consistent with prior published studies of the relationship between antler traits and body mass of yearling deer and the expression of these traits in later age-classes (Williams et al. 1983, Scribner et al. 1984, Williams and Harmel 1984, Harmel et al. 1989, Schultz and Johnson 1992). Earlier studies of the Kerr deer herd (Williams et al. 1983, Williams and Harmel 1984) showed that the average body mass of yearlings at 1.5, 2.5, and 3.5 years of age was significantly less for deer that had < 6 points as yearlings compared to those with 6 points. The number of antler points at 1.5
10 - D

years of age was correlated with number of antler points at 2.5 and 3.5 years. As a consequence, yearlings with < 6 points produced inferior antlers in their second and third antler sets. In an analysis of harvested free-ranging bucks, Scribner et al. (1984) showed that the body mass of 1.5-, 2.5-, and 3.5-year-old bucks that had spike antlers as yearlings was significantly less than those that had forked antlers as yearlings. Harmel et al. (1989) qualitatively compared 64 spike- and fork-antlered yearlings produced within the Kerr deer herd from 1.5 through 3.5 years of age and showed that spike-antlered yearlings (N = 26) remained inferior to fork-antlered yearlings (N = 38) in antler mass, main beam length, number of points, and body mass through 3.5 years of age. The current quantitative study strengthens the qualitative study of Harmel et al. (1989) and extends the results of Williams et al. (1983), Williams and Harmel (1984), and Harmel et al. (1989) to the 4.5-year age-class.
Our results show that differences in antler quality (indexed in earlier studies as a series of individual, although not uncorrelated, metrics--e.g., antler mass, number of points, basal circumference, beam length, and spread) translated into large differences in a single measure of overall antler quality, i.e., GBC score. Moreover, our results document that differences in overall quality arose because of significant increases in each component (ΓMB, ΓGN, ΓHN, and SP) of GBC score.
Increased tine lengths and, to a lesser extent, beam circumferences, were the primary contributors to the increased GBC scores of fork-antlered yearlings at 4.5 years. Adult deer allocated resources similarly (i.e., no differences in the shape of the relationships between tine length or beam circumference and measurement position illustrated in Figs. 4 - 5), but fork-antlered yearlings apparently committed more total resources to bone growth throughout antler development (i.e., at each successive measurement position).
In the only other published study of antler and body mass characteristics of spike- and fork-antlered yearling white-tailed deer conducted on a captive herd (other than the Kerr herd), Schultz and Johnson (1992) demonstrated that spike-antlered yearlings had smaller antler mass than fork-antlered yearlings at 1.5, 2.5, and 3.5 years of age. Differences in antler mass diminished in their Louisiana deer herd at 4.5 years of age, however, and no difference in body mass at 1.5 years of age was detected (the only year for which we can directly compare data). Because sample sizes decreased from age-classes 1.5 to 4.5 throughout Schultz and Johnson‘s study (N decreased from 20 to 6 and from 53 to 13 for spike- and fork-antlered yearlings, respectively), and because criteria for selecting the subset of individuals that continued in the study are not given, the extent to which results at age-class 4.5 years are unbiased in this study cannot be assessed.
MANAGEMENT IMPLICATIONS
Our analyses show clear differences between the size of antlers and body mass of adult white-tailed bucks that were spike- or fork-antlered as yearlings in our control herd. If the results of penned studies are applicable to free-ranging or managed populations, then the distinction between these classes of yearlings could be of value to those wishing
11 - D

to improve the average GBC scores of mature bucks. Improvement of GBC scores within a herd could be accomplished by selectively culling spike yearling bucks. This technique would increase mean antler quality at maturity within a cohort of bucks simply by reducing the number of small-antlered bucks contributing to the population mean (Armstrong et al. 1995). Improvement would be realized within the population, at the expense of cohort size, regardless of the genetic basis of antler traits.
Most management, however, is directed at habitat improvement and/or long-term (genetic) improvement of herd performance. Both habitat improvement and genetic improvement seek to reduce the incidence of spike-antlered yearlings. For selective culling of spikes to produce long-term genetic improvement, not only must the expression of antler traits at the yearling stage reliably predict antler traits at maturity (as we have shown) but antler traits must exhibit heritable variation (Armstrong et al. 1995). Williams et al. (1994) demonstrated intermediate to high heritability in yearling Texas white-tailed bucks for number of points, main beam length, inside spread, basal circumference, and antler mass. Our results, in conjunction with those of Williams et al. (1994), imply that for Texas white-tailed deer, the average value of antler traits at maturity, or a measure that summarizes a suite of antler traits (e.g., GBC score), could be increased between generations in managed populations by selective culling of small-antlered bucks. This implication follows directly from a basic tenet of selection theory,namely that the response of a trait to selection is a product of the intensity of selection and the heritability of the trait (Falconer 1989). We concur with Scribner et al. (1984 ), Harmel et al. (1989), Schultz and Johnson (1992), and Armstrong et al. (1995) that selective culling of spikes could be considered as a component of management for improved average antler development of a herd. We note, however, that Lukefahr and Jacobson (In press) found low heritability values for incidence of spikes vs. forks, number of points, maximum inside spread, total antler weight, and main beam length in yearling males in a captive Mississippi deer herd and hence discouraged the use of antler records from yearling males as criteria for selective harvest when genetic improvement is a goal.
Results of our 3-group analysis demonstrated large differences among spike, 3-5 point, and 6 point yearling bucks and suggest that for maximum antler expression, the decision of which yearling bucks to protect or remove from managed herds is not as simple as the convenient classification system —spike- or fork-antlered“ would suggest. White-tailed deer managers and hunters must recognize that antler and body weight are correlated, continuously distributed traits whose expression at maturity may be correlated with their expression at the yearling stage. As indicated by basic selection theory (Lerner 1950) and discussed by Williams and Harmel (1984), management strategies that favor the removal of all but the largest-antlered yearling bucks (under the appropriate conditions) will lead to the greatest gain in mean herd performance. The short-term cost of improvement in antler quality is fewer harvestable animals at maturity. Obviously within different herds (and even the same herd in different years), the subset of the yearling population to be culled will differ, but in each population —top-end“ yearling bucks should be identified and preserved, if the long-term management goal is to improve antler quality.
12 - D

Understanding the comparative performance of spike- and fork-antlered yearling white-tailed deer at maturity in free-ranging populations has suffered from an abundance of conflicting opinions (Brothers and Ray 1975, Kroll 1991, Armstrong et al. 1995) combined with a lack of published data. No comparative longitudinal studies of antler characteristics and body mass of spike- and fork-antlered yearling white-tailed deer have been conducted in free-ranging populations. Thus, the relative performance of spike- and fork-antlered yearlings at maturity in natural populations remains virtually unknown and can only be inferred from the few and conflicting published studies of penned deer. Our results extend the findings of earlier studies of pen-raised Texas deer, and make it clear that for Texas white-tailed deer raised on a high-quality diet, spike-antlered yearlings are smaller than fork-antlered yearlings at maturity in both antler size and body mass.
LITERATURE CITED Armstrong B., D. Harmel, B. Young, and F. Harwell. 1995. The management of spike bucks in a white-tailed deer population. Texas Parks and Wildlife Department PWD LF W7100-247. 2pp. Boone and Crockett. 1982. Official measurer�s manual. Boone and Crockett Club, Alexandria, Va. 176pp Brothers, A. and M. E. Ray, Jr. 1982. Producing quality whitetails. Caesar Kleberg Wildl. Res. Inst., Kingsville, Tex. 247pp. Causey, M. K. 1990. Fawning date and growth of male Alabama white-tailed deer. Proc. Annu. Conf. Southeast. Assoc. Fish and Wildl. Agencies 44:337-341. Falconer, D. S. 1989. Introduction to quantitative genetics. John Wiley & Sons, Inc. New York, N.Y. 438pp. French, C. E., L. C. McEwen, N. D. Magruder, R. H. Ingram, and R. W. Swift. 1956. Nutrient requirements for growth and antler development in the white-tailed deer. J. Wildl. Manage. 20:221-232. Harmel, D.E. 1983. Effects of genetics on antler quality and body size in white-tailed deer. Pages 339-347 in R.D. Brown, ed. Antler development in Cervidae. Caesar Kleberg Wildl. Res. Inst., Kingsville, Tex. ______, J. D. Williams, and W. E. Armstrong. 1989. Effects of genetics and nutrition on antler development and body size of white-tailed deer. Final Rep., Tex. Parks and Wildl. Dep., Hunt, Tex. 55pp. Jacobson, H. A. and K.White. 1985. Selective harvest of yearling bucks as a trophy management strategy. Abstr. Annu. Meet. Southeast Deer Study Group 8: 24. Knox, W. M., M. O. Bara, and K. V. Miller. 1991. Effect of fawning date on physical development in yearling male white-tailed deer. Proc. Annu. Conf. Southeast. Assoc. Fish and Wildl. Agencies 45:30-46. Kroll, J. C. 1991. A practical guide to producing and harvesting white-tailed deer. Stephen F. Austin State Univ., Nacogdoches, Tex. 590pp. Lerner, I. M. 1950. Population genetics and animal improvement. Cambridge Univ. Press, Cambridge, Mass. Lukefahr S. D. and H. A. Jacobson. Variance component analysis and heritability of antler traits in white-tailed deer. J. Wildl. Manage. In Press.
13 - D

Moen, A. N. 1978. Wildlife ecology, an analytical approach. W. H. Freeman and Co., San Francisco, Calif. 458pp. Sauer, P. R. 1984. Physical characteristics. Pages 73-90 in L.K. Halls, ed. White-tailed-deer: ecology and management. Stackpole Books, Harrisburg, Pa. Schultz, S. R. and M. K. Johnson. 1992. Antler-development of captive Louisiana white-tailed bucks. Proc. Annu. Conf. Southeast. Assoc. Fish and Wildl. Agencies 46:67-74. Scribner, K. T. and M. H. Smith. 1990. Genetic variability and antler development. Pages 460-476 in G. A. Bubenik, and A. B. Bubenik, eds. Horns, pronghorns, and antlers. Springer, New York. _______, _______, and P. E. Johns. 1984. Age, condition, and genetic effects on incidence of spike bucks. Proc. Annu. Conf. Southeast. Assoc. Fish and Wildl. Agencies 38:23-32. _______, _______, and _______. 1989. Environmental and genetic components of antler growth in white-tailed deer. J. Mammal. 70:284-291. Severinghaus, C. W. and A. N. Moen. 1983. Prediction of weight and reproductive rates of a white-tailed deer population from records of antler beam diameter among yearling males. N. Y. Fish Game J. 30:30-38. Shea, S. M., T. A. Breault, and M. L. Richardson. 1992a. Relationship of herd density and physical condition of white-tailed deer in Florida. J. Wildl. Manage. 56:262-267. _______, _______, and _______. 1992b. Relationship of birth date and physical development of yearling white-tailed deer in Florida. Proc. Annu. Conf. Southeast. Assoc. Fish and Wildl. Agencies 46:159-166. Smith, M. H., R. K. Chesser, E. G. Cothran, and P. E. Johns. 1983. Genetic variability and antler growth in a natural population of white-tailed deer. Pages 365-388 in R. D. Brown, ed. Antler development in Cervidae. Caesar Kleberg Wildl. Res. Inst., Kingsville, Tex. Teer J. G., J. W. Thomas, and E. A. Walker. 1965. Ecology and management of white-tailed deer in the Llano Basin of Texas. Wildl. Monogr. 15. 1-62. Ullrey, D. 1983. Nutrition and antler development in white-tailed deer. Pages 49-59 in R. D. Brown, ed. Antler development in Cervidae. Caesar Kleberg Wildl. Res. Inst., Kingsville, Tex. Verme, L. J. and D. E. Ullrey. 1972. Feeding and nutrition of deer. Pages 275-291 in D. C. Church, ed. The digestive physiology and nutrition of ruminants. Vol. 3: Practical Nutrition. Corvallis, Ore. Williams, J. D. and D. E. Harmel. 1984. Selection for antler points and body weight in white-tailed deer. Proc. Annu. Conf. Southeast. Assoc. Fish and Wildl. Agencies 38:43-50. _______, _______, W. E. Armstrong, and S. E. Wardroup. 1983. Antler development in the white-tailed deer. Page 468 in R. D. Brown, ed. Antler development in Cervidae. Caesar Klegberg Wildl. Res. Inst., Kingsville, Tex. 480pp _______, W. F. Krueger, and D. E. Harmel. 1994. Heritabilities for antler characteristics and body weight in yearling white-tailed deer. Heredity 73:78-83.
14 - D

Appendix E œ Updated Frequency Tables from —Effects of Genetics and Nutrition on Antler Development and Body Size of White-tailed Deer“.
Frequency distribution of antler points for 228 white-tailed deer at 1.5 and 2.5 years of age
There were 3 deer that were spikes at 1.5 years and they had 3 points at 2.5 years
Antler points at 2.5 year
Antler point distribution at 1.5 years of age
Figure E-1. Frequency distribution of total antler points for 228 white-tailed deer at 1.5 and 2.5 years of age.
1 - E

Frequency distribution of antler points for 152 white-tailed deer at 1.5 and 3.5 years of age
Antler point distribution at 1.5 years of age
Antler points at 3.5 year
Figure E-2. Frequency distribution of total antler points for 105 white-tailed deer at 1.5 and 3.5 years of age
2 - E

Apay
Figwh
Figuwhi
Frequency distribution of antler points for 105 white-tailed deer at 1.5 and 4.5 years of age
Antler point distribution at 1.5 years of age
Antler points at 4.5 year
re E-3. Frequency distribution of total antler points for 105te-tailed deer at 1.5 and 4.5 years of age.
Frequency distribution of antler points for 151 white-tailed deer at 2.5 and 3.5 years of age
Antler point distribution at 2.5 years of age
ntler oints t 3.5 ear
ure E-4. Frequency distribution of total antler points for 105 ite-tailed deer at 2.5 and 3.5 years of age.
3 - E

Frequency distribution of antler points for 105 white-tailed deer at 2.5 and 4.5 years of age
Antler point distribution at 2.5 years of age
Antler points at 4.5 year
Figure E-5. Frequency distribution of total antler points for 105 white-tailed deer at 2.5 and 4.5 years of age.
Frequency distribution of antler points for 105 white-tailed deer at 3.5 and 4.5 years of age
Antler point distribution at 3.5 years of age
Antler points at 4.5 year
Figure E-6. Frequency distribution of total antler points for 105 white-tailed deer at 3.5 and 4.5 years of age.
4 - E

Frequency distributionof antler weight for 105 white-tailed deer at 1.5 and 4.5 years of age
Antler point distribution at 1.5 years of age
Figure E-7. Frequency distribution of total antler points for 105 white-tailed deer at 1.5 and 4.5rs of age.
Frequency distribution of antler weight for 104 white-tailed deer at 1.5 and 4.5 years of age
Antler point distribution at 1.5 years of age
Figure E-8. Frequency distribution of total antler weight at 4.5 years vs total antler points at 1.5 years for 104 white-tailed deer.
5 - E
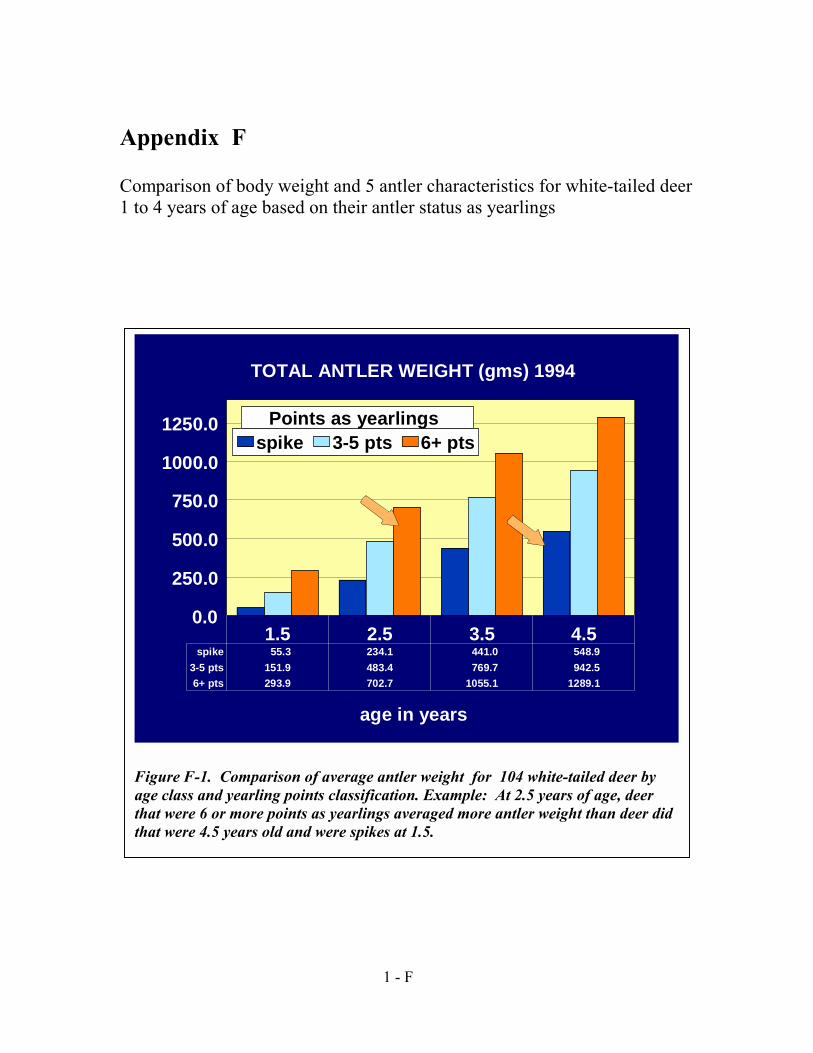
Appendix F
Comparison of body weight and 5 antler characteristics for white-tailed deer 1 to 4 years of age based on their antler status as yearlings
TOTAL ANTLER WEIGHT (gms) 1994
age in years
1.5 2.5 3.5 4.5 0.0
250.0
500.0
750.0
1000.0
1250.0 spike 3-5 pts 6+ pts
spike 55.3 234.1 441.0 548.9 3-5 pts 151.9 483.4 769.7 942.5 6+ pts 293.9 702.7 1055.1 1289.1
Points as yearlings
Figure F-1. Comparison of average antler weight for 104 white-tailed deer by age class and yearling points classification. Example: At 2.5 years of age, deer that were 6 or more points as yearlings averaged more antler weight than deer did that were 4.5 years old and were spikes at 1.5.
1 - F

B AS AL C IR C U M FER EN C E (m m ) 1994
ag e in years
1 .5 2 .5 3.5 4 .5 0
25
50
75
100
125
spike 3-5 p ts 6+ p ts
spike 47.2 67.9 81.4 86.2 3-5 pts 63.9 80.7 93.2 101 6+ pts 72.7 87.8 99.7 106.9
P o ints as yearlin gs
Figure F-2. Comparison of average basal circumference for 104 white-tailed deer by age class and yearling points classification. Example: At 2.5 years of age, deer that were 6 or more points as yearlings had slightly more basal circumference than deer did that were 4.5 years old and were spikes at 1.5.
TOTAL ANTLER POINTS - 1994
age in years
1.5 2.5 3.5 4.5 0 1 2 3 4 5 6 7 8 9
10 11 12
spike 3-5 pts 6+ pts
spike 2 4.8 5.8 6.4 3-5 pts 4.4 7.5 8 9 6+ pts 7.2 8.3 9.3 10.1
Points as yearlings
Figure F-3. Comparison of average total antler points for 104 white-tailed deer by age class and yearling points classification. Example: At 2.5 years of age, deer that were 6 or more points as yearlings averaged more antler points than deer did that were 4.5 years old and were spikes at 1.5.
2 - F

MAIN BEAM LENGTH (mm) 1994
age in years
1.5 2.5 3.5 4.5 100.0
200.0
300.0
400.0
500.0
600.0
spike 3-5 pts 6+ pts
spike 120.5 275.2 361.9 395.8 3-5 pts 277.0 359.0 427.4 464.1 6+ pts 292.8 415.3 483.3 514.8
Points as yearlings
Figure F-4. Comparison of average main beam length for 104 white-tailed deer by age class and yearling points classification. Example: At 2.5 years of age, deer that were 6 or more points as yearlings averaged greater main beam length than deer did that were 4.5 years old and were spikes at 1.5.
1.5 2.5 3.5 4.5 100 150 200 250 300 350 400 450 500
spike 3-5 pts 6+ pts
MAIN BEAM SPREAD (mm) 1994
age in years
Points as yearlings
Figure F-5. Comparison of average antler spread for 104 white-tailed deer by age class and yearling points classification. Example: At 2.5 years of age, deer that were 6 or more points as yearlings averaged more antler spread than deer did that were 4.5 years old and were spikes at 1.5.
3 - F

LIVE BODY WEIGHT (lbs) 1994
age in years 1.5 2.5 3.5 4.5
50
75
100
125
150
175
200 spike 3-5 pts 6+ pts
Figure F-6. Comparison of average live body weight for 104 white-tailed deer by age class and yearling points classification. Example: At 2.5 years of age, deer that were 6 or more points as yearlings averaged heavier body weight than deer did that were 4.5 years old and were spikes at 1.5.
4 - F

Appendix G —Environmental/Genetic Interaction in White-tailed Deer“- Trends in antler characteristics and body weights for 1992 œ 1999 born deer reared to yearling status. All yearling deer reared on an 8% protein diet.
Genetics/Environmental Interaction Study
0 20 40 60 80
100
120
1992 1993 1994 1995 1996 1997 1998 1999 Birth Year
Perc
ent
Forked Spike
Figure G-1 Trends in percent of fork vs. spike antlered yearlings for 217 deer in the —Genetic/Environmental Interactions in White-tailed Deer“ study. All deer reared on an 8% protein diet.
G en etic / E n viro n m en ta l In te ractio n S tu d y 350
Av erage Antle r W e ight -300 Y e arling d eer
250
200
150
n= 31
n= 21
n= 33
n= 29
Ant
ler w
t. gr
ams
n= 31100
50
0
n= 25
n= 18 n=
26
92 93 94 95 96 97 98 99 B irth Y ear
Figure G-2. Trend in average yearly antler weights. Sample size —n=“ is listed for each year. There were a total of 214 yearling males used in the antler weight analysis. Kerr Wildlife Management Area.
1 -H

Genetic/ Environmental Interaction Study 330
Leng
th (m
m)
310 290 270 250 230 210 190 170 150
92 93 94 95 96 97 98 99
Birth Year
Average M ain Beam Length -Yearling Antlers
n= 27
n= 18
n= 26
n= 31
n= 31
n= 21
n= 33
n= 29
Figure G-3. Trend in average yearly main beam lengths. Sample size —n=“ is listed for each year. There were a total of 216 yearling males used in this analysis. Kerr Wildlife Management Area.
FigurThereMana
Genetic/ Environmental Interaction Study 8
Poin
ts
7
6
5
4
3
2
1
0 92 93 94 95 96 97 98 99
Birth Year
Average Points -Yearling Deer
n= 27
n= 18 n=
26
n= 31
n= 31
n= 21
n= 33
n= 29
e G-4. Trend in average yearly points. Sample size —n=“ is listed for each year. were a total of 216 yearling males used in this analysis. Kerr Wildlife gement Area.
2 -H

FigureThere Manag
Figureyear. TManag
Genetic/ Environmental Interaction Study
100
120
140
160
180
200
220
240
260
280
Spre
ad (m
m)
Average Spread -Yearling Deer
n= 27 n=
16 n= 26
n= 31
n= 31
n= 21
n= 33
n= 29
92 93 94 95 96 97 98 99 Birth Year
G-5. Trend in average yearly spreads. Sample size —n=“ is listed for each year. were a total of 214 yearling males used in the spread analysis. Kerr Wildlife ement Area.
G e n e tic / E n viro n m e n ta l In te ra c tio n S tu d y
60
70
80
90
100
110
120
130
140
Bod
y w
eigh
t (lb
s).
Av e ra g e B o d y W e ig h t -Y e a rlin g D e e r
n= 24
n= 18 n=
26
n= 32
n= 31
n= 21
n= 33
n= 29
92 93 94 95 96 97 98 99 B irth Y ear
G-6. Trend in average yearly body weights. Sample size —n=“ is listed for each here were a total of 214 yearling males used in this analysis. Kerr Wildlife ement Area.
3 -H

Genetic/ Environmental Interaction Study 70
Average Basal Circumference -Yearling Deer
65
60
55 n= 31
n= 21
n= 33
n= 29
Bas
al C
ir. (m
m)
n= 31
50
45
40
35
30
n= 27
n= 18 n=
26
92 93 94 95 96 97 98 99
Birth Year
Figure G-7. Trend in yearly average basal circumference. Sample size —n=“ is listed for each year. There were a total of 216 yearling males used in this analysis.. Kerr Wildlife Management Area.
0
20
40
60
80
100
120
92 93 94 95 96 97 98 99 Ye a r
Perc
ent
Gen etic/ En viron men tal In teraction Stu dy
Trends in 2-5 point yearlings Trends in 6+ point yearlings
Figure G-8. Trends in yearly point production. Through the selection process of the Genetic/ Environmental Interaction study, the number of 5 points or less yearlings decreased, and the number of 6 or more points increased.
4 -H

Yearstudy
YearEnvi
Genetic / Environment Study Total Deer
Birth year Spike 3-5 pts 6-7 pts 8 or > Total
92 9 7 10 1 27
93 6 5 6 1 18
94 8 13 4 1 26
95 3 13 15 1 32
96 1 6 15 9 31
97 0 3 9 9 21
98 0 7 14 12 33
99 1 0 14 14 29
ly totals of yearling deer produced in the Genetic/ Environmental Interaction based on yearling point classification.
Genetic / Environment Study Average Body Weight
Birth year Spike 3-5 pts 6-7 pts 8 or> Total
92 86 87 85 117 27
93 88 98 108 113 18
94 80 95 104 101 26
95 100 109 116 115 32
96 97 112 118 116 31
97 0 96 113 127 21
98 0 112 121 130 33
99 108 0 125 139 29
Non Selected Sires
Selected Sires
ly average body weights of yearling deer produced in the Genetic/ ronmental Interaction study based on yearling point classification.
5 -H

Genetic / Environment Study Average Antler Weight
Birth year Spike 3-5 pts 6-7 pts 8 or> Total
92 24 79 151 384 27
93 37 79 179 228 18
94 38 97 185 266 26
95 79 86 177 378 32
96 60 127 201 271 31
97 0 103 211 314 21
98 0 145 232 343 33
99 36 0 252 419 29
Non Selected Sires
Selected Sires
Yearly average antler weights of yearling deer produced in the Genetic/ Environmental Interaction study based on yearling point classification.
6 -H

Appendix H œ —What Causes Mature Bucks to not have Browtines?“ œ Kathy McGinty
Many of us have undoubtedly seen or harvested a mature buck without browtines. If you happen to be one of those that have you have probably asked yourself why these bucks don‘t have browtines? This is a question that is often asked and debated around deer camps and coffee shops. It is often difficult to convince paying hunters to harvest one of these bucks without browtines because most of them have less than 8 points. As a result, these bucks are often left year after year to breed because no one wanted to waste a tag on such an animal. Recently, several biologists with Texas Parks and Wildlife Department along with myself went back through 1,815 sets of antlers collected from 1974 to 1998. We looked specifically at the browtine status of bucks at different ages and at the browtine status of each individual buck throughout its lifetime. First, we looked at all deer within the same age groone browtine and those live body weight of bucbucks with one browtine
Antler weight (mquality. Basically, the hwithout browtines had hbucks with both browtinbrowtines. Antler pointfewest points and bucksone browtine being in bone browtine averaged 41.5 years of age. Antlerwith bucks without browbucks with both browtin
ups to compare those bucks without browtines to those with only with both browtines. At 1.5 years of age (Yearling status) the ks without browtines were on average 12 pounds lighter than and 20 pounds lighter than bucks with both browtines.
Body Weight
set 1 set 2 set 3 set 4
AGE
50
100
150
200
Bod
y W
eigh
t (lb
s.)
spike >2 no bt >2 1 bt >2 2 bt
ass) is undeniably one of the best measures of overall antler eavier the set of antlers the larger the antlers. Yearlings bucks alf the antler mass than bucks with only one browtine. Yearling es had three times the antler mass of yearling bucks without s showed the same trend with bucks without browtines having the with both browtines having the most points and bucks with only etween the two. Bucks without averaged 2.5 points, bucks with .8 points and bucks with both browtines averaged 6.6 points at
spread and Main beam length averages followed the same trend tines being the smallest antlered bucks in the group and the es having the largest antlers.
1 -H

By the time bucks reached 4.5 years of age the difference between bucks without, with only one, and with both browtines was just as evident. Bucks with both browtines out weighted bucks without browtines by an average of 25 pounds, had an average antler weight doubled that of bucks without browtines and averaged 4 more points. The second thing we looked at was browtine status of bucks at 3.5 years of age every set of antlers that th90% had both browtines, we look at bucks withoutinteresting. Ninety-two percent of all bucks without browtines at 3.5 years of age were Spike Bucks at 1.5 year of age (as Yearlings). The other 8% without browtines were 3 point bucks. Every buck without browtines at 3.5 years of age were yearlings with 3 points or less. Of the deer with only one browtine at 3.5 years of age 56% of them were also Spike Bucks as yearlings, 22% were 3 pointers and 22% were 4 pointers. Seventy-five percent of the deer with
Antler Points 12
spike >2 no bt >2 1 bt >2 2 bt 10
Ant
ler P
oint
s 8
6
4
2
0
when we had the first three sets of antlers. Meaning we had e buck had ever produced up to 3.5 years of age. Of these deer, 4% had only one browtine and 6% had no browtines. Now, if browtines at 3.5 years of age we find something very
set 1 set 2 set 3 set 4
AGE
Main Beam Length600
Mai
n B
eam
Len
gth
(mm
)
500
400
300
200
100
spike >2 no bt >2 1 bt >2 2 bt
set 1 set 2 set 3 set 4
AGE
2 -H

both browtines at 3.5 years of age had 4 points or more as yearlings. Every buck with 5 or more points as yearlings had both browtines at 3.5 years of age.
Based on just points you could predict which deer would have both browtines at 3.5 and 4.5 years of age just by looking at their yearling set of antlers. Every buck with 5 or more points at 1.5 years of age had both browtines later in life. Meaning bucks with 5 or more points, as yearlings are your future trophies. They are also your future breeders that can pass their genetic traits on to future generations.
Every buck without browtines at 3.5 years of age also had no browtines as yearlings. If a buck had only one browtine at 3.5 years of age 89% were without browtines as yearlings and 11% had only one browtine as yearlings. Bucks with both browtines at 3.5 years of age had 47% with both browtines as yearlings, 14% with only one and 39% without browtines as yearlings. Every buck with both browtines at 1.5 years of age had both browtines at 3.5 years of age.
Live body weight comparisons between bucks without, with only one and with both browtines shows a 20 pound difference between those without and those with both at 1.5 years of age. Bucks with both browtines at 3.5 years of age averaged 7 points as yearlings where bucks without at 3.5 years of age averaged less than 3 points. Bucks with both browtines at 3.5 years of age averaged 3 times the antler weight than bucks without at 3.5 years of age.
The Boone & Crockett scoring system is the most widely accepted system for evaluating the quality of antlers. All antlers critiqued were scored, to obtain Gross B&C scores for all deer. Bucks with both browtines at 3.5 years of age averaged around 68 gross B&C score, while bucks without averaged around 35 gross B&C score. These same deer showed the same upward trend in increased body weight, more antler points, heavier antler weights and higher gross B&C scores as browtine numbers increased from none to both at ages 2.5 and 3.5 years of age.
We also looked at all deer where we had the first 4 sets of antlers. At 4.5 years of age 89% of bucks had both browtines, 6% had only one browtine and 5% had no browtines. Live body weights and antler weight showed about the same upward trend between bucks without browtines and bucks with both browtines as the 3.5-year-old bucks. Bucks without browtines averaged less than 7 points at 4.5 years of age while bucks with both browtines averaged over 10 points. The gross B&C score showed a dramatic increase from bucks without browtines to bucks with both browtines. Bucks without browtines averaged a B&C score of 92 inches, while bucks with both browtines averaged a B&C score of over 140 inches. Yes! That‘s 48 inches more antlers, or 4 feet more antlers produced at 4.5 years of age.
So I‘ll ask which buck would most hunters rather harvest? The 140 class buck or the 90 class buck? No contest! Well the problem is that these bucks without browtines which average 25 pounds lighter, average less than 7 points, have half the antler mass and have on average 4 feet less antlers don‘t get harvested. Why don‘t they get harvested? Well I mentioned it earlier, no one wants to waste a tag or waste their only buck they can harvest on a lease on a sorry, inferior buck. These bucks stay out there breeding year after year because the better quality bucks are being harvested (those with both browtines). The genetic make up which produced these sorry bucks is passed from one generation to another year after year after year.
3 -H

Something to remember is that 89 to 90% of the bucks without browtines at 3.5 and 4.5 years of age were Spikes as yearlings. All deer with only one browtine at 4.5 years of age had 4 points or less. All bucks with 5 or more points as yearlings had both browtines at 3.5 and 4.5 years of age. All bucks without browtines at 4.5 years of age were also without at 1.5 years of age. All yearling bucks that had both browtines had both browtines at 3.5 and 4.5 years of age.
As you can see, you can tell what a buck will probably turn out to be at 3.5 and 4.5 years of age by looking at what he is at 1.5 years of age. It is logical to cull the least desirable bucks from the herd as quickly as possible. That is at 1.5 years of age before they have a change to breed and pass on their inferior genetics. Not all spikes were without browtines at 3.5 and 4.5 years of age and a few have on occasion turned out to be descent bucks. However, remember I have talked about averaged and not the few exceptions. Good quality management should strive to produce the highest number of good animals, not to produce one or two good animals while producing a whole lot of sorry, poor quality animals.
I‘ve heard arguments that waiting to cull deer at 2.5 years of age or older is the best way to cull so you can see what they develop into. The problem with trying to cull after 1.5 years of age is a good 8 or 10 point yearling is often as big or bigger in body size with better antlers than many 2.5 or older bucks that were spikes as a yearlings. Most people would have an extremely hard time telling the difference between a really good yearling buck and a 2.5-year-old or older deer with small antlers and body size. This makes culling later almost impossible for most of us, which is all the more reason to go ahead and cull as early as possible, at 1.5 years of age.
Some landowners and hunters alike often argue that by killing spikes they will kill all yearling bucks. In Texas, this is not a problem because according to 20 years of harvest data collected by Texas Parks and Wildlife Department outside of South Texas on over 37,000 harvested bucks only 26% of the yearling bucks harvested were spikes while 74% of the yearlings harvested were fork-antlered. By harvesting spikes you still have 74% of your yearling bucks remaining and I might add, better quality bucks that will produce better quality bucks at 3.5 and 4.5 years of age. By harvesting Spike bucks and 3 pointers at 1.5 years of age you can eliminate the problem of mature bucks that do not produce browtines. Every mature buck without browtines were spikes or 3 pointers at 1.5 years of age. By getting them out of the gene pool as quick as possible you can eliminate mature bucks without browtines.
4 -H

PWD RP W7000-0827 (05/02)