understanding the banking sector - s3-eu-central-1...
TRANSCRIPT

FSD KenyaFinancial Sector Deepening
UNDERSTANDING THE BANKING SECTORSTRENGTHENING INFORMATION AND ANALYSIS IN KENYA
DECEMBER 2008

FSD KenyaFinancial Sector Deepening
The Kenya Financial Sector Deepening (FSD) programme was established in early 2005 to support the development of financial markets in Kenya as a means to stimulate wealth creation and reduce poverty. Working in partnership with the financial services industry, the programme’s goal is to expand access to financial services among lower income households and smaller enterprises. It operates as an independent trust under the supervision of professional trustees, KPMG Kenya, with policy guidance from a Programme Investment Committee (PIC). In addition to the Government of Kenya, funders include the UK’s Department for International Development (DFID), the World Bank, the Swedish International Development Agency (SIDA) and Agence Française de Développement (AFD).
This report was prepared for FSD Kenya’s FinAccess programme by: Alan Roe and Steve Peachey from
This report was commissioned by FSD Kenya. The findings, interpretations and conclusions are those of the authors and do not necessarily represent those of FSD Kenya, it’s Trustees and partner development agencies.
PM
Oxford Policy Management

UNDERSTANDING THE BANKING SECTOR – STRENGTHENING INFORMATION & ANALYSIS IN KENYA • i
Table of Contents
Abbreviations iiIntroduction: Executive summary iiiOverview of report structure iv
Chapter 1 Why Do We neeD gooD banKing inFormaTion? 1
Chapter 2 The banKing inFormaTion inDuSTry in Kenya 32.1 Data production 3 2.2 Data analysis and processing 4 2.3 Data dissemination 5
Chapter 3 a CriTiCal revieW oF The preSenT Supply oF 6 inFormaTion3.1 Official supply - current volume and quality 6 3.2 Official supply - issues going forward 7 3.3 Private supply - volume and quality 8 3.4 Are there any obvious unmet demands? 9
Chapter 4 iDeaS For improveD analyTiCal WorK in banKing 114.1 Introduction 11 4.2 Analysis that would be possible with data already in the 11 public domain 4.3 Potential uses of data that could easily be put into the 12 public domain 4.4 Potential uses of official data that could also safely be 13 made public
Chapter 5ConCluSionS anD iniTial reCommenDaTionS 145.1 Main conclusions 145.2 Recommendations 14
annexes1. List of persons consulted 172. The current disclosure forms of the CBK for audited accounts 183. List of tariffs and charges on current accounts 214. Examples of commercial bank profiles contained in the 22 Metropol Annual review 5. Sample disclosures from Estonian and Bulgarian Central Bank 23 websites 6. Sample charts based on data in or close to the public domain 25

ii • UNDERSTANDING THE BANKING SECTOR – STRENGTHENING INFORMATION & ANALYSIS IN KENYA
Abbreviations
apr Annual Percentage RateaTm Automatic Teller MachinebSD Bank Supervision DepartmentCbK Central Bank of KenyaFSD Financial Sector Deepening TrustgCr Global Capital Ratingsiea Institute of Economic AffairsimF International Monetary Fundipar Institute of Policy Analysis and ResearchKba Kenya Bankers AssociationKSh Kenya ShillingsKippra Kenya Institute for Public Policy Research and AnalysisKnbS Kenya National Bureau of StatisticsmFi Micro Finance Institution(s)mi Market IntelligencenbFi Non-Bank Financial Institutionnpl Non Performing Loanopm Oxford Policy Managementp & l Profit and Loss Account rD Research DepartmentSaCCo Savings and Credit Cooperative Organisation

UNDERSTANDING THE BANKING SECTOR – STRENGTHENING INFORMATION & ANALYSIS IN KENYA • iii
level of pro-active interest from the academic research community in Kenya (the latter we believe may well be a consequence of the former). Aggregate data is readily available from the Central Bank of Kenya and individual bank disclosure requirements are well publicised in the press (and in some cases on the internet). This is, however, mostly in paper format and not easily collated electronically. This is especially true of tariff data.
Where efforts are made to make available the collated data, the press will publicise the findings as was demonstrated by the example of the recent joint CBK/FSD initiative on bank charges for loans and money transmission accounts. There are also two good quality private publications aimed at different parts of the industry that collate public disclosure data. However, the cost of these appears to preclude wider dissemination among either the academic community or through press take-up of the issues raised. One obvious route for the improved publication of collated bank-by-bank data in common electronic formats – the Kenya Bankers Association – does not offer this facility and has no plans to do so in the near future. Therefore the main recommendations of the report focus on how the data might be made more readily available to more users and how these data might be better used:
CBK should consider the electronic publication of the data that banks are �presently required to publish quarterly in the newspapers.
Moves should continue towards developing a system of annual �percentage rates (APRs) that allow consumers to identify and compare the true cost of loans and related services. Equivalent moves should also be made for deposit charges.
While there is no need for any significant increase in the amount of �public disclosure by banks, moves should be made for more data sharing between banks to improve the industry’s own understanding of its performance.
A community of researchers needs to be created that is interested in �banking questions. This could be led by the existing CBK Research Department and offered a supportive framework for its work.
As part of the wider strategy for economic and banking sector �development the authorities should develop a Banking Information Strategy that highlights under-researched areas and encourages much more local input (beyond the CBK) to address these gaps.
Moves should continue to encourage press interest in the issues of �banking sector performance; especially regarding service level efficiency and charging but also through a more forensic style of journalism that does much more than accept data and announcements from the industry itself.
The objective of this report is to review existing sources of detailed data and analysis about the banking sector in Kenya, assess the demand for and uses of these and make pragmatic recommendations about how any unmet demand could be met.
The overall conclusion of this report is that generally the base data in Kenya is strong and that it can support a wide range of analysis. However, the manner in which these data are made available at present fails to encourage widespread use.
By any developing economy standards the public disclosure requirement on banks is already good in Kenya. There are examples of countries that go further but these are generally at much higher levels of development than is the case in Kenya. The disclosure requirement in Kenya not only puts audited annual financial statements clearly into the public domain but augments these with mandatory disclosure of key regulatory indicators (capital adequacy, liquidity, loan performance and provisioning, etc) and a comparable quarterly set of releases covering the balance sheet, profit and loss and the same regulatory indicators. In addition to all this a current tariff of fees and charges must be made publicly available on a regular basis.
The report describes the available data in some detail. It then goes on to describe, and give illustrations in an annex, of how such data can be used to produce various types of analysis about how well the Kenyan banking system is performing both as an industry and to support wider economic development. The report does suggest a very modest incremental expansion of the amount of data released but this is not the major thrust of its recommendations. Broadening out the disclosure standard to include two bits of information already on the fringes of the public domain – employee numbers and branch numbers/locations – would allow analysts to cover better the debate about the supply of accessible finance in Kenya. Further improvements in the quality of debate would come from Kenyan banks publishing two reports they already produce for the Central Bank of Kenya, namely data on deposit accounts and loan numbers and the mix of lending (ideally by instrument and maturity but definitely by economic sector).
The banking industry should have nothing to fear from these proposed minor extensions to the disclosure requirement as they will as often as not portray the industry in a better light and show better some of the successes in expanding access that have been evident since early on in this decade. In general the more transparent the industry, the better the quality of debate about its functioning. The only topic that is likely to put the industry under pressure is data on the costs of its various services and the information to address that is already in the public domain.
If the base data for analysis is good and needs little augmentation, what then are the obstacles to its better use? The report concludes these are mostly to do with (i) the way that the data enter the public domain and (ii) the relatively low
EXECUTIVE SUMMARY

iv • UNDERSTANDING THE BANKING SECTOR – STRENGTHENING INFORMATION & ANALYSIS IN KENYA

UNDERSTANDING THE BANKING SECTOR – STRENGTHENING INFORMATION & ANALYSIS IN KENYA • 1
Market information about the suppliers of financial services is a vital part of an efficient banking market. Transparent and regular information (such as who the banks are, who owns them, how they operate, how much they charge, how strong or weak their finances are) are all hard facts that can help customers to make informed decisions about where to deposit their funds and from whom to seek credit and other financial services.
This paper is not intended to provide a comprehensive essay on the various component aspects of this important proposition. But it is helpful in setting the stage for the substance of the report to refer to six main reasons why information collection and dissemination should be a high priority for policy-makers in Kenya and more generally.
benchmarking performance.1. Regular and reliable balance sheet and profit and loss data on individual banks is an essential element to inform the industry itself about the evolving standards of performance achieved by different players in the sector. It thereby provides one way in which any one bank can benchmark itself against the industry in general or against major competitor banks in particular. This benchmarking may relate to the market shares for particular banking products, to earnings performance, to capital adequacy, to cost parameters, and above all to charges. Such benchmarking provides an essential raw material that can oil the competitive process and so help to stimulate banking sector improvements over time.
guiding new business developments.2. Similarly, reliable and accessible data about the activities of other banks – especially in a system such as Kenya’s with a relatively large number of banks – is essential to inform the decisions of any one bank about possible new business developments. For example, any bank considering an expansion into new geographical areas, into new technological developments, or into new types of banking services needs an intelligent evidence-based idea of what other competitive banks are already doing in such areas. Clearly any such information that relates to future plans will be held in some confidence by any one bank. However, there is potentially a great deal of other relevant information - e.g. about what banks already do, how new technologies are opening up new possibilities, how increases in incomes are extending the potential customer base, that is not subject to confidentiality restrictions.
international benchmarking.3. In an evolving and fast changing banking system such as that in Kenya, it is also very important for any individual bank and indeed the policy-makers to maintain a good and up-to-date idea about how bank performance compares with that of strongly performing banks in somewhat more advanced economies. In part this is a regulatory problem – the CBK regulators are anxious to ensure that Kenyan banks comply with well-established international
Chapter 1
WHY DO WE NEED GOOD BANKING INFORMATION?codes and standards such as those laid down by the Basel Committee. However, such standards provide only a part of the international benchmarking that is possible and good quality information can enable non-official analysis of how any one bank performs vis-à-vis a very broad range of international indicators. This too can be a valuable incentive to spur improved bank performance.
Defending financial stability.4. Good quality data regularly supplied and using definitions that are both consistent across banks and compliant with international standards are the bread and butter raw material of effective bank regulation. This is the first line of defence against individual bank failure and financial instability more generally. It is of course quite normal and sensible for some part of the regulatory banking information to be held in confidence by the regulator – in the absence of such a restriction banks would be much more reluctant to comply with the requirement to divulge sensitive information. However, in practice there is a fine and difficult line to be drawn between those data that can and should be disclosed (for the reasons listed above) and those data that may legitimately be kept confidential: for example, because disclosure might precipitate a panic reaction that sound regulatory intervention could easily avert.
informing bank customers.5. Bank customers also need to make informed decisions about where to deposit their savings, which bank can best handle their payment requirements, and where they can get the best deals on loans. The main type of information involved here relates of course to the schedule of bank interest rates and fees. It is vital for effective competition that such data are put regularly and transparently into the public domain. However, bank customers also have a duty to themselves to entrust their business only to safe and secure banks. With this in mind the bank customers also need regular and reliable data about the financial performance of banks. It is of course normal practice in most countries for the public to entrust this aspect of the scrutiny of banks to the bank regulator – this delegation to a qualified regulatory “agent” makes a great deal of economic sense. But caveat emptor principles still apply and customers are ill-advised to fully delegate their own duty of care to their regulatory agent. Hence public as well as regulatory information about banks can play a critical part both in consumer protection and as a second line of defence of financial stability.
Keeping regulators on their toes.6. Because bank regulation is a highly specialized business it does make sense to have one officially designated bank regulator – in Kenya’s case this is the Banking Supervision Department of the CBK. However, that single regulator is nonetheless placed in a monopoly position. Because of this there is merit in having a parallel private industry of bank analysis that can provide a non-official perspective on the health and performance of individual banks.

2 • UNDERSTANDING THE BANKING SECTOR – STRENGTHENING INFORMATION & ANALYSIS IN KENYA
Of course the private analyst is at some competitive disadvantage in that he or she will not have full access to the privileged data maintained by the regulator. Nonetheless, the competitive private sector product – informed by regular and reliable disclosed data – can provide a useful reality check on the judgments reached by the officials. In extreme cases (thankfully not relevant in Kenya) of dishonest or incompetent regulation, the competitive private analysis provides the only real information safeguard against poor quality banks. In less extreme cases, it does no harm to give the regulators an occasional challenge.
This brief review of the arguments in favour of good quality banking information already indicates some of the challenges that confront policy in this area. In brief any effective competitive banking system will undoubtedly benefit from access to a high level of very detailed banking data. However, in practice it
is the individual banks that generate most of these data. In some important respects these information suppliers are conflicted. On the one hand they can draw their own benefits from such access (points 1, 2 and 3 above). But on the other hand, they have their own competitive reasons for wishing to withhold at least some of the data that could be of value to competitors.
Similarly, the CBK regulators who are the custodians of very detailed information about all of Kenya’s banks have quite legitimate reasons for not wishing to disclose all of this information to the general public. So the reality in all countries including Kenya is that the public disclosure of valuable banking information is always going to be incomplete. One challenge for this assignment is to assess not only the quality of the banking data already being produced in Kenya but also whether the line between disclosure and confidentiality is being correctly drawn.

UNDERSTANDING THE BANKING SECTOR – STRENGTHENING INFORMATION & ANALYSIS IN KENYA • 3
It is helpful to categorize the information industry in Kenya as comprising three main components as follows:
Data production (supply) �
Data analysis and processing �
Data dissemination �
All three of these components can be subdivided as to the official (public sector) dimensions and the private dimensions. In addition the private elements can be further sub-divided as between (a) the market-related activities – serving the needs of banks or other market players; (b) those activities that are more closely associated with research organizations and purposes (e.g. The activities of Universities and think tanks); and (c) those that have more of a “retail” purpose serving the broader Kenyan public. This chapter provides a very brief summary of the main sources of supply under these three heads. Chapter 3 below looks in more detail at the volumes of the data and reports that are produced and critically assesses some selected quantity and quality aspects of these.
2.1 Data production
The vast bulk of the banking data produced in Kenya is produced by the individual commercial banks. However, these are “official” data in the sense that most of the data in the public domain are produced in response to a statutory requirement. The authority for this in turn derives from various provisions of the Banking Act and from the numerous prudential and other instructions to banks that follow from those. In all cases the data reporting is to the Central Bank of Kenya (CBK).
The CBK has been working to develop an integrated data base – partly as a response to its commitments under the Global Data Dissemination Standard of the IMF. However, there is still an important sub-division of the data collected - between those data required mainly by the Policy Analysis and Research Department (RD) of the CBK and those required by the Banking Supervision Department (BSD). The former data are collected and compiled mainly to support the monetary policy analysis of the RD and so comply closely with the IMF standards of definition. These in turn are associated with the so-called monetary survey and the IMF monetary programming approaches which have less need of bank-by-bank data. The BSD data requirements are more comprehensive in scope and are designed to enable the department to monitor the financial performance and stability of individual banks in close conformity with the evolving standards of the Basel Committee. These data do lend themselves to more detailed analysis of individual banks and are presented with this in mind.
It is very significant from the perspective of Kenya’s emerging body of banking analysts that the Banking Act has been cleverly interpreted over time to give
Chapter 2
THE BANKING INFORMATION INDUSTRY IN KENYAthe CBK quite significant powers to require banks to publicly disclose significant details about their operations beyond the normal statutory publication of annual accounts. Some of the detail on this is described in chapter 3.
Significantly there is little or no official banking data collection beyond that produced by the CBK. Although there are some banking data presented in the publications of the Kenya National Bureau of Statistics (KNBS), these all derive from the original data generated by the CBK. This of course is not surprising. Given the pre-eminence of the CBK in the banking area and the good quality of its statistical capabilities, there is no particular need for some other official body such as KNBS to collect original banking data.
To the extent that the KNBS is active as the key player in various regular statistical survey activities such as the annual National Accounts survey, and the less frequent Kenya National Household Integrated Budget Survey, the data involved relate only very peripherally to banking sector issues. Occasionally there will be a subject of a survey in which banking issues play some part – one example would be the questions on the availability and cost of credit in special micro and small enterprise (MSE) surveys. However, as far as we are aware there are no examples of special surveys where banking sector questions are a central focus of the work of KNBS and other official agencies beyond the CBK.
The work undertaken for this assignment has revealed few privately originated sources of banking data that are in the public domain. The individual Kenyan banks carry out a variety of data collection exercises for their own purposes but for the most part, and for fairly obvious reasons the results of these are not made public. These exercises are of two main types. First, all Kenyan banks produce a variety of management information system (MIS) data which is additional to their statutory accounts and their information reports to the CBK. These data include a variety of costing and market information that is used to operate their businesses and to check on the profitability of particular products and services.
Second, some banks also carry out regular or ad hoc customer and other special surveys to help them gauge the success and consumer responsiveness to their existing products, services and pricing and also to garner new market information to guide possible new business developments. There is a feeling in some Kenyan banks that rather more of the second type of data assembly might be undertaken on an across-the-industry basis by for example the bankers’ association. However, the Kenya Bankers’ Association currently seems to do relatively little data collection except to inform the work of its various special committees.
The University and think-tank component of the Kenyan information industry has thus far been a very minor player. At the present time it seems fair to describe it as a user of banking data but not a significant producer of such data. This proposition needs further checking with a broader sub-set of institutions.

4 • UNDERSTANDING THE BANKING SECTOR – STRENGTHENING INFORMATION & ANALYSIS IN KENYA
However, discussions in the University of Nairobi and in KIPPRA reveal some specialized and mainly micro level surveys to address particular research questions but not much data origination beyond that.
2.2 Data analysis and processing
Again the work of the CBK dominates the scene with extensive data analysis conducted inside the organization. The main bulk of this analysis and processing is carried out to serve the operational needs of the CBK itself (a) the conduct of monetary policy in the Policy Analysis and Research Department and (b) the prudential oversight of commercial banks in the Banking Supervision Department.
Although there is some analysis of banking and other financial data in the Treasury and other parts of the Kenyan government, this is typically very dependent on the initial analysis conducted in the CBK.
In addition there is now a small but good-quality private sector industry that processes the CBK data referred to earlier and provides more in-depth analysis of some of those data. Again a great deal of this work goes on inside the individual banks and so does not appear as a public resource available to external analysts and researchers. The lead in providing public domain analysis from the private sector came back in 1998 from a private initiative marketed under the title of MI-Market Intelligence. This was originally published on a monthly basis but with a special annual edition which included the definition of the best performing banks in the preceding year and an associated feature entitled the “Market Intelligence Banking Survey Awards”. The annual edition also included comprehensive tables that ranked all Kenyan banks in relation to some 60 separate balance-sheet, profit & loss and ratio indicators. An overall ranking used a sub-set of 10 criteria related to size, asset quality, efficiency and profitability.
The publication was exclusively dependent on the disclosure data on banks made possible by the CBK requirements on disclosure of which more in Chapter 3. The final issues of MI-Market Intelligence appeared in June 2006. It has now been replaced by a new but similar publication marketed under the title of The Banking Survey by a Kenyan company called Think Business Limited.
Mr Ochieng Oloo who had been the lead person behind the earlier MI publication is also the editor of the new publication. The new Survey like its predecessor ranks all Kenyan banks on a range of indicators similar to those used in MI and now provides a somewhat more refined overall ranking based on 12 indicators linked to the CAEL part of the standard CAMEL methodology for rating banks. Mr Oloo has plans for a second and parallel publication that will deal with the capital market institutions including listed companies in Kenya. Significantly, in 2007 a new significant competitor in the market for collated bank-by-bank data and analysis emerged in the form of a new
offering from the local Kenyan firm of Metropol who operate in Nairobi in close collaboration with the international rating agency Global Capital Ratings (GCR). There are, however, marked differences between the business models of the two suppliers. The Think Business product is sold widely and at a relatively modest price that could even attract some top-end retail interest. The Metropol-GCR product by contrast is sold only to subscribers and at a very much higher cover price that limits it to a specialist institutional and professional market and almost certainly puts it out of the reach of academic researchers.
Small amounts of analytical work on banks are also carried out by the various universities and thinks tanks based in and around Nairobi. However, a limited set of meetings in these institutions and some parallel scrutiny of their web sites did not reveal either (a) much dedicated and specialist research on banks or (b) a particular high data-intensity in the work that is carried out. On balance the attention given by the Kenyan research community to banking issues and to the analysis of the voluminous amount of banking data already available is disappointing.
Specifically, the Economics Department at the University of Nairobi lists over 500 publications but in recent years - the past 5-8 years - only a very few of these have had any financial sector content at all and much of this relates to micro finance or to various aspects of the Nairobi Stock Exchange. There is almost nothing that involves a strong focus on banking and so very little apparent analytical use of banking data.
KIPPRA covers a wide range of research topics and has a strong reputation for its work on macroeconomic modelling and policy including earlier papers on monetary policy (not least papers on interest rate spreads in 2004 by Rose Ngugi and others and papers by Professor Njuguna Ndung’u - the present Governor of the CBK). Its small finance team is known to be preparing a compendium of banking data but analytical papers based on this have not yet been produced as far as we know.
The Tegemeo Institute has a strong reputation in a range of agricultural research areas. But its long list of working papers and policy briefs reveals only one with a significant financial focus and this paper by Betty Kibaara (2006) is mainly focused on the less-formal means of financial service delivery in rural areas.
The Institute of Policy Analysis and Research (IPAR) has a broad research remit and an impressive list of publications to its credit. But we have found only two recent papers on finance (one on micro credit access by John Akoten (2007) and another by Thomas Kibua and others on a regional bond market (2005)).
The Institute of Economic Affairs (IEA) has more of a civil society and advocacy agenda and appears not to have an agenda that would include significant original analysis of banking data. Professor Terry Ryan, a long time adviser

UNDERSTANDING THE BANKING SECTOR – STRENGTHENING INFORMATION & ANALYSIS IN KENYA • 5
to the Kenyan Ministry of Finance, and now associated with Strathmore University, is known to maintain a keen interest in Kenya’s monetary and banking development and is also anxious to build a compendium of banking data. However, we do not currently have any detailed information about this project.
2.3 Data dissemination
The situation here is again dominated by the work of the CBK. The disclosure requirements that are discussed more fully in chapter 3 ensure that all banks in the country publish both their audited balance-sheet and profit and loss accounts in national newspapers in a standard format but that they also provide un-audited publication of the same data in the other three quarters of the year.
The CBK also provides various data on banks in its main publications which are:
The CBK Weekly Bulletin which is a short review with a strong monetary �operations/money market focus.
The Monthly Economic Review which includes a summary of �macroeconomic, monetary and banking developments with a limited set of summary data tables.
The Statistical Bulletin prepared by the Research Department which �includes some 30 pages of detail on various aspects of the banking sector situation and trends. It includes long time series (typically ten years plus some quarterly and monthly detail) of bank balance sheets (aggregated across all banks), sectoral detail on the allocation of credit, and information about the evolution of all the main interest rates. The statistics are characterized by long time series but only limited bank-by-bank information.
The Bank Supervision Annual Report which provides a more diagnostically �focused assessment of banking trends including the status of the sector from a prudential stand-point. This report includes some detailed aggregate tables consolidated across all banks on balance sheet, P&L and some other disclosure data. It also supplies a limited set of bank by bank data on key aggregates such as total assets, risk weighted assets, and profitability. However, the bank-by-bank summaries here are somewhat less than are provided in the private sources already discussed above.
The Annual Report of the Deposit Protection Fund that provides, inter- �alia useful additional detail on the size composition of deposits.
The CBK Annual Report on the overall operations of the Central Bank. �
Occasional special reports and recently the special December 2007 survey �(conducted with the assistance of FSD) of 900 bank customers designed to establish the patterns of usage of various banking services.
Overall this is an impressive and collectively very useful package of published information. It is difficult to see that the CBK could make more than marginal improvements in the volume and quality of its work in this area.
In the private sector we have already drawn attention to the valuable work of analysis and also dissemination by Think Business and by Metropol/GCR. In addition to this most of the local daily newspapers provide a significant volume of discussion about banking sector issues. The volume and quality of such work has increased markedly in recent years and is strong by African standards. Further given the somewhat inaccessible nature of the other sources that we have already discussed the broad Kenyan public is very dependent on the newspapers and other media representation of the situation in the banking sector. What we may term the “retail” part of dissemination is almost wholly dependent on the print and visual media.
Leading providers in this area include the (pink) Business Daily which is part of the Nation Media Group; weekly special chapters in papers such as the Standard (with its Shillings and Sense supplement) that have a consumer finance flavour, the Kenyan monthly Finance: The Magazine for our Times which has developed a remit somewhat beyond “finance” but contains regular and useful articles on aspects of banking; the Kenya monthly Business Post published by Media Services Group in Nairobi.
These and other similar publications mostly sell at accessible cover prices (e.g. KSh 50 for Business Daily) and so provide the Kenyan public with an accessible and wide variety of views about business and finance including banking. However, these publications largely present the data and analysis that is provided by others without adding a significant amount of analytical value. Being dependent on advertising revenues they also tend to make extensive use of the materials provided by the banks themselves and typically provide critical comment on a secondary rather than an original basis.
Finally it is important to mention that the national newspapers are the place where the statutory bank-by-bank disclosures as required by the CBK see the light of day. The four times a year publication by all Kenyan banks represents an unusually detailed resource by Africa standards. However, that very detail and the intensive statistical nature of the statutory publication ensures that it is a resource of value mainly to a limited set of the more sophisticated readers of the newspapers and not to the broad mass of the Kenyan public.

6 • UNDERSTANDING THE BANKING SECTOR – STRENGTHENING INFORMATION & ANALYSIS IN KENYA
Chapter 3
A CRITICAL REVIEW OF THE pRESENT SUppLY OF INFORMATIONThis chapter of the report presents more detail and critical comment on some aspects of the production, analysis and dissemination of banking data as introduced in chapter 2. It also sets out to clarify the underpinnings of the present situation and to identify areas of unmet demand where improvement may be sought.
3.1 official supply – current volume and quality
As was noted in chapter 2 above the CBK dominates in all three components of the Kenyan banking information industry from data origination through dissemination. Given the system’s dependence on this source of supply it is important to probe a little into what underpins it. The authority for the CBK’s very extensive production and dissemination of banking data derives from the Banking Act (and especially from Article 22 of that Act).1
This requirement on its own is relatively unremarkable and indeed can be considered to be the normal statistical practice for most regulated banking systems around the world. At present in Kenya, the requirement applies to 42 functioning commercial banks, to 2 Mortgage Companies with some of the deposit-taking features of banks (Housing Finance Ltd and Savings and Loan Ltd), and to 1 deposit-taking Non-Bank Financial Institution (NBFI).2
However, the basic banking data to which the requirement of the Act gives rise is further supplemented by the evolving (and discretionary) interpretations which the has over the past 15 years applied to the clauses of Article 22 but also more substantively by the broad authority accorded to the CBK by Article 33 (4) which relates to the …”guidelines to be adhered to by institutions in order to maintain a stable and efficient banking and financial system”. Very significantly from the viewpoint of this present assignment this clause has given rise to the specific instruction shown in Box 1 below that is a part of the Prudential Guidelines that the CBK issues to all banks. It can be seen there that the disclosure data is collected and made available on a quarterly basis.
There is in addition to this a significant volume of largely undisclosed data that relates to the prudential supervisory responsibility of the CBK as captured above all in Article 33(4) of the Banking Act. The specific data requirements placed on banks are captured in various guidelines issued from time to time under the authority of the Act. So for example there is a monthly requirement to report the size of risk weighted assets that is captured via Form CBK/PR3. For the most part this additional reporting for prudential purposes provides the
3 There is close collaboration between the two departments of the CBK. As one element of its agreement with the IMF Global Data Dissemination Standard (GDDS), the two departments have established a programme to create a common CBK data base of relevance to all CBK users of banking data. Among other things this should help to eliminate the duplication of requests to the responding banks and also help to iron out any differences of definitions of substantively similar items.
4 The monthly banking returns to the CBK to which this refers are governed by a separate instruction. Although these monthly data are not subject to the same bank-by-bank disclosure requirements, useful consolidated summaries of the data and associated commentary are provided in the regular publications of the CBK and particularly in the Monthly Economic Review and in the CBK Statistical Bulletin.
regulator with more detail and more regular information (monthly rather than quarterly) than is available in the disclosure data. The main point to note here is that Article 33(4) in particular gives the CBK very broad powers to request additional data from banks on a fairly regular basis. However, much of this additional data can only be disclosed to the public on an aggregated rather than on a bank-by-bank basis. Finally there is a collection of banking data on a monthly basis which is obtained using the form CBK - BS(M). This collection of data is undertaken more for the needs of the Research Department of the CBK than for the needs of Banking Supervision.3
box 1: The disclosure requirements on Kenya banks
Every institution shall cause a copy of un-audited financial statements to be published in a daily national newspaper, between Mondays and Fridays excluding public holidays, in the format prescribed by the Central Bank of Kenya from time to time. In order to facilitate comparisons, the prescribed formats shall be similar to those used to publish audited financial statements. The un-audited financial statements shall be published at quarterly intervals in accordance with the following programme:
period ending publication Deadline 31st March 31st May 30th June 31st August 30th September 30th November
The publication for the period ending 31st December should follow the process described under Audited Financial Statements. All financial statements and other disclosures to be published should first be submitted to the Central Bank of Kenya for clearance at least two weeks before publication. The financial statements must be signed by the Chief Executive Officer and at least one director of the institution. The reports forwarded to the Central Bank of Kenya for clearance must provide detailed reconciliations for any differences between the disclosures and the CBK-BS(M)4, PR4-1, PR21, PR3 and other prudential returns relating to the same cut-off date which had earlier been forwarded.
See Annex 2 for the detailed data that is required from banks.
1 Article 22 reads as follows:“…Every institution shall exhibit throughout the year in a conspicuous position in every office and branch in Kenya a copy of its last audited balance sheet and last audited profit and loss statement (which shall be in conformity with the minimum financial disclosure prescribed from time to time by the Central Bank and shall include a copy of the auditor’s report) together with the full and correct names of all persons who are offices of the institution in Kenya , and shall within three months from the end of each financial year, cause a copy of the balance sheet and last audited profit and loss statement for that financial year to be published in a national newspaper.”
2 As of September 2007 there were a further 12 Depository Corporations under liquidation to which the requirements of Article 22 would previously have applied.

UNDERSTANDING THE BANKING SECTOR – STRENGTHENING INFORMATION & ANALYSIS IN KENYA • 7
Chapter 3
A CRITICAL REVIEW OF THE pRESENT SUppLY OF INFORMATION
Together with Article 22 itself, this monthly collection was motivated originally by Kenya’s statistical obligations especially towards the International Monetary Fund. The specific data collected still relate much more to the needs of monetary policy operations than to the needs of prudential supervision. It is the basis for the preparation of the Monetary Survey data. Hence the balance-sheet of the banks is the central core of the data requested from banks through the BS(M) form although a number of subsidiary tables are also routinely collected. These include data on the maturity structures of both local and foreign currency deposits; a sectoral analysis of loans and advances; an analysis of both the size distribution and the maturity of new loan approvals; and details on both the volume and prices of money market operations.
Although collected on a bank-by-bank basis, the disclosures are confined to the consolidated numbers for the whole of the banking system. They are therefore somewhat more useful for the broader macro-monetary analysis than for industry-level diagnostics and market analysis.
These disclosure arrangements under various articles of the Banking Act provide the Kenyan public and the market with a level and a quality of regular quarterly bank data which is of a high standard compared with much of Africa. Like the Article 22 data it currently applies to some 45 banks and bank-like institutions in the country. Meetings conducted with the CBK for the present assignment indicate that as the new Microfinance Act is implemented, the disclosure requirements will apply also in a very similar manner to all micro-finance institutions registered as deposit-taking institution under the new Act.
Significantly and as noted in chapter 2 there is little or no official banking data collection beyond that produced by the CBK. Although there are some banking data presented in the publications of the Kenya National Bureau of Statistics (KNBS), these all derive from the original data generated by the CBK.
3.2 official supply – issues going forward
In terms of the volume and quality of the banking data that is made available in the public arena it is hard to be critical of the official effort focused around the CBK. Certainly the high level of detail provided in the balance-sheet, P and L statements and in the supporting disclosures provide adequately rich raw material for most serious analysis of individual (or groups of) banks (see Annex 2 for the detail that is provided). At present this rich vein of information is seriously under-utilized by both the market analyst and the research communities in Kenya. Three substantive issues arose during our review.
The first is the need for the CBK to consider the electronic publication of the data that banks are presently required to publish quarterly in the newspapers. Given that all these data are disclosed already and that they need to be presented electronically to the CBK prior to their publication (see Box 1 above), there is no obvious practical reason why those same data should not also be
published on the CBK web site as is done in some other countries (Annex 5 includes examples from Estonia and Bulgaria and a wider survey is being completed). This would save a huge amount of the time and effort of the existing (small) industry of analysts.
All those we spoke to including experts in Think Business, Metropol/GCR and in KIPPRA presently type in the disclosure data from the newspaper copy. This is an incredibly time consuming task and one that is also likely to generate significant errors. So an electronic publication would at the very least save the time and energy of the existing (small) community of banking researchers. But in addition, by making the data more readily available it would almost certainly encourage some new entry into that industry and so extend the volume and possibly the quality of the analysis that is carried out.
Second, although data on bank charges are required to be made public the form of publication and the detail provided make these data less immediately useful for analysis than are the balance-sheet and profit and loss data just discussed. This is partly because the authority for publishing the data on bank charges has emerged through a rather different route from that described above.5 However, this authority also provides very broad scope for disclosure and again on a bank by bank basis – should the CBK so decide as it has in this particular case. Because the banks are required to report changes in any of the charges they levy, the data provided are quite daunting and of little direct use for analytical or comparative purposes. Specifically, they show the unit costs to customers of up to 72 different bank services (e.g. Manual salary processing, electronic salary processing, opening an account, bank opinion to customer, cash delivery, dormant account charge, etc.). Since many of these services are never used by most customers and others are used in various combinations, the data which have emerged for regulatory purposes are really not suitable for advising consumers of bank products. It is well nigh impossible to assess the cost that might apply to any particular customer or to make meaningful comparisons across banks (see Annex 3 for the details of the charges data provided).
The CBK has recognized that, at the very least, it is essential to associate the unit cost data with some meaningful estimates of the level of usage of different bank services by a range of typical customers. The work to do this has been underway for some time in the CBK with support from FSD. At the present time a survey of 900 bank customers in Nairobi, Kisumu and Mombasa (as published now on the CBK web site) has revealed the scale of usage of
5 In brief, the existence of the controversial Article 44 of the Banking Act requires Minister of Finance approval for any increase by any bank in its banking or other charges. This requirement has led in turn to the CBK collecting regular and detailed data on the charges levied by banks for a variety of their services. In recent years and as a partial response to the criticisms about the neglect of the Article 44 provision, the CBK has chosen to put this information into the public domain. It does so largely on the authority of Article 31(1) that states that the Central Bank or the Minister may publish in such manner as it or he thinks fit, any information furnished to it or him under this Act.

8 • UNDERSTANDING THE BANKING SECTOR – STRENGTHENING INFORMATION & ANALYSIS IN KENYA
different categories of product and customer. The December 2007 publication6
then shows the costs for a typical customer of three main banking services namely:
The monthly cost of operating a current account for an average user. �
The interest rate, repayment amounts and additional charges associated �with a loan of KSh 50,000 paid monthly over two years.
The interest rate, repayment amounts and additional charges associated �with a loan of KSh 500,000 paid monthly over three years.
All three are shown on a bank-by-bank basis with the banks ranked in order (from lowest to highest chargers). In addition the report shows the availability by bank of branch outlets, ATMs and payments services such as Kenswitch and Pesapoint.
This innovation is a very important one for bank customers. However, the CBK acknowledges that it is merely the first step in enhancing the quality of information about bank charges. The CBK may also expect some criticism for combining its regulatory functions with this public ranking of banks (as far as we are aware this is the first time that the CBK has engaged in a ranking exercise). Certainly there is considerable scope for one or more private initiatives taking over the burden of this work now that the CBK and FSD have shown the way forward. Bank customers will certainly need a more systematic way to compare bank services over time and to make informed choices about where to allocate their business.
Finally there is the issue of should more detail be disclosed? Our starting point in answering this question is that the volume and quality of the data that is already disclosed by the CBK is of a high order by African standards and indeed is superior in many respects to that seen in more advanced banking systems (see Annex 5 for examples from emerging Central European banking systems). However, given that CBK collects more data than it presently discloses on a bank-by-bank basis and that there are central banks that do release such data, then a case can clearly be made for greater disclosure based on the same discretionary powers that underpin some of the existing disclosures. The next chapter looks in detail at this issue from the perspective of what type of analysis is possible with different levels of disclosure, starting with data clearly already in the public domain, moving through data on the borderline between official and public domains and onto data that is not yet publicly disclosed but could relatively easily be so.
The extreme end-point of this process would be the release of all detailed monetary and supervisory returns on a bank-by-bank basis. This is not standard and not dealt with in this report; even the Estonian approach referred
to above only releases mid-level data albeit in greater detail than that currently being disclosed in Kenya. Going towards full disclosure is almost certainly not appropriate at this stage for Kenya as it requires a very well established and almost self-regulating capacity to analyse such sensitive data. All the findings of the two visits to Kenya suggest that this is not yet present even for relatively non-sensitive data. This is because the main barrier to new sources of in-depth banking analysis at present appears to be the huge amount of work that has to be done just to collate individual bank disclosure and tariff data into coherent and comparable data sets before any analysis can begin.
Only when easier access to public domain data in a useable form is possible, will competitive advantage in the market for in-depth banking analysis move away from the uneven distribution of capacity to collate and towards the more desirable attribute of a demonstrably superior capacity to analyse. Put bluntly, until barriers to entry are reduced, those in the private sector that can surmount them could use the collated data to say almost anything they want with very little risk of challenge. This is not to say that the existing work being done is in any way suspect – it seems very good – but only that there is no self-regulating mechanism of expected peer review and challenge to ensure that only sound analysis gains a sustained market foothold.
It can also mean that the presentation of data is skewed towards the business activity that can most easily pay for the heavy investment in data collation. Again, this is not the same as saying that this is a problem in Kenya; just that it is a risk.7 Therefore the focus of the next chapter is on what could be done with a steady but measured expansion of public disclosure of current official domain data but with this taking second place to improving the accessibility of the currently disclosed data.
3.3 private supply – volume and quality
As noted earlier there is now a small but good quality private sector industry that processes further some of the data prepared by the banks and the CBK and provides more in-depth analysis of some of those data. Again a great deal of this work goes on only inside the individual banks and this fact clearly detracts from its general usefulness to the industry as a whole.
Similarly the high costs of the analytical product from, for example GCR - Metropol limits the usefulness of their work to a quite small number of market users who are prepared to pay significant sums for the privilege. As also noted the volume of work on banking in the country’s universities and think-tanks – both original data work and analysis – has been disappointingly thin in recent years. It is possible that the suggestion made above about the electronic publication of the main CBK disclosure data as shown in Annex 2 would provide a stimulus for increased volumes of analytical work by both
6 Central Bank of Kenya, Survey on Bank Charges and Lending Rates, December 2007, available on the CBK web site.
7 Indeed, the Metropol analysis includes a very interesting review of banking the unbanked and the competitive threat from cellphone transaction banking as well as the the analysis of banks by their likely takeover status which more obviously relates to GCR-Metropol’s capital market focus.

UNDERSTANDING THE BANKING SECTOR – STRENGTHENING INFORMATION & ANALYSIS IN KENYA • 9
the market-facing analysts and by the research community. But this of itself will not be enough to convert the present rather minimal supply of work into a more substantial one.
In addition some appropriate promotional work could pay high dividends. Certainly, the existing volume of private sector activity is not appropriate for a banking sector that may aspire (in the context of the Vision 2030 programme) to be many times larger than it is at present in 10 or 15 years time. For example, syndicated attitudinal surveys of customer or practitioner sentiment can be thought of as part of a developed market infrastructure. But they could be started in Kenya on a modest basis. A possible first step beyond the work in individual banks is for the demand-side surveys to go on to a syndicated basis.
3.4 are there any obvious unmet demands?
The set of meetings undertaken in the course of this assignment have provided only a limited basis for answering this question. However the following pointers have emerged.
Among the commercial banks themselves there is some evidence of an unmet need for more good quality cross-market intelligence. There are essentially three ways of providing this by:
the regulator forcing the pace and releasing bank-by-bank data for free;a.
the industry co-operating to make basic bank-by-bank data available b. as a public good (usually via an industry association such as KBA) and charging only the marginal cost of delivery; or,
going the fully commercial route as with the current Think Business and c. Metropol products.
The last two solutions are not mutually exclusive since there is clearly some scope for industry associations to outsource the creation of public domain data to commercial processors. In the UK, for example, basic industry statistics are available through industry bodies such as the British Bankers Association and the Council of Mortgage Lenders but the biggest base of information on individual bank interest rates and charges was built up by MoneyFacts, a private start-up in the mid 1980s. MoneyFacts then sold the compiled data on a monthly subscription basis, not least to the industry (which found it a cheaper solution than compiling their own cross-market interest and fee rate data) but also to retail customers.
The starting point for improving the scope for cross-market intelligence needs to be a debate among banks themselves about where the borderline between public and private/official domains should lie. Put crudely, all banks expect to have to disclose to the regulators almost anything asked of them about what they are doing. They would welcome something in return for this large effort of data assembly and reporting. In particular, they would like to know what
their competitors are doing in many dimensions that bear on their competitive position. Unfortunately most individual banks would rather not reveal exactly which parts of the market they themselves are targeting, what their costs are etc. So we have a situation in which the data to meet a lot of the second type of banker’s need (what are competitors doing) is created and given to the regulator but not then released back to the supplying banks because of the third need of banks (to keep their own individual market strategies and tactics confidential for as long as possible). This situation results in a standoff where no systematic cross-market bank-by-bank data is available – holding one’s own market information close inevitably means flying half-blind in markets one is seeking to penetrate.
This is essentially an issue of where does competitive advantage lie – is it in overcoming the hurdles to finding and collating bank-by-bank data or is it in the quality of what is then done analytically with those data? The Kenya Bankers Association would be the normal focal point for the debate that needs to take place within the banking industry but the KBA may need supporting and even pushing in this direction. A second option would be a CBK~Treasury working group with bank representation, which might be organised but not mediated by KBA. The justification for this is that the authorities have a very legitimate interest in the second type of competitive advantage (the banks knowing what to do analytically with data) beginning to dominate the first advantage (merely having the resources to find and collate data).
The issues that need to be discussed centre on (a) the mechanisms that banks might engage collectively to research cross-cutting issues that affect all banks even though individual banks will want to develop differentiated responses to them;8 (b) what bank-by-bank data already prepared for the official domain is not really so commercially sensitive that it cannot be put into the public domain more or less immediately and (c) what improvements in those data prepared for official purposes would make it so much more useful to practitioners that they would come round eventually to seeing it in the public domain as well. Examples of how the borderline between official and public domain data might gradually move are discussed more in chapter 4.
Some banks are also likely to welcome further work on cost and price comparability along the lines already started by CBK and FSD Kenya to make the charging structures more easily comparable. This is now moving on to embrace the complex issue of developing a meaningful “annual percentage rate” (APR) standard. Such exercises are technically challenging to policymakers and practitioners alike and are virtually always top down initiatives (whether or not backed by statutory enforcement). This is what is happening in Kenya now with the CBK/FSD initiative. Some higher-cost banks may initially object but the more responsive ones should see the merits of greater transparency.
8 e.g. The emergence of new access products in other countries in Africa, the likely next developments in mobile telephony, the new banking products that may be made possible by these; and regulatory changes that may be driven by the technology and other global developments.

10 • UNDERSTANDING THE BANKING SECTOR – STRENGTHENING INFORMATION & ANALYSIS IN KENYA
A positive response will, however, only happen if the methods used both to analyse the problem and to disseminate the results are sound and based on a reasonable degree of prior consultation. The normal vehicle for such participation would be a bankers association such as KBA.
As was noted in chapter 2, the volume of output from the research community is presently disappointing, especially in the light of the high level of talent that is available in Kenya. This suggests the need for a better framework for stimulating banking sector research. However, a community of researchers as such does not yet exist in Kenya as an organized body. Hence it is difficult to comment with any real confidence about the “demands” that they might express were they to be better organized. It does seem eminently possible that an improvement could quite easily be achieved if some organisational framework were to be devised and supported in a pump-priming manner in the early years. The idea simply would be to try to create a community of researchers interested in banking questions and offer them a supportive framework (meetings scheduled at regular intervals, distinguished guest speakers possibly from other countries, invitations to participate in non-confidential policy discussions in the CBK and Treasury and some guidance about the priority research topics). This alone will almost certainly not, however, be enough to create a viable new source for in-depth banking analysis.
A small pump-priming grant window may also be needed to help members of the potential research community get started on new research. It is important that this work should challenge as well as support industry initiatives and government policy. Therefore while CBK, Treasury and the Kenyan Bankers Association would be important stakeholders in the process none of them should have an individual or even collective veto on the work that might be done. There would also be merit in more association with competent Kenyan researchers based in the USA or other western universities. The African Economic Research Consortium that has been active and successfully so in Nairobi for several years provides one possible model that could be used to get started: and the CBK Governor himself has hands-on experience there.
The limited capacity and interest of the research community in the banking area also poses problems for meeting the needs of the government when it seeks to undertake any assignment that involves a significant banking component. An immediate example is the preparation of the Financial Sector component of the new Medium Term Strategy that in turn will be the first bite at the Vision 2030 project.
The Treasury (for example) can certainly call on a variety of specialists from within the public sector, particularly CBK with good practical knowledge of the issues involved. However, experts with a wider perspective on what should be possible and where major constraints may lie are more likely to come from outside government and here availability is far less good. This limits government’s scope to follow through on domestically generated ideas and makes it more dependent on international consultancy support.
If Kenya were able to develop a larger and more active research community whose members were not involved so much in day-to-day policy matters, this would provide the government with an extra cushion of capacity and intellectual ideas that could spawn a richer menu of ideas for future policy development. This will not, however, happen of itself even if the data platform for new in-depth banking analysis improves; it will have to be cultivated in the way described in the previous paragraph.
Finally, there are the needs of the general public in Kenya. Knowing whether these are unmet or not is a difficult question to answer because it involves separating the issue of whether information reaches the consumer in a useful and useable form from the issue of whether consumers have the capacity to process such material. Thus a distinction has to be drawn between the need for better consumer education and the need for better consumer information.
The gap in capacity to absorb and understand information about financial services is being addressed by various financial education programmes including the Financial Education Partnership being supported by FSD Kenya. This should be extended but by itself it will not change the reality that much information about financial services will always reach consumers in an intermediated way rather than being directly delivered.
Aside from anything that may be done through stronger regulation on consumer protection, the responsibility here lies mainly with the newspapers and the other media outlets used by the general public. Notwithstanding the good and improving work done by Business Daily and similar publications there is a need for much more accessible public information and comment on issues such as: what any given bank product or service really offers as against what it claims to offer; what are the true charges for such products and services as opposed to the “sticker prices”; and how the offerings of any one bank in any particular area compares in quality and price with that of other banks?
Prospects for progress in this area appear quite good; the press reaction to the first CBK/FSD Kenya Survey on Bank Charges and Lending Rates lasted weeks and even the follow-up survey got a couple of days coverage. Nevertheless, based on the journalistic output seen in two short visits there still seems a gap in the market for (a) a more forensic style of financial journalism that probes the public disclosure data from individual institutions and uses this to challenge bank management and (b) ongoing consumer journalism that keeps issues such as charging and service levels constantly in the press in the way it is in more developed market economies.

UNDERSTANDING THE BANKING SECTOR – STRENGTHENING INFORMATION & ANALYSIS IN KENYA • 11
4.1 introduction
This chapter aims to demonstrate what might be done with banking data that is currently in the public domain and then look at how this might be taken further were slightly more bank-by-bank data put into the public domain. The topic can be broken down into four parts:
The starting point has to be analysis that can be done using 1. fully disclosed public domain data. This focuses on use of data contained in the public disclosures of bank balance sheets, income and expense statements and the additional obligatory disclosures plus bank tariff data. The analysis described under this heading is based on work done earlier using public disclosure data collated by CBK. However, as a test of whether this work really can be done using data in the public domain, part of the underlying data model has been reworked to run off public disclosure data as compiled and kindly made available by GCR-Metropol. This has generally worked well although there are some minor differences still to be resolved.
Next, there is the additional analysis that can be undertaken using 2. data in the official domain which should probably be put in the public domain. The analysis described under this heading would require only the additional release of employee numbers and branch numbers and locations. Neither of these is particularly sensitive; nor would putting them into the public domain involve much additional work. Indeed information about the location of branches is by definition already in the public domain – the public can see where they are. It is not yet, however, publicly available as systematic data for the whole industry. Adding in these data can give more richness to the debate about access to finance and the quality of supply.
A real breakthrough in analysis of the supply of accessible finance – 3. clearly an issue of great importance to a country like Kenya – would come from opening up data on the number of bank accounts being opened by the public, plus a sectoral split of lending. Some of these data are already in the official domain, albeit with gaps, but none of it gets into the public domain except on an aggregated, whole-industry basis. The CBK Research Department collects data on the number of new loans by size band and sector but not by value and collects data on the value of outstanding lending by sector but not by numbers of loans outstanding. The Deposit Guarantee Scheme has data on outstanding deposit balances and account numbers split between those under and over the guarantee limit, but no data appears to be collected on the number of new deposit accounts opened or the mix between individual and commercial accounts. None of these data should be hard to extract from bank IT systems and if this were done it would give a better supply side perspective to the debate about the number of customers actually out there. Demand-side survey data is extraordinarily valuable in terms
Chapter 4
IDEAS FOR IMpROVED ANALYTICAL WORK IN BANKING
of who thinks of themselves as a bank customer and what they are like but this may not actually be the same as who really does have a bank account and uses it. Only when supplier data about the volume and average value of business being done is put along side demand-side data will there be any chance of understanding “usage”, which by definition lies at the interchapter of demand and supply.
Last but by no means least, there is 4. data that cannot readily be gathered in a systematic way from banks as suppliers but would still inform them of how well they are positioned in the market for financial services. This generally takes the form of syndicated surveys paid for by banks in advanced market economies. The South African equivalent of the FinAccess survey is funded this way. This is the only way of comparing who banks with a bank compared to the potential customers who do not yet bank with them. There are real economies of scale to be had by doing these surveys on a syndicated basis. There are, moreover, economies of scope – syndicating a properly structured, specialist financial market survey has more chance of delivering data about the true levels of bank and product penetration at affordable unit costs than lots of conflicting bursts of add-ons to omnibus media surveys.
These four elements cover the whole spectrum of what can and cannot yet be done with available banking data, moving out from what is already in the public domain and being used through what could be quite easily be put into the public domain and on to what is not there yet and would require some new work on data collection to bring it to the public domain. As already noted the extreme end-point of this spectrum would be the release of all detailed monetary and supervisory returns on a bank-by-bank basis but this is not recommended for Kenya for the reasons given in chapter 3 above.
Therefore the focus of the rest of this chapter is what can be done with data that is or could safely be put into the public domain now and this turns out to offer surprisingly rich opportunities. None of this is to say that Kenya could not move towards even fuller disclosure of the Estonian sort but rather that it should wait until the capacity to analyse existing data is more fully established and tested. It should also be stressed here that the examples of such analysis described below and the charts in Annex 6 are just that – examples of what can be done with data that is or could easily be put into the public domain. They are very much coloured by the work Oxford Policy Management has already done on banking system development in Kenya over the last five years.
4.2 analysis that would be possible with data already in the public domain
Four main areas of analysis are possible using data already in the public domain:
The publicly disclosed balance sheet allows analysis of which banks �are driving the overall development of banking activity in Kenya. Annex

12 • UNDERSTANDING THE BANKING SECTOR – STRENGTHENING INFORMATION & ANALYSIS IN KENYA
6 includes two sample charts showing the importance of local private banks with no foreign connection to the rapid expansion of credit across the Kenyan economy since the start of the Economic Recovery Strategy. Similar charts could have been produced for deposit mobilisation or the accumulation of liquidity or banking capital.
The parallel disclosure of income and expense data allows analysis �of sector profitability and efficiency and therefore gives pointers to the long-run sustainability of continued expansion. Crude measures of efficiency such as the cost income ratio can be broken down into costs relative to assets versus the combined spread and fee yield that different types of banks extract from their customers. This opens up a top-down perspective on affordability - an issue of obvious and long-standing concern in Kenya – and this can be combined with the detailed analysis of tariff data discussed below. Sample charts illustrating the decomposition of cost-income ratios for different types of bank over time are also in Annex 6.
The additional disclosures of selected regulatory data allow � emerging problems within the banking sector to be analysed. The charts in Annex 6 take just the problem of non-performing loans and illustrate where the bulk of the problem remained by 2006 and how it has impacted on the profitability of the state-influenced part of the banking sector. They could just have easily looked in more detail at evolving credit quality at the rapidly growing local private banks or made comparisons across bank groups. With this data it is also possible to look at the quality of capital and how much is recognised for regulatory purposes as well as how capital adequacy is being maintained in a period of rapid growth.
Finally, the mandatory publication of bank tariffs allows the � affordability of specific banking services to be analysed. The charts in Annex 6 show a very crude analysis based on stylised assumptions of likely use if price and terms of access were not the constraint on access they are known to be. More recently the CBK has been working with FSD Kenya on the issue of what actually is the average comparable cost based on actual patterns of use. The point here is that because tariff data are in the public domain and can be organised then comparable costs of use can be calculated and presented.
All these examples in Annex 6 show a distinction drawn between the performance of banks split by type of ownership and by operating status. This is purely a reflection of the particular interests of OPM’s audience for its work in 2003~2005 (primarily policy driven) and it is not the purpose of this paper to reopen that debate now. The key point here is that with the underlying balance, profitability and additional disclosure data and pricing tariffs forced into the public domain for all banks, any typology would be possible. Moreover, because of the mix of information forced into the public domain, a far wider range of topics could have been covered than just those illustrated here.
4.3 potential uses of data that could easily be put into the public domain
This chapter discusses some data that is definitely in the official domain but lies only on the borderline of the public domain. The distinction is ambiguous because it is not clear that the data is not in the public domain but merely that the banks are not obligated to put it there in a systematic way.
The first useful source of additional public domain data relates to employee and branch numbers. This gives an operational perspective on otherwise purely financial measures of efficiency, affordability and profitability. The chart related to this in Annex 6 uses a mixture of balance sheet data on earning assets and income data on expenses and merges it with employee and branch numbers. Earning assets is not a data item that must be disclosed but it can be constructed readily enough from the disclosed balance sheet. The chart plots costs per employee, earning assets per employee and total branch numbers.
It shows that back in 2003 the big branch-networked foreign and state-linked banks were operating behind a clear efficiency frontier established by the smaller local private banks (who are further down and towards the right of the chart and therefore have lower cost to asset ratios). Among the larger branch-networked banks, the foreign-owned ones tended to operate at the higher balance but higher cost end of the market and the state-owned banks at the lower balance lower cost end of the market. Since then, however, the preceding charts suggest that the gap has closed.
This sort of analysis should be useful to (a) any bank undergoing major change such as KCB, Equity etc, (b) competitors facing the changed threat from reviving banks or new entrants and (c) commentators concerned about mass-market banking (the original motivation for the work). It is undoubtedly work that can be and almost certainly is being done by some banks – not by using this same graphical analysis perhaps but other approaches addressing the same issues. The question raised here is whether the competitive advantage coming from sound market analysis really is served by having only some banks able to do that analysis. Could the easier access to the data by itself encourage more banks to operate in a more analytical mode when formulating their own strategies?
The second useful source of quasi-public domain data is branch locations. As already explained this is information already known by the public but not available publicly in a systematic way. It is, however, information that is collated by CBK and linked through to parliamentary constituency, district and province. The relevant two-part chart produced in Annex 6 merges this data with other public domain data from KNBS on population density and relative poverty at district level. It addresses the issue of whether the former state-controlled banks still have a special role to play in maintaining access and then separately whether the pro-access banks such as Equity, Co-op, etc are reaching into the poorest and most sparsely populated areas Again, this

UNDERSTANDING THE BANKING SECTOR – STRENGTHENING INFORMATION & ANALYSIS IN KENYA • 13
chart reflects the interests of OPM’s clients at a certain point in time but the charts could just as easily have been done comparing new branches opened in 2006/07 with the residual branch network after the previous trend to reduce branch networks.
4.4 potential uses of official data that could also safely be made public
This chapter looks at what could be done with relatively non-sensitive data that is in the official domain but not generally publicly available. The first source is the Deposit Guarantee Scheme which has a breakdown of retail deposits above and below the deposit insurance limit and looks at which sort of bank services them. The changing mix of supply can then be compared by bank type over time. It would also be possible to take the results of this analysis and then merge it with the affordability analysis that can be completed using tariff data that is in the public domain to see the degree to which expansion of access does or does not rely on improved affordability.
Another potentially useful source is sector lending data that is collected by CBK Research Department, which allows trends in the value of lending to key sectors to be analysed by bank type over time. The relevant chart in Annex 6 gives just one illustration of this but the sectors covered and the split by bank type could easily be varied.
All these charts have been based on individual bank-by-bank data that is not in the public domain but have been aggregated so as not to reveal individual
bank performance. Even if it is decided that individual bank data of this sort should not be released there are ways of structuring these data so that they are revealed only in a grouped way such that no single bank could combine its own data with the grouped data to reveal the confidential data of a competitor.
This, however, begs the question as to whether the data really is as sensitive at an individual bank level as banks often think it is. Should basic data about the number of clients being served and the mix of business really be treated in this way? For all the benefit a bank might get from its competitors not knowing exactly which segments it is addressing, there is also a cost in not knowing who it is up against. There is also a cost of sorts in this kind of analysis only being possible from within official circles. If the underlying data were to be made available in the public domain, the banking industry or independent third parties could make the case itself that private banks are already pushing out the frontiers of access faster than might have be commonly thought and thereby reduce pressure on and from within government for a more state-interventionist approaches.
Deciding where the balance of cost versus benefit lies between the decision to disclose or hold confidential is exactly the sort of issue that needs to be discussed as a follow-on to this study.

14 • UNDERSTANDING THE BANKING SECTOR – STRENGTHENING INFORMATION & ANALYSIS IN KENYA
Chapter 5
CONCLUSIONS AND INITIAL RECOMMENDATIONS5.1 main conclusions
This brief review of the Kenyan supply of banking information and the associated analysis has revealed a mixed picture. First, and in terms of the production of the raw data, the Kenyan system and particularly the work over the years of the CBK is very impressive. Without doing further detailed country-by-country analysis we cannot be entirely sure about the next proposition. But it is certainly our impression that the Kenyan performance in this regard ranks Kenya in the top 2-3 countries on the continent.
The analysis in chapter 3 shows that this strong performance has arisen for a variety of reasons but has not been driven primarily by any carefully designed banking information strategy.9 Since the various clauses of the Banking Act that authorize the CBK to collect and disclose so much data are largely general statements involving a high level of discretion on the part of the CBK, the present status quo cannot be assumed to be entirely secure. For this reason there is much to be said for trying to lock in Kenya’s strong performance in terms of the production of raw data through a somewhat more explicit strategic statement of policy intent. Possibly it is time for the CBK to define a Banking Information Strategy using this present report as one of the possible building blocks.
The second part of the mixed picture relates to the presently rather thin supply of good quality analysis of the data and the associated dissemination of the results. Although some market-facing analysis now exists in Kenya, it remains very thin and we found a very low degree of awareness about this even within the banking industry itself. The analytical products that are available are also to a degree dependent on the goodwill and the advertising revenues received from banks.
Some of these products are very new and are provided using a business model (high price and small volume) that is still unproven in the Kenyan market. So it is far from clear that they will be able to provide a sustained and objective service of banking analysis to inform and help strengthen the market in some of the ways indicated in chapter 1 of this report. There is also an obvious quantitative point – Kenya needs a bigger supply of such market-facing analytical services.
The situation is even more disappointing in relation to the research-oriented analysis on banking conducted by the universities and the think-tanks in Nairobi and other major centres. In recent years, the community of researchers, with a few notable exceptions, seems to have rather neglected banking issues. One result is that the rich supply of raw data coming from the efforts of the CBK remains both seriously under-analysed and under-used in both academic research and in more policy-focused work.
9 So, for example, the presently available platform of data pertaining to the charges levied by commercial banks has arisen largely as a by-product of the high level of political concern about the famous Article 44 of the banking Act.
At the level of what we have termed the “retail” information supply, there has been an encouraging growth of new specialist newspapers and monthly magazines in recent years. These provide some new analysis for the benefit of both the market participants and the consumers of banking services. However, it is our impression – based admittedly on a rather limited set of interviews - that this type of information is not yet forensic and critical enough in nature to truly help the ordinary users to identify which banks are providing the best quality and most cost-effective bank products and services – and to warn consumers away from truly bad products.
Following this assessment of the present situation in the banking information industry, this report in chapter 4 has also provided some examples of the possible analytical uses of the Kenyan data. In our opinion these types of analysis should be more widely utilized both in academic research in Kenya and in the official assessments conducted by the CBK and other parts of government. This also suggests the need to push the boundaries of what reasonably be disclosed.
5.2 recommendations
The analysis of the report as a whole has also identified a number of unmet demands for data of various types, for the modalities in which the data are provided and for the analysis and reports which the data lend themselves to. The main interim recommendations include the following.
(a) Data publication
First, the CBK should consider the electronic publication of the data that banks are presently required to publish quarterly in the newspapers. Given that all these data are disclosed already and that they need to be presented electronically to the CBK prior to their publication, there is no obvious practical reason why those same data should not also be published on the CBK web site as is done in some other countries. This would save a huge amount of the time and effort of the existing (small) industry of analysts and would also be likely to stimulate new quantitative research on banks.
(b) Data on bank charges
All banks at present are required to report changes in any of the charges they levy. However, this results in a rather daunting body of regulatory data that is of only limited use in terms of informing consumers and enabling informed comparisons across products and banks. It is well nigh impossible to assess the cost that might apply to any particular customer or to make meaningful comparisons across banks. The CBK has recognized that, at the very least, it is essential to associate the unit cost data with some meaningful estimates of the level of usage of different bank services by a range of typical customers. The work to do this has been underway for some time in the CBK with support from the FSD. This innovation is a very important one for bank customers. However, the CBK acknowledges that it is merely the first step in enhancing

UNDERSTANDING THE BANKING SECTOR – STRENGTHENING INFORMATION & ANALYSIS IN KENYA • 15
Chapter 5
CONCLUSIONS AND INITIAL RECOMMENDATIONSthe quality of information about banks charges. Furthermore, the CBK may expect some criticism for combining its regulatory functions with this public ranking of banks (as far as we are aware this is the first time that the CBK has engaged in a ranking exercise). Elements of this criticism were evident at a workshop held to share findings from this project. So we would encourage one or more private initiatives to take some of the burden of this work now that the CBK and FSD have shown the way forward. This could possibly be organised via pump-priming grants and technical assistance supported by the FSD.
One part of the solution to achieving more helpful consumer data about bank charges would be to move to a formal and mandated system of Annual Percentage Rate(s) (APRs) on at least a small set of bank products. This is discussed further in recommendation (g) below. Our interviews suggested that this would be welcomed by at least some of the Kenyan banks. However, the task of defining and implementing an APR system is by no means straightforward.
(c) Extending public disclosure
Our starting point in addressing the question of whether there should be more public disclosure is that the volume and quality of the data that is already disclosed by the CBK is of a high order. So the CBK does not need to be subjected to too much pressure to disclose a great deal more than is already the case. Indeed this report has argued that the present large imbalance between the supply of good quality data on the one hand (large) and the analytical usage of these data on the other (small) may even pose certain risks. These risks arise because the substantial barriers to entry into the business of analysing data mean that those few organizations in the private sector that can afford the time and resources to collate the available data can say almost anything they want with very little risk of challenge.
This is not to say that the existing work being done is in any way suspect – it seems very good – but only that there is no self-regulating mechanism of routine peer review and challenge to ensure that only sound analysis gains a sustained market foothold. It can also mean that the presentation of data is skewed towards the business activity that pays for the heavy investment in data collation. So until the present imbalance is addressed (partly via our first recommendation above) we would recommend against any prioritisation of significant new public disclosures of data.
(d) Extending disclosure between banks
In Kenya as in most other countries, the commercial banks are all required to disclose to the regulators (CBK) almost anything asked of them. Not unreasonably the banks would like some information in return for this substantial effort of data assembly and reporting. For example, most would like to know what their competitors are doing but would rather not reveal exactly which parts of the market they themselves are targeting and with what products and marketing approaches. In short while the regulators
possess much information of value to individual banks, the need to keep market strategy and tactics confidential for as long as possible represents an inevitable impediment to releasing these data. The outcome can be described as a standoff where no systematic cross-market bank-by-bank data is available – each bank thereby flying half-blind in markets they may be seeking to penetrate.
There are various possible avenues to partially overcome this standoff in the Kenya case and these are worthy of serious consideration by the banks themselves and by the CBK. Option 1 would be for the bankers to jointly mandate the Kenya Bankers Association (KBA) to become a somewhat stronger focal point for the debate that needs to take place within the banking industry and then for some specific new data management initiatives of the type discussed in the body of this report. However, option 1 might also call for some possible official or donor support and even pressure to move in this direction. Option 2 would be a CBK-Treasury working group with bank representation, which might be organised but not mediated by KBA. The justification for this is that the authorities have a very legitimate interest in promoting a greater competitive advantage (more banks able to make effective use of analytical data) within the banking sector based on much fuller information sharing than at present. The various issues that need to be discussed and resolved in either of these approaches are discussed in the body of this report and are not repeated here.
(e) A new framework to stimulate banking sector research
The present quantity and quality of bank-related research including research that has a significant statistical dimension is disappointing. In the light of this, it does seem eminently possible that an improvement could quite easily be achieved if some organisational framework were to be devised and supported in a pump-priming manner in the early years. The idea should be to try to create a community of researchers interested in banking questions – possibly led by the CBK - and offer them a supportive framework (meetings scheduled at regular intervals, distinguished guest speakers, invitations to participate in non-confidential policy discussions in the CBK and Treasury and some guidance about the priority research topics). Any such initiative may need to be supported initially by small pump-priming grant mechanisms to help members of the potential research community get started on new research. It is important that any such work should challenge as well as support industry initiatives and government policy: i.e. Any pump priming grants should not be conditional on the research activities coming up with politically pre-determined results.
(f ) New areas for analytical research
Notwithstanding what was said above about the limited case for further public data disclosure at the present time, there are many important areas of analytical work on banks that remain under-explored: some examples (but they are only examples) are provided in chapter 4 of this present report. If

16 • UNDERSTANDING THE BANKING SECTOR – STRENGTHENING INFORMATION & ANALYSIS IN KENYA
some progress can be achieved with the deepening of interest in bank related research in Kenya (recommendation (e) above) it would be sensible to identify more completely the agenda of potential research activities that could then be developed further: i.e. To extend the various examples given in chapter 4 above. This work could be one part of a possible new CBK Banking Information Strategy as mooted earlier.
This present report has provided some ideas about this but has referenced these ideas against the differing types of data disclosure that they seem to call for. In particular it has referred to examples at three of the four different levels of data availability and disclosure. These four elements cover the whole spectrum beginning with those data already in the public domain, through data that could be quite easily be put into the public domain, and finishing with data that are not yet available and so would require some significant new data collection work, including further survey work to bring them to full availability.
It is recommended that the CBK keep the issue of further data release under active review with the intention of giving as much support as possible to an expanding industry of banking analysis. A partial summary of the potential marriage between further data disclosure and increased research can be presented in brief as follows:
Data that are already unambiguously in the public domain. The priority �here is to make those data available in a more usable form.
Data on the edges of the public domain. The easiest research gains here �might come from releasing employee and branch numbers and their locations, all of which are already largely in the public domain but not in as systematic a way as the mandatory disclosures.
Data that could safely go into the public domain. This heading would �cover the sectoral mix of lending and the numbers of both deposit and loan accounts by banks. This extra data would help to provide a better supply-side perspective on access to finance.
(g) Improving the Information available to the Kenyan public
In this area an important distinction must be drawn between the need for better consumer education and the need for better consumer information. The gap in capacity to absorb and understand information about financial services is already being addressed by various financial education programmes including the Financial Education Partnership supported by FSD Kenya. This needs to continue and be extended to more persons. But it leaves open the question of how the requisite banking information and analysis is to reach the general public.
One part of the approach would be to inject a stronger consumer protection element into the evolving Kenyan systems for regulation not only of banks but also of MFIs, SACCOs and insurance companies. This would require these institutions to provide the public with more fully digested, standardised and intelligible information about the products and services that they offer.
The development of an APR system for at least a limited sub-set of banking products would provide a useful new entry point into this more general area of consumer protection. However, APR systems are potentially quite complex (mathematically and in terms of the elements of bank charges to incorporate in the APR calculation or to exclude) and their intended informative effects can very easily by undermined if the definitions of the interest and other cost elements included in their calculation are poorly designed.
Additionally, a positive response to the idea from the Kenyan banks will only materialise if the methods used both to analyse the problem and to disseminate the results are sound substantively and are also demonstrated as such via a reasonable degree of prior consultation. The normal vehicle to lead such participation would be a bankers association such as KBA. The recommendation here is to initiate exploratory work for the introduction of an APR system in Kenya but with due regard for the complexities involved and with a relatively relaxed time frame that can allow for both the sound design and the full consultation with all interest parties.
In parallel a major responsibility for informing consumers lies with the local newspapers and the other media outlets used by the general public. On the basis of the limited amount of work done on this aspect during the present assignment it is difficult to propose specific new initiatives. However, there is a need for a more forensic style of financial journalism in Kenya that assesses critically the public disclosure data; provides more in-depth analysis of specific bank products and services and, where necessary challenges individual bank management. There is also a case that more mainstream and regular consumer journalism will keep issues such as bank charging and service levels, and comparative performance constantly in the press in the manner seen in most developed market economies.
One approach to doing this would be to promote the case for a higher level of financial education in the mainstream modules of those Kenyan universities that already offer advanced training in communication studies. We understand that there have been earlier initiatives of this type but that they may need to be revitalised.
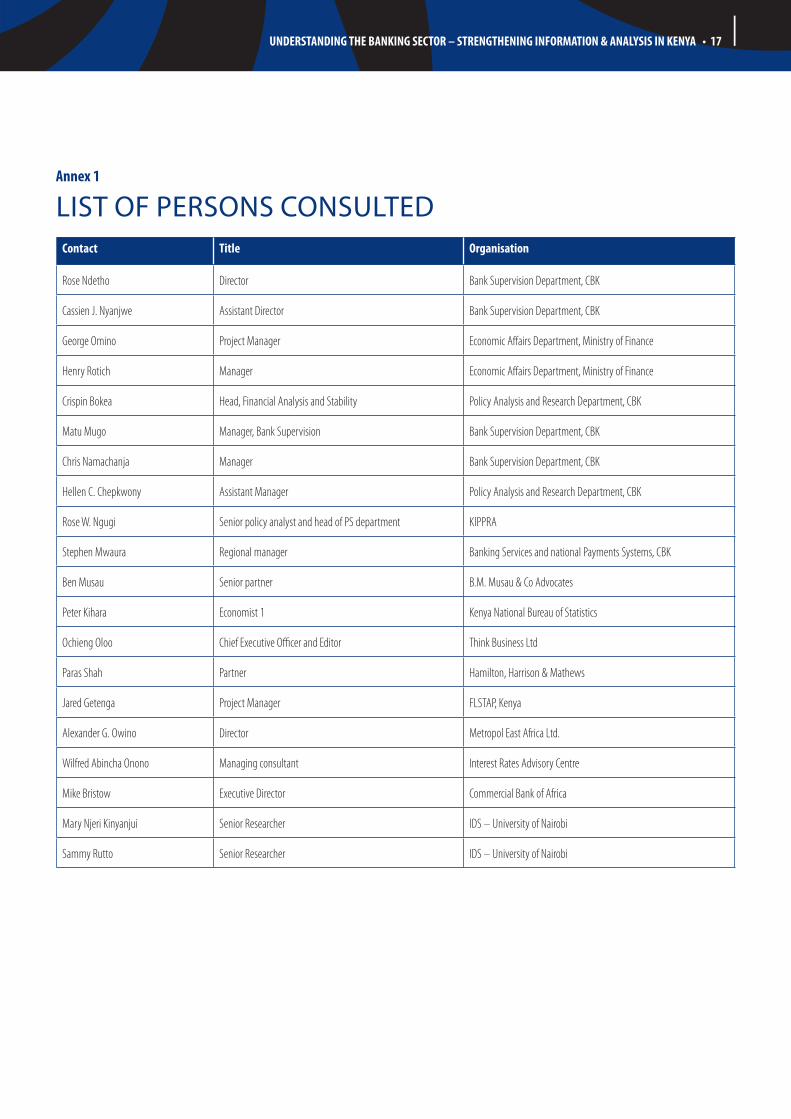
UNDERSTANDING THE BANKING SECTOR – STRENGTHENING INFORMATION & ANALYSIS IN KENYA • 17
Contact Title organisation
Rose Ndetho Director Bank Supervision Department, CBK
Cassien J. Nyanjwe Assistant Director Bank Supervision Department, CBK
George Omino Project Manager Economic Affairs Department, Ministry of Finance
Henry Rotich Manager Economic Affairs Department, Ministry of Finance
Crispin Bokea Head, Financial Analysis and Stability Policy Analysis and Research Department, CBK
Matu Mugo Manager, Bank Supervision Bank Supervision Department, CBK
Chris Namachanja Manager Bank Supervision Department, CBK
Hellen C. Chepkwony Assistant Manager Policy Analysis and Research Department, CBK
Rose W. Ngugi Senior policy analyst and head of PS department KIPPRA
Stephen Mwaura Regional manager Banking Services and national Payments Systems, CBK
Ben Musau Senior partner B.M. Musau & Co Advocates
Peter Kihara Economist 1 Kenya National Bureau of Statistics
Ochieng Oloo Chief Executive Officer and Editor Think Business Ltd
Paras Shah Partner Hamilton, Harrison & Mathews
Jared Getenga Project Manager FLSTAP, Kenya
Alexander G. Owino Director Metropol East Africa Ltd.
Wilfred Abincha Onono Managing consultant Interest Rates Advisory Centre
Mike Bristow Executive Director Commercial Bank of Africa
Mary Njeri Kinyanjui Senior Researcher IDS – University of Nairobi
Sammy Rutto Senior Researcher IDS – University of Nairobi
annex 1
LIST OF pERSONS CONSULTED

18 • UNDERSTANDING THE BANKING SECTOR – STRENGTHENING INFORMATION & ANALYSIS IN KENYA
annex 2
THE CURRENT DISCLOSURE FORMS OF THE CBK FOR AUDITED ACCOUNTS nb - the un-audited disclosures are very similar in content and detail

UNDERSTANDING THE BANKING SECTOR – STRENGTHENING INFORMATION & ANALYSIS IN KENYA • 19
annex 2
THE CURRENT DISCLOSURE FORMS OF THE CBK FOR AUDITED ACCOUNTS nb - the un-audited disclosures are very similar in content and detail

20 • UNDERSTANDING THE BANKING SECTOR – STRENGTHENING INFORMATION & ANALYSIS IN KENYA
(Deficiency)

UNDERSTANDING THE BANKING SECTOR – STRENGTHENING INFORMATION & ANALYSIS IN KENYA • 21
Account Opening Balance Minimum Balance to avoid penalty Penalty on balance below minimum
Withdrawal Over the Counter Fees per ATM Withdrawal Drawing Against Uncleared Effects
Ledger Fee Per Entry Minimum Ledger Fees per Month Periodic Scheduled Statements
Interim Statement Per Page ATM mini Statement Charge Duplicate Statement Per Page
Balance Over The Counter Certificate of Balance Statement of a Closed Account
Transfer of of account inter-branch Transfer of cash bal. on closure of account Unclaimed Balances charge
Dormant Account Charge Overdrawn A/C Interest Charge Closure of Account
Reactivation of Account Transfer of account Inter branch New ATM Card Issuance
Replacement of lost ATM Card ATM Captured Card Fee Local Cheques per – Leaf
Counter Cheques Bankers Cheque Issuance Encashment of third party cheques
Encashment of cheques for away branch customers
Fate of Cheques Advised by tel/fax Standing Instructions to return paid cheques
Request for retrieval of paid cheques Unpaid Cheque - "Refer to Drawer" Unpaid Cheque - "Effects not Cleared"
Unpaid Cheque - "Technical Reasons" Stop Cheque Payment Instructions Indemnity Signed on Lost bankers chq
Standing Order (Setting up) Standing Order Processing (Internal) Standing Order Processing (External)
Standing Order (Amendment) Stop Standing Order Instructions Unpaid Standing Order
Processing Salary (Manual) Processing Salary (Electronic) Bulk Cash Handling Charges Deposits
Bulk Cash Handling Charges Withdrawals Collection on Customers Instructions Cash Delivery
EFT / Inward Clearance EFT / Outward Clearance Internal Transfer of funds
Telegraphic Transfer (TTs) per Transfer Interbank Transfers through CBK account Interbranch Transfers
Upcountry/ Remittances Cheque Clearing Urgent Transfers Mail Transfer per Transfer
Special Clearance- FCY to Local Inward FCY Cheque on Special Clearance KBA Clearing hse Cost Sharing
Telex Charges Commission on T.B's purchased on behalf of customers Wage Packeting
PAYE Processing Bankers Opinion Insurance Debit Order
Tracers Photocopies at customer request Bills payment on the Counter
Bills payment through ATM Postal / Money order Collection / Deposits
annex 3
THE LIST OF TARIFFS AND CHARGES ON CURRENT ACCOUNTS AS REpORTED BY BANKS TO THE CBK AT END OF 2004

22 • UNDERSTANDING THE BANKING SECTOR – STRENGTHENING INFORMATION & ANALYSIS IN KENYA
i&m bank limited was formed in 1974 as Investments & Mortgages Limited, a niche community banker offering personalized financial services to a selective market segment. It registered as a Non- Bank financial institution (NBFI) in 1980 under the Banking Act and converted into a commercial bank on 1 April 1996. It merged with Biashara Bank to form I&M Bank in 2003, a pivotal moment in its growth and development. 2003 was also the year when the bank launched its first ATMs. I&M Bank’s excellent performances in recent years have attracted attention from international Banks keen on acquiring an interest in the privately held bank with total assets of KSh 22.3bn notably ICICI Bank from India, an entry by a world-class bank that could shake up domestic banks focussed on narrow niche segments of the market.)
In 2006 I&M Bank enjoyed the best results in its history. Pretax profits virtually doubled to KSh 936.4m on the back of a higher lending portfolio, increased interest income and lower charges for bad debts. I&M Bank also generated higher non-interest income and incurred modest increases in expenses. Assets rose by KSh 4.3bn to KSh 22.3bn. Customer deposits increased by KSh 3.4bn to KSh 18.2bn with most of the additional deposits coming from the top end of its customer base of 18,265 accounts. I&M Bank’s results leave its current shareholders with few options but to make plans for listing on the NSE as the best way to realize the true market value of the bank, one of Kenya’s best performing private banks.
Chase bank took bold steps in 2004 to clean up its non-performing loan book , harsh medicine that tipped the bank into a loss. Since then Chase Bank delivered stronger performances in 2005 and improved results in 2006 that saw pretax profits cross KSh 100 million for the first time in its history The bank
annex 4
EXAMpLES OF THE COMMERCIAL BANK pROFILES CONTAINED IN THE METROpOL ANNUAL REVIEW
needs to move fast and transition from a small, niche banker with a 3 branch operation to a mid sized bank offering customers a differentiated product from the large banks. Chase needs to leverage its position to target new segments where its customers are strong like Dubai, Middle Eastern businessmen; and branch into new areas like SME financing and Islamic banking.
Without the requisite banking size and scale, Chase may need to invite strategic banking partners to increase its national branch and distribution capacity, widen its customer channels; and deepen its capital base. Investments that need deep pockets like an advanced core banking systems lie in its near future. It could be cost effective to share these investments with 2 or 3 smaller banks. Chase could also outsource its IT platform and network Infrastructure entirely to a domestic bank with lots of spare IT capacity, deep pockets and an expanding nationwide network.
Credit bank limited (Cbl) growth in assets, deposits, loans and profits has not kept pace with the industry. CBL remains a small bank with assets of KSh 2.6bn, pretax profits of KSh 90m and shareholders funds of KSh 509 m. Its owners face a capital requirements “gap” of KSh ½ billion over the next 3 years. At current after-tax earnings of KSh 60m (and allowing for modest increases), CBL may not generate the KSh 150m in fresh capital it needs annually to 2010, even if all post-tax profits are retained. The bank’s shareholders face few options: inject KSh ½bn in new capital, merge into a larger bank or be acquired.

UNDERSTANDING THE BANKING SECTOR – STRENGTHENING INFORMATION & ANALYSIS IN KENYA • 23
eSTonia – Start of sample bank-by-bank balance sheet disclosure
annex 5
SAMpLE DISCLOSURES FROM ESTONIAN AND BULGARIAN CENTRAL BANK WEB SITESeSTonia – main annual Disclosure Screen
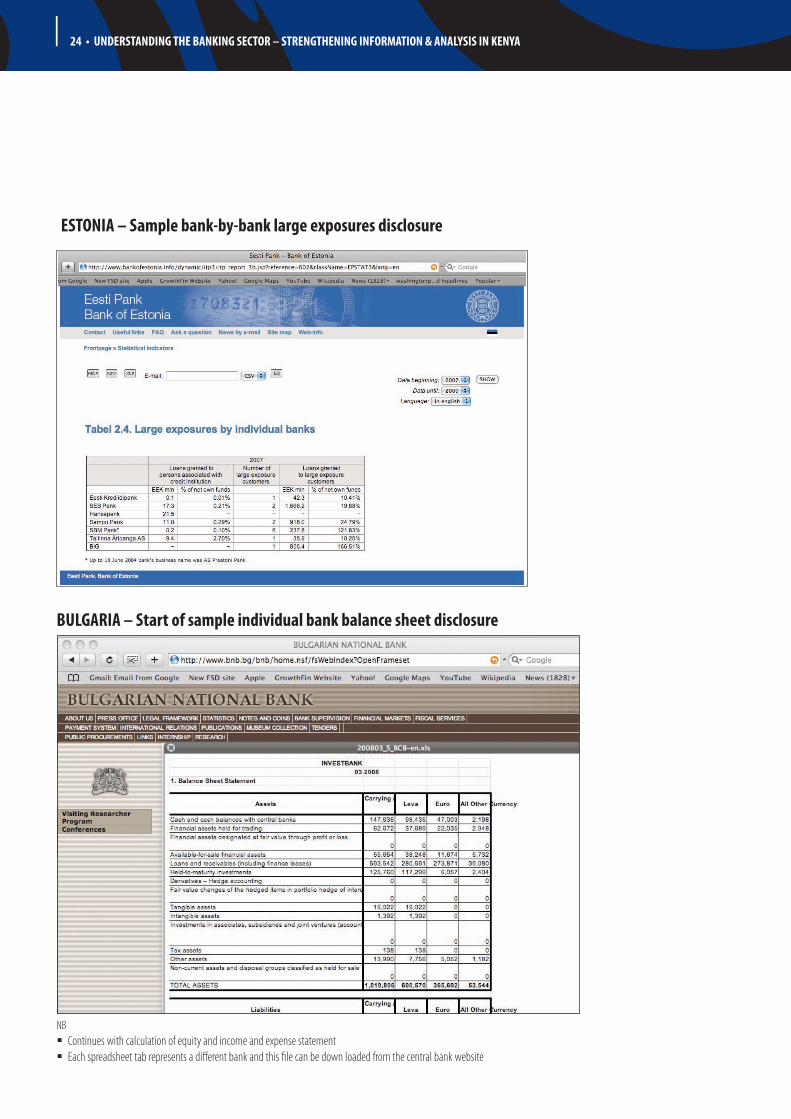
24 • UNDERSTANDING THE BANKING SECTOR – STRENGTHENING INFORMATION & ANALYSIS IN KENYA
eSTonia – Sample bank-by-bank large exposures disclosure
bulgaria – Start of sample individual bank balance sheet disclosure
NBContinues with calculation of equity and income and expense statement �Each spreadsheet tab represents a different bank and this file can be down loaded from the central bank website �

UNDERSTANDING THE BANKING SECTOR – STRENGTHENING INFORMATION & ANALYSIS IN KENYA • 25
Chart 1- Stock of gross loan principal split by bank type
0
50
100
150
200
250
300
350
400
450
500
0
50
100
150
200
250
300
350
400
450
500
31.12.97 31.12.98 31.12.99 31.12.00 31.12.01 31.12.02 31.12.03 31.12.04 31.12.06 31.12.08
Problem private institutions
State-linked institutions
Foreign-owned banks
KES
billi
onKES billion
Performing local private institutions
Chart 2
Page 1
Foreign-owned
banks
State-linked
institutions
Performing local
private institutions
Problem private
institutions
-10
-5
0
5
10
15
20
25
30
-10
-5
0
5
10
15
20
25
30
99
01
03
05
99
01
03
05
99
01
03
05
99
01
03
05
KE
S b
illion
s K
ES
bil
lio
ns
ANNUAL CHANGE IN GROSS LOAN PRINCIPAL SPLIT BY BANK GROUP Chart 2 - yearly change in gross loan principal split by bank type
The two charts below use disclosed balance sheet data to illustrate what sort of bank (broken down by ownership and operating status) have driven the growth during the period of the Economic Recovery Strategy. The first chart shows the split of outstanding gross lending (i.e. Before provisions) and clearly demonstrates the growing role of local private banks that are in compliance with CBK supervisory requirements. The second chart shows this even more starkly by looking at the change in gross lending year by year.
annex 6
SAMpLE CHARTS BASED ON DATA IN OR CLOSE TO THE pUBLIC DOMAIN

26 • UNDERSTANDING THE BANKING SECTOR – STRENGTHENING INFORMATION & ANALYSIS IN KENYA
Chart 3 – Factors behind the evolution of cost - income ratios
operaTing CoST To inCome raTio
54% 59% 56% 54% 60% 54% 53% 51% 49%
Foreign-Owned Banks
51% 57% 59% 62% 64% 59% 65% 67% 62%
Performing Local Private Institutions
74% 81% 86% 81% 79% 79% 80% 77% 69%
State-Linked Institutions
1998 1999 2000 2001 2002 2003 2004 2005 2006
11% 11% 11% 9% 10% 9% 8% 8% 7%
Foreign-Owned Banks
6% 7% 8% 8% 7% 7% 7% 7% 7%
Performing Local Private Institutions
13% 14% 16% 17% 20% 17% 15% 13% 13%
State-Linked Institutions
1998 1999 2000 2001 2002 2003 2004 2005 2006
21% 19% 19% 17% 16% 17% 14% 15% 15%
Foreign-Owned Banks
12% 12% 13% 12% 12% 12% 10% 10% 12%
Performing Local Private Institutions
17% 17% 19% 21% 25% 21% 19% 17% 18%
State-Linked Institutions
1998 1999 2000 2001 2002 2003 2004 2005 2006
operaTing CoSTS aS a perCenTage oF inCome-earning aSSeTS
operaTing inCome aS a perCenTage oF inCome-earning aSSeTS

UNDERSTANDING THE BANKING SECTOR – STRENGTHENING INFORMATION & ANALYSIS IN KENYA • 27
The three-part charts use a different strand of the quarterly disclosures required of banks, namely that related to their income, expenses and profit and merges it with balance sheet data on assets. The charts decompose the cost-income ratio – a classic measure of bank efficiency – for different groups of banks over time and show how one single measure can give a misleading impression of what is really happening across a very heterogenous banking system:
The state-linked banks have always struggled with high cost-income �ratios (top row of the top chart). For most of the last decade their operating costs have absorbed on average close to or above 80% of operating income before bad debts, which left very little slack to absorb loan quality problems. The last two years demonstrated an improving trend, which if sustained and spread across all state-linked banks would represent a fundamental improvement in their long-run viability. The middle chart, however, suggests that (a) this improvement is more longstanding – the ratio of operating costs to income-earning assets had been falling since 2001 – but (b) also gives some cause for concern in that the improving trend in the cost ratio may now have stopped. Therefore the really marked improvement in the average cost-income ratio for state-linked banks in 2006 came from a rising ratio of operating income to income-earning assets (the bottom chart), where they already extract on average more spread and fee income relative to the income earning part of their balance sheet than does the average private bank (foreign or domestically owned). Given this has implications for affordability of services provided by a key part of the retail segment of the Kenyan banking system, the decomposition of the overall cost-income ratio should be of interest to the banks themselves, commentators and policy-makers alike.
The locally-owned private banks as a group show better and more stable �cost-income ratios (middle row of top chart) but based on costs and income being much lower relative to income-earning assets (the bottom two charts). The extra detail was important at the time the chart was first put together by OPM – there was an ongoing debate as to whether to force consolidation of the mostly smaller local private banks by raising minimum capital requirements. With this analysis the case was made
that most of these banks were not showing the diseconomies that might be expected to come from their small scale. They were in fact more cost efficient than larger Kenyan banks at that time (and still largely are) and passed on much of the benefit of this to their customers. Interestingly, it was from this group that Equity emerged as a leading Kenyan retail bank.
The foreign-owned banks display a more complex picture (the bottom �row in each chart). They too have brought down their costs relative to income-earning assets and now match the ratios seen at locally-owned private banks (middle chart). They have, however, better cost-income ratios (top chart) because they extract more combined spread and fee income relative to the income earning portion of their balance sheet. As a result the ratio of operating income to income-earning assets (bottom chart) remains high but it has fallen markedly over the last decade.
The next pair of charts go on to look in more detail at the constraints limiting one part of the banking system – state-linked banks – from matching the rapid private sector credit growth and shows how much they were struggling to cover the costs of past bad lending. To do this they use a mixture of the income, expense and profitability disclosures that lie behind the preceding charts and the additional disclosures of regulatory ratios that must be published at the same time.
The first chart overleaf shows how concentrated the historic non-performing loan (NPL) problem still was even after four years of the Economic Recovery Strategy and the second shows what a burden NPLs were over that period (and before) on the profitability of the group of state-linked banks. Only in 2006 was there enough of a gap between operating income and operating cost to create enough profit before bad debts to just cover the charge to state-linked banks’ profit and loss account resulting from poor loan quality. This gives some of the context to the preceding charts that show the state-linked banks still extracting one and a half times as much in combined spread and fee income as do local private banks relative to their income earning balance sheets – they have to just to cover their high non-performing loan rates.

28 • UNDERSTANDING THE BANKING SECTOR – STRENGTHENING INFORMATION & ANALYSIS IN KENYA
State-linked institutions, KSh 29.7bn
Problem private banks; KSh 0.3bn
Other institutions; KSh 12.2bn
Operating income
Operating expense
Operating pro�t before bad debts
Bad-debt charge
0
5
10
15
20
25
0
5
10
15
20
25
98 99 00 01 02 03 04 05 06 98 99 00 01 02 03 04 05 06
minus
equals
which at last covers
Turning to the issue of affordability of available services, the fact that tariffs must be published and made explicitly available for public inspection gives a good base for analysis. The problem remains of re-organising the different tariff structures adopted by banks to create some meaningful comparability. Here, however, a platform for future work has been created by the Ministry
Chart 4 – Concentration of un-provided npls among state-linked banks (2006)
Chart 5 – Significance of poor loan quality for state-linked bank profitability
of Finance and the CBK, with the former mandating the latter to collect and organise tariff data for the purposes of addressing the issue of high charges. The chart below shows some early work by OPM based on data collected on current account charges at the end of 2004.

UNDERSTANDING THE BANKING SECTOR – STRENGTHENING INFORMATION & ANALYSIS IN KENYA • 29
1221 1207 1907
Foreign-Owned Banks
752 346
1083
Performing Local Private Banks
761 541
1449
State-Linked Problem
Figures in KSh
Institutions
Used for salary Used for savings Retail enterprise
This is a very crude analysis based on stylised assumptions of likely use if price and terms of access were not the constraint on access that they are known to be.10
The next two charts include at least some data that is definitely in the official domain but only borderline in the public domain. The distinction is ambiguous because it is not clear that the data is not in the public domain merely that the banks are not obligated to put it there.
Chart 6 – Calculated charges of standardised current account by bank group
The first chart uses a mixture of balance sheet data on earning assets and income data on expenses and merges it with employee numbers. Earning assets is not a data item that must be disclosed but it can be constructed readily enough from what is disclosed. Operating expenses are unambiguously disclosed and employee numbers are usually disclosed in bank annual reports but are not part of the mandatory additional disclosures. The chart below is based on one designed by OPM to address the issue of how the banking market in Kenya was segmented at the start of the Economic Recovery Strategy (2002).
10 The three sets of columns in the chart show the calculated cost in terms of fees and commissions that each group of banks would on average charge for: running a current account with a minimum balance of KSh 10,000 to receive pay electronically �once a month, write a couple of cheques and make one standing order payment per month as well as one ATM withdrawal per week;running a current account as a very basic flexible savings account with a minimum balance of KSh �5,000 that allows one deposit and a couple of withdrawals per month;running a retail enterprise current account with a minimum balance of KSh 50,000 to write ten �cheques and pay a couple of standing orders per month as well as to deposit KSh 5,000 of cash takings three times a week.

30 • UNDERSTANDING THE BANKING SECTOR – STRENGTHENING INFORMATION & ANALYSIS IN KENYA
Chart 7 – Factors behind operating cost to earning assets ratio in 2002
KCB
POSB
Barclays / Stanbic
Stan. Chart
Co-op
NBK
HFCK
ConB DBK
IDB
10% cost ratio
5% cost ratio
Citibank off-scale
20% cost ratio
0
1
2
3
4
5
6
7
0 10 20 30 40 50 60 70
Ope
ratin
g co
st p
er e
mpl
oyee
(200
2, K
Shs
m)
Average income earning assets per employee (2002, KShs m)
The chart above plots costs per employee and earning assets per employee.
As expected most of the foreign-owned banks had very high earning assets per employee but also quite high costs. This did not prove that they deliberately confined themselves to the top and upper-middle ends of market but it was circumstantial evidence that they fitted there. By contrast the state-linked banks had much lower earning assets per employee but their operating costs per employee were also lower than the foreign-owned average. Some of the difference could be explained by residual underemployment of staff but by 2002 – the starting point for this analysis – these banks had shed most of the surplus staff they were going to. Therefore it seemed as if they really were positioned differently – dealing with lower average balance customers that created quite a lot of work for staff so total operating costs per employee had to be kept down to help keep cost ratios from being unsupportably high.
By contrast the local, private banks – almost all then with very small branch networks – were largely operating with either the same low costs per employee but higher earning assets than the state-linked banks or the same
earning assets per employee as the foreign-owned banks but lower costs per employee. This meant that most of them were operating with cost to asset ratios in the 5-10% range and could fairly be described as operating on the then efficiency frontier for Kenyan banks. Indeed, they could be described as operating relatively close to the efficiency frontier for commercial banks in most developing countries (a cost ratio of around 5%) whereas the banking system as a whole definitely could not. As already noted, however, both state-linked and foreign-owned banks have made progress in reducing costs relative to income-earning assets and they have done this by increasing earning assets per employee faster than they have allowed costs per employee to grow.
The other chart produced with data close but not formally in the public domain also addresses the issue of whether the former state-controlled banks still have a special role to play in maintaining access but from a completely different angle. The two-part chart below shows the number of bank branches (circle size) per constituency, with constituencies plotted by their population density (bottom axis) and relative poverty (side axis).
Type of bank Bubble size Foreign State Local niche banks 1 branch 5 branches 50 branches (all private)
KEY

UNDERSTANDING THE BANKING SECTOR – STRENGTHENING INFORMATION & ANALYSIS IN KENYA • 31
Chart 8 (a) – branch numbers per constituency by population density and poverty - State-linked versus private banks
Chart 8 (b) – branch numbers per constituency by population density and poverty - Specialist pro-access banks
<==
Med
ian
– |
M
edia
n +
==>
<== Nairobi / Mombasa
HIGH DENSITY LOW POVERTY
HIGH DENSITY HIGH POVERTY
<= Median + Median – => Ultra sparse ==>
LOW DENSITY LOW POVERTY
LOW DENSITY HIGH POVERTY
15
25
35
45
55
65
75
85
1 10 100 1,000 10,000 100,000
Poverty ratio (proportion of population below poverty line)
Population Density (population per Km2)
LEGEND: Bubble size shows number of branches per constituency:
1 branch only
10 branches
20 branches
100 branches
STATE FI PRIVATE outlets outlets
<==
Med
ian
– |
M
edia
n +
==>
<== Nairobi / Mombasa
HIGH DENSITY LOW POVERTY
HIGH DENSITY HIGH POVERTY
<= Median + Median – => Ultra sparse ==>
LOW DENSITY LOW POVERTY
LOW DENSITY HIGH POVERTY
15
25
35
45
55
65
75
85
1 10 100 1,000 10,000 100,000
Poverty ratio (proportion of population below poverty line)
Population Density (population per Km2)
LEGEND: Bubble size shows number of branches per constituency:
1 branch only
10 branches
20 branches
100 branches
The first part of the chart shows how commercial banks limit themselves to the relatively better off and well populated areas. As a consequence access to branches in poorer more sparsely populated constituencies still relies very heavily on state-linked institutions. The second part suggests that the explicitly pro-access banks such as Equity, Co-op, K-Rep and Family Finance mostly deepen access in relatively densely populated and better off areas; a very important activity but not the same as combating geographic exclusion.
This next two charts use relatively non-sensitive data that is in the official domain but not generally publicly available. The first set of charts uses Deposit Guarantee Scheme data on retail deposits with total balances below the deposit insurance limit and looks at which sort of bank services them. The mix of supply is compared between mid 2002 and mid 2006.

32 • UNDERSTANDING THE BANKING SECTOR – STRENGTHENING INFORMATION & ANALYSIS IN KENYA
24 27 28
Foreign-Owned Banks
12 11 10
Performing Local Private Institutions
14 18 23
State-Linked Institutions
478 386 373
302 671
1169
758 808 924
30.06.02 31.12.04 30.06.06 30.06.02 31.12.04 30.06.06
NUMBERS OF ACCOUNTS AV BALANCE (KSH 000s)
FOREIGN-OWNED
BANKS
31%
PERFORMING LOCAL
PRIVATE
19%
CO-OP BANK / KCB
34%
REMAINING STATE-
LINKED
15%
MIX AT
MID-2002
FOREIGN-
OWNED BANKS
15%
PERFORMING LOCAL
PRIVATE
47%
CO-OPERATIVE BANK /
KCB
32%
REMAINING STATE-
LINKED
6%
MIX AT
MID-2006
These deposit charts were designed to show the degree to which private “performing” banks (i.e. Those with sound financials) could and were taking over from state-linked banks as the main providers of mass-market retail deposits. The degree to which this has shown to be true is very marked. Even within the state-linked group of banks there had been a switch away from those that were under continuing state control and those that had by the end of the period largely escaped it (KCB and Co-op in particular).
Chart 9 – Changing mix of supply for retail deposits (under KSh 100,000)
The next chart shows a similar presentation of trends in the value of lending to agriculture forestry and fisheries by bank type over broadly the same period as the deposit charts. This too is based on official domain data – this time returns to the CBK Research Department.

UNDERSTANDING THE BANKING SECTOR – STRENGTHENING INFORMATION & ANALYSIS IN KENYA • 33
These last charts have been based on individual bank-by-bank data that is not in the public domain but have been aggregated so as not to reveal individual bank performance. Even if it is decided that individual bank data of this sort should not be released there are ways of structuring these data so that they are revealed only in a grouped way such that no single bank could combine its own data with the grouped data to reveal the confidential data of a competitor.
7.2% 8.8% 6.9% 8.7%
Foreign-Owned Banks
5.3% 4.8% 4.1% 4.8%
Performing Local Private Institutions
14.6% 14.6% 14.6% 13.0%
PORTFOLIO SHARE State-Linked
Institutions
6.4 8.5 8.1 11.2
3.5 3.8 4.2 6.0
13.1 12.8 15.5 13.9
KSH BILLIONS .
31.12.02 31.12.03 31.12.04 31.12.05 31.12.02 31.12.03 31.12.04 31.12.05
Chart 10 – Trends in supply of bank finance for agriculture, forestry and fishing

34 • UNDERSTANDING THE BANKING SECTOR – STRENGTHENING INFORMATION & ANALYSIS IN KENYA
NOTES

UNDERSTANDING THE BANKING SECTOR – STRENGTHENING INFORMATION & ANALYSIS IN KENYA • 35
NOTES

36 • UNDERSTANDING THE BANKING SECTOR – STRENGTHENING INFORMATION & ANALYSIS IN KENYA
NOTES


[email protected] • www.fsdkenya.orgFSD Kenya is an independent Trust established to support the development of inclusive financial markets in Kenya 4th Floor Kenya Re Towers • Off Ragati Road, Upper Hill • P.O. Box 11353, 00100 Nairobi, Kenya T +254 (20) 2718809, 2718814 • m +254 (724) 319706, (735) 319706
FSD KenyaFinancial Sector Deepening