understanding the characteristics and establishing ... · understanding the characteristics and...
TRANSCRIPT

Understanding the Characteristics and Establishing Acceptance Criteria for
Analytical Methods Validation
Ying Verdi
IVT LAB WEEK EUROPE
June 2017
Partners in Health Since 1919
Regulatory View of Method Characteristics
Statistics Behind Method Validation
Statistical Tools
Establishing Acceptance Criteria Based on Method Characteristics
2
3

• Guidance for Industry: Analytical Procedures and Methods Validation for Drugs and Biologics (July 2015)
• ICH Q2(R1): VALIDATION OF ANALYTICAL PROCEDURES: TEXT AND METHODOLOGY
• ICH Q6A: Specifications (Dec 2000, Aug 1999)
• ICH Q3A, Q3B, ICH M7
• ICH Q8 (R2): Pharmaceutical Development (Nov 2009)
• ICH Q9: Quality Risk Management (Jun 2006)
• ICH Q10: Pharmaceutical Quality System (Apr 2009)
• 21CFR Part 211.165 (e)
• EMEA Guidance on Validation of Analytical Procedures: Text and Methodology
4
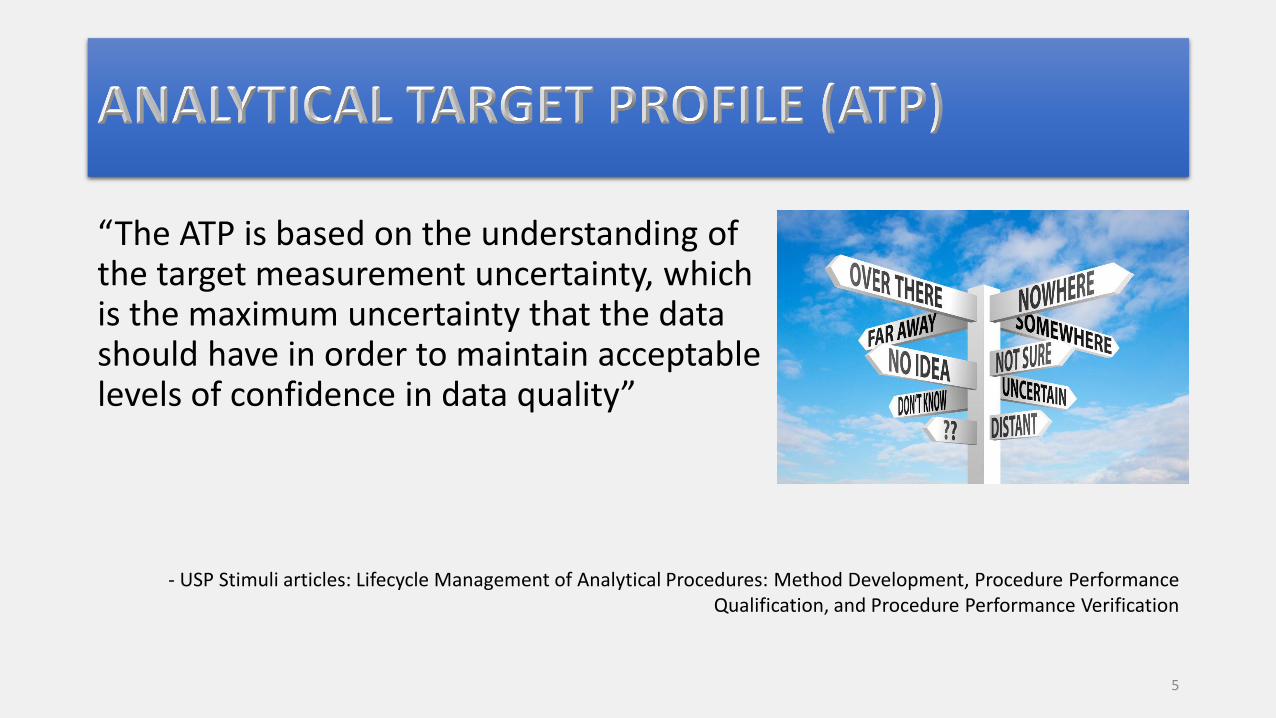
“The ATP is based on the understanding of the target measurement uncertainty, which is the maximum uncertainty that the data should have in order to maintain acceptable levels of confidence in data quality”
5
- USP Stimuli articles: Lifecycle Management of Analytical Procedures: Method Development, Procedure Performance Qualification, and Procedure Performance Verification
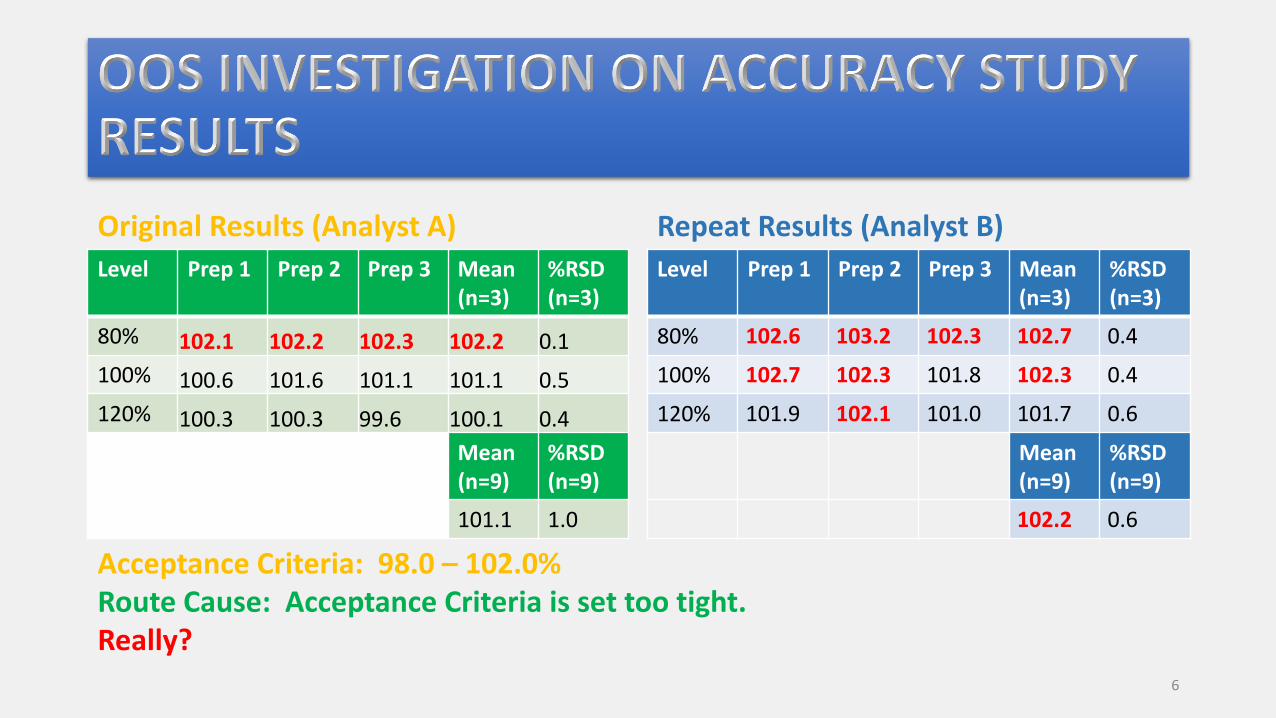
Original Results (Analyst A)
Level Prep 1 Prep 2 Prep 3 Mean(n=3)
%RSD (n=3)
80% 102.1 102.2 102.3 102.2 0.1
100% 100.6 101.6 101.1 101.1 0.5
120% 100.3 100.3 99.6 100.1 0.4
Mean (n=9)
%RSD (n=9)
101.1 1.0
Repeat Results (Analyst B)
Level Prep 1 Prep 2 Prep 3 Mean(n=3)
%RSD (n=3)
80% 102.6 103.2 102.3 102.7 0.4
100% 102.7 102.3 101.8 102.3 0.4
120% 101.9 102.1 101.0 101.7 0.6
Mean (n=9)
%RSD (n=9)
102.2 0.6
Acceptance Criteria: 98.0 – 102.0%Route Cause: Acceptance Criteria is set too tight. Really?
6

7

8

Validation
Parameter
RSD (n=5)
NMT 2.0%
RSD (overall)
NMT 2.0%
Tailing
NMT 2.0
Check
Standard
98.0 – 102.0%
Accuracy &
Specificity run0.1 0.1 1.3 99.9
9
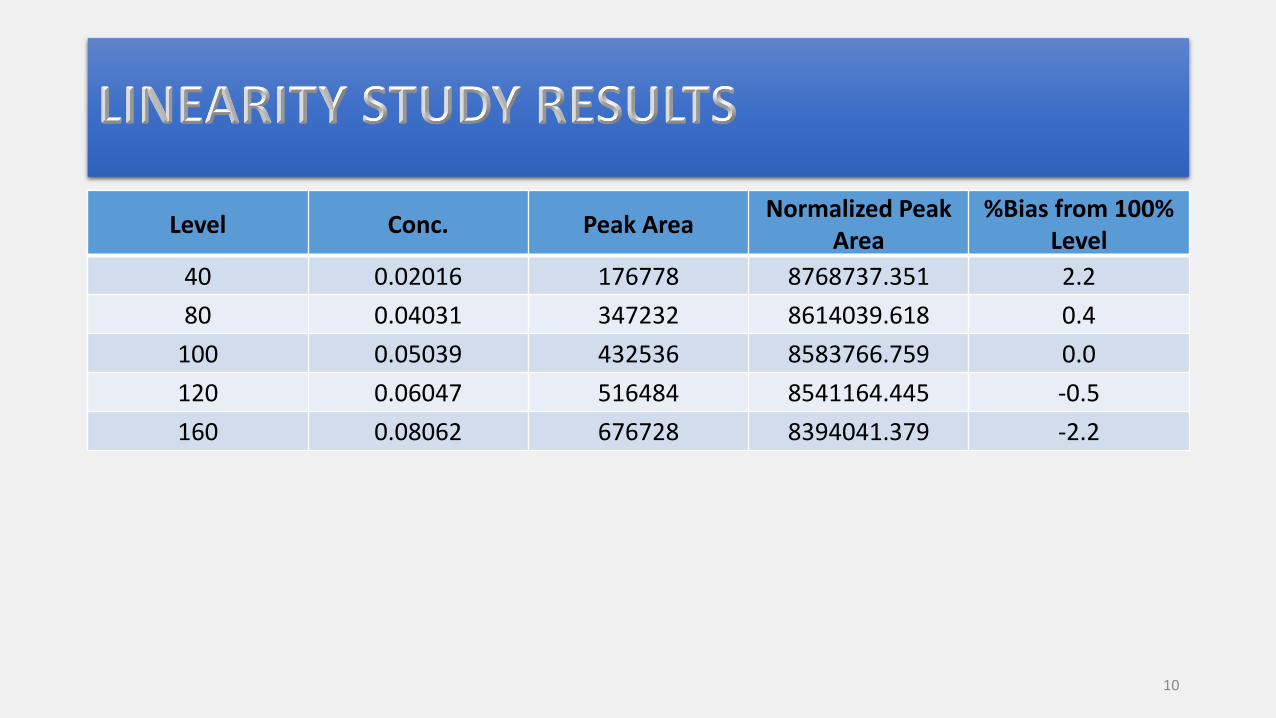
Level Conc. Peak AreaNormalized Peak
Area%Bias from 100%
Level
40 0.02016 176778 8768737.351 2.2
80 0.04031 347232 8614039.618 0.4
100 0.05039 432536 8583766.759 0.0
120 0.06047 516484 8541164.445 -0.5
160 0.08062 676728 8394041.379 -2.2
10
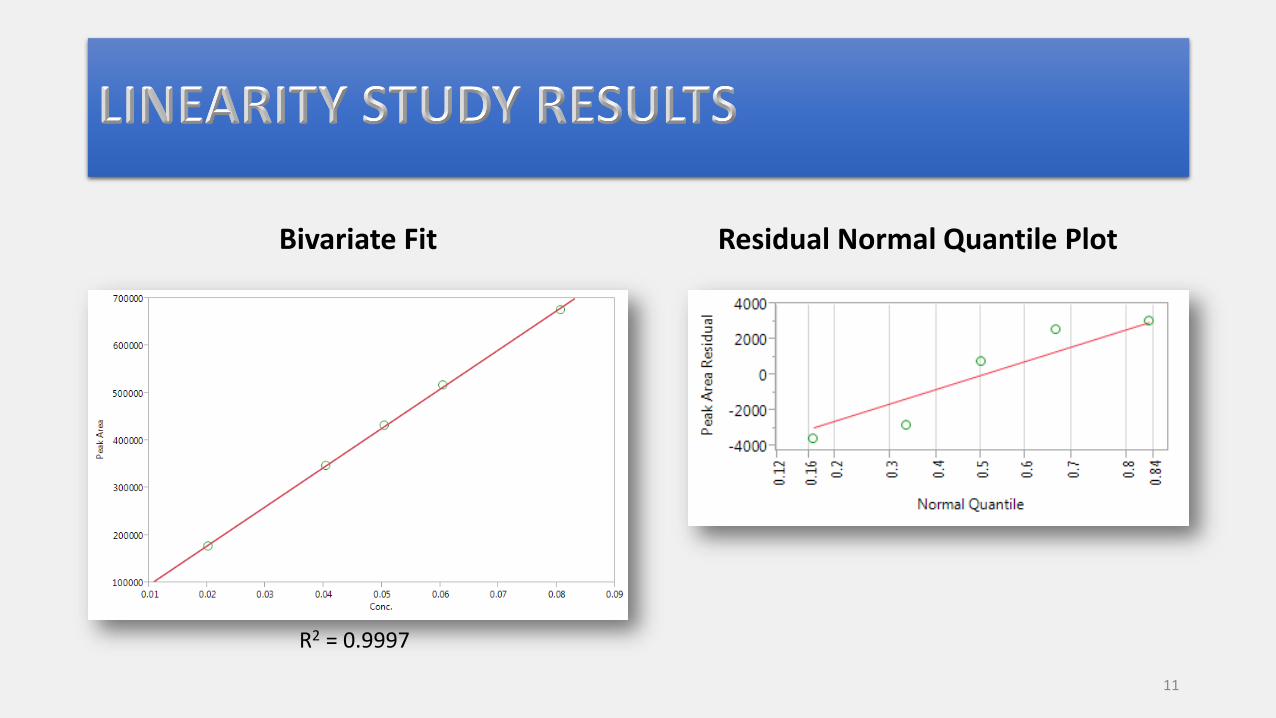
Bivariate Fit Residual Normal Quantile Plot
R2 = 0.9997
11

• Sample Prep• Place 20 tablets into a
100-mL vol. flask
• Add 50 mL diluent, sonicate 10 min
• Cool to room temp
• QS with diluent, mix
• Dilute 10:50
12

• Unlikely causes of OOS results• Standard prep
• Spiking solution
• Instrument precision
• Analyst training
• Acceptance criteria
• Likely root cause of OOS results• Placebo displacement
• Placebo displacement study confirmed the root cause
• Sample preparation modification
13

Level Prep 1 Prep 2 Prep 3 Mean (n=3) %RSD (n=3)
80% 100.5 100.0 99.9 100.1 0.3
100% 99.6 99.3 98.9 99.3 0.3
120% 99.4 99.4 99.6 99.5 0.2
Mean (n=9) %RSD (n=9)
99.6 0.5
14

Cliffs of
Moher
15
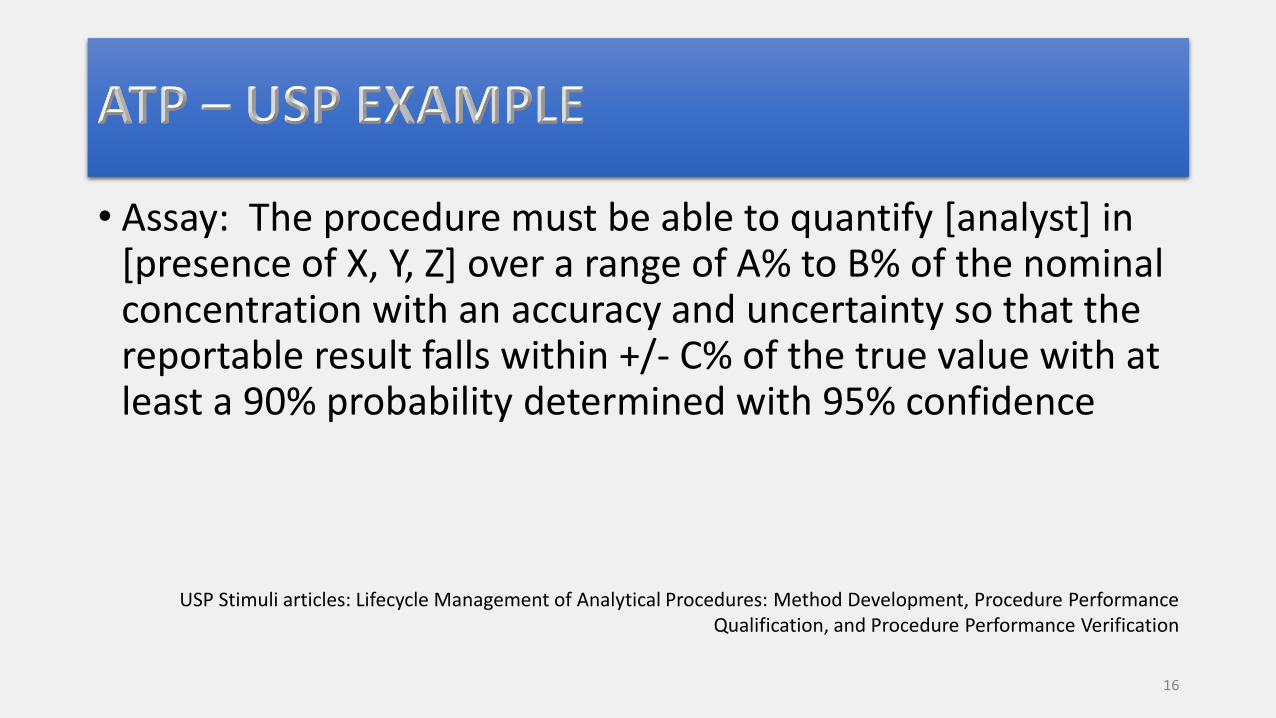
• Assay: The procedure must be able to quantify [analyst] in [presence of X, Y, Z] over a range of A% to B% of the nominal concentration with an accuracy and uncertainty so that the reportable result falls within +/- C% of the true value with at least a 90% probability determined with 95% confidence
USP Stimuli articles: Lifecycle Management of Analytical Procedures: Method Development, Procedure Performance Qualification, and Procedure Performance Verification
16

17
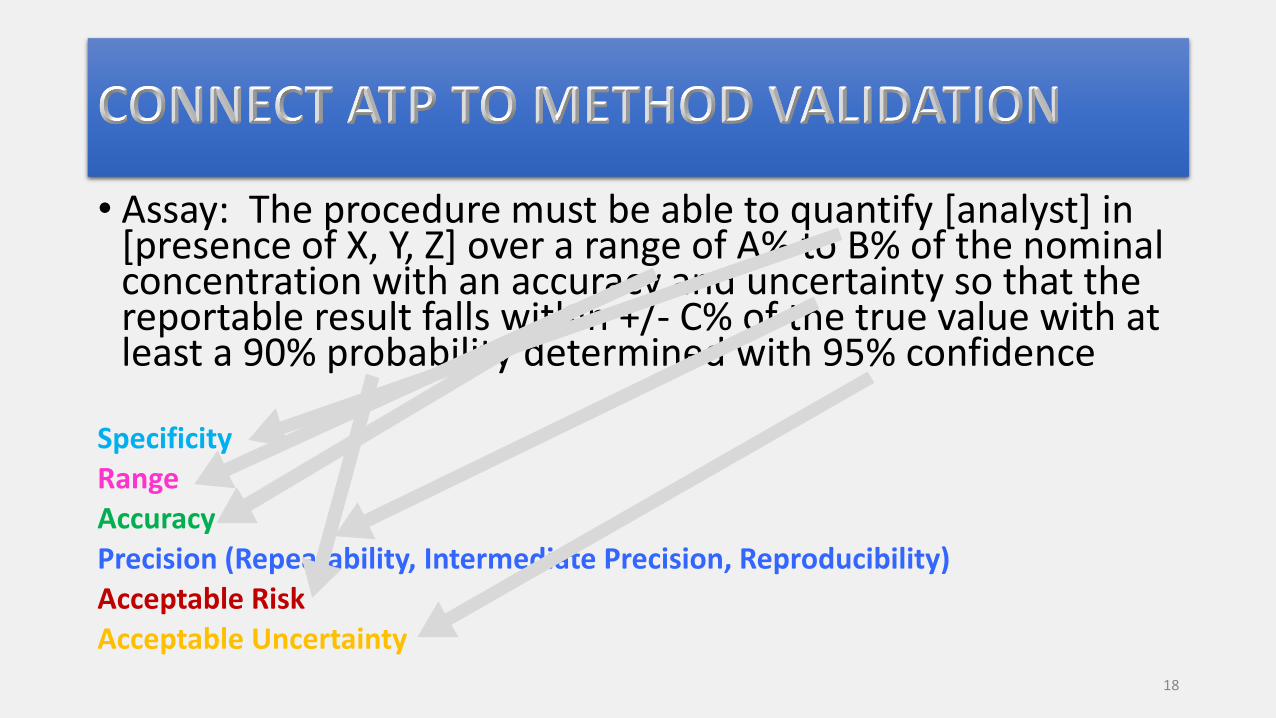
• Assay: The procedure must be able to quantify [analyst] in [presence of X, Y, Z] over a range of A% to B% of the nominal concentration with an accuracy and uncertainty so that the reportable result falls within +/- C% of the true value with at least a 90% probability determined with 95% confidence
Specificity
Range
Accuracy
Precision (Repeatability, Intermediate Precision, Reproducibility)
Acceptable Risk
Acceptable Uncertainty
18

USP <1225> ICH Q2(R1) FDA Guidance
Accuracy
Precision• Repeatability• Intermediate Precision• Reproducibility
Specificity
DL
QL
Linearity
Range
Robustness * *
* Can be done during method development
19

Method Performance Characteristics Defined by ICH and USP
Accuracy, Specificity, Linearity System Variability
Precision, DL, QL Inherent Random Variability
Range, Robustness N/A
• There are two types of method performance characteristicso systematic variability (bias)o inherent random variability (noise)
20
21
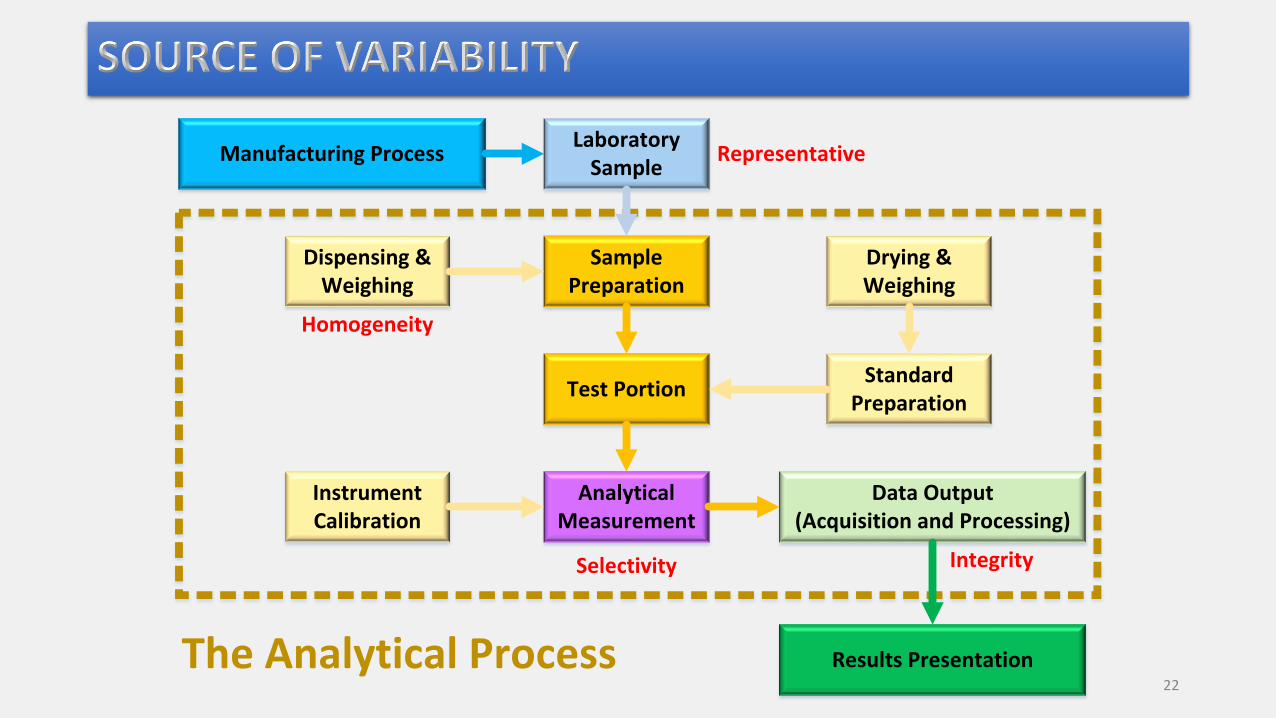
Sample Preparation
Standard Preparation
Instrument Calibration
Analytical Measurement
Data Output(Acquisition and Processing)
Results Presentation
Manufacturing ProcessLaboratory
Sample
Test Portion
Drying & Weighing
Dispensing & Weighing
Representative
Homogeneity
IntegritySelectivity
22
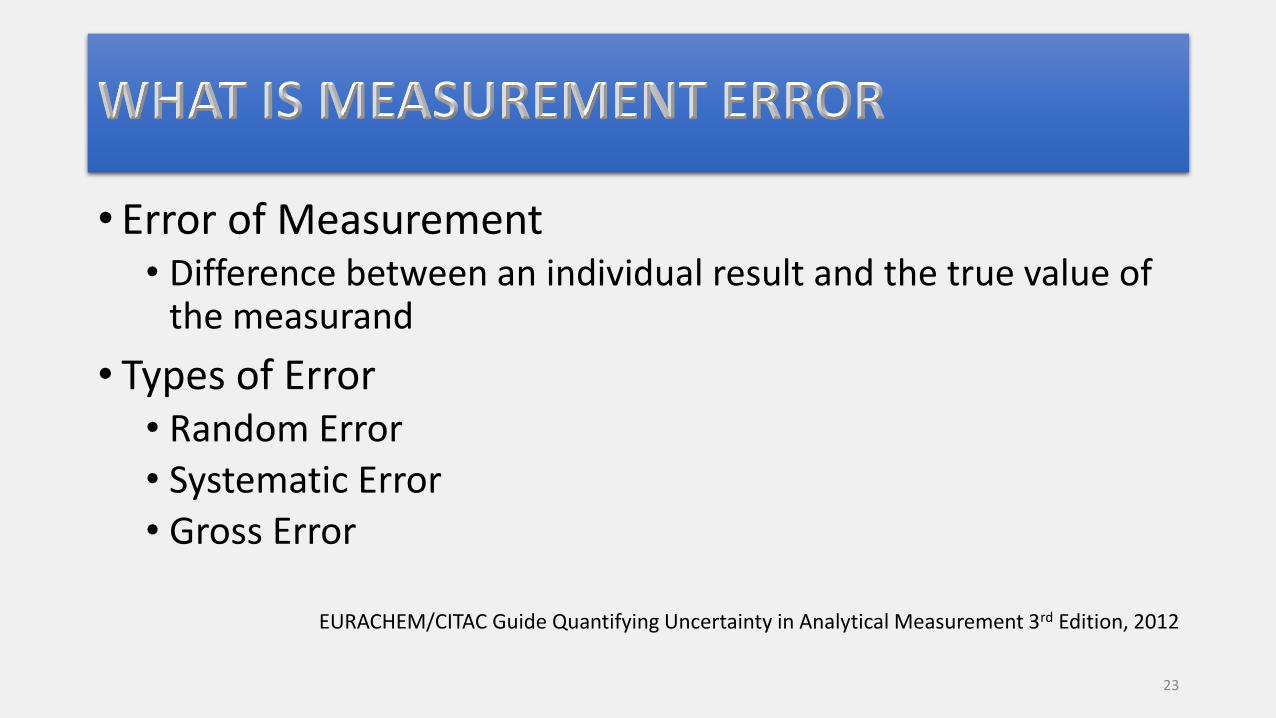
• Error of Measurement• Difference between an individual result and the true value of
the measurand
• Types of Error• Random Error• Systematic Error• Gross Error
EURACHEM/CITAC Guide Quantifying Uncertainty in Analytical Measurement 3rd Edition, 2012
23

• Random Error (Noise)• In replicate measurements varies in an
unpredictable manner
• Systematic Error (Bias)• In replicate measurements remains
constant or varies in a predictable manner
• Gross errors• Only abandonment of the experiment
and a fresh start is an adequate cure
24
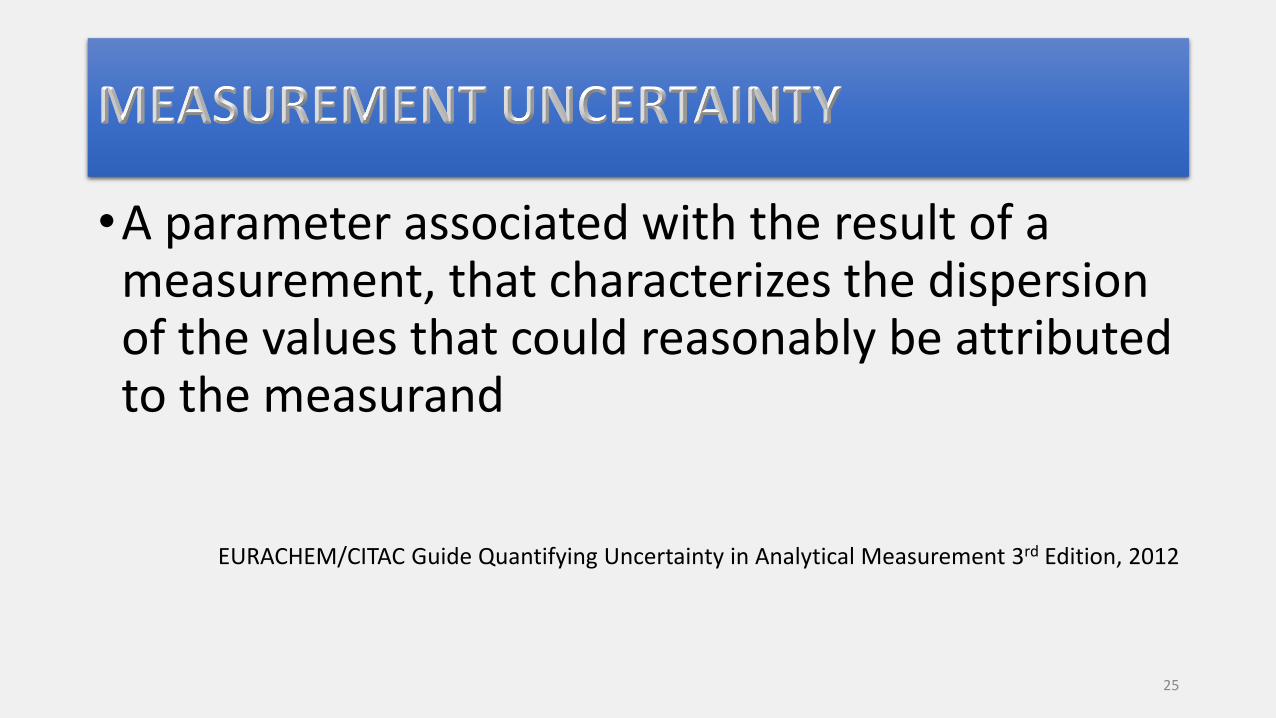
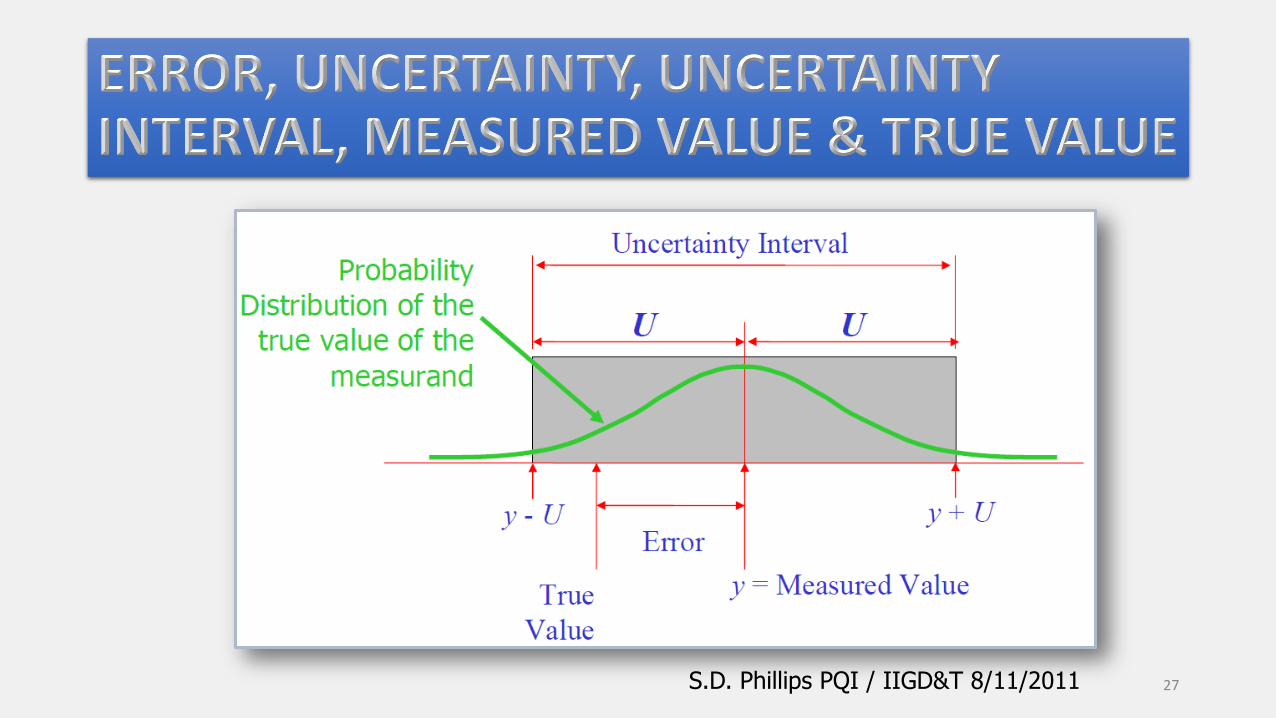
•A parameter associated with the result of a measurement, that characterizes the dispersion of the values that could reasonably be attributed to the measurand
EURACHEM/CITAC Guide Quantifying Uncertainty in Analytical Measurement 3rd Edition, 2012
25

Error Uncertainty
A single value A range or interval
The value of a known error can be applied as a correction to the result
The value of the uncertainty cannot be used to correct a measurement result
26
S.D. Phillips PQI / IIGD&T 8/11/2011 27

“ There are known knowns; there are things we know that we know. There are known unknowns; that is to say, there are things that we now know we don't know. But there are also unknown unknowns –there are things we do not know we don't know. ”
— United States Secretary of Defense, Donald Rumsfeld
28

Profit
Conforms to Specification
Passed Inspection
Loss
Does not Conform to Specification
Passes Inspection
Type II Error
Loss
Conforms to Specification
Fails Inspection
Type I Error
Loss
Does not Conform to Specification
Fails Inspection
Reality
Mea
sure
d R
esu
lt
29

• Type A Method of evaluation of uncertainty by the statistical analysis of series of observations• Normal distribution
• Type B Method of evaluation of uncertainty by means other than the statistical analysis of series of observations• Rectangular distribution
• Triangular distribution
30

DistributionRectangular (Uniform)
Triangular Normal
Shape
Most Conservative
31
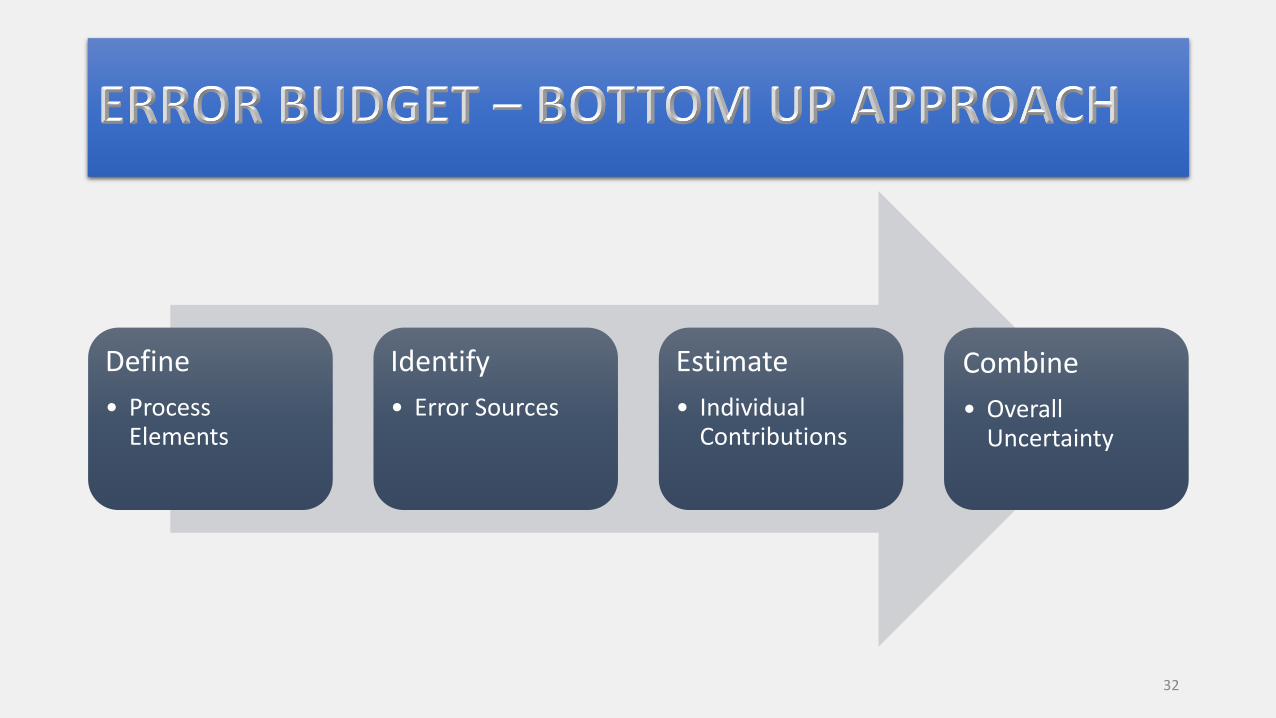
Define
• Process Elements
Identify
• Error Sources
Estimate
• Individual Contributions
Combine
• Overall Uncertainty
32
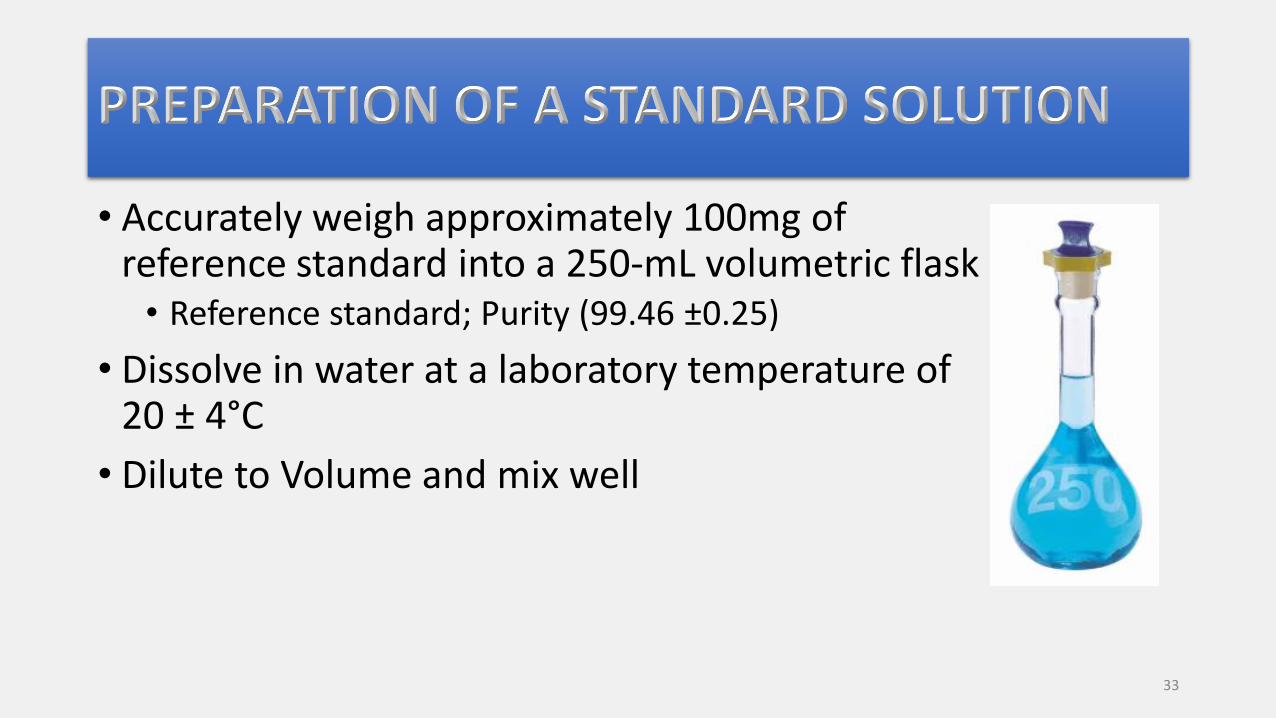
• Accurately weigh approximately 100mg of reference standard into a 250-mL volumetric flask• Reference standard; Purity (99.46 ±0.25)
• Dissolve in water at a laboratory temperature of 20 ± 4°C
• Dilute to Volume and mix well
33
34
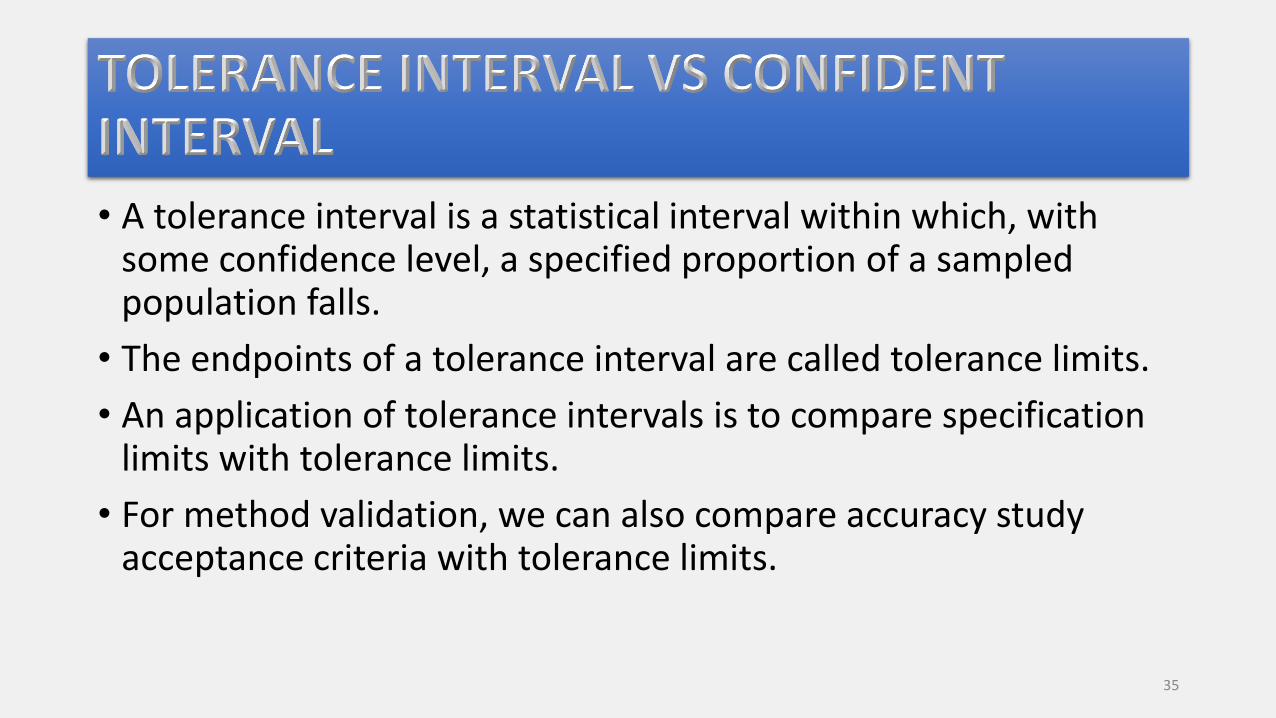
• A tolerance interval is a statistical interval within which, with some confidence level, a specified proportion of a sampled population falls.
• The endpoints of a tolerance interval are called tolerance limits.
• An application of tolerance intervals is to compare specification limits with tolerance limits.
• For method validation, we can also compare accuracy study acceptance criteria with tolerance limits.
35
• Confidence limits are limits within which we expect a given population parameter, such as the mean, to lie.
• Statistical tolerance limits are limits within which we expect a stated proportion of the population to lie.
36
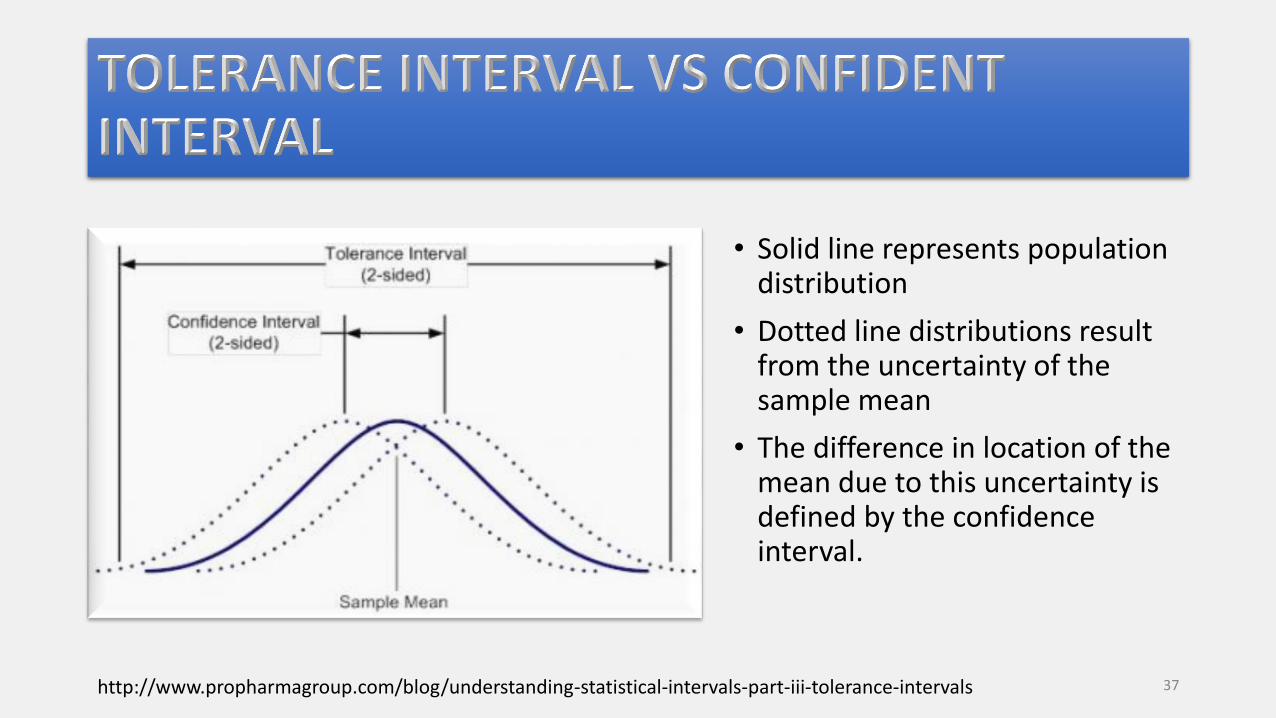
• Solid line represents population distribution
• Dotted line distributions result from the uncertainty of the sample mean
• The difference in location of the mean due to this uncertainty is defined by the confidence interval.
http://www.propharmagroup.com/blog/understanding-statistical-intervals-part-iii-tolerance-intervals 37
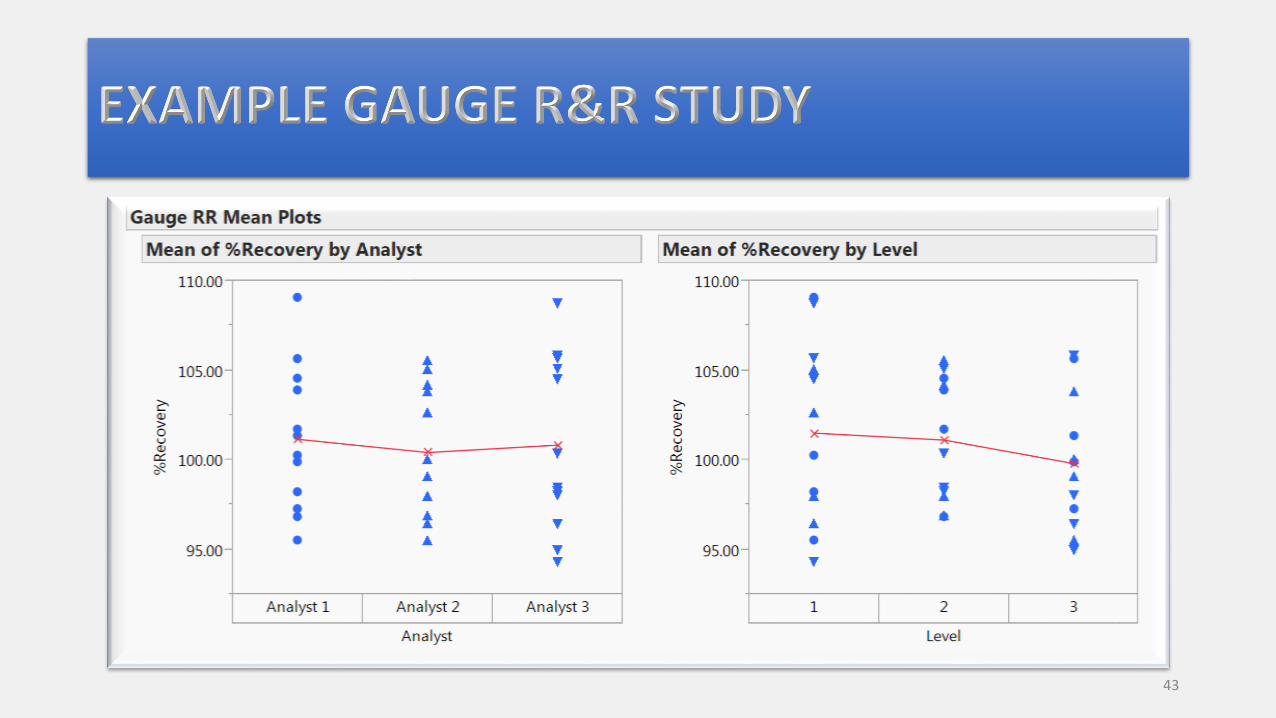
• ANOVA gauge R&R measures the amount of variability induced in measurements by the measurement system itself, and compares it to the total variability observed to determine the viability of the measurement system. (Wikipedia)
• The Gauge R&R method analyzes how much of the variability in your measurement system is due to operator variation (reproducibility) and measurement variation (repeatability).
• Gauge is the measurement device
38

• Collect a random sample of parts over the entire range of part
sizes from your process.
• Select several operators at random to measure each part
several times.
• Method validation: Precision
39

Ass
ay R
esu
lt
ProcessVariability
Method Variability
Accuracy(Bias)
Precision
Repeatability
Reproducibility
Gauge R&R
40

Analyst Spiking Level Prep 1 Prep 2 Prep 3 Prep 4
1 80% 100.2 109.0 98.2 95.5
1 100% 96.8 101.7 103.8 104.5
1 120% 101.3 105.6 99.9 97.3
2 80% 105.0 96.5 102.6 98.0
2 100% 104.1 105.6 98.0 96.8
2 120% 103.8 99.1 100.0 95.5
3 80% 108.7 94.3 105.6 104.5
3 100% 98.4 100.3 98.2 105.0
3 120% 94.9 98.0 96.4 105.7
41

42
43

44

Which one contributed more variability to the results, analyst or method itself?
45

46

•Based on combination of the following• Intended Use•Customer requirements•Historical data•Risk tolerance• Statistical analysis
•Specified in protocol
47

Test Result
Test Method Variability
Raw Material Attributes
Manufacturing Process
Variability
Sampling Variability
Storage Conditions &
Duration
Before method validation, ask yourself this question: How much variability can I have for my method?
48
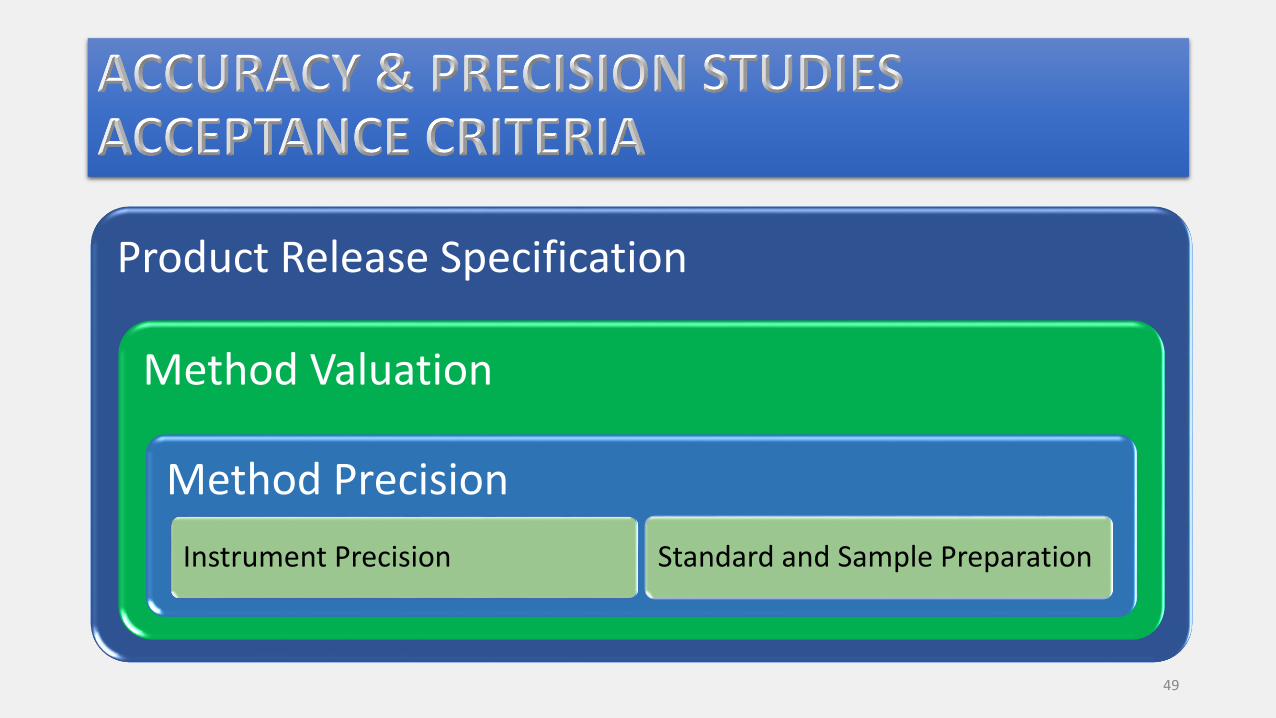
Product Release Specification
Method Valuation
Method Precision
Instrument Precision Standard and Sample Preparation
49

USP <621> SYSTEM SUITABILITY
50

51

Analyst Spiking Level Prep 1 Prep 2 Prep 3 Prep 4
1 80% 100.2 109.0 98.2 95.5
1 100% 96.8 101.7 103.8 104.5
1 120% 101.3 105.6 99.9 97.3
2 80% 105.0 96.5 102.6 98.0
2 100% 104.1 105.6 98.0 96.8
2 120% 103.8 99.1 100.0 95.5
3 80% 108.7 94.3 105.6 104.5
3 100% 98.4 100.3 98.2 105.0
3 120% 94.9 98.0 96.4 105.7
52

Analyst 1 Analyst 3
Analyst 2 All Analysts
What will be the MV Acceptance Criteria?
53

Standard Concentration
Re
spo
nse
Standard Concentration
Re
spo
nse
Standard Concentration
Re
spo
nse
Standard Concentration
Re
spo
nse
54

• “The quantitation limit of an individual analytical procedure is the lowest amount of analyte in a sample which can be quantitatively determined with suitable precision and accuracy. The quantitation limit …… is used particularly for the determination of impurities and/or degradation products.”
- ICHQ2(R1)
• QL ≤ Reporting Threshold
55

56
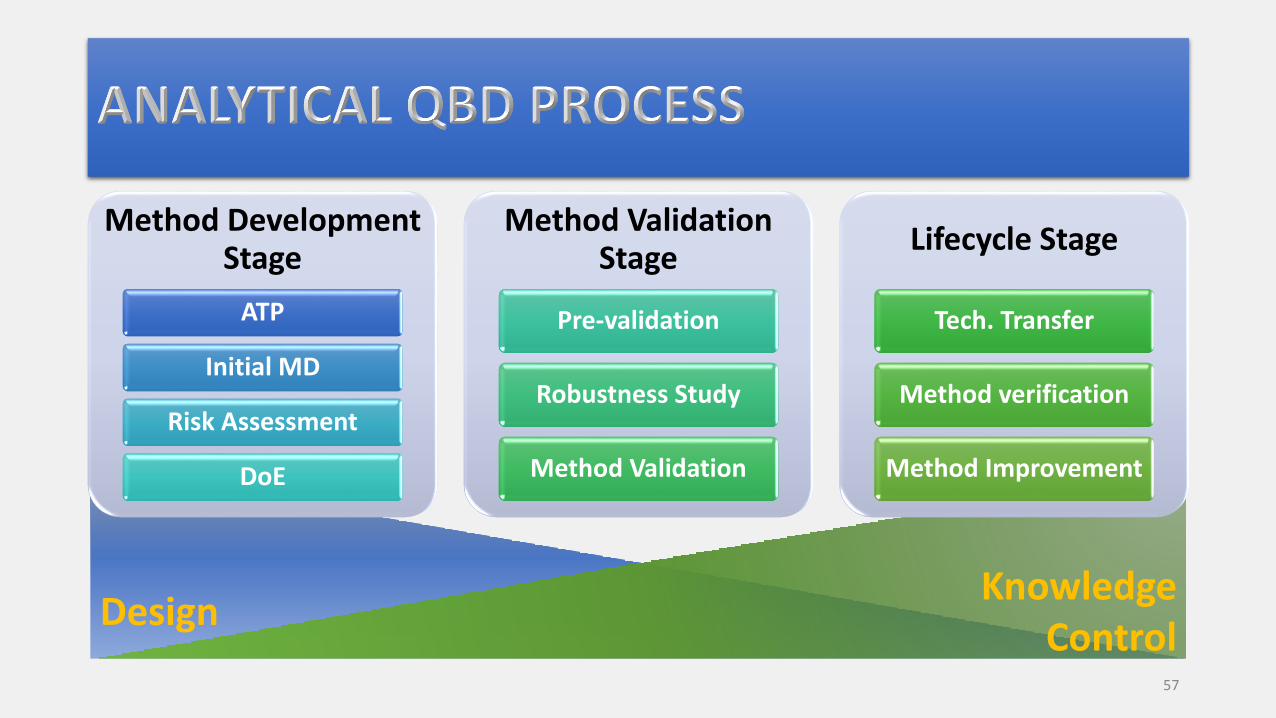
DesignKnowledge
Control
Method Development Stage
ATP
Initial MD
Risk Assessment
DoE
Method Validation Stage
Pre-validation
Robustness Study
Method Validation
Lifecycle Stage
Tech. Transfer
Method verification
Method Improvement
57

• Starting with end goal in mind
• Identify critical method parameters, understand them and control them
• Set appropriate acceptance criteria for method validation to demonstrate quality performance characteristics
• Achieve cost-effective method and generate quality data
58

59