understanding the decline of u.s. manufacturing employment
TRANSCRIPT
Upjohn Institute Working Papers Upjohn Research home page
6-1-2018
Understanding the Decline of U.S. Manufacturing Employment Understanding the Decline of U.S. Manufacturing Employment
Susan N. Houseman W.E. Upjohn Institute for Employment Research, [email protected]
Upjohn Author(s) ORCID Identifier:
https://orcid.org/0000-0003-2657-8479
Upjohn Institute working paper ; 18-287
Follow this and additional works at: https://research.upjohn.org/up_workingpapers
Part of the Labor Economics Commons
Citation Citation Houseman, Susan N. 2018. "Understanding the Decline of U.S. Manufacturing Employment." Upjohn Institute Working Paper 18-287. Kalamazoo, MI: W.E. Upjohn Institute for Employment Research. https://doi.org/10.17848/wp18-287
This title is brought to you by the Upjohn Institute. For more information, please contact [email protected].

Upjohn Institute working papers are meant to stimulate discussion and criticism among the
policy research community. Content and opinions are the sole responsibility of the author.
Understanding the Decline of U.S. Manufacturing Employment
Upjohn Institute Working Paper 18-287
Susan N. Houseman
Upjohn Institute for Employment Research
e-mail: [email protected]; phone: (269) 395-0434
January 2018
Revised June 2018
ABSTRACT
U.S. manufacturing experienced a precipitous and historically unprecedented decline in
employment in the 2000s. Many economists and other analysts—pointing to decades of statistics
showing that manufacturing real (inflation-adjusted) output growth has largely kept pace with
private sector real output growth, that productivity growth has been much higher, and that the
sector’s share of aggregate employment has been declining—argue that manufacturing’s job
losses are largely the result of productivity growth (assumed to reflect automation) and are part
of a long-term trend. Since the 1980s, however, the apparently robust growth in manufacturing
real output and productivity have been driven by a relatively small industry—computer and
electronic products, whose extraordinary performance reflects the way statistical agencies
account for rapid product improvements in the industry. Without the computer industry, there is
no prima facie evidence that productivity caused manufacturing’s relative and absolute
employment decline. This paper discusses interpreting labor productivity statistics, which
capture many factors besides automation, and cautions against using descriptive evidence to
draw causal inferences. It also reviews the research literature to date, which finds that trade
significantly contributed to the collapse of manufacturing employment in the 2000s, but finds
little evidence of a causal link to automation.
JEL Classification Codes: J21, F66, J24
Key Words: manufacturing, productivity, price deflators, trade, offshoring, outsourcing,
automation
Acknowledgments: An earlier version of this paper was prepared for the conference on
“Restoring American Economic Dynamism,” Museum of Finance, New York, November 28,
2017, and for the “Manufacturing Forum,” Economic Policy Institute, Washington, DC, January
12, 2018. I am indebted to Tim Bartik, Larry Mishel, Chad Syverson, and participants at those
conferences for input on this work and to Lillian Vesic-Petrovic for research assistance.

1
The manufacturing sector experienced a precipitous and historically unprecedented
decline in employment in the 2000s, which coincided with a surge in imports, weak growth in
exports, and a yawning trade deficit. The plight of U.S. manufacturing featured prominently in
the 2016 presidential election, with candidates Donald Trump and Bernie Sanders arguing that
globalization had severely damaged U.S. factories. This argument resonated in many American
communities and may have played a role in the election of President Trump. Making good on
campaign promises, the president pulled out of the Trans-Pacific Partnership agreement,
proposed renegotiating the North American Free Trade Agreement, and has begun levying tariffs
on imports, raising concerns about a trade war.
Countering this view, many economists, policymakers, and pundits cite manufacturing
output and productivity statistics to assert that American manufacturing has never been stronger.
They point out that although manufacturing employment had been relatively stable before 2000,
its share of U.S. employment had been in decline for decades. Often making analogies to the
agricultural sector, they contend that automation, not globalization, largely explains
manufacturing’s relative employment declines and steep job losses in recent years.1
This perspective often is presented as the consensus view among economists and taken as
fact in media reports. Typical is a New York Times article published in late 2016 in which
reporter Binyamin Appelbaum asserts, “From an economic perspective . . . there can be no
revival of American manufacturing, because there has been no collapse. Because of automation,
there are far fewer jobs in factories. But the value of stuff made in America reached a record
high in the first quarter of 2016, even after adjusting for inflation.”
1 See, for example, Lawrence and Edwards (2013), Muro (2016), and DeLong (2017). Atkinson et al.
(2012, pp. 27–28) includes a long list of notable economists and policymakers who subscribe to this view.

2
Regardless of whether the view represents a consensus, it reflects a misreading of the
data and research evidence. The apparently robust growth in manufacturing inflation-adjusted
(real) output and productivity are driven by a relatively small sector—computers and electronic
products, which account for only about 13 percent of value-added in manufacturing. Without the
computer and electronic products industry (hereafter referred to simply as “the computer
industry”), real value-added or GDP growth in manufacturing was less than half that of the
private sector average from 1979 to 2000, and only 12 percent in the 2000s. And without the
computer industry, manufacturing labor productivity generally has been no higher or only
somewhat higher than that of the private sector.
The computer industry, in turn, is an outlier and statistical anomaly. Its extraordinary
output and productivity growth reflect the way statistical agencies account for improvements in
selected products produced in this industry, particularly computers and semiconductors. Rapid
productivity growth in this industry—and by extension the above-average productivity growth in
the manufacturing sector—has little to do with automation of the production process. Nor is
extraordinary real output and productivity growth an indicator of the competitiveness of
domestic manufacturing in the computer industry; rather, the locus of production of the
industry’s core products has shifted to Asia.
Manufacturing’s declining employment share has mirrored its declining share of output
(nominal GDP) and to a large degree reflects the fact that, in most manufacturing industries,
there has been relatively little growth in the amount of goods made in American factories for the
past 40 years. The recent precipitous decline in manufacturing employment is a distinct
phenomenon, and a growing body of research examines whether—and the extent to which—
international trade can explain it. Although none of the studies comprehensively examine the

3
various mechanisms by which trade and the broader forces of globalization may impact
employment, collectively they find that trade has played a significant role in the collapse of U.S.
manufacturing employment in the 2000s. In contrast, research to date finds little support for the
hypothesis that automation was responsible for the sudden decline.
In the remainder of the paper, I elaborate on these points. I close with a brief discussion
of the consequences of the large job losses in manufacturing for workers and regional economies
and consider lessons for policy.
THE COLLAPSE OF MANUFACTURING EMPLOYMENT IN THE 2000s
Figure 1 depicts employment in the manufacturing sector from 1947 to 2016 and the
number of manufacturing establishments from 1977 to 2014.2 Manufacturing employment
trended upward in the years following World War II, peaking at over 19 million in 1979. From
1979 to 1989, the year of the next business cycle peak, manufacturing shed 1.4 million jobs, or
7.4 percent of its base. The job losses were concentrated in the primary metals and textile and
apparel industries. The oil price hikes of the 1970s and early 1980s dampened demand for steel
at a time when developing countries were expanding capacity. The resulting excess global
capacity led to downsizing in the United States and other advanced economies. The declines in
apparel and textiles reflected the shift in production in these labor-intensive industries to
developing countries.
2 Changes in industry classification systems, particularly the shift from the Standard Industrial
Classification (SIC) system to the North American Classification System (NAICS) implemented in the late 1990s or
early 2000s (depending on the data series), have made historical analysis of trends in manufacturing and other
sectors difficult. The Bureau of Economic Analysis recently constructed a consistent time series for industries or
sectors from 1947 to the present for data on employment (breakdowns for manufacturing industries since 1977),
nominal and real GDP, and GDP price deflators. Most of the analyses in this paper make use of this consistent time
series. The number of manufacturing establishments plotted in Figure 1 comes from the Census Bureau’s Business
Dynamics Statistics.

4
Employment in manufacturing was relatively stable in the 1990s. Although measured
employment declined by about 700,000, or 4 percent, from 1989 to 2000, the net decline in jobs
can be entirely explained by the outsourcing of tasks previously done in-house. For example, the
number of temporary help workers assigned to manufacturers increased by an estimated one
million over the period. Although these workers are the legal employees of temporary help
agencies and so are counted in the services sector, they work in the factories side-by-side with
manufacturing employees. Had these workers been counted in manufacturing, manufacturing
employment would have risen by an estimated 1.3 percent rather than declining (Dey,
Houseman, and Polivka 2012).
Evidence suggests that other types of domestic outsourcing, although not well measured,
partly explain the decline in manufacturing employment since World War II. Berlingieri (2014)
estimates that domestic outsourcing accounted for 25 percent of manufacturing’s employment
decline from 1948 to 2002. Although manufacturers have continued to outsource in the 2000s,
this factor likely has played a relatively small role in the recent declines in manufacturing
employment (Dey, Houseman, and Polivka 2012, 2017).
The precipitous decline in manufacturing employment in the 2000s is historically
unprecedented. Between the business cycle peaks of 2000 and 2007, manufacturing employment
declined by 3.4 million, or 20 percent. Although employment in manufacturing, a cyclically
sensitive sector, often drops sharply during recessions, the early 2000s marked the first period in
which employment in the sector did not entirely or largely recover during the subsequent
expansion. Manufacturing employment was hard-hit again during the Great Recession of 2008–
2009, rebounding only slightly during the ensuing recovery. From 2007 to 2016, manufacturing
employment declined on net by 1.5 million. In total, since 2000, manufacturing employment has

5
fallen by nearly 5 million, or by over 28 percent. Unlike the declines experienced in the 1980s,
the job losses have been broad-based, affecting all industries. Widespread plant closures
accompanied the employment declines. As shown in Figure 1, from 2000 to 2014, the number of
manufacturing establishments dropped by more than 78,000, a 22 percent decline.
Not only was the sharp decline in manufacturing employment historically unprecedented
in the United States, the magnitude of the decline was unique among the world’s leading
manufacturing economies, according to an analysis by the U.S. International Trade Commission
(Benedetto 2018). Over the 1998 to 2014 period, manufacturing employment significantly
expanded in China and in South Korea. Although manufacturing employment shrank by almost 9
percent in Germany during this period, the drop was far less than in the United States and,
Benedetto notes, was accompanied by a 4.8 percent decrease in the German working age
population. Among the five leading manufacturing economies, only Japan experienced a similar
percentage decline in manufacturing employment as the United States, but its working age
population declined by over 9 percent over the period—in contrast to the United States, where
the working age population grew by more than 16 percent.
THE PUZZLE
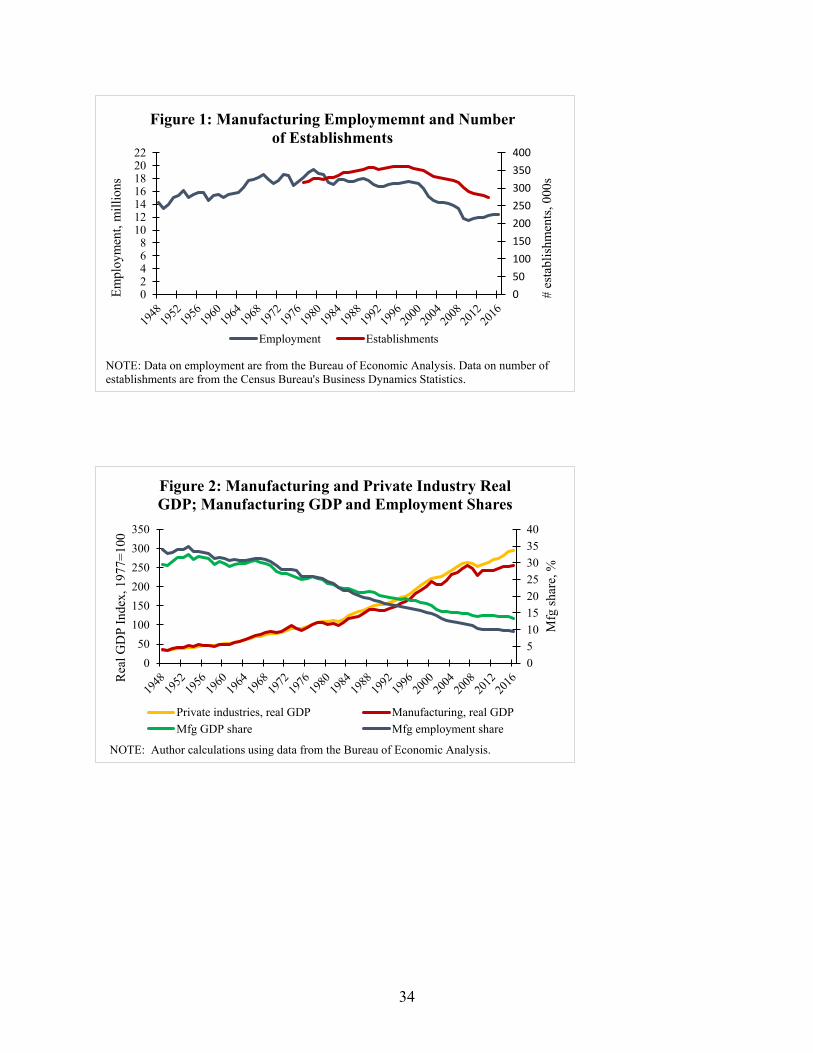
Reflecting stable or declining employment in the manufacturing sector, the share of U.S.
private sector employment in manufacturing has dropped steadily, and relative declines have
been particularly prominent since the 1980s. Manufacturing employment as a share of private
sector employment peaked at 35 percent in 1953; by 2016, that share had fallen to just under 10
percent. Manufacturing’s share of private sector GDP has experienced a parallel decline:
manufacturing’s contribution to private sector GDP peaked at 33 percent in 1953, and by 2016

6
its share was just 13 percent. The trends in these shares are depicted in the right scale of Figure
2. Together, they suggest that performance in the manufacturing sector has been weak relative to
the rest of the economy.
Figure 2 also depicts indices of real GDP for the private sector and for manufacturing
(left scale). Although manufacturing output is more cyclically sensitive than the average for the
private sector, real GDP growth in manufacturing has largely kept pace with that of the private
sector overall. This fact is somewhat paradoxical in view of manufacturing’s declining
employment and GDP shares. Only since the Great Recession has real GDP growth been
considerably slower in manufacturing than in the aggregate economy.
If real GDP growth for manufacturing has kept pace with real GDP growth in the
aggregate economy yet manufacturing’s share of private sector GDP is falling, then it must be
the case that the average price growth of manufactured goods has been slower than the average
price growth for the goods and services produced in the economy. Figure 3, which displays an
index of GDP price deflators for manufacturing and for the private sector, confirms this pattern.
The slower growth in price deflators for manufacturing is evident since about 1980. In addition,
if real GDP growth has kept pace with real GDP growth in the aggregate private sector yet
manufacturing’s share of private sector employment is falling, it follows that labor productivity
growth is higher in manufacturing than the average for the private sector.
RECONCILING MANUFACTURING’S DECLINING SHARES WITH ROBUST
OUTPUT GROWTH: THE PREVAILING NARRATIVE
Manufacturing’s declining share of private sector employment results because
manufacturing employment is growing more slowly than the aggregate private sector
7
employment. Using the fact that labor productivity is defined as output per unit labor, these
differential growth rates can be expressed by the following identity:
(1) ∆𝑙𝑛(𝐿𝑇) − ∆𝑙𝑛(𝐿𝑀) = (∆𝑙𝑛(𝐺𝐷𝑃𝑇) − ∆𝑙𝑛(𝐺𝐷𝑃𝑀)) − (∆𝑙𝑛(𝑃𝑟𝑑𝑇) − ∆𝑙𝑛(𝑃𝑟𝑑𝑀))
In an accounting sense, the difference in the growth rates of labor employed in the aggregate
private sector and in manufacturing (LT and LM) is equal to the difference in the growth rates of
real GDP less the difference in the growth rates of labor productivity. If manufacturing’s real
GDP growth rate is approximately the same as the average for the private sector, as indicated in
Figure 2, then all, or virtually all, of manufacturing’s declining employment share is accounted
for by higher labor productivity growth.
Although research economists widely recognize that such accounting identities and other
descriptive evidence cannot be used to infer causality, many have taken it as strong prima facie
evidence that higher productivity growth in manufacturing—implicitly or explicitly assumed to
reflect automation—has largely caused the relative and absolute declines of manufacturing
employment. Even when some role for trade is recognized, it is deemed small, and the decline is
taken as inevitable (e.g., DeLong 2017).
Yet productivity growth, which is necessary for improvements in living standards, does
not by itself cause employment declines. Productivity growth should lead to higher inflation-
adjusted wages, and higher productivity growth in manufacturing should lead to declining prices
for manufactured goods relative to other goods and services. This, in turn, stimulates demand for
manufactured products. To meet higher demand for their products, manufacturers produce
more—potentially fully (or more than fully) offsetting the adverse effects of higher labor
productivity on employment. To reconcile higher manufacturing productivity growth with
declining relative and absolute employment, therefore, it must also be the case that consumer

8
demand for manufactured goods is limited and so not very responsive to the declining prices.
Analogies are often made to agriculture, where people’s food consumption is limited and where
mechanization has displaced most farm workers.
AN ALTERNATE RECONCILIATION: MEASUREMENT ISSUES
The arguably anomalous patterns depicted in Figure 2—sharply declining manufacturing
share of GDP coupled with robust growth in real GDP in manufacturing—imply that price
inflation is much lower in manufacturing than in the aggregate economy. One might suppose that
there is something unusual about price deflators in manufacturing. Indeed, the apparently strong
growth in real manufacturing output is driven by the computer and electronic products industry
and reflects the fact that price deflators for certain key products in the industry, namely
computers and semiconductors, are adjusted to reflect rapidly improving product quality. For
much of the recent past, these price deflators have been sharply declining. Although the
computer industry has accounted for less than 15 percent of value-added in manufacturing
throughout the period, it has an outsized effect on measured real output and productivity growth
in the sector, skewing these statistics and giving a misleading impression of the health of
American manufacturing.3
Figure 3 depicts price indices used to deflate private industry and manufacturing GDP.
Figure 4 shows price indices for private industry and manufacturing, omitting the computer
industry, and for the computer industry by itself.4 The price index for the computer industry rises
3 The discussion on the computer industry here and below follows analysis in Houseman, Bartik, and
Sturgeon (2015). 4 In the late 1990s, the BEA began using chained indexes for its real output and price indices in lieu of
fixed-weight, constant dollar indices. The chained indices effectively allow the composition of the basket of goods

9
until 1968 and falls thereafter, with particularly steep declines in the 1990s.5 Without the
computer industry, the price indices for the private sector and manufacturing display similar
trends. Although price inflation for manufacturing without computers has been somewhat lower
than the average for the private sector in some years—most notably in the early 1980s and early
2000s—overall the differences are small.
Figure 5 displays indices of real GDP in the private sector and manufacturing, as
published and omitting the computer industry. Unsurprisingly, omitting the computer industry
has little effect on measured real GDP growth in manufacturing initially. From 1947 to 1979, the
average real growth of manufacturing was 99 percent of that of real GDP growth in the private
sector; omitting the computer industry from each, the rate of real output growth in manufacturing
falls to 94 percent of the private sector average growth. The computer industry, however, has had
large effects on measured real GDP in manufacturing since the 1980s, reflecting the rapid
development of semiconductor and computer technology. From 1979 to 2000, measured real
GDP growth in manufacturing was 97 percent of the average for the private sector; when the
computer industry is dropped from both series, manufacturing’s real GDP growth rate is just 45
percent that of the private sector average.
Output growth substantially slowed in both manufacturing and the private sector in the
2000s. In the published series displayed in Figure 2, real output growth in manufacturing was
somewhat higher in manufacturing than in the private sector between the business cycle peaks of
and services to change smoothly over time. Although they avoid biases associated with the old fixed-weight indices,
they are computationally more difficult to work with. To back out the computer industry from aggregate price
indices and real GDP measures using published data, I employ a Törnqvist index, as described in Houseman, Bartik,
and Sturgeon (2015, p. 157). 5 Whelan (2000) notes that in the mid-1980s the Bureau of Economic Analysis began to apply hedonic
methods developed by economist Zvi Griliches to construct price deflators for computers. The application of this
method, which endeavors to account for the value buyers attach to product quality changes, led to more rapid
declines in their price deflators.

10
2000 and 2007; netting out the computer industry from both series, real output growth in
manufacturing was about 60 percent that in the private sector. Interestingly, without the
computer industry, the average rate of real GDP growth in manufacturing was approximately the
same over the 2000–2007 period, 1.4 percent per year, as it had been over the 1979–2000 period.
While most manufacturing industries experienced lower and in some cases negative real GDP
growth in the early 2000s, this was counterbalanced by especially large increases in real GDP
growth in the transportation and, to a lesser degree, chemicals industries. I discuss the special
case of the motor vehicles industry during this period further below.
Since the Great Recession, real output growth in manufacturing has been noticeably
lower than average private-sector real output growth. Just as, in prior years, rapidly declining
computer industry price deflators were responsible for the fact that manufacturing’s output
growth largely kept pace with that in the aggregate economy, a dramatic slowing of the decline
in these price deflators and, correspondingly, of real output growth in the computer industry,
significantly contributed to the differential growth rates between manufacturing and the
aggregate private sector since the last recession.6 In published statistics, whereas private sector
output was about 11 percent higher in 2016 compared to 2007, manufacturing output was
approximately the same. Netting out the computer industry, manufacturing output was more than
6 percent lower in 2016 than in 2007.
Over the entire 2000–2016 period, real GDP growth in manufacturing was 63 percent of
the average private sector growth. Omitting the computer industry from each series,
6 Byrne, Oliner, and Sichel (2015) detail the slowdown in the decline of the semiconductor industry’s price
deflators, and Schmalensee (2018) shows the contribution the computer industry to manufacturing’s lower labor
productivity growth during the period.

11
manufacturing’s measured real output growth is near zero (about 0.2 percent per year) and just
12 percent of the average for the private sector in the 2000s.
Figure 6 repeats the series displayed in Figure 5 that omit the computer industry and adds
real output growth for the computer industry. The figure illustrates why this industry has such an
outsized effect on measured real output growth in manufacturing. Real GDP growth in the
computer industry is a different order of magnitude than that for either the private sector or the
manufacturing industry series, which omit the computer industries and appear as near horizontal
lines along the x-axis because of the different scale needed on the y-axis to accommodate the
extraordinary growth in the computer industry. From 1977, the base year in this graph, to 2016
real output in the private sector less computers grew by 169 percent, real output in manufacturing
less computers grew by 45 percent, while real output in the computer industry increased by
19,257 percent.
WHAT EXPLAINS THE EXTRAORDINARY OUTPUT GROWTH IN THE
COMPUTER AND SEMICONDUCTOR INDUSTRY?
As indicated earlier, the answer to the question of what explains the large and sustained
growth in computers and semiconductors lies in the way that the statistical agencies, through the
construction of price indices, account for the rapid technological advances in the products
produced in this industry. The semiconductors embedded in our electronics are much more
powerful today than they were a decade or even a year ago. Likewise, the computers and related
devices that consumers and businesses buy today have much greater functionality than in the
past. If, for example, buyers are willing to pay 15 percent more for a new computer model that
boasts greater speed and more memory than last year’s model, then 100 of the new computers
would be the equivalent of 115 of the previous year’s model. The rapid output growth in this

12
industry does not necessarily imply that American factories are producing many more
computers, semiconductors, and related products—they may be producing less. Instead, it
reflects the fact that the quality of the products produced is better than in the past. The statistical
agencies adjust price deflators for other products, such as autos, for changes in quality. However,
the effects of quality adjustment in other industries on aggregate statistics, to date, have generally
been small compared to those of the computer industry.
It follows that the rapid productivity growth accompanying output growth in the
computer industry has little if anything to do with automation: production of computers and
semiconductors has been automated for many years. Rather, rapid productivity growth in the
industry—and, by extension, the above-average productivity growth in manufacturing—largely
reflects improvements in high-tech products.
Nor is the rapid growth in measured computer and semiconductor output a good indicator
of the international competitiveness of domestic manufacturing of these products. As detailed in
Houseman, Bartik, and Sturgeon (2015), the locus of production of these products has been
shifting to Asia, and the large employment losses in this industry reflect offshoring and foreign
competition.
It should be emphasized that the statistical agencies are correct to adjust prices for
improvements in product quality. The adjustments, however, can be highly sensitive to
methodology and idiosyncratic factors. A change in Intel’s pricing strategy for older-generation
semiconductors is partly responsible for the slowdown, as explained in Byrne, Oliner, and Sichel
(2015). The slowdown in the rate at which price deflators are falling has sparked a debate over
whether the size of the quality adjustments for the computer and semiconductor industry has
been too great or too little. Because these adjustments potentially have large effects at both

13
industry and aggregate levels on measured real output and productivity growth, it is an important
area for future research.
Such quality adjustment, however, can make the numbers difficult to interpret. Because
the computer industry, though small in dollar terms, skews the aggregate manufacturing statistics
and has led to much confusion, figures that exclude this industry, as shown in Figure 5, provide a
clearer picture of trends in manufacturing output.
PRODUCTIVITY GROWTH AND INTERPRETING DECOMPOSITIONS THAT
SHOW PRODUCTIVITY’S CONTRIBUTION TO EMPLOYMENT GROWTH
The computer industry also has a large influence on measured productivity in the
manufacturing sector. For various time horizons from 1987 to 2011, Baily and Bosworth (2014)
estimate labor and multifactor productivity growth for the private sector, for aggregate
manufacturing and for manufacturing excluding the computer industry. They find that while
labor and multifactor productivity growth are considerably higher in manufacturing, when the
computer industry is dropped from the calculations, these productivity measures are virtually
identical to average productivity growth for the private sector over all time periods examined. As
noted from Equation (1), if real GDP growth equals the average growth for the private sector,
then productivity growth accounts for all of the relative decline in manufacturing employment.
Conversely, if, excluding the computer industry, real GDP growth is lower in manufacturing than
in the private sector and labor productivity growth is the same, labor productivity growth can
account for none of the relative decline in employment in most of manufacturing.
Since 1977, the Bureau of Economic Analysis has published an industry employment
series that is consistent with its industry real and nominal output series. Although employment is
a crude measure of labor input because it does not control for differences in hours worked, it

14
allows me to construct the decompositions using Equation (1) for a relatively long-time horizon
and show the sensitivity of these decompositions to inclusion of the computer industry. The top
panel of Table 1 decomposes the difference in the average employment growth rate for private
industry and manufacturing into the part accounted for by differences in growth rates and the
part accounted for by differences in labor productivity. The bottom panel shows this
decomposition when the computer industry is omitted from the private sector and manufacturing
numbers. From the top panel, over the entire period from 1977 to 2016, average annual
employment growth in manufacturing was about 0.025 log points (approximately 2.5 percent)
lower than average employment growth in the private sector. Only 15 percent of the differential
is accounted for by lower output growth in manufacturing, while higher manufacturing labor
productivity accounts for 85 percent of its higher employment growth. When the computer
industry is omitted from both series, 61 percent of the lower manufacturing employment growth
is accounted for by manufacturing’s lower output growth, and just 39 percent by its higher labor
productivity growth.7 The decompositions are highly sensitive to the inclusion of the computer
industry in all subperiods, whose starting and ending years (except for 2016) are business cycle
peaks.
The point of this exercise is to show that there is no prima facie evidence that
productivity growth is entirely or primarily responsible for the relative and absolute decline in
manufacturing employment. Although such decompositions underlie the narrative that
productivity growth, in the form of automation, has caused the relative decline in manufacturing
employment, they are fraught with measurement problems, and the direction of causality is
7 Unlike Baily and Bosworth (2014), I find somewhat higher labor productivity growth in manufacturing
compared to the private sector when the computer industry is omitted from both series. Some of the difference
likely reflects the fact that BEA made significant revisions to the industry accounts data, which particularly affected
growth in the computer industry, following the publication of the Baily and Bosworth paper.

15
unclear. If output growth in manufacturing is low relative to the private sector, for instance, it
could be because of slower demand growth (domestic or global) or the loss of international
competitiveness, as evidenced by the growth in the share of imported products or by slow export
growth. Some decompositions are embellished to try to capture changes in output owing to trade,
measured as changes in imports and exports. Yet imports and exports must be separately
deflated, and existing price indices, particularly import price indices, suffer from well-known
biases that lead researchers to understate the growth of real imports.8 In addition, industries are
connected by supply chains; imports in one industry will affect demand for inputs in upstream
industries, but such effects are not captured in decompositions. Decompositions based on
disaggregated industries exacerbate this problem. Job losses owing to trade may depress
domestic demand, but such general equilibrium effects are not captured in these reduced-form
accounting identities.
Moreover, labor productivity growth is not synonymous with automation, and measured
productivity growth may be simply picking up the effects of international trade and other forces
associated with globalization. Given its importance, I elaborate on this last point in the following
section.
What Labor Productivity Measures Capture
Labor productivity in an industry or sector is typically defined as value-added (the returns
to capital and labor) divided by a measure of labor input (hours worked or employment). Labor
8 The methodology used to construct price indices does not capture price drops when a purchaser shifts to a
less expensive supplier of a good or service. Therefore, lower prices that have driven the growth in imported
products from low-wage countries are not captured in import price indices. Houseman et al. (2011) discuss import
price bias and estimate the bias in manufacturing statistics from the growth in imported material intermediates.
Mandel and Carew (2012) estimate the bias to all GDP from the growth in imports.

16
productivity will increase if processes are automated—i.e., if businesses invest in capital
equipment and that equipment substitutes for workers in the production process. Measured
growth in labor productivity, however, captures many factors besides automation. As already
discussed, the strong productivity growth in the manufacturing sector has been driven by
productivity growth in the computer industry, which largely stems from product improvements
owing to research and development, not from automation of the production process. Although
the computer industry has had by far the largest influence on real output and productivity growth
in aggregate manufacturing, output and productivity measures in other industries, such as motor
vehicles, are significantly affected by quality adjustment of price deflators.
In addition, as noted, manufacturers have outsourced many activities previously done in-
house, either to domestic or foreign suppliers. If the outsourced activities are primarily done by
relatively low-paid, low-value-added workers, or if the outsourced labor is cheaper than the in-
house labor, measured labor productivity will mechanically increase. International competition
may directly impact measured manufacturing productivity by affecting the composition of
products produced and processes used in the United States. The industries and plants within
industries most affected by increased competition from low-wage countries will likely be the
most labor-intensive. Similarly, the growth of global supply chains and the slicing up of the
value chain may impact the stages of production done in the United States, affecting labor
productivity measures. Exposure to trade can accelerate the adoption of automated processes
(Bloom, Draca, and Van Reenen 2016; Pierce and Schott 2016). In these cases, there is no simple
parsing out of the effects of trade and automation on employment.
A study of plant closures in the early 2000s with a focus on the home furniture industry
illustrates these forces (Holmes 2011). The making of high-quality wood furniture such as

17
bedroom and dining room furniture, known as casegoods, requires human craftsmanship, is labor
intensive, and does not lend itself to automation. The surge of imports from China and other
Asian countries beginning in the late 1990s hit the casegoods industry particularly hard; between
1997 and 2007, a majority of the large casegoods plants shut down, most of the rest downsized,
and employment in the industry dropped by half. The upholstery industry was also hard-hit by
imports but fared better because of the custom nature of the product and the expense associated
with shipping bulky sofas. The U.S. upholstery industry, however, offshored the labor-intensive
“cut-and-sew” of upholstery fabric to China in kits, which could be inexpensively shipped. These
kits were then stuffed with U.S.-built frames and foam. Holmes investigated two very large
plants classified in casegoods that survived the surge of Asian imports. One made ready-to-
assemble furniture, thus effectively “outsourcing” the labor-intensive assembly process to the
customer, 9 and had mechanized the stage where finish is applied to the furniture. The other, he
discovered, actually imported all of its casegoods from China. The facility, which served as the
corporate headquarters, engaged in some manufacturing of upholstered furniture, but it imported
the wood furniture from China and offshored the labor-intensive cut-and-sew work to China.
The furniture case study illustrates how trade may affect the composition of products
produced and the stages of production done in U.S. manufacturing and shift production toward
more mechanized plants. These forces will all raise measured labor productivity.
A widely cited Ball State University report illustrates the problem with using accounting
identities to draw conclusions about automation’s contribution to manufacturing’s job losses
(Hicks and Devaraj 2017). The report’s authors apply a variant of Equation (1) to manufacturing
industries, concluding that productivity growth accounts for most of the job losses. For example,
9 Basker, Foster, and Klimek (2017) argue that such shifting of tasks to consumers results in an
overstatement of an industry’s productivity growth.

18
Hicks and Devaraj claim that from 2000 to 2010 a staggering 3.9 million jobs in the computer
and electronics products industry were “not filled due to productivity,” more than five times the
number of jobs lost (Table 3). Such a claim is absurd. As noted, the productivity gains in the
computer industry largely reflect dramatic improvements in the speed and functionality of
computers and related products, not automation of the production process. While computers sold
in 2010 are better than those sold in 2000 (and in a statistical sense a 2010 model counts as more
than one 2000 computer model), this does not mean that the production of a 2010 model requires
fewer workers than the production of a 2000 model.
For the auto industry, Hicks and Devaraj (2017) conclude that nearly 600,000 jobs were
not filled because of productivity, representing 93 percent of the industry’s job losses over the
period. Yet, much of the productivity growth in autos, like computers, reflects product
improvements. Since the 1960s, the Bureau of Labor Statistics has adjusted new vehicle price
indices for the cost of quality improvements between model years, using estimates of the cost of
improvements provided by manufacturers (Williams and Sager 2018). In addition, the
development of global supply chains and offshoring of some production assembly and auto parts
production during this period, particularly within the NAFTA countries, means that some of the
productivity growth likely reflects cost savings and changes in the composition of products
produced in the United States. Between the business cycle peaks of 2000 and 2007, the number
of vehicles produced in the United States declined at a rate of nearly 5 percent per year,
according to data from the Federal Reserve Board, while real GDP in the motor vehicles industry
grew at a rate of about 3.5 percent per year, according to data from the BEA. The divergent
trends in the two quantity measures suggest that adjustment of price deflators for product quality
had sizable effects on measured real output growth in the BEA series. The divergent trends are

19
also consistent with offshoring and substantial restructuring of the domestic industry.
Automation may well have contributed to job losses in the auto and other industries, but the
decompositions in the Hicks and Devaraj report can shed no light on the importance of this
factor.
In short, productivity growth does not, per se, cause employment declines. Accounting
identities and other descriptive evidence cannot be used to draw inferences about the causes of
these declines, but once the anomalous effects of computer industry are excluded, even
descriptive statistics provide no prima facie evidence that higher rates of automation were
primarily responsible for the long-term decline in manufacturing’s share of employment. Rather,
they suggest that understanding the reasons for the slow output growth in manufacturing
output—whether from weak growth in domestic demand, strong growth in imports, or weak
growth in exports—is critical.10
RESEARCH ON THE CAUSES OF MANUFACTURING’S EMPLOYMENT DECLINE
IN THE 2000s
Accounting identities such as those in Equation (1) are appealing because they appear to
provide a simple decomposition of the effects of trade and technology on manufacturing’s
relative or absolute employment decline. But, understanding the causes of the decline in
manufacturing employment requires rigorous research. Although such studies are never
comprehensive in nature and cannot provide a decomposition of the effects of trade and
10 According to BEA data, real growth in domestic consumption of manufactured goods was slower than
that for services prior to 2000, consistent with common assertions that faster growth in consumption of services
partially contributed to the decline in manufacturing’s employment share. Interestingly, real consumption of
manufactured goods has outpaced that of services since 2000, which is consistent with consumers’ responding to a
surge of low-cost imports.

20
technology—indeed to some degree developments of the two are interrelated—they can provide
insights into the relative importance of the two forces.11
Motivated by the dramatic decline in manufacturing employment in the 2000s, recent
studies have focused on the effects of trade and automation on employment in the sector. I
provide a brief review of the existing literature on these topics in this section.12
The Causal Effect of Trade
The international competitiveness of manufacturing in the United States is influenced by
exchange rates, differential subsidies provided to manufacturing firms in the United States versus
other countries, tariffs, and various nontariff barriers, among other factors. The forces of
globalization may reduce domestic manufacturing output growth by increasing the growth of real
imports or by slowing the growth of exports. U.S. plants may close or downsize because of
import competition. U.S. producers also may close plants and shift production overseas or simply
expand production in other countries to take advantage of lower wages, higher subsidies, or
lower tax rates. In these cases, some of the products produced overseas may show up as U.S.
imports, but much may be exported to other countries; thus, the effects on U.S. output growth
through this channel, though potentially important for manufacturing employment, will not show
up directly in U.S. trade statistics.13 Additionally, manufacturing job losses owing to trade will
have spillover effects in the economy, potentially depressing domestic demand for manufactured
goods. And international competition may reduce investment in the United States, undermining
the sector’s competitiveness and depressing demand for manufacturing workers in the future.
11 Fort, Pierce, and Schott (2018) also note that research cannot provide such decompositions. 12 I do not review earlier research that focused on the effects of international trade on the declines in
manufacturing employment during the 1980s. To my knowledge, no rigorous studies have examined the causes of
manufacturing’s declining share of aggregate employment during periods when the sector’s employment levels were
rising or relatively stable. 13 Setser (2017), for example, discusses the slow growth of U.S. exports outside of NAFTA.

21
No study captures all aspects of globalization and its effects on manufacturing
employment, and the limitations of any single study need to be recognized. Collectively,
however, a growing body of research points to sizable adverse effects, operating through various
mechanisms.
The precipitous decline in manufacturing employment in the early 2000s coincided with a
dramatic widening of the merchandise trade deficit, led by a rise in imports from China. This
suggested that trade, and Chinese imports in particular, were behind the collapse. Several studies
focus on the effects of Chinese imports on U.S. manufacturing employment. Autor, Dorn, and
Hanson (2013) use regional data at the commuting-zone level to examine how exposure to
growth in Chinese imports affects manufacturing employment. They estimate that a quarter of
the decline in manufacturing employment from 1990 to 2007 is related to the growth of Chinese
imports.
Pierce and Schott (2016) also examine the effects of Chinese imports on U.S.
manufacturing employment in the 2000s, but they focus specifically on the effects of granting
permanent normal trade relations (PNTR) to China. Congress passed PNTR in late 2000, and it
became effective at the end of 2001 with China’s accession to the WTO. The authors argue that,
although China had been subject to the relatively low WTO tariff rates since 1980, China’s
accession to the WTO eliminated the possibility of a sudden tariff spike on Chinese imports and
thus removed uncertainty for investors. Pierce and Schott outline three channels by which
granting China PNTR may have affected U.S. employment: 1) it increased the incentive for U.S.
firms to incur sunk costs of shifting operations to China or of partnering with a Chinese
manufacturer, 2) it provided Chinese producers with incentives to enter or further invest in
exporting to the U.S. market, and 3) it provided an incentive for U.S. firms to invest in labor-

22
saving technology or to shift the mix of products they produced to less labor-intensive ones.
Pierce and Schott find that manufacturing industries in the United States that were more affected
by the change in trade policy experienced larger employment losses and that all three channels
contributed to the losses. In addition, using input-output linkages, they find that U.S. suppliers to
the industries impacted by the change in trade policy also experienced employment losses and
were more likely to close, which could reflect reduced demand or a decision by these firms to
also offshore production to China.
In addition, studies have found sizable adverse effects of Chinese imports on U.S. firm
sales, investment, patents, and research and development (Autor et al. 2017; Pierce and Schott
2017). These adverse effects raise larger concerns about the loss of competitiveness of domestic
manufacturers, with implications for future employment in the sector.
Studies have also examined the effects on manufacturing employment from activities by
multinational companies, which have accounted for a disproportionate share of the employment
decline. Using firm-level data from the Bureau of Economic Analysis, Harrison and McMillan
(2011) find that offshoring to low-wage countries substitutes for domestic employment, but that
some offshoring is complementary and increases a company’s domestic employment. On net,
they find a small negative impact of offshoring on parent employment. Using establishment-level
data on multinational firms from the Census Bureau, Boehm, Flaaen, and Pandalai-Nayar (2015)
estimate that the offshoring of intermediate inputs, which they find is primarily done by
multinational companies, substitutes for U.S. employment. Structural model estimates indicate
that offshoring of intermediate inputs by multinational companies accounts for 13 percent of the
decline in U.S. manufacturing employment between 1993 and 2011.

23
While the studies cited above focus on the effects of Chinese imports or multinational
company offshoring on manufacturing employment, Campbell (2017) examines the effect of a
temporary appreciation of the dollar on manufacturing employment in the early 2000s.
Campbell’s study potentially captures effects of an exchange-rate appreciation on manufacturing
employment that operates through higher imports (not just imports from China) and lower
exports. An important innovation of Campbell’s work is to adjust the real exchange rate index
for compositional changes in trading partners toward developing countries with lower price
levels, such as China. This adjustment shows that the real appreciation of the dollar was
substantially greater than an index that does not take into account these compositional changes.
Campbell estimates that the exchange rate appreciation can explain 1.5 million of the job
losses in manufacturing from 1995 to 2008. He also presents for this and other exchange rate
shocks evidence of hysteresis: job losses from a temporary exchange rate appreciation are not
reversed when a currency subsequently depreciates. Economic theory suggests that hysteresis
may be important when there are sunk costs and learning by doing. An appreciation of the dollar
could stimulate sunk-cost investments in production and supply chains in developing countries
with lower production costs. Campbell points out that even if the currency returns to its original
value vis-à-vis its trading partners, production costs may still be lower in the developing
countries where firms invested, and the currency depreciation would not induce firms to write off
these sunk-cost investments. Additionally, firms operating in foreign countries may become
more efficient over time (learning by doing) and thus develop a comparative advantage. The
appreciation of the dollar, therefore, may induce investments in low-cost countries that still enjoy
a cost advantage even after the dollar depreciates to its prior level.
24
The Causal Effect of Automation
While studies have generally found that factors related to trade have played an important
role in the decline of manufacturing employment in the 2000s, studies have failed to uncover a
strong relationship between automation and manufacturing job loss during the period.
Using data on manufacturing industries, Acemoglu et al. (2014) examine the argument,
popularized in the book Race Against the Machine (Brynjolfsson and McAfee 2011), that IT
capital and associated automation are transforming U.S. workplaces. The authors study the
relationship between investment in IT equipment, labor productivity growth, and employment
from 1980 to 2009. They find that while there is a strong relationship between IT investment and
productivity growth, the relationship largely disappears once the anomalous computer and
electronic products industry is dropped from the sample. IT-intensive industries do experience
somewhat higher labor productivity growth in the 1990s, but the effect dissipates in the 2000s,
precisely when the sector experiences a precipitous employment decline. Moreover, they find
that when IT-intensive industries do experience rapid labor productivity growth, it is associated
with declining output and even more rapid employment declines. If automation caused the
employment decline, the higher productivity growth associated with it should be reducing costs
and therefore be accompanied by higher output growth. The pattern instead is consistent with
displacement from trade, whereby the remaining downsized industry is concentrated in segments
that are less labor intensive.
Autor, Dorn, and Hanson (2015) use data on regional labor markets in the United States
over the period 1980 to 2007 to examine the effects of both trade and automation on employment
in manufacturing and nonmanufacturing industries. As reported in their earlier work, Autor,
Dorn, and Hanson find that regions exposed to imports from China experienced significant
reductions in employment, particularly in manufacturing industries. This affected all

25
manufacturing occupations, including high-skilled professional and technical jobs. In contrast,
labor markets that had a concentration of occupations in routine manual tasks, which are
susceptible to automation, did not experience a net decline in employment in either
manufacturing or nonmanufacturing, although the occupational structure of employment in these
industries did shift. Most notable for the question examined in this paper, the effects of
automation in manufacturing were most prominent in the 1980s and had greatly diminished by
the 2000s, while the effects of automation in nonmanufacturing industries accelerated over time.
In a much-publicized paper, Acemoglu and Restrepo (2017) estimate that the adoption of
robots could have large, adverse effects on employment and wages in the future. However,
because the adoption of industrial robots has been limited thus far, it can explain little of the
sharp decline in employment that has occurred.
Recent studies also have found that the rise of markups since the 1980s and the
offshoring of labor intensive processes (not capital investment) account for the rise of capital
share (De Loecker and Eeckhout 2017; Elsby, Hobijn, and Sahin 2013). Such evidence is
inconsistent with the hypothesis that a large technology shock caused employment declines and a
concomitant rise in capital share in manufacturing.
THE CONSEQUENCES OF MANUFACTURING JOB LOSSES
Among the most robust findings in labor economics is that plant closures and other mass
layoffs have large, adverse, and lasting effects on workers and communities.14 In a seminal
article on workers laid off from distressed firms in Pennsylvania, Jacobson, Lalonde, and
14 von Wachter (2010) and Carrington and Fallick (2017) provide recent reviews of the literature on the
consequences of job displacement.

26
Sullivan (1993) find that dislocated workers with high job-tenure experience average long-term
earnings losses of 25 percent of their predisplacement income. Using Social Security earnings
data, von Wachter, Song, and Manchester (2009) find similarly large, persistent earnings losses
among those affected by a mass layoff—with immediate earnings losses of 30 percent and losses
of 20 percent 15–20 years following the layoff event, compared to similar workers who did not
experience a mass layoff.
With just under 10 percent of U.S. employment located in the manufacturing sector, some
may believe that manufacturing job losses matter little anymore. Yet through supply chain
linkages, the manufacturing sector has an outsized effect on the economy. Approximately half of
the labor needed in the production of manufactured goods in the United States and other
advanced countries is employed outside the manufacturing sector. In addition to job creation
effects through these input-output relationships, an increase in employment in the manufacturing
sector increases local and national employment by increasing demand: the additional employed
manufacturing workers spend more in the economy, creating new jobs. Using a local general
equilibrium model, Moretti (2010) estimates that each additional manufacturing job in a city
generates 1.6 nonmanufacturing jobs. Multiplier effects are higher for skilled jobs: an additional
skilled manufacturing job in a city generates an estimated 2.5 jobs in local goods and services.
Reflecting manufacturing’s large spillover effects, research finds that the sudden and large job
losses in manufacturing in the 2000s are to a large degree responsible for the weak job growth
and poor labor market outcomes among less-educated workers during that decade, although the
housing boom in the early 2000s initially masked some of the effects of manufacturing job losses
(Acemoglu et al. 2016; Charles, Hurst, and Notowidigdo 2016).
27
An important lesson from the research literature is that the size of the adverse shock
matters for workers’ reemployment and earnings and for regional economic outcomes. Workers’
long-term earnings losses depend to a large extent on the prevailing local labor market conditions
at the time of the loss; those losing jobs in weak labor markets suffer larger earnings losses
(Jacobson, Lalonde, and Sullivan 1993), and the effects of job loss are worse for workers during
a recession (von Wachter, Song, and Manchester 2009). Correspondingly, the effects of trade
and other adverse economic shocks on regional economies depend critically on the size of the
shocks. While local economies can recover from modest setbacks relatively quickly, large
adverse shocks can overwhelm a local economy, causing a downward spiral and depressing its
economy for decades.15
CONCLUSION
Two stylized facts underlie the prevailing view that automation largely caused the relative
decline and, in the 2000s, the large absolute decline in U.S. manufacturing employment: first,
manufacturing real output growth has largely kept pace with that of the aggregate economy for
decades, and second, manufacturing labor productivity growth has been considerably higher.
These statistics appear to provide a compelling case that domestic manufacturing is strong, and
that, as in agriculture, productivity growth, assumed to reflect automation, is largely responsible
for the relative and absolute decline in manufacturing employment. Although the size and scope
15 This dynamic is illustrated in Dix-Carneiro and Kovak (2017). In a study of trade liberalization in Brazil
in the early 1990s, the authors find that regions that initially specialized in industries facing larger tariff cuts
experienced prolonged declines in formal sector employment and earnings, compared to other regions. Moreover,
they find that the impact of tariff changes on the regional economy is persistent and grows over time. The
mechanisms, the authors argue, include low labor mobility, slow capital adjustment, and agglomeration economies,
which amplify the initial labor demand shock from liberalization.

28
of the decline in employment manufacturing industries in the 2000s was unprecedented, many
see it as part of a long-term trend and deem the role of trade small.
That view, I have argued, reflects a misinterpretation of the numbers. First, aggregate
manufacturing output and productivity statistics are dominated by the computer industry and
mask considerable weakness in most manufacturing industries, where real output growth has
been much slower than average private sector growth since the 1980s and has been anemic or
declining since 2000. Second, labor productivity growth is not synonymous with, and is often a
poor indicator of, automation. Measures of labor productivity growth may capture many forces
besides automation—including improvements in product quality, outsourcing and offshoring,
and a changing industry composition owing to international competition. Indeed, the rapid
productivity growth in the computer and electronics products industry, and by extension in the
manufacturing sector, largely reflects improvements in product quality, not automation. In short,
the stylized facts, when properly interpreted, do not provide prima facie evidence that
automation drove the relative and absolute decline in manufacturing employment.
It is difficult to parse out the effects of various factors on manufacturing employment,
and research does not provide simple decompositions of the total contribution that trade and the
broader forces of globalization make to manufacturing’s recent employment decline.
Nevertheless, the research evidence points to trade and globalization as the major factor behind
the large and swift decline of manufacturing employment in the 2000s. Although manufacturing
processes continue to be automated, there is no evidence that the pace of automation in the sector
accelerated in the 2000s; if anything, research comes to the opposite conclusion.
Manufacturing still matters, and its decline has serious economic consequences.
Reflecting the sector’s deep supply chains, manufacturing’s plight contributed to the weak

29
employment growth and poor labor market outcomes prevailing during much of the 2000s.
Research shows that such large-scale shocks have persistent adverse effects on affected
communities and their residents, though these costs rarely are fully considered in policy making
(Klein, Schuh, and Triest 2003). In addition, because manufacturing accounts for a
disproportionate share of R&D, the health of manufacturing industries has important
implications for innovation in the economy. The widespread denial of domestic manufacturing’s
weakness and globalization’s role in its employment collapse has inhibited much-needed,
informed debate over trade policies.

30
References
Acemoglu, Daron, David Autor, David Dorn, Gordon H. Hanson, and Brendan Price. 2014. “The
Return of the Solow Paradox? IT, Productivity, and Employment in U.S. Manufacturing.”
American Economic Review: Papers and Proceedings 104(5): 394–399.
———. 2016. “Import Competition and the Great U.S. Employment Sag of the 2000s.” Journal
of Labor Economics 34(S1, Part 2): S141–S198.
Acemoglu, Daron, and Pascual Restrepo. 2017. “Robots and Jobs: Evidence from U.S. Labor
Markets.” NBER Working Paper No. 23285. Cambridge, MA: National Bureau of
Economic Research.
Atkinson, Robert D., Scott M. Andes, Luke A. Stewart, and Stephen J. Ezell. 2012. Worse Than
the Great Depression: What Experts Are Missing about American Manufacturing’s
Decline. Washington, DC: Information Technology and Innovation Foundation.
Autor, David H., David Dorn, and Gordon H. Hanson. 2013. “The China Syndrome: Local Labor
Market Effects of Import Competition in the United States.” American Economic Review
103(6): 2121–2168.
———. 2015. “Untangling Trade and Technology: Evidence from Local Labor Markets.”
Economic Journal 125: 621–646.
Autor, David, David Dorn, Gordon H. Hanson, Gary Pisano, and Pian Shu. 2017. “Foreign
Competition and Domestic Innovation: Evidence from U.S. Patents.” NBER Working
Paper No. 22879. Cambridge, MA: National Bureau of Economic Research.
Baily, Martin Neil, and Barry P. Bosworth. 2014. “U.S. Manufacturing: Understanding Its Past
and Potential Future.” Journal of Economic Perspectives 28(1): 3–26.
Basker, Emek, Lucia Foster, and Shawn Klimek. 2017. Customer-Employee Substitution:
Evidence from Gasoline Stations. Washington, DC: U.S. Census Bureau.
Benedetto, John. 2018. “Trends in Manufacturing Employment in the Largest Industrialized
Economies during 1998-2014.” USITC Executive Briefings on Trade, April. Washington,
DC: U.S. International Trade Commission.
Bergsten, C. Fred. 2014. “Addressing Currency Manipulation through Trade Agreements.”
Policy Brief PB14-2. Washington, DC: Peterson Institute for International Economics.
Berlingieri, Giuseppe. 2014. “Outsourcing and the Rise of Services.” Centre for Economic
Performance Working Paper No. 1199. London: London School of Economics and
Political Science.

31
Bloom, Nicholas, Mirko Draca, and John van Reenen. 2016. “Trade Induced Technical Change?
The Impact of Chinese Imports on Innovation, IT, and Productivity.” Review of
Economic Studies 83(1): 87–117.
Boehm, Christoph E., Aaron Flaaen, and Nitya Pandalai-Nayar. 2015. “Multinationals,
Offshoring, and the Decline of U.S. Manufacturing.” Unpublished paper. Ann Arbor, MI:
University of Michigan.
Brynjolfsson, Erik, and Andrew McAfee. 2011. Race Against the Machine: How the Digital
Revolution Is Accelerating Innovation, Driving Productivity, and Irreversibly
Transforming Employment and the Economy. Lexington, MA: Digital Frontier Press.
Byrne, David M., Stephen D. Oliner, and Daniel E. Sichel. 2015. “How Fast Are Semiconductor
Prices Falling?” NBER Working Paper No. 21074. Cambridge, MA: National Bureau of
Economic Research.
Campbell, Douglas. 2017. “Relative Prices, Hysteresis, and the Decline of American
Manufacturing.” Unpublished paper. Moscow, Russia: New Economic School.
Carrington, William J., and Bruce C. Fallick. 2017. “Why Do Earnings Fall with Job
Displacement?” Industrial Relations 56(4): 688–722.
Charles, Kerwin Kofi, Erik Hurst, and Matthew J. Notowidigdo. 2016. “The Masking of the
Decline in Manufacturing Employment by the Housing Bubble.” Journal of Economic
Perspectives 30(2): 179–200.
De Loecker, Jan, and Jan Eeckhout. 2017. “The Rise of Market Power and the Macroeconomic
Implications.” NBER Working Paper No. 23687. Cambridge, MA: National Bureau of
Economic Research.
DeLong, J. Bradford. 2017. “NAFTA and Other Trade Deals Have Not Gutted American
Manufacturing—Period.” Vox Media. https://www.vox.com/the-big-
idea/2017/1/24/14363148/trade-deals-nafta-wto-china-job-loss-trump (accessed June 5,
2018).
Dey, Matthew, Susan N. Houseman, and Anne E. Polivka. 2012. “Manufacturers’ Outsourcing to
Staffing Services.” Industrial and Labor Relations Review 65(3): 533–559.
_____. 2017. “Manufacturers’ Outsourcing to Temporary Help Services: A Research Update.”
Working Paper No. 493. Washington, DC: U.S. Bureau of Labor Statistics, Office of
Employment and Unemployment Statistics.
Dix-Carneiro, Rafael, and Brian K. Kovak. 2017. “Trade Liberalization and Regional
Dynamics.” American Economic Review 107(10): 2908–2946.

32
Elsby, Michael W., Bart Hobijn, and Aysegul Sahin. 2013. “The Decline of the U.S. Labor
Share.” Brookings Papers on Economic Activity 2013(2): 1–63.
Fort, Teresa C., Justin R. Pierce, and Peter K. Schott. 2018. “New Perspectives on the Decline of
US Manufacturing Employment.” Journal of Economic Perspectives 32(2): 47–72.
Harrison, Ann, and Margaret McMillan. 2011. “Offshoring Jobs? Multinationals and U.S.
Manufacturing Employment.” Review of Economics and Statistics 93(11): 857–875.
Holmes, Thomas J. 2011. “The Case of the Disappearing Large-Employer Manufacturing Plants:
Not Much of a Mystery After All.” Economic Policy Paper 11-4. Minneapolis, MN:
Federal Reserve Bank of Minneapolis.
Houseman, Susan N., Timothy J. Bartik, and Timothy Sturgeon. 2015. “Measuring
Manufacturing: How the Computer and Semiconductor Industries Affect the Numbers
and Perceptions.” In Measuring Globalization: Better Trade Statistics for Better Policy—
Volume I. Biases to Price, Output, and Productivity Statistics from Trade, Susan N.
Houseman and Michael Mandel, eds. Kalamazoo, MI: W.E. Upjohn Institute for
Employment Research, pp. 151–194.
Houseman, Susan, Christopher Kurz, Paul Lengermann, and Benjamin Mandel. 2011.
“Offshoring Bias in U.S. Manufacturing.” Journal of Economic Perspectives 25(2): 111–132.
Jacobson, Louis S., Robert J. LaLonde, and Daniel G. Sullivan. 1993. “Earnings Losses of
Displaced Workers.” American Economic Review 83(4): 685–709.
Klein, Michael W., Scott Schuh, and Robert K. Triest. 2003. Job Creation, Job Destruction, and
International Competition. Kalamazoo, MI: W.E. Upjohn Institute for Employment
Research.
Lawrence, Robert Z., and Lawrence Edwards. 2013. “U.S. Employment Deindustrialization:
Insights from History and the International Experience.” Policy Brief No. PB13-27.
Washington, DC: Peterson Institute for International Economics.
Mandel, Michael, and Diana G. Carew. 2012. “Measuring the Real Impact of Imports on Jobs.”
PPI policy memo. Washington, DC: Progressive Policy Institute.
Moretti, Enrico. 2010. “Local Multipliers.” American Economic Review: Papers and
Proceedings 100: 1–7.
Muro, Mark. 2016. “Manufacturing Jobs Aren’t Coming Back.” MIT Technology Review,
November 18. https://www.technologyreview.com/s/602869/manufacturing-jobs-arent-
coming-back/ (accessed June 5, 2018).
Pierce, Justin, and Peter Schott. 2016. “The Surprisingly Swift Decline of U.S. Manufacturing
Employment.” American Economic Review 106(7): 1632–1662.

33
_____. 2017. “Investment Responses to Trade Liberalization: Evidence from U.S. Industries and
Establishments.” NBER Working Paper No. 24071. Cambridge, MA: National Bureau of
Economic Research.
Schmalensee, Richard. 2018. “The Curious Collapse of U.S. Manufacturing Labor Productivity
Growth after 2010.” Cambridge, Massachusetts Institute of Technology. Unpublished
manuscript.
Setser, Brad. 2017. “U.S. Manufacturing Exports—Excluding NAFTA—Are Surprisingly
Small.” Follow the Money (blog), Council on Foreign Relations, February 22.
von Wachter, Till. 2010. “Summary of the Literature on Job Displacement in the U.S. and EU:
What We Know and What We Would Like to Know.” In Wage Structures, Employment
Adjustments, and Globalization, David Marsden and François Rycx, eds. Basingstoke,
UK: Palgrave Macmillan, pp. 64–121.
von Wachter, Till, Jae Song, and Joyce Manchester. 2009. “Long-Term Earnings Losses Due to
Mass Layoffs during the 1982 Recession: An Analysis Using Longitudinal
Administrative Data from 1974 to 2004.” Unpublished manuscript.
Whelan, Karl. 2000. “A Guide to the Use of Chain Aggregated NIPA Data.” Washington, DC:
Federal Reserve Board.
https://www.federalreserve.gov/pubs/feds/2000/200035/200035pap.pdf (accessed June 5,
2018).
Williams, Brendan, and Erick Sager. 2018. “A New Vehicles Transaction Price Index: Offsetting
the Effects of Price Discrimination and Product Cycle Bias with a Year-Over-Year
Index.” Washington, DC: U.S. Bureau of Labor Statistics.
https://www.unece.org/fileadmin/DAM/stats/documents/ece/ces/ge.22/2018/BLS_Poster.
pdf (accessed June 5, 2018).
34
0
50
100
150
200
250
300
350
400
02468
10121416182022
Em
plo
ym
ent,
mil
lio
ns
# e
stab
lish
men
ts,
00
0s
Figure 1: Manufacturing Employmemnt and Number
of Establishments
Employment Establishments
NOTE: Data on employment are from the Bureau of Economic Analysis. Data on number of
establishments are from the Census Bureau's Business Dynamics Statistics.
0
5
10
15
20
25
30
35
40
0
50
100
150
200
250
300
350
Mfg
sh
are,
%
Rea
l G
DP
In
dex
, 19
77
=100
Figure 2: Manufacturing and Private Industry Real
GDP; Manufacturing GDP and Employment Shares
Private industries, real GDP Manufacturing, real GDP
Mfg GDP share Mfg employment share
NOTE: Author calculations using data from the Bureau of Economic Analysis.

35
0
20
40
60
80
100
120
140
160
180
200
Ind
ex, 1
98
7=
100
Figure 3: GDP Price Deflators, Private Industry and
Manufacturing
Private industry Mfg
0
50
100
150
200
250
Index
, 19
87
=100
Figure 4: GDP Price Deflators, Private Industry and
Manufacturing Omitting Computer Industry,
Computer Industry
Private industry, w/o computers Mfg, w/o computers
Computer industry
NOTE: Author calculations using data from the Bureau of Economic Analysis.
NOTE: Data are from the Bureau of Economic Analysis.

36
0
50
100
150
200
250
300
350
Figure 5: Real GDP, Private Industry and Manufacturing,
with and without Computer Industry, 1977=100
Private industries Manufacturing
Private industries, less computers Manufacturing, less computers
NOTE: Author calculations using data from the Bureau of Economic Analysis.

37
Table 1 Decomposition of Differences in Private Sector v. Manufacturing Employment Growth Rates, With
and Without Computer and Electronic Products Industry, Selected Time Periods
1977–2016 1979–1989 1989–2000 2000–2007 2007–2016
Including Computer Industry:
Difference in employment growth rate:
private business − manufacturing 0.025 0.029 0.022 0.037 0.019
Share due to GDP Growth 0.147 0.195 −0.135 −0.037 0.666
Share due to Labor
Productivity Growth 0.853 0.805 1.135 1.037 0.334
Excluding Computer Industry:
Difference in employment growth rate:
private business − manufacturing 0.026 0.032 0.022 0.036 0.019
Share due to GDP Growth 0.609 0.478 0.815 0.255 1.020
Share due to Labor
Productivity Growth 0.391 0.522 0.185 0.745 −0.020 NOTE: The table shows, for various periods, decompositions of the difference in the employment growth rate in the private and
manufacturing sectors—with and omitting the computer industry—into the part due to the difference in their real GDP growth
and the part due to the difference in their labor productivity growth. Calculations are based on Equation (1) in the text and use
data from the Bureau of Economic Analysis.