understanding the genetic basis of phenotype variability
TRANSCRIPT

1
Understanding the genetic basis of phenotype variability in individuals with
neurocognitive disorders
Michael H. Duyzend
A dissertation submitted
in partial fulfillment of the
requirements for the degree of
Doctor of Philosophy
University of Washington
2016
Reading Committee:
Evan E. Eichler, Chair
Raphael Bernier
Philip Green
Program Authorized to Offer Degree:
Genome Sciences

2
©Copyright 2016
Michael H. Duyzend

3
University of Washington
Abstract
Understanding the genetic basis of phenotype variability in individuals with neurocognitive
disorders
Michael H. Duyzend
Chair of the Supervisory Committee:
Professor Evan E. Eichler
Department of Genome Sciences
Individuals with a diagnosis of a neurocognitive disorder, such as an autism spectrum
disorder (ASD), can present with a wide range of phenotypes. Some have severe language and
cognitive deficiencies while others are only deficient in social functioning. Sequencing studies
have revealed extreme locus heterogeneity underlying the ASDs. Even cases with a known
pathogenic variant, such as the 16p11.2 CNV, can be associated with phenotypic heterogeneity.
In this thesis, I test the hypothesis that phenotypic heterogeneity observed in populations with a
known pathogenic variant, such as the 16p11.2 CNV as well as that associated with the ASDs in
general, is due to additional genetic factors. I analyze the phenotypic and genotypic
characteristics of over 120 families where at least one individual carries the 16p11.2 CNV, as
well as a cohort of over 40 families with high functioning autism and/or intellectual disability. In
the 16p11.2 cohort, I assessed variation both internal to and external to the CNV critical region.
Among de novo cases, I found a strong maternal bias for the origin of deletions (59/66, 89.4% of
cases, p=2.38x10⁻¹¹), the strongest such effect so far observed for a CNV associated with a
microdeletion syndrome, a significant maternal transmission bias for secondary deletions (32
maternal versus 14 paternal, p=1.14x10⁻²), and nine probands carrying additional CNVs
disrupting autism-associated genes. In the same cohort, I assessed genome wide exonic variation,
including in the 27 16p11.2 CNV critical region genes and the 3 genes that lie in the flanking
4
segmental duplications, BOLA2, SLX1A, and SULT1A3 with the hypothesis that dosage
imbalance in these genes could lead to variable phenotypes. I find an absence of variation across
the critical region, compared to similarly sized regions genome-wide by average heterozygosity
(2nd percentile) and Tajima’s D (3rd percentile) metrics. Among the 27 critical region genes and
three duplicated genes, I find no loss of function variants in 16p11.2 CNV carriers. Our genome-
wide exome analysis revealed 13 likely-gene disruptive (LGD) variants in 13 probands in
autism-associated genes, which is fewer than would be expected by chance (p<10-16) and
individuals having such variants trend towards being more severely affected on FSIQ (p=0.19).
To understand the genetic heterogeneity associated with high-functioning autism and intellectual
disability, I assessed genetic variation observed in a cohort of 43 local families of which 29 have
a diagnosis of high functioning-autism. I discovered variants in novel autism candidate genes,
including LPHN1 and NUMBL, find that the high functioning autism cohort tends to have more
inherited loss of function and severe missense variation per individual than low functioning
cohorts (p<2.2*10-16), but fewer de novo LGD variants per individual (p=0.007). I also find that
de novo variants in high functioning cases lie in a protein-protein interaction network including
proteins involved in the NOTCH signaling pathway. Our findings suggest that modifiers external
to, as opposed to variants internal to the critical region, may play a role in the observed
phenotypic differences observed in individuals with a 16p11.2 CNV and those with ASDs in
general.

5
List of Figures 7
List of Tables 8
Acknowledgements 9
1. Introduction 12
1.1 Overview 12
1.2 The connection between genotype and phenotype 12
1.3 The Simons VIP collection 14
1.4 Basis for genotype heterogeneity 16
1.5 The 16p11.2 CNV helps to define a subtype of autism 18
1.6 The 16p11.2 CNV critical region 20
1.7 The SAGE cohort 22
2. Maternal Modifiers and Parent-of-Origin Bias 25
of the Autism-Associated 16p11.2 CNV
2.1 Summary 25
2.2 Introduction 26
2.3 Subjects and methods 27
2.3.1 Samples 27
2.3.2 Phenotypic assessment 17
2.3.3 CNV detection 28
2.3.4 CNV inheritance and validation 30
2.3.5 Control CNV analysis 30
2.3.6 De novo 16p11.2 CNV parent-of-origin analysis 32
2.3.7 Mechanism of unequal crossover and recombination analysis 33
2.4 Results 34
2.4.1 Characterization of the 16p11.2 CNVs in the Simons VIP Cohort 34
2.4.2 Maternal parent-of-origin of the 16p11.2 CNV 35
2.4.3 Secondary CNVs and maternal transmission bias 37
2.4.4 Phenotypic features 38
2.5 Discussion 43
2.6 Notes 46
3. Exonic variation and population genetic analysis 48
of the Autism-Associated 16p11.2 CNV
3.1 Summary 48
3.2 Introduction 49
3.3 Methods 50
3.3.1 SNV detection and validation in the 16p11.2 critical region genes 50
3.3.2 Case and control resequencing 51
3.3.3 Copy number genotyping 53
3.3.4 Exome sequencing and analysis 53
3.3.5 Diversity and selection across the critical region 55
3.4 Results 56
3.4.1 Unique critical region genes 56
3.4.2 Duplicated critical region genes 57
3.4.3 Resequencing critical region genes in cases and controls 61
3.4.4 Copy number genotyping 63
3.4.5 Exome analysis 67

6
3.4.6 Selection analysis 71
3.5 Discussion 72
4. Exome sequencing of a local cohort reveals genes 81
implicated in neurocognitive disorders and high-functioning autism
4.1 Summary 81
4.2 Introduction 81
4.3 Subjects and methods 82
4.3.1 Samples 82
4.3.2 Phenotypic assessment 84
4.3.3 Variant detection from exome sequencing 85
4.3.4 Network and enrichment analysis 86
4.4 Results 86
4.4.1 De novo variation 87
4.4.2 Variants shared between siblings 88
4.4.3 Inherited cases 89
4.4.4 SAGE high functioning autism cases 90
4.5 Discussion 93
5. Summary and Future Directions 100
References 112
Appendix A: Supplementary Material for Chapter 2 128
Appendix B: Supplementary Material for Chapter 3 144
Pocket Material: CD with Supplemental Tables
7
List of Figures
Figure 1.1. Two-hit model and phenotype variability 17
Figure 1.2. Phenotypic heterogeneity of 16p11.2 deletion cases 19
Figure 1.3. 16p11.2 critical region 21
Figure 2.1 Maternal origin of 16p11.2 de novo CNVs 33
Figure 2.2 Mechanisms of unequal crossing over 36
Figure 2.3 Familial IQ decrement in 16p11.2 deletion and duplication families 39
Figure 2.4 Examples of secondary large CNVs 42
Figure 3.1 Severity plot for 16p11.2 CNV probands 58
Figure 3.2 Protein models and variation of BOLA2, SLX1A, and SULT1A3 60
Figure 3.3 Allele balance across discovered variants in BOLA2 and SLX1A 62
Figure 3.4 Expansion of the 16p11.2 critical region 64
Figure 3.5 Likely gene disruptive variants in autism associated genes 69
Figure 3.6 Signatures of selection across the 16p11.2 critical region 72
Figure 4.1 Families with de novo severe variants in autism and 88
neurocognitive associated genes
Figure 4.2 Mendelian candidates for pathogenicity 90
Figure 4.3 Variants per individual in two SSC cohorts 92
Figure 4.4 Network of connected proteins from de novo LGD and 93
severe missense variants from SSC high functioning cases
Figure 5.1 Cognitive impairment of control neuropsychiatric CNV carriers 109
and controls

8
List of Tables
Table 2.1 Clinical characteristics of screened probands 28
Table 2.2 Number of 16p11.2 CNV carriers and non-carrier 35
family members analyzed
Table 2.3 Secondary CNVs 38
Table 2.4 SFARI genes hit in probands from exome data 68
Table 3.1 Simons VIP exomes analyzed 54
Table 3.2 Probands with a rare severe coding SNV from MIP resequencing data 57
Table 3.3 Severe variants in duplicated genes in probands from 59
the Simons VIP from MIP resequencing
Table 4.1 SFARI genes hit 91

9
Acknowledgements
“On the mountains of truth you can never climb in vain: either you will reach a point higher up
today, or you will be training your powers so that you will be able to climb higher tomorrow.” –
F. Nietzche
The scientific journey is one of profound introspection into nature’s truths. Like any journey,
those surrounding us have tremendous influence on our way forward and the lens through which
we see the world. Fortune looked kindly on me, and tremendous individuals from all aspects of
life have surrounded me. I am deeply indebted to all who shared their wisdom with me,
encouraged me, and were there for me during this voyage of discovery.
I would like to thank my parents and brother, for their constant encouragement, and always
enabling me to see the wisdom I would gain from every situation. I learned from them to see the
world not as black and white, but rather a multi-layered, multi-faceted set of truths and illusions
which is thrilling to navigate. They are always enthusiastic about my scientific interests, and
intense motivators and advocates for equality and truth. Perhaps this is a reason that I am the first
person in my extended family to pursue a PhD.
I would like to thank my mentors, especially Evan Eichler, Mary-Claire King, and my
committee members Raphe Bernier, Phil Green, Debbie Nickerson, and Peter Byers. I admire
their passion for discovery, and ability to separate the scientific pursuit from other motivators so
prevalent in society. These mentors have allowed me to view the scientific pursuit as an exciting
playing field, where each effort, even if leading to negative results, helps pave the path forward.
As Dr. Eichler once said, “Let the science speak for itself.”
I would like to thank the great many friends and extended family who provided balance and
insight during these years. Gordon Griggs and Valerie Stevens served as great “family” when my
parents moved away from Seattle. My childhood friend Alan Charnley, whose mother was Chair

10
of Botany at UW, and passed away from ovarian cancer far too soon, influenced my decision to
pursue science and medicine. My close friends, Allen Chen, Joshua Cook, Isabel Huang-Doran,
Mathew Plucinski, Alexandre Babeanu, and Dave Young, now spread all over the world for
being, in Emerson’s words, “masterpieces of nature.” My cousins Molly Gross and Emily Gross,
both pursing medical careers, offered great advice, support, and fun during the PhD.
I would like to thank the other students, postdocs and staff who were with me in the lab,
department, and Medical Scientist Training Program, especially Xander Nuttle and Brad Coe,
with whom I collaborated extensively, and who provided great companionship and mentorship
both inside and outside of the lab.
The outdoors, art, and travel have provided insightful and balancing reprieve from the rigors
of the scientific pursuit. The opportunity to serve on medical school committees and national
organizations gave important perspective on the worldwide state of medicine and science.
Observing people around the world working hard to make the most of their lives, from the
favelas of Brazil to the steppes of Mongolia to the financial district of London, not only gave me
hope in humanity but also cemented the necessity of collaboration and selflessness across
socioeconomic and cultural bounds. The authors Emerson, Blake, Wollstonecraft, Tolstoy,
Neruda, Huxley, and more; composers Bach, Beethoven, Handel, Buxtehude, Enaudi, and more;
painters Monet, Lichtenstein, Van Gogh, Vermeer, and more; mathematicians Riemann, Tao,
Euler, and Ramanujan, and more. These artists have revealed beauty in the world and enriched
my humanity.
I would like to thank the mentors and teachers I have had over the years. Larry Muir, a PhD
biochemist come high school teacher, sparked my passion for understanding biologically active
molecules (of which DNA is one of the most important). Dave Alberg, professor of Chemistry at

11
Carleton College, confirmed my love for organic synthesis and biochemical manipulation. Bob
Dobrow, professor of Mathematics at Carleton College let me see the power of probability,
statistics, and combinatorics. David Liben-Nowell associate professor of Computer Science at
Carleton College encouraged me to think big and pursue a computational degree and allowed me
to realize the insight one can gain for huge datasets. Martha Bulyk, Professor of Medicine and
Biology at Brigham and Women’s hospital and Harvard Medical School, incidentally a former
benchmate of Jay Shendure, for opening up the world of genomics.
Finally, I would like to thank the Department of Genome Sciences and the Medical Scientist
Training Program at the University of Washington as well as the National Institutes of Health (in
particular the National Institute of Mental Health), Simons Foundation, and Howard Hughes
Medical Institute for providing tremendous resources and support during my PhD years. I cannot
think of a better place to have done this program.
12
1. Introduction:
1.1 Overview
The overarching theme of my thesis is to assess the genetic basis of phenotype variability in
individuals with variants strongly associated with the autism phenotype (genotype-first
ascertainment) or diagnosed with an autism spectrum disorder (ASD, phenotype-first
ascertainment). First, I analyze a cohort of individuals carrying the 16p11.2 CNV to assess the
presence of genetic modifiers in individuals already carrying a variant associated with autism
(chapters 1 and 2). I divide modifiers into two types. Those internal to, that is found in the
16p11.2 critical region and those external to or found outside of the 16p11.2 critical region.
Second, I assess a cohort of high functioning autism cases to understand the variants associated
with the social deficits of ASD in the absence of intellectual disability (ID) (chapter 3). The
results of my research have the potential to improve immediately clinical diagnosis, counseling
of affected individuals and their families, and management of individuals with the 16p11.2 CNV
and ASD. Furthermore, the research community can apply the techniques developed here to the
study of other variants associated with ID, ASD, and epilepsy.
1.2 The connection between genotype and phenotype
Identifying the patterns between genotype and phenotype gave rise to modern genetics1. The
patterns of segregation of traits provided powerful insight into how genetic variation can lead to
particular attributes, including disease traits. Researchers initially observed that traits segregate
in a dominant or recessive fashion, and later mapped them to particular chromosomal regions. In
model organisms, such as mouse, fly, yeast, zebrafish and worm, this has allowed for the genetic
13
manipulation of particular loci and observation of the resulting phenotype. Such an approach can
often provide insight into a disease causing variant discovered in humans.
Humans are not traditional model organisms. For ethical reasons, one cannot keep colonies
of humans, perform genetic manipulations, and observe the resulting phenotype. However, the
advent of rapid targeted and whole-genome sequencing approaches has allowed assessment of
hundreds of thousands of human genomes at relatively low cost. For example, the sequencing of
the coding part of the genome “the exome” of over 2,000 families with one affected individual
with autism has led to the identification of more than 30 genes involved in the phenotype2–5.
Through ascertainment, of either a particular phenotype, or a particular genetic variant, we can
now survey the variation extant in the over 7 billion humans to understand better the relationship
between genotype and phenotype. In this way, we are utilizing nature’s laboratory.
There are two possible ways to ascertain a cohort. In human studies, individuals are typically
ascertained on the basis of a particular clinical phenotype, for example autism, melanoma, or
macular degeneration. Researchers then assess these cohorts for shared genetic variation using a
phenotype-first approach. The approach taken with model organisms is often the reverse, or a
genotype-first approach. Researchers generate variants in a particular organism and observe the
resulting phenotypic characteristics. For human disorders with a wide heterogeneity of clinical
presentations, such as autism, variants in different genes are likely causative for different clinical
subtypes of the disorder. Rapid and targeted sequencing approaches allow researchers to
ascertain cohorts based on a particular variant, or variants discovered in a particular gene. Such
an approach provides a handle to better understand phenotypic heterogeneity associated with a
particular variant.
14
In the assessment of any cohort, it is crucial to have access to comprehensive phenotype and
genotype data. Detailed phenotype information allows association of subtle features with
particular variants and assessment of the scale of heterogeneity associated with single genetic
variants. Most large sequencing studies have focused on the identification of LGD variants, with
less emphasis on missense and non-coding variation. Indeed, a recent study showed that both
synonymous and non-synonymous exonic variation may be important in determining the
phenotype landscape6. The availability of comprehensive genetic and phenotypic data allows
assessment of all forms of variation and its association with phenotype.
Both genetic and phenotypic data should be assessed in the context of family (if possible)
and population. For example, proband 1 may have a full scale IQ (FSIQ) of 80, and proband 2
may have an FSIQ of 100. However, if the mean IQ of the parents of proband 1 is 100, and of
proband 2, 120, the difference in FSIQs for both probands when compared to their parents is 20.
Hence, calibrating metrics within the family can allow more normalized comparisons between
families. From a genetic standpoint, familial information is important to understand inheritance
patterns, and as a control population. If an inherited variant is only found in affected individuals,
for example, but not unaffected siblings, it has a higher likelihood of pathogenicity.
1.3 The Simons VIP collection
One of the first cohorts ascertained using a “genotype-first” approach was a collection of
over 200 individuals with a 16p11.2 CNV and their carrier and non-carrier family members7. The
discovery of the 16p11.2 deletion in ~1% of autism cases8,9 highlighted the importance of
recurrent CNVs underlying the genetic etiology of autism spectrum disorders10–12. Unlike other
disorders with a known genetic etiology, such as Prader-Willi or Smith-Magenis syndromes,

15
detailed study of individuals with the 16p11.2 deletion failed to reveal a set of phenotypic criteria
associated with the disorder13,14. The factors responsible for the phenotype variability found in
individuals with seemingly identical genomic alterations presented challenges for diagnosis,
counseling, and management. Collection of larger cohorts of individuals with the 16p11.2 CNV
revealed different and sometimes mirror phenotypes associated with the region: deletion is
associated with seizures15, obesity16, intellectual disability14, and macrocephaly13, while
duplication is associated with schizophrenia, reduced BMI, and microcephaly17,18. While it is
clear that the 16p11.2 CNV confers a strong risk for disease 19–21, it alone is not sufficient to
define a particular phenotype outcome.
Given the well-established association of the 16p11.2 deletion with autism, the Simons
Foundation collected a cohort of over 200 individuals with the 16p11.2 CNV and their family
members for study as part of the Simons Variation in Individuals Project (Simons VIP)7.
Families find out about the study via the internet or their clinician. Individuals and their families
travel to one of three centers for comprehensive examination, including a structural brain MRI
for participants who can complete the study without the use of sedation. Importantly, both
comprehensive phenotype information, including psychiatric evaluation by licensed clinicians
for >200 ascertained probands, and whole blood DNA for >120 ascertained probands and >200
family members was collected allowing for comprehensive genotype and phenotype
characterization. The phenotypes represented in this set are diverse and include individuals with
coordination disorder, enuresis, autism, tremors, and articulation disorder among others. This
collection offers an unparalleled resource to study how genetic changes on a background
sensitized by a known pathogenic CNV affect phenotype.

16
1.4 Basis for genotype heterogeneity
Despite the vast advances in identifying variants that are strongly associated or causative for
a particular disease phenotype, little is understood about what modulates the severity or
penetrance of that phenotype. For example, a recent study screened over 874 genes in 500,000
individuals and led to the identification of 13 adults with variants for 8 severe Mendelian
conditions, with no reported clinical manifestation of the indicated disease22. At the same time,
the majority of identified events leading to severe phenotypes (for example cystic fibrosis) are
loss-of-function in nature and involve a single variant, even though a combination of variants
could potentially lead to a similar phenotype.
The importance of additional or second hits affecting phenotype severity has been established
in several disorders, and a model has been developed to explain the phenotype variability
associated with pathogenic CNVs17,23,24. This was based initially on the study of a rare 16p12.1
microdeletion17 that is inherited in 95% of families and where the severity of disease correlates
with the presence of additional large CNVs (>400kbp) in individuals with intellectual disability.
This study was extended and analysis performed on more than 30 genomic disorders from 2,312
individuals carrying a primary pathogenic CNV variant24. Individuals with the same primary
pathogenic CNV but variable phenotype outcomes are more likely to have inherited (as opposed
to sporadic) primary CNVs and are more likely to carry another CNV, a so-called “second hit.”
There is a positive correlation (Spearman correlation coefficient, 0.68; P<0.001) between the
proportion of individuals carrying an additional CNV and the proportion of inherited CNVs
(Figure 1.1a).
17
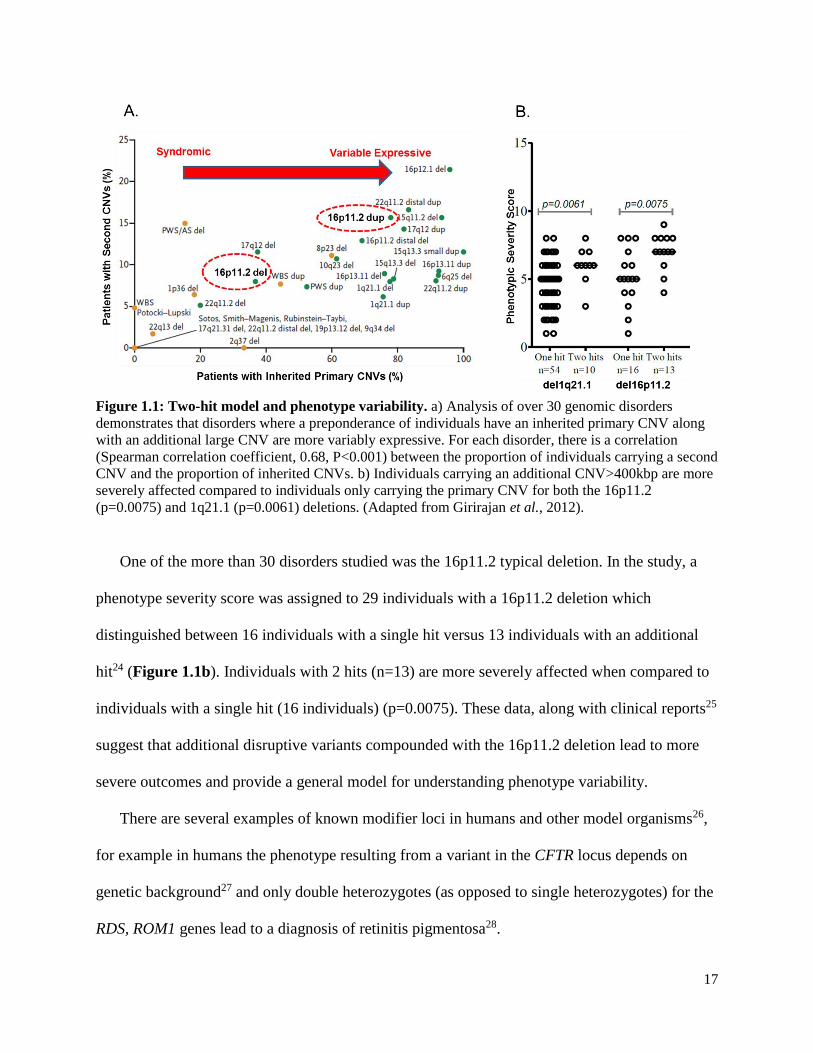
Figure 1.1: Two-hit model and phenotype variability. a) Analysis of over 30 genomic disorders
demonstrates that disorders where a preponderance of individuals have an inherited primary CNV along
with an additional large CNV are more variably expressive. For each disorder, there is a correlation
(Spearman correlation coefficient, 0.68, P<0.001) between the proportion of individuals carrying a second
CNV and the proportion of inherited CNVs. b) Individuals carrying an additional CNV>400kbp are more
severely affected compared to individuals only carrying the primary CNV for both the 16p11.2
(p=0.0075) and 1q21.1 (p=0.0061) deletions. (Adapted from Girirajan et al., 2012).
One of the more than 30 disorders studied was the 16p11.2 typical deletion. In the study, a
phenotype severity score was assigned to 29 individuals with a 16p11.2 deletion which
distinguished between 16 individuals with a single hit versus 13 individuals with an additional
hit24 (Figure 1.1b). Individuals with 2 hits (n=13) are more severely affected when compared to
individuals with a single hit (16 individuals) (p=0.0075). These data, along with clinical reports25
suggest that additional disruptive variants compounded with the 16p11.2 deletion lead to more
severe outcomes and provide a general model for understanding phenotype variability.
There are several examples of known modifier loci in humans and other model organisms26,
for example in humans the phenotype resulting from a variant in the CFTR locus depends on
genetic background27 and only double heterozygotes (as opposed to single heterozygotes) for the
RDS, ROM1 genes lead to a diagnosis of retinitis pigmentosa28.
18
1.5 The 16p11.2 CNV helps to define a subtype of autism
While individuals carrying the 16p11.2 CNV in the Simons VIP show extensive phenotype
variability8,9, the size of the cohort allows quantification of specific aspects of phenotype. While
the 16p11.2 deletion was initially ascertained in autism cohorts, an important conclusion is that
the 16p11.2 deletion is not primarily associated with a clinical diagnosis of autism13,15,29. In the
Simons VIP, for example, only 20 out of 84 carriers (24%) have a clinical diagnosis of autism
and only 15 (18%) meet strict criteria for an autism diagnosis based on the autism diagnostic
observation schedule (ADOS) and the autism diagnostic interview (ADI).
However, many of the individuals carrying the deletion have clinical features similar to
autism. Of the deletion carriers, for example 71% (60/85 carriers) show a speech or language-
related disorder such as expressive/mixed receptive-expressive language deficits or a
phonological processing (articulation) disorder. Carriers are also 2.7 times more likely to show
restricted or repetitive behavior patterns when compared to controls (88% of deletion carriers vs.
33% of controls showed more than two types of these behaviors). As expected15, a remarkable
decrement in full-scale IQ (FSIQ) of 26.8 points or 1.8 SD was observed when comparing
carriers and non-carriers29. The decrement was slightly greater for verbal IQ (VIQ), 27.6 points
or 1.5 SD, when compared to nonverbal IQ (NVIQ), 23.5 points or 1.6 SD. A population-based
study also found a significant decrement in VIQ in carriers vs. controls (p=5.90x10⁻¹⁶) as well as
a reduction in fecundity (p=1.6x10⁻¹²)30.
Despite these unifying features of the 16p11.2 deletion phenotype, the question remains: why
is there such great variability in disorder manifestation even within the context of a family
(Figure 1.2a)? Notwithstanding the limitations of the DSM-IV-TR31, it is clear that there are a
variety of diagnoses associated with the 16p11.2 deletion, with the number of distinct diagnoses
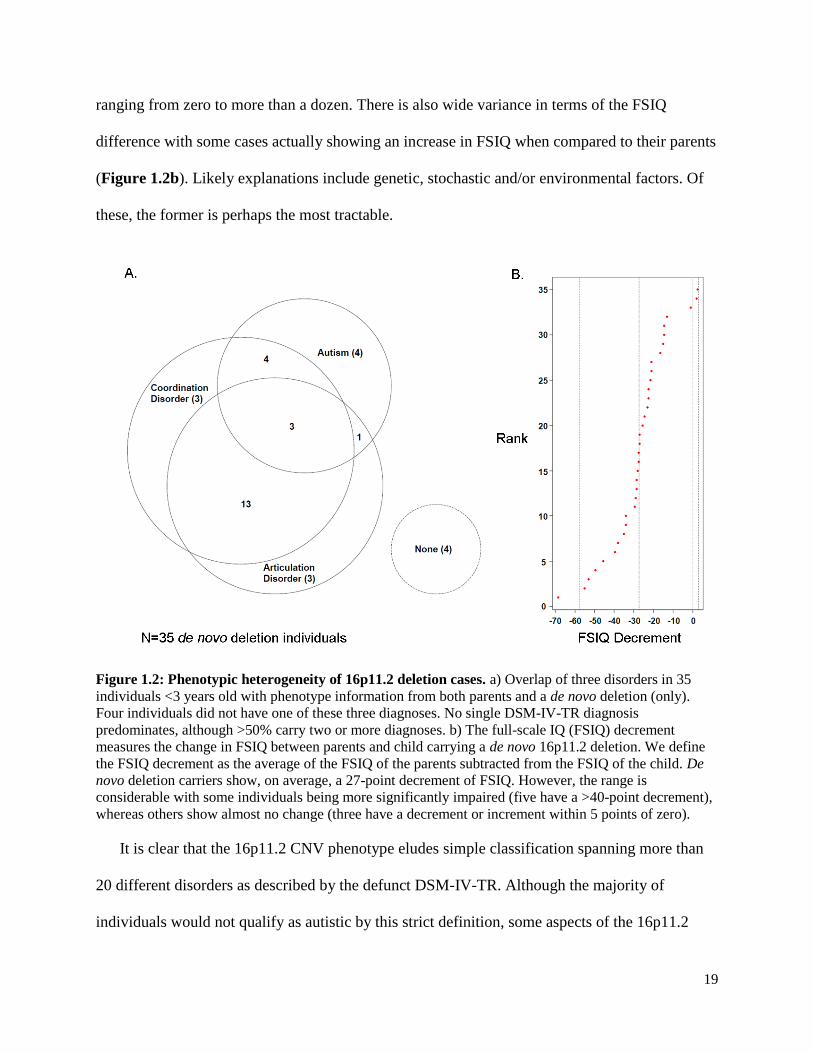
19
ranging from zero to more than a dozen. There is also wide variance in terms of the FSIQ
difference with some cases actually showing an increase in FSIQ when compared to their parents
(Figure 1.2b). Likely explanations include genetic, stochastic and/or environmental factors. Of
these, the former is perhaps the most tractable.
Figure 1.2: Phenotypic heterogeneity of 16p11.2 deletion cases. a) Overlap of three disorders in 35
individuals <3 years old with phenotype information from both parents and a de novo deletion (only).
Four individuals did not have one of these three diagnoses. No single DSM-IV-TR diagnosis
predominates, although >50% carry two or more diagnoses. b) The full-scale IQ (FSIQ) decrement
measures the change in FSIQ between parents and child carrying a de novo 16p11.2 deletion. We define
the FSIQ decrement as the average of the FSIQ of the parents subtracted from the FSIQ of the child. De
novo deletion carriers show, on average, a 27-point decrement of FSIQ. However, the range is
considerable with some individuals being more significantly impaired (five have a >40-point decrement),
whereas others show almost no change (three have a decrement or increment within 5 points of zero).
It is clear that the 16p11.2 CNV phenotype eludes simple classification spanning more than
20 different disorders as described by the defunct DSM-IV-TR. Although the majority of
individuals would not qualify as autistic by this strict definition, some aspects of the 16p11.2
20
deletion phenotype are remarkably consistent with a “type of autism” not yet recognized by the
DSM. These conclusions highlight the power of the genotype-first-based approach32 to studying
autism and neuropsychiatric disease more generally. Similar to reports for other autism genes33,
the findings presented suggest that “autism” phenotypes conditioned on a common genetic
etiology may be superior and more meaningful diagnostically than the strict DSM nosology.
1.6 The 16p11.2 CNV critical region
The typical 16p11.2 CNV deletes or duplicates a unique region of ~550kbp in length as well
as ~50kbp of segmental duplications (Figure 1.3). The unique part contains 27 genes and the
duplicated 3 genes and variation in these genes and their regulatory regions is likely important in
determining phenotype outcome. At least 17 of the 27 genes are neuronally expressed18 and a
bioinformatics analysis revealed that at least 12 of the genes are involved in a single interaction
network.9 Evidence from model organisms suggests that particular genes within the critical
region are associated with particular phenotypes34–36. In an attempt to determine the
macrocephaly phenotype associated with the 16p11.2 deletion, for example, a group used a
zebrafish model and systematically knocked out all unique genes in the critical region34 and
observed that knockout of the gene KCTD13 leads to macrocephaly in zebrafish. Despite this
result, none of the critical region genes have come to significance in human exome sequencing
studies, and only a handful of partial deletions of the region have been discovered, none
associated with a particular phenotype. A recent publication showed that compound inheritance
of a rare null variant and a hypomorphic allele of TBX6 accounted for 11% of congenital
scoliosis cases37. This suggests that a combination of deletion or duplication of critical region
genes or non-coding dosage imbalance in this region results in the observed phenotypes.

21
Figure 1.3: 16p11.2 critical region. The 16p11.2 critical region is flanked by segmental duplications
which mediate non-allelic homologous recombination. The critical region contains 27 genes, none have
which come to significance in exome sequencing studies, focal deletions are not associated with particular
phenotypes, and only one gene, KCTD13, is associated with a head size phenotype in zebrafish. In the
flanking segmental duplications lie three genes, one of which, BOLA2 is duplicated only in Homo sapiens
and has a putative role in cytosolic iron regulation. (Image adapted from Zufferey et al J. Med Genet,
2014).
Due to the highly identical segmental duplications flanking the critical region, these regions
have not been accurately assembled and the breakpoints were not resolved until recently38. High
identity (>99.5%) blocks of segmental duplications act as substrates for non-allelic homologous
recombination (NAHR), predisposing to genomic disorders39. Despite most individuals
presenting with a typical deletion or duplication, the possibility of distinct breakpoints
emphasizes the need to comprehensively assess the extent of the CNV in each individual. Recent
work assembling haplotypes using long-read sequencing of bacterial artificial chromosome
libraries from 8 humans and 3 non-human primates allowed design of molecular inversion
probes (MIPs) enabling refinement of the breakpoint down to a 90 kbp region that includes the
genes BOLA2, SLX1A, and SULT1A3. In 96% of the cases, the deletion or duplication fell in a 90
kbp duplicated region specific to Homo sapiens, not found in any of the non-human primates or
ancient hominins Neanderthal or Denisova. Hence, copy number of the three duplicate genes
may be an important determinant in phenotype severity.
22
1.7 The SAGE cohort
The Study of Autism Genetics Exploration (SAGE) cohort is a cohort collected at the
University of Washington of individuals with autism and/or intellectual disability. Families are
recruited to the study through (1) the Seattle Children’s Hospital Autism Center Clinic Registry;
(2) Area listservs for families with ASD, DD or ID (e.g. IAN, Autism Speaks, Parent to Parent,
ARC, FEAT, etc.); (3) Providers who work with individuals with ASD or DD. Blood samples
are collected from individuals and array CGH analysis is performed to identify large and
potentially pathogenic copy number variants. To date, a total of 252 families have been screened
for large CNVs, and a set of 42 families (148 samples, 21 trios, 20 quads, 1 quint) were selected
for exome sequencing. Families were chosen that were multiplex, to enrich for the possibility of
finding Mendelian variants, as well as those with a diagnosis of high functioning autism. No
family chosen had a likely pathogenic CNV.
Most variants discovered in the exome sequencing of large autism cohorts are found in
individuals with severe phenotypes. No study has decoupled intellectual disability with the other
features of autism, including lack of social reciprocity and repetitive behaviors. Through
studying these families as well as high functioning families from the Simons Simplex Collection
(SSC)40, I analyze all types of exonic variation to understand what contributes to autism in the
absence of intellectual disability.
1.8 Research goals and hypotheses
The overarching theme of my thesis is to assess the genetic basis of phenotype variability in
individuals with a variant strongly associated with the autism phenotype (genotype-first
ascertainment) or diagnosed with an ASD (phenotype-first ascertainment).

23
Genotype-first assessment of a 16p11.2 CNV cohort. My goal is to assess the genetic
basis of the phenotype variability in individuals with copy number variation at 16p11.2,
events which are strongly associated with autism but lead to variable phenotypes. I
hypothesize that differences in genetic background or in the CNV itself contribute to
phenotype variability and to the severity of disease. I divide my analyses into the
assessment and discovery of genetic modifiers internal and external to the 16p11.2
critical region and correlate these to phenotype.
Phenotype-first assessment of an ASD cohort. My goal is to assess individuals from
families with high functioning autism to discover a network of genes associated with the
social deficits of the ASDs without intellectual disability.
Stemming from these goals, I have several hypotheses:
1) Analysis of internal and external modifiers in the background of a 16p11.2 CNV will
identify genetic features important for phenotype penetrance and hence clinical
ascertainment.
2) The analysis of exome sequencing data from individuals with high functioning autism
will reveal a network of genes and classes of variants responsible for the social deficits
associated with the ASDs.
3) In the majority of cases, several variants or modifiers must be present to lead to as
clinically ascertainable phenotype (oligogenic model).
In order to address these hypotheses, my thesis has two broad aims:
Aim 1: Assessment of genetic modifiers in a cohort of individuals with a 16p11.2 CNV and
their non-carrier family members.

24
In this aim, I divide modifiers into those internal and external to the 16p11.2 critical region.
For internal modifiers, I assess variation in the 27 unique and 3 duplicated 16p11.2 critical
region genes. For external modifiers, I assess CNVs discovered in addition to the 16p11.2 CNV,
and exonic variants outside of the critical region. I use a large population of individuals with
intellectual disability or autism and controls to assess variation in the 3 duplicated 16p11.2
critical region genes, due to low sequencing coverage in variant databases.
Aim 2: Analyze a high functioning autism and intellectual disability cohort to determine
genes associated with the social deficits of ASD
In this aim, I assess variants discovered from the exome sequencing of a cohort of 42 locally
collected families with a diagnosis of intellectual disability and/or autism, of which 29 have a
diagnosis of high functioning autism.
The ultimate goal of my thesis is to understand the genetic modifiers that underlie the
phenotype variability associated with the ASDs. First, I analyze a cohort of individuals carrying
the 16p11.2 CNV to assess the presence of genetic modifiers in individuals already carrying a
variant associated with autism. Second, I assess a cohort of high functioning autism cases to
understand the variants associated with the social deficits of ASD in the absence of ID. The
results of my research will inform future experiments, allow for correct interpretation of
transcriptomic, induced pluripotent stem cell, and other resources, and has the potential to
immediately improve clinical diagnosis and counseling of affected individuals and their families.
25
2. Maternal Modifiers and Parent-of-Origin Bias of the Autism-
Associated 16p11.2 CNV
This chapter has been published: Duyzend, MH, Nuttle X, Coe BP, Baker C, Nickerson DA,
Bernier R, Eichler EE. Am. J. Hum. Genet. 98, 45-57 (2016).
I designed the study with Evan E. Eichler, performed array CGH experiments with Carl Baker,
wrote analysis software, analyzed data, and wrote the paper with Evan E. Eichler.
2.1 Summary
Recurrent deletions and duplications at chromosome 16p11.2 are a major genetic contributor
to autism but also associate with a wider range of pediatric diagnoses, including intellectual
disability, coordination disorder, and language disorder. In order to investigate the potential
genetic basis for phenotype variability, I assessed the parent-of-origin of the 16p11.2 copy
number variant (CNV) and the presence of additional CNVs in 126 families where detailed
phenotype data were available. Among de novo cases, I found a strong maternal bias for the
origin of deletions (59/66, 89.4% of cases, p=2.38 x 10⁻¹¹), the strongest such effect so far
observed for a CNV associated with a microdeletion syndrome. In contrast to de novo events, I
observed no transmission bias for inherited 16p11.2 CNVs, consistent with a female meiotic
hotspot of unequal crossover driving this maternal bias. I analyzed this 16p11.2 CNV cohort for
the presence of secondary CNVs and found a significant maternal transmission bias (32 maternal
vs. 14 paternal, p=1.14 x 10⁻²). Of the secondary deletions that disrupted a gene, 92% were either
maternally inherited or de novo (p=3.4 x10⁻³). Nine probands carry secondary CNVs that disrupt
genes associated with autism and/or intellectual disability risk variants. Our findings demonstrate
a strong bias in maternal origin of 16p11.2 de novo deletions as well as a maternal transmission
bias for secondary deletions that contribute to the clinical outcome on a background sensitized by
the 16p11.2 CNV.
26
2.2 Introduction
Duplication and deletion of an ~550 kbp region on chromosome 16p11.2 accounts for ~1%
of autism cases, representing one of the most common contributors to autism spectrum disorder
(ASD) in the human population9,41. Unlike many other syndromic disorders, such as Smith-
Magenis or Prader-Willi syndromes, detailed studies of individuals with the 16p11.2 copy
number variant (CNV) have revealed marked phenotypic variability13–15,42–47. Phenotypic studies
indicate different and sometimes mirror phenotypes associated with the CNV. For example, the
deletion has been associated with seizures15, obesity16, intellectual disability14, and
macrocephaly13, while the duplication has been associated with schizophrenia18, reduced body
mass index (BMI)48, and microcephaly13. While it is clear that the 16p11.2 CNV confers a strong
risk for neurodevelopmental disease20,21,49,50, it is likely that other factors, including genetic
background, may be key in determining the severity of phenotype outcome24,37.
Recently, a cohort of over 120 families, with at least one proband carrying a 16p11.2 CNV,
was assembled as part of the Simons Variation in Individuals Project (Simons VIP)51. This
collection is one of the largest cohorts for the 16p11.2 CNV and is distinctive in its
comprehensive phenotypic assessment of participants. It offers a useful resource to study genetic
differences on a background sensitized by a known pathogenic CNV and how these differences
affect phenotype severity. In this analysis, carriers of the 16p11.2 CNV refer to either probands
or other family members that are heterozygous for the deletion or duplication irrespective of
diagnostic ascertainment or inheritance status. The goal of this study was twofold: 1) to provide
genetic detail regarding the extent and transmission characteristics of the CNV in these families
and 2) to investigate the presence of CNVs in addition to the 16p11.2 CNV in modifying the
severity of the phenotype. For clarity and to distinguish from the ascertained 16p11.2 CNV, we
27
will refer to the rare additional CNVs (present in <0.1% of controls) as secondary CNVs. In this
study, we assess the parent-of-origin and mechanism of unequal crossing over for the 16p11.2 de
novo CNVs and examine transmission bias for secondary CNVs within these families.
2.3 Subjects and methods
2.3.1 Samples
DNA samples were derived from peripheral blood obtained from 482 individuals from 141
16p11.2 CNV families as part of the Simons VIP. Exclusion criteria included any additional
pathogenic CNVs or other neurogenetic or neurological diagnoses unrelated to 16p11.251.
Greater than 80% of probands were of full European ancestry (Table S1). We utilized the
Simons VIP release (9.30.2014) of phenotypic information for these individuals. All procedures
for clinical assessment and blood extraction were approved by the institutional review boards
(IRBs) of participating institutions, and informed consent was obtained for participation in this
research.
2.3.2 Phenotypic assessment
As part of participation in the Simons VIP51, standardized assessments, including psychiatric,
neurocognitive, behavioral, motor, and neurologic evaluation, were conducted at three Simons
VIP clinical sites along with collection of a detailed medical history through interview and
medical records review for each participant. Psychiatric and neurodevelopmental conditions
were diagnosed by experienced, licensed clinicians following DSM-IV-TR criteria31 using all
available information, including clinical observation, caregiver history, and records review.
Diagnostic foci included: ASD, attention deficit hyperactivity disorder (ADHD), communication

28
disorders, anxiety disorders, mood disorders, intellectual disability, tic disorders, elimination
disorders, learning disorders, and behavioral disorders, totaling 27 diagnostic codes. Full-scale
intelligence quotient (FSIQ) was determined by the developmentally appropriate cognitive
measure (Mullen Scales of Early Learning52), the Differential Abilities Scale, Second Edition53,
or the Wechsler Abbreviated Scales of Intelligence54. For our phenotype analysis, we define the
FSIQ decrement as the average of the FSIQ of the parents subtracted from the FSIQ of the
proband (Table 1).
2.3.3 CNV detection
Single-nucleotide polymorphism (SNP) microarray data was generated from the Illumina
HumanOmniExpress v1 (104 probands, 280 family members) and v2 (26 probands, 72 family
members) microarray platforms. Each microarray contains over 715,000 probes and has the
power to detect CNVs >100 kbp with more than 95% sensitivity (Figure S1). CNVs were
detected using the cnvPartition algorithm (see Web Resources). We chose this algorithm
because its performance (as determined by the cnvPartition score) had been previously optimized
by comparison against CNVs detected by deep whole-genome sequence data55. For both array

29
designs, we generated a cluster definition file from only the individuals that did not carry the
16p11.2 CNV using the Illumina Genome Studio software (see Web Resources). Samples in the
extremes for call rate and autosomal LogR standard deviation were manually inspected. We
assessed one triplication family, which we did not include in the subsequent analysis, and
removed families where the proband did not have the expected 16p11.2 CNV identified in the
clinic (Simons VIP families 14904 and 14925). Familial relationships were assessed using the
program KING56, and samples that did not match their expected pedigree membership were
removed (Table S1). The analysis showed that the probands were unrelated with the exception
of two probands that have a possible third-degree relationship (14710.x7 and 14877.x7). To
ensure accurate comparisons between OmniExpress platforms, we required a minimum of seven
probes within unique regions for both platforms and excluded the call if it contained >50%
segmental duplication. Calls with the same state in the same individuals within 500 kbp of one
another were merged if appropriate following manual inspection and all calls identified as de
novo were manually inspected. A subset of the calls >100 kbp were validated using an array
comparative genomic hybridization (CGH) platform (Tables S2, S3). Following this curation,
102 probands and 264 family members were analyzed on the HumanOmniExpress v1 platform
and 24 probands and 68 family members were analyzed on the HumanOmniExpress v2 platform.
Secondary CNVs intersecting genes associated with autism risk variants were defined using the
SFARI gene list (June 2015, see Web Resources). We used the two-sided binomial test in this
study, unless indicated otherwise.
30
2.3.4 CNV inheritance and validation
For each CNV call in a proband, we genotyped parents and siblings (if present), computed
the median log ratio across these regions, and used this information to genotype across the
family. We further validated a subset of large (>100 kbp) CNVs using a custom array CGH
platform (Table S3). We utilized a previously designed custom 12-plex NimbleGen array with a
total of 135,000 probes targeted to genomic hotspots for CNV detection57. The hotspot array
consists of a high density of probes (approximately 2.6 kbp apart) targeting 107 genomic hotspot
regions and a probe spacing of approximately 36 kbp in the genomic backbone. Array
hybridization experiments and analysis were performed as described previously57. All signal
intensities from the array CGH experiments were loaded onto a UCSC Genome Browser mirror
(Santa Cruz, CA, USA) and manually visualized. 26/34 secondary CNVs >100 kbp called by the
SNP microarray were validated by array CGH. The eight events that did not validate had
insufficient coverage on the array CGH platform (≤5 probes spanning the region).
2.3.5 Control CNV analysis
To assess the population frequency of each secondary CNV, we used two sets of curated
control samples. Set I focuses on larger CNVs from 19,584 previously published controls19
where ethnicity is similar to our cases (79.2% with known ethnicity are of European descent).
Set II is a curated set of 4,092 samples from the Welcome Trust Case Control Consortium
(WTCCC, see Web Resources) analyzed using a custom Illumina 1.2 million SNP microarray.
The higher density of probes in Set II increases sensitivity for smaller events compared to Set I.
Set II CNVs were recalled using the cnvPartition algorithm in order to improve the comparison
with the case calls. We called CNVs on 2920 samples from the WTCCC 58C cohort and 2698

31
samples from the WTCCC UKBS (UK Blood Service) cohort. The ethnicity of the UKBS cohort
is 100% European ancestry. While the ethnicity of the 58C cohort is not available, this is a 1958
British Birth Cohort and therefore likely to contain primarily individuals of European descent.
Controls were not ascertained specifically for neurological disorders, but all controls were
obtained from adult samples providing informed consent, so severe developmental phenotypes
should be exceedingly rare.
Samples with a SNP call rate <0.98 and/or an autosomal LogR standard deviation ≤0.37 were
removed19. We utilized an outlier detection method for skewed data58 to identify and remove
additional samples with an excess of calls and/or excess of larger calls (>100 or >500 kbp).
Finally, we applied this outlier method to exclude CNVs within these size ranges when their
mean LogR–median LogR value was greater than 0.2 or less than -0.15—known characteristics
of false positive calls. 4092 samples passed quality control (2025 samples from the 58C cohort
and 2067 from the UKBS cohort). Similar to our analysis of case CNVs, we required at least
seven unique probes for each CNV call. Calls with the same CNV state and mapping within 500
kbp of one another were manually inspected and merged if appropriate. To assess frequency of
case CNVs, we computed the number of state-matched events that have a 50% reciprocal overlap
with a control event in both Set I and Set II. Because of the probe density, Set II offered greater
sensitivity for assessing the frequency of smaller CNVs in cases. In addition, Set II uses the same
technology as the case platforms and CNV calls were made using the same algorithm. We only
considered secondary CNVs as rare if there were sufficient probes to call the variant in either Set
I or Set II and the estimated control frequency was below 0.1% (Table S3).

32
2.3.6 De novo 16p11.2 CNV parent-of-origin analysis
We used the signal intensity data (LogR) to confirm the presence of the 16p11.2 CNV and b-
allele frequency (BAF) across the critical region to infer the parent-of-origin for 79 families
where a de novo 16p11.2 CNV had been identified (Figure 2.1a-b, Tables S4, S5). This
included 64 individuals from the Simons VIP (58 deletions, 6 duplications) as well as 15
individuals from the Simons Simplex Collection (SSC) that were previously assessed using SNP
microarrays12,59 (8 deletions, 7 duplications, Table S6). In total, 34 quads, 22 trios and 10
probands with single parents were used to assess de novo deletion cases (Table S4). A total of 8
quads and 5 trios were used to assess de novo duplication cases (Table S5). We restricted this
analysis to probes mapping within the 16p11.2 critical region (112 for the OmniExpress arrays).
For deletions, only two genotypes are possible for each probe (A or B) with a corresponding
BAF of 0 or 1, while for duplications four genotypes (AAA, AAB, ABB, and BBB) with
corresponding BAFs of 0, 1/3, 2/3, and 1, respectively, are possible (see Supplemental
Appendix). For cases where we had SNP microarray data from both parents (trios), we
computed the probability that the unaffected haplotype came from the mother or father using
parental SNP genotypes. In the deletion cases where we had only one parent available, but the
16p11.2 deletion was previously confirmed as de novo, we estimated the probability of the
genotypes for the unobserved parent using the known allele frequencies for particular probes
from the 1000 Genomes Project60. To test the fidelity of this approach for incomplete deletion
families, we estimated the false discovery rate by removing a parent from a subset of the families
where we had information from both parents (Table S7). Using this approach, 78/88 parent-of-
origin estimates matched our inferences for a false discovery rate of 11.4%.
33
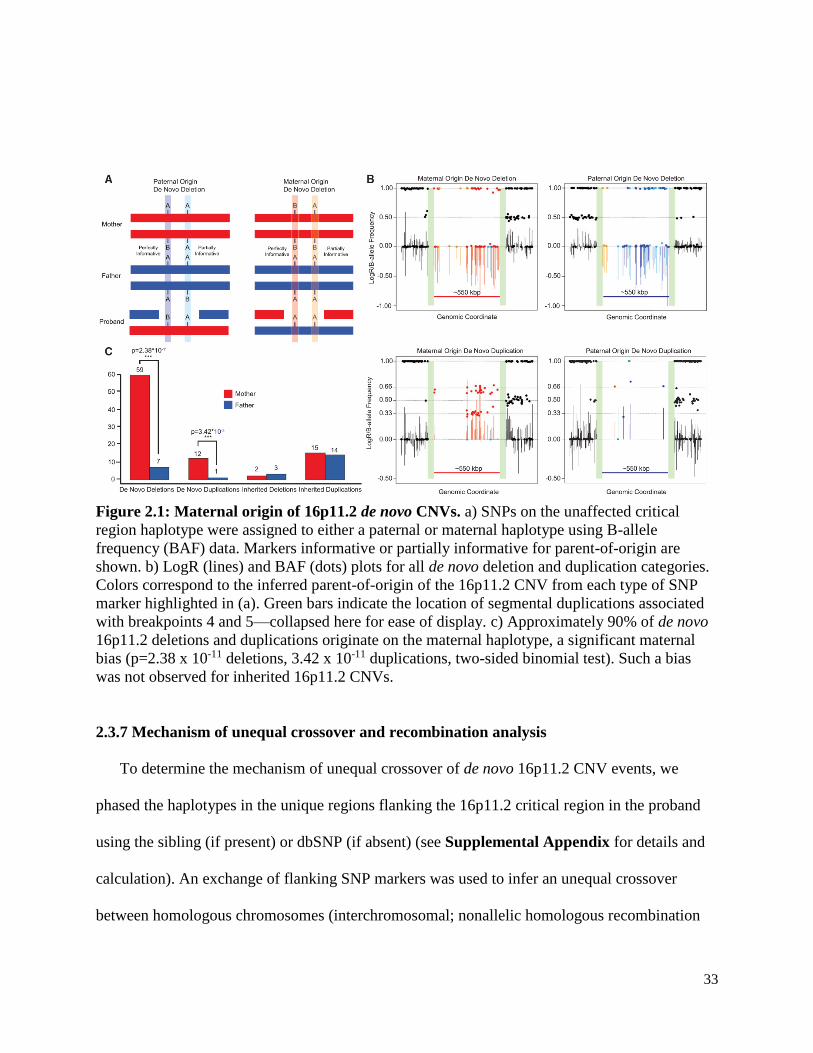
Figure 2.1: Maternal origin of 16p11.2 de novo CNVs. a) SNPs on the unaffected critical
region haplotype were assigned to either a paternal or maternal haplotype using B-allele
frequency (BAF) data. Markers informative or partially informative for parent-of-origin are
shown. b) LogR (lines) and BAF (dots) plots for all de novo deletion and duplication categories.
Colors correspond to the inferred parent-of-origin of the 16p11.2 CNV from each type of SNP
marker highlighted in (a). Green bars indicate the location of segmental duplications associated
with breakpoints 4 and 5—collapsed here for ease of display. c) Approximately 90% of de novo
16p11.2 deletions and duplications originate on the maternal haplotype, a significant maternal
bias (p=2.38 x 10⁻¹¹ deletions, 3.42 x 10⁻¹¹ duplications, two-sided binomial test). Such a bias
was not observed for inherited 16p11.2 CNVs.
2.3.7 Mechanism of unequal crossover and recombination analysis
To determine the mechanism of unequal crossover of de novo 16p11.2 CNV events, we
phased the haplotypes in the unique regions flanking the 16p11.2 critical region in the proband
using the sibling (if present) or dbSNP (if absent) (see Supplemental Appendix for details and
calculation). An exchange of flanking SNP markers was used to infer an unequal crossover
between homologous chromosomes (interchromosomal; nonallelic homologous recombination

34
(NAHR) during meiosis I); maintenance of haplotype phase (i.e., no exchange) was classified as
intrachromosomal or interchromatidal (likely NAHR during meiosis II). Male and female
recombination rates for the critical region were obtained from Kong et al.61 The genetic distance
between the leftmost and rightmost markers in our analysis is 6.20 centiMorgans for the female
versus 0.45 centiMorgans for the male, which corresponds to a probability of crossover of 6.2%
for the female and 0.45% for the male, respectively. We also used the recombination rate data to
estimate the average difference between male and female recombination rates within the 16p11.2
critical region, and in 550 kbp regions genome-wide, for comparison. We sampled 10,000
regions of 550 kbp (the size of the 16p11.2 critical region), excluding regions containing
segmental duplications or gaps and the sex chromosomes, and determined that the region ranks
in the 87th percentile for mean difference between male and female recombination rates genome-
wide (Figure S2).
2.4 Results
2.4.1 Characterization of 16p11.2 CNVs in the Simons VIP cohort
We confirmed the presence or absence of the 16p11.2 deletion or duplication using a SNP
microarray (Illumina OmniExpress) in a total of 459 individuals from 126 families where either a
duplication (n=36) or deletion proband (n=90) had been identified (Table 2). For 81% of the
probands (102/126) DNA was available from at least one parent and 60% (76/126) had DNA
available from both parents (Table S1). We confirmed the presence of the canonical breakpoint
4 to breakpoint 5 (BP4-BP5) deletion or duplication for most (125/126) of the probands,
corrected familial transmission status for one Simons VIP family (14784.x15, Figure S3), and
confirmed the presence of a de novo deletion in a set of monozygotic twins (family 14824,

35
Figure S4). In one severely affected proband (14720.x7), we identified a larger 2 Mbp deletion
extending from BP2 to beyond BP5 (Figure S5)15. In addition to cases screened with available
DNA, phenotype information is available for a larger set of 150 probands and their family
members. Considering the entire Simons VIP collection, for cases where both parents were also
screened for the 16p11.2 CNV (109/150) based on clinical microarray, FISH and/or the present
analysis, 90% of deletion cases (65/72) were de novo or mosaic in the germline. In contrast, only
24% (9/37) of duplication cases were confirmed as de novo.
2.4.2 Maternal parent-of-origin of the 16p11.2 CNV
We observe a striking maternal bias for the parent-of-origin of 16p11.2 de novo deletions
(Figure 2.1). 89.4% (59/66) occur on the maternal haplotype, representing a significant
departure from expectation (p=2.38x10⁻¹¹) (Figure 2.1c). A similar result was observed for
duplications (12 maternal vs. 1 paternal, p=3.42x10⁻¹¹). For inherited 16p11.2 CNVs for which
we have information from both parents, we observed no significant parental transmission biases
for either duplication (15/29 maternal, p=1) or deletion (2/5 maternal, p=1) cases (Figure 2.1c,
36
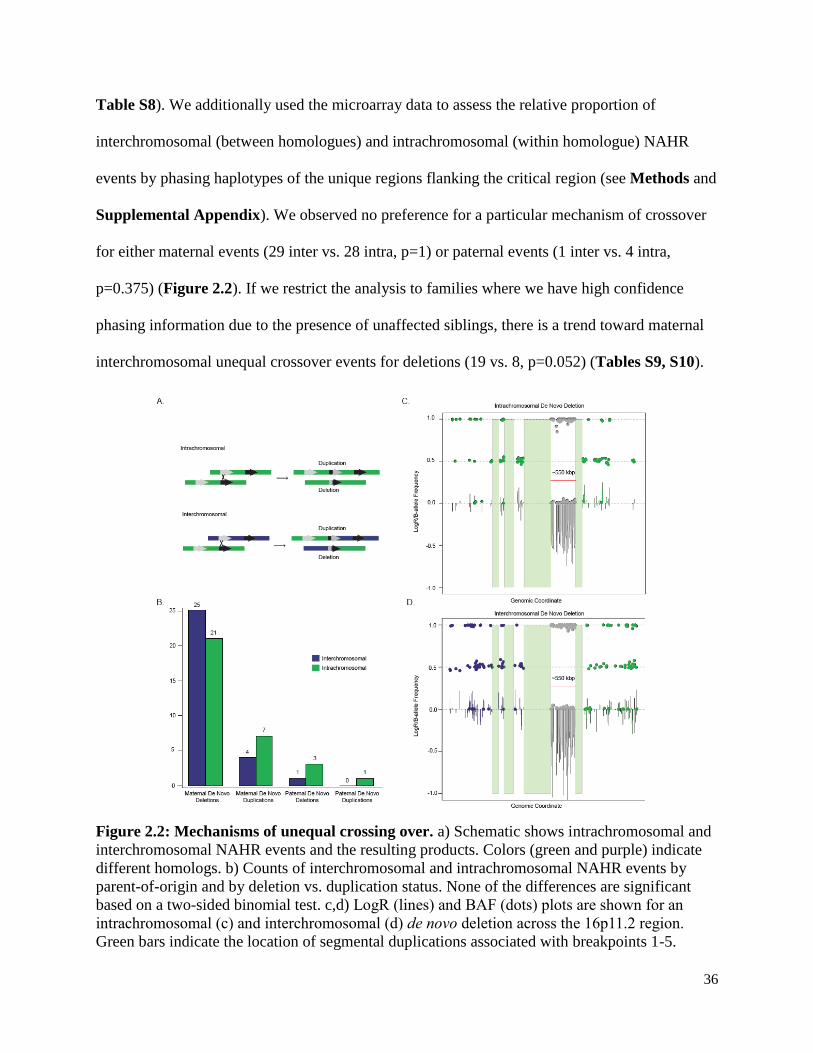
Table S8). We additionally used the microarray data to assess the relative proportion of
interchromosomal (between homologues) and intrachromosomal (within homologue) NAHR
events by phasing haplotypes of the unique regions flanking the critical region (see Methods and
Supplemental Appendix). We observed no preference for a particular mechanism of crossover
for either maternal events (29 inter vs. 28 intra, p=1) or paternal events (1 inter vs. 4 intra,
p=0.375) (Figure 2.2). If we restrict the analysis to families where we have high confidence
phasing information due to the presence of unaffected siblings, there is a trend toward maternal
interchromosomal unequal crossover events for deletions (19 vs. 8, p=0.052) (Tables S9, S10).
Figure 2.2: Mechanisms of unequal crossing over. a) Schematic shows intrachromosomal and
interchromosomal NAHR events and the resulting products. Colors (green and purple) indicate
different homologs. b) Counts of interchromosomal and intrachromosomal NAHR events by
parent-of-origin and by deletion vs. duplication status. None of the differences are significant
based on a two-sided binomial test. c,d) LogR (lines) and BAF (dots) plots are shown for an
intrachromosomal (c) and interchromosomal (d) de novo deletion across the 16p11.2 region.
Green bars indicate the location of segmental duplications associated with breakpoints 1-5.

37
2.4.3 Secondary CNVs and maternal transmission bias
We considered the presence of secondary rare CNVs (frequency <0.1% of controls) as a
potential modifier of phenotype severity within the context of each family. The SNP microarray
used in this study to detect CNVs has >95% sensitivity for detecting events >100 kbp throughout
the genome, although we note that events as small as 2 kbp can be detected (Figure S1). Despite
the Simons VIP exclusion criteria for additional pathogenic CNVs, 70% of assessed probands
(88/126) carried at least one secondary CNV, with 35% (44/126) of probands having two or
more secondary CNVs. The fraction of deletion and duplication probands carrying a secondary
CNV is similar (69% and 69.5%, respectively) and no significant differences in secondary CNV
presence were observed between males and females (65% and 75%, respectively) (Tables 3,
S11). Overall, only five of the secondary CNVs were determined to be de novo (4 deletions and
1 duplication), although in 40% of the families (50/126) inheritance status could not be
determined due to the absence of DNA from both parents. Over a third (50/126) of all probands
carried a secondary CNV greater than 100 kbp in size (Tables 3, S11). 81 secondary CNVs
disrupted an annotated exon of a gene. Eleven of these corresponded to genes associated with
autism risk variants (Table S12), consistent with their potential contribution to disease etiology
in the nine individuals in which they were found.
Among secondary CNVs where inheritance could be unambiguously determined (i.e. both
parents screened), maternally inherited events predominate (52 maternal vs. 35 paternal,
p=0.086). The maternal bias is strongest for the most likely pathogenic events. If we consider
only secondary deletions, 70% are transmitted maternally (32 maternal vs. 14 paternal, p=1.14 x
10-2). This is significant both in terms of the number of events as well as the number of probands
inheriting an event from a particular parent (29 maternal vs. 10 paternal, p=3.38x10⁻³). This
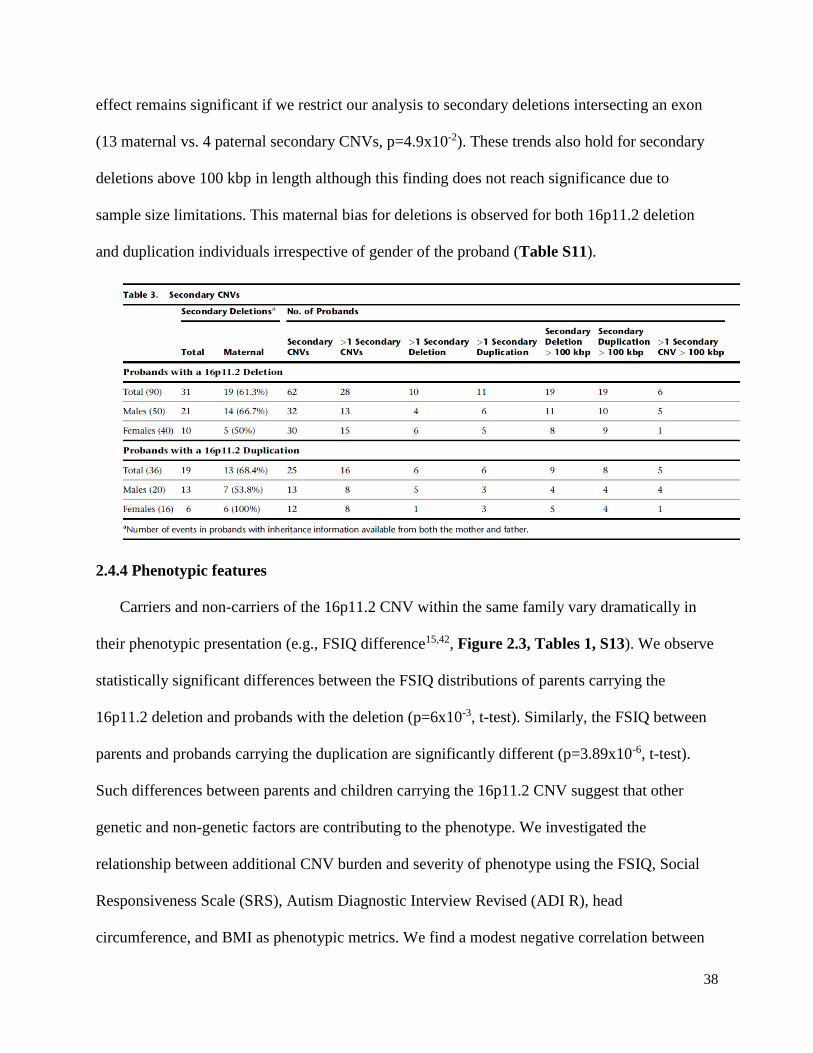
38
effect remains significant if we restrict our analysis to secondary deletions intersecting an exon
(13 maternal vs. 4 paternal secondary CNVs, p=4.9x10⁻²). These trends also hold for secondary
deletions above 100 kbp in length although this finding does not reach significance due to
sample size limitations. This maternal bias for deletions is observed for both 16p11.2 deletion
and duplication individuals irrespective of gender of the proband (Table S11).
2.4.4 Phenotypic features
Carriers and non-carriers of the 16p11.2 CNV within the same family vary dramatically in
their phenotypic presentation (e.g., FSIQ difference15,42, Figure 2.3, Tables 1, S13). We observe
statistically significant differences between the FSIQ distributions of parents carrying the
16p11.2 deletion and probands with the deletion (p=6x10⁻³, t-test). Similarly, the FSIQ between
parents and probands carrying the duplication are significantly different (p=3.89x10⁻⁶, t-test).
Such differences between parents and children carrying the 16p11.2 CNV suggest that other
genetic and non-genetic factors are contributing to the phenotype. We investigated the
relationship between additional CNV burden and severity of phenotype using the FSIQ, Social
Responsiveness Scale (SRS), Autism Diagnostic Interview Revised (ADI R), head
circumference, and BMI as phenotypic metrics. We find a modest negative correlation between

39
FSIQ and the number of secondary CNVs (R2=0.04, p=0.03, Figure S6). This signal is driven
primarily by secondary deletions and is consistent with previous findings on the overall burden
of CNV deletions and reduced IQ24. Although no other significant correlations are observed with
other quantitative measurements, an examination of the clinical details for individuals carrying
these secondary CNVs showed evidence of clinodactyly, scoliosis, hypopigmentation and
craniofacial abnormalities consistent with a more severe phenotypic outcome.
Figure 2.3: Familial IQ decrement in 16p11.2 deletion and duplication families. a) Density
plots of FSIQ for deletion families (a) and duplication families (b) from the entire Simons VIP
cohort. The significant decrement between parents carrying a 16p11.2 deletion and inherited
deletion probands (p=6x10⁻³, t-test) and between parents carrying a 16p11.2 duplication and
inherited duplication probands (p=3.89x10⁻⁶, t-test), shown in the third panel of a and b suggest
factors other than the 16p11.2 CNV contribute to FSIQ decrement.
Among the secondary CNVs were several deletions and duplications corresponding to genes
strongly implicated in synaptic function and/or risk of autism. Nine individuals, for example, had
rare deletions or duplications in genes implicated in autism as defined by a curated list of genes
40
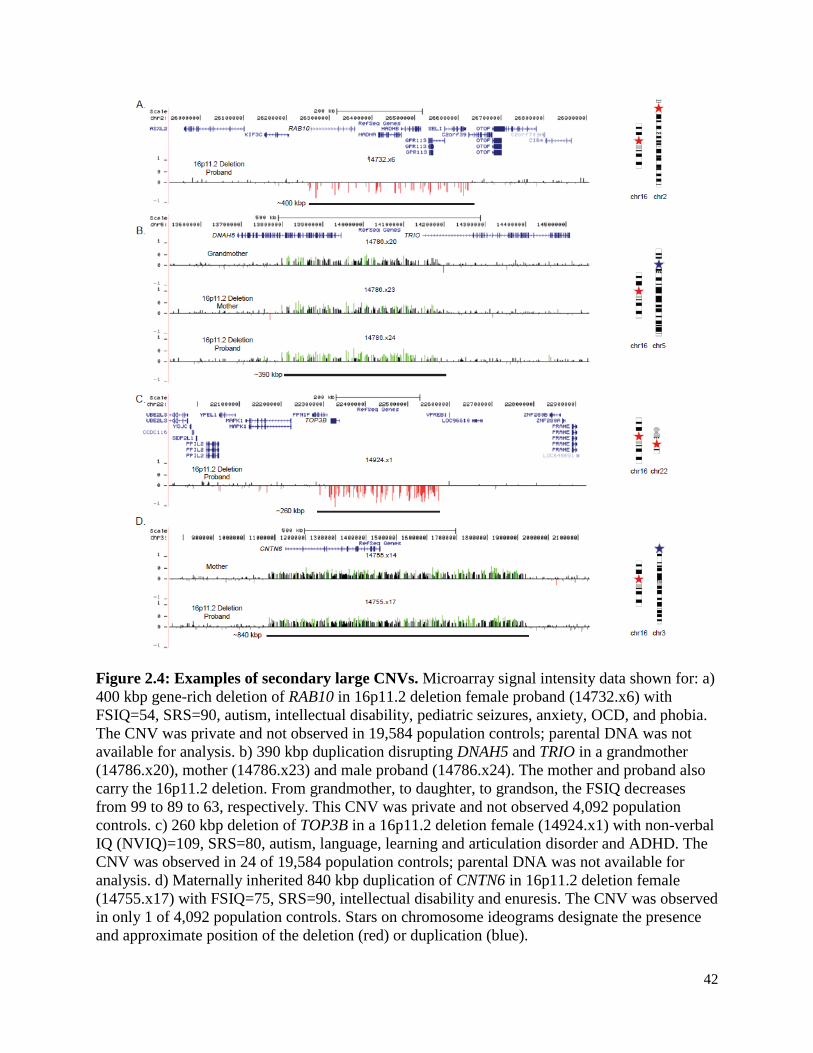
associated with autism risk (see Web Resources), including CACNA2D3 [MIM 606399], TRIO
[MIM 601893], and KATNAL2 [MIM 614697] (Table S12). In a proband with a 16p11.2
deletion we validated an additional private ~400 kbp deletion that affects six genes, including
RAB10 [MIM 612672]—a gene important in vesicular transport and membrane trafficking in
neurons33. This proband is among the most severely affected females in our cohort. She exhibits
autism (SRS=90), intellectual disability (FSIQ=54), pediatric seizures, anxiety, obsessive
compulsive disorder (OCD) and phobia along with structural defects of the brain, including
enlarged ventricles and abnormal cerebellar vermis and corpus callosum (Figure 2.4a). As DNA
is not available for either parent, inheritance status for both deletions is unknown. The severity of
this proband is similar to the male proband with severe intellectual disability (NVIQ=29) who
carried an atypical deletion of 16p11.2 encompassing more than 50 genes (Figure S5). We also
discovered a secondary duplication disrupting DNAH5 [MIM 603335] and TRIO that was
transmitted from grandmother, to daughter, to son. Transmission of this CNV was associated
with a characteristic facies. While the mother and son both carry the 16p11.2 deletion, the
severity of the phenotype based on FSIQ increased from generation to generation (Figure 2.4b)
with the son manifesting other features such as gynecomastia, clinodactyly and scoliosis.
In a high-functioning female autism proband carrying a 16p11.2 deletion, a ~250 kbp
additional deletion of TOP3B [MIM 603582] was validated (Figure 2.4c). TOP3B has been
strongly implicated in neurodevelopmental disorders and is thought to be important in the co-
recruitment of FMRP to mRNPs62. While this event is found in 24 of 19,584 controls (0.123%),
this same deletion in the homozygous state was found to be segregating with schizophrenia or
intellectual disability in three Northern Finnish families63. We discovered an 840 kbp duplication
harboring the autism risk locus, contactin-6 (CNTN6 [MIM 607220]), transmitted from a mother
41
(Broader Autism Phenotype Questionnaire (BAPQ) 124) to her daughter (Figure 2.4d). In this
particular case, the autistic daughter inherited the 16p11.2 deletion from her father. Hence, this is
a case where a 16p11.2 deletion is transmitted from the father, and a secondary event from the
mother. We also observe in this proband a smaller ~50 kbp de novo deletion disrupting BIRC6
[MIM 605638]. BIRC6 inhibits apoptosis through facilitating the degradation of apoptotic
proteins by ubiquitination64, and previous studies have identified three de novo variants in this
gene in individuals with an ASD diagnosis65,66. In this family, it is highly unlikely that the
decrement in IQ can be solely attributed to the 16p11.2 deletion event since the FSIQ of the
father carrying the 16p11.2 deletion and his proband daughter who also carries the 16p11.2
deletion differ by more than 28 points. In addition to these autism candidates, we note that two
16p11.2 duplication carriers have rare independent deletions in CTNNA3 [MIM 607667] (Figure
S7)—a locus previously associated with autism67,68 and for which rare deletions have been
reported in ASD individuals3.
42
Figure 2.4: Examples of secondary large CNVs. Microarray signal intensity data shown for: a)
400 kbp gene-rich deletion of RAB10 in 16p11.2 deletion female proband (14732.x6) with
FSIQ=54, SRS=90, autism, intellectual disability, pediatric seizures, anxiety, OCD, and phobia.
The CNV was private and not observed in 19,584 population controls; parental DNA was not
available for analysis. b) 390 kbp duplication disrupting DNAH5 and TRIO in a grandmother
(14786.x20), mother (14786.x23) and male proband (14786.x24). The mother and proband also
carry the 16p11.2 deletion. From grandmother, to daughter, to grandson, the FSIQ decreases
from 99 to 89 to 63, respectively. This CNV was private and not observed 4,092 population
controls. c) 260 kbp deletion of TOP3B in a 16p11.2 deletion female (14924.x1) with non-verbal
IQ (NVIQ)=109, SRS=80, autism, language, learning and articulation disorder and ADHD. The
CNV was observed in 24 of 19,584 population controls; parental DNA was not available for
analysis. d) Maternally inherited 840 kbp duplication of CNTN6 in 16p11.2 deletion female
(14755.x17) with FSIQ=75, SRS=90, intellectual disability and enuresis. The CNV was observed
in only 1 of 4,092 population controls. Stars on chromosome ideograms designate the presence
and approximate position of the deletion (red) or duplication (blue).

43
2.5 Discussion
Our results show that most recurrent rearrangements between breakpoints 4 and 5 in
chromosome 16p11.2 originate maternally. Specifically, nearly 90% of de novo deletions and
duplications arise on maternal haplotypes, with an approximately equal proportion of inter and
intrachromosomal rearrangements consistent with unequal crossover events during meiosis I and
II, respectively. This observation stands in stark contrast to 75-80% of de novo CNVs identified
in other studies that originate paternally69,70. Excluding genomic disorders associated with
imprinted loci, a maternal parent-of-origin bias has been reported for two genomic disorders to
date: the NF1 region on 17q11.2 and the 22q11.2 microdeletion associated with velocardiofacial
and DiGeorge syndromes71,72. Neither of these regions, however, demonstrates such a high level
of female bias as what we have observed for the 16p11.2 CNV. For 16p11.2, we observe no
correlation with advanced maternal age (p=0.43, t-test) (Tables S4, S5) and there is no
compelling evidence of imprinted genes within the critical region73,74. Importantly, no bias is
observed in maternal or paternal transmission for inherited events arguing against selection at the
level of the germline or early embryogenesis.
The most likely explanation for this maternal bias is different recombination rates at 16p11.2
between males and females. Examining data from published recombination maps61,75, there is a
clear hotspot of female recombination within the critical region (Figure S8). Females have a
significantly higher mean recombination rate within this region than do males (0.82 vs. 0.083,
p=0.01, t-test) with this particular region ranking in the 87th percentile for mean difference
between male and female recombination genome-wide (Figure S2). The maximum
recombination rate for females for the 16p11.2 critical region is 13.24, whereas for males it is
1.27, a more than tenfold difference. A much milder excess of female recombination is also
44
noted for the 22q11.2 microdeletion (1.2- to 2.8-fold) commensurate with a more subtle maternal
bias for this genomic disorder (56% maternal)71. The 16p11.2, 22q11.2, and 17q11.2 CNVs all
lie close to the centromere of their respective chromosomes, consistent with higher female
recombination rates in pericentromeric regions61. Thus, it is likely that gender-specific
recombination hotspots may be a much more general predictor of female and male biases for
NAHR.
We observe not only a maternal parent-of-origin bias for de novo 16p11.2 deletions, but also
that mothers transmit a significantly greater number of secondary deletions to probands than do
fathers. Such a transmission disequilibrium has been observed for small CNVs and single-
nucleotide variants (SNVs) in individuals with ASD76,77, and this effect may result from a higher
female tolerance towards additional variants. We extend this putative female protective effect to
secondary CNVs with 16p11.2 families. It is striking that of the nine probands with a secondary
CNV disrupting a gene from a curated list associated with autism risk (Web Resources) six are
female, including two with multiple events, suggesting that females may be more tolerant of
severe variants77. We do not observe this bias for secondary duplications likely because
duplications are generally less deleterious than deletions.
Our results suggest that genetic background plays a role in the observed phenotypic
heterogeneity and that dosage imbalances at other loci contribute, especially in the case of
16p11.2 duplication carriers. It is interesting that the FSIQ decrement for probands with an
inherited 16p11.2 duplication compared to their parents who also carry the 16p11.2 CNV is
greater than the difference observed for transmission of the deletion (Figure 2.3). Such a
difference, along with the statistically significant differences between the mean FSIQ of parents
carrying the 16p11.2 CNV and probands, suggests that additional factors are contributing to the
45
severity of the phenotype. Our finding of a modest negative correlation between FSIQ and
secondary CNVs as well as the increased phenotypic severity of such individuals argues in favor
of additional rare gene disruptive variants. These findings are consistent with studies focused on
different genomic disorders which have shown that individuals with more than one large CNV
tend to have lower IQ when compared to individuals with only a single CNV24. Similarly, a
recent study of an Estonian population cohort reported that a greater proportion of individuals
carrying large CNVs (>250 kbp) failed to graduate high school when compared to individuals
without such events. When CNVs exceeded 1 Mbp in size, there was a significant risk for
intellectual disability.78
There are some clear limitations of this study. The number of complete families with a de
novo variant and parental phenotypic information is insufficient, especially for duplications.
Investigation of a larger sample of 16p11.2 CNVs in conjunction with more detailed phenotypic
data is necessary in order to confirm the observed trends. The Simons VIP is not a population
cohort, but rather was clinically ascertained and subject to inclusion and exclusion criteria.
Importantly, the Simons VIP was screened for large, likely pathogenic CNVs, thus depleting the
number of individuals with large secondary CNVs. A population-based cohort of sufficient size
would prove most valuable if large-scale genetic screening were followed by detailed phenotypic
assessment of individuals with particular genotypes32. Because we focused on CNVs (typically
>50 kbp), we did not assess other potentially deleterious variants (e.g., SNVs or small CNVs).
The importance of secondary hits at other loci affecting phenotype severity has been
established in several disorders, and a model has been developed to explain the phenotype
variability associated with pathogenic CNVs17,23,24. Importantly, 11 of the secondary CNVs have
already been implicated as risk factors for autism and developmental delay (e.g., 240 kbp
46
deletion of the TOP3B locus on chromosome 22q11.22)63. Our results extend observations of
secondary variantal hits to the 16p11.2 CNV and suggest that full-genome sequencing of
individuals carrying the 16p11.2 CNV will ultimately be required to more precisely predict the
severity of disease within the context of families. This is an important consideration because
once the 16p11.2 CNV is discovered such individuals are routinely excluded from further exome
and genome sequencing analyses2,21,79. The presence of additional risk factors discovered by
either sequencing or diagnostic microarray will be important for projecting the disease trajectory
and the diverse outcomes associated with this pathogenic CNV.
2.6 Notes
Description of Supplemental Data
Supplemental Data include Eight Figures, and Fifteen Tables.
Acknowledgements
We thank F. Hormozdiari, K. Steinman, and T. Brown for useful discussion and edits to the
manuscript. We thank all of the families at the participating Simons Variation in Individuals
Project (VIP) sites, as well as the Simons VIP Consortium. We appreciate obtaining access to
phenotypic data on SFARI Base. Approved researchers can obtain the Simons VIP population
dataset described in this study by contacting the Simons Foundation Autism Research
Initiative. A full list of the investigators who contributed to the generation of the WTCCC data
is available from http://www.wtccc.org.uk/. M.H.D. is supported by U.S. National Institute of
Mental Health grant no. 1F30MH105055-01 and by the Simons Foundation and X.N. was
supported by a U.S. National Science Foundation Graduate Research Fellowship (Grant No.
DGE-1256082). This work was supported by the Simons Foundation Autism Research
Initiative Grant No. 294112 (E.E.E.), National Institutes of Health Grant No. R01MH101221
(E.E.E.), and National Institutes of Health Fellowship Grant No. 1F30MH105055-01
(M.H.D.). E.E.E. is an investigator of the Howard Hughes Medical Institute.
Competing Financial Interests
E.E.E. is on the scientific advisory board (SAB) of DNAnexus, Inc., is a consultant for the
Kunming University of Science and Technology (KUST) as part of the 1000 China Talent
Program.
Web Resources
cnvPartition Algorithm: http://www.illumina.com/content/dam/illumina-
marketing/documents/products/technotes/technote_cnv_plug_ins.pdf
Illumina Genome Studio Software: http://www.illumina.com/techniques/microarrays/array-
data-analysis-experimental-design/genomestudio.html

47
OMIM [Online Mendelian Inheritance in Man]: http://www.omim.org
SFARI List: https://gene.sfari.org/autdb/
Simons VIP: https://simonsvipconnect.org/
Wellcome Trust Case Control Consortium 2: http://www.wtccc.org.uk/ccc2/
Accession Numbers
Underlying SNP microarray data are available from NDAR under accession number [accession
in progress].
Underlying calls for the recalled WTCCC set (“Set II”) is available in dbVar under accession
number [accession in progress].
CNV calls for the 19,584 (“Set I”) controls are available in dbVar under accession nstd100.

48
3. Exonic variation and population genetic analysis of the Autism-
Associated 16p11.2 CNV
This chapter has not been published. Evan Eichler and I designed the study. I designed the MIP
assays and performed MIP capture. Kendra Hoekzma and Holly Stessman performed sequencing
experiments. Xander Nuttle designed the 206 copy number MIPs. I performed all analyses and
wrote this section.
3.1 Summary
Recurrent deletion and duplication at chromosome 16p11.2 is one of the largest genetic
contributors to autism and autism-like phenotypes. Despite carrying the seemingly identical
CNV, affected individuals present with a wide range of phenotypes ranging from severely
affected to relatively unaffected. In order to explore the genetic underpinnings of this
heterogeneity we resequenced the coding regions of the 27 unique and 3 duplicated genes in the
16p11.2 critical region in a cohort of over 100 individuals with a 16p11.2 CNV and their
families. Strikingly, we find a relative lack of diversity across the critical region, with no
proband carrying an LGD event in any of the 30 critical regions genes. We find that the critical
region lies below the 3rd percentile for both Tajima’s D and average heterozygosity metrics
genome-wide, suggesting that the critical region is under selection. In order to understand natural
variation in the 3 duplicated genes that are missed by exome sequencing, we resequenced the
exons of these genes in >10,000 individuals and find fewer than 50 likely gene disruptive events.
Our resequencing data also identified an individual with a 16p11.2 triplication and
quadruplication, demonstrating that higher copy number states of the critical region are viable.
Reanalysis of exome sequencing data from the 16p11.2 cohort reveals 13 probands with LGD or
severe missense variants in autism-associated genes. Our results elucidate properties of the
critical region and modifiers of the phenotype associated with the 16p11.2 CNV.

49
3.2 Introduction
In addition to secondary CNVs, deleterious variants in the 27 genes within the 16p11.2
critical region could affect the phenotype as shown for the TBX6 gene and scoliosis37. For
example, a 16p11.2 deletion individual with an LGD variant on the remaining haplotype might
be expected to have a more severe phenotype due to the “unmasking” of a recessive allele. We
hypothesize that dosage imbalance of rare variation in the critical region genes could contribute
to the observed phenotype heterogeneity. In order to test this hypothesis, we resequenced the
exons of the 27 unique genes within the 16p11.2 critical region.
Along with the 27 unique genes in the 16p11.2 critical region, 3 genes are present in the
segmental duplications flanking the critical region: BOLA2, SLX1A, and SULT1A315. Analysis of
whole-genome sequencing data from humans, ancient hominins, and great apes has revealed that
BOLA2 is duplicated only in Homo sapiens38 and no ortholog of the duplicated gene SULT1A3
(also called SULT1A4) has been identified in non-primate species80. Evidence suggests that
human specific duplicated genes are important for neural development as in the case of the
SRGAP2 gene family81. We hypothesize that rare nucleotide variation or copy number variation
in these genes could contribute to the observed phenotype. In order to test this hypothesis, we
resequenced the exons of the 3 duplicated genes in the Simons VIP cohort. Since these genes are
not well covered in exome sequencing data, we additionally resequenced the exons of these
genes in thousands of cases with autism and controls. Finally, to assess copy number variation in
these duplicated genes, we designed probes to distinct markers that allow determination of genic
copy number.

50
3.3 Methods
3.3.1 SNV detection and validation in 16p11.2 critical region genes
We designed and optimized 526 MIPs corresponding to the exons of 27 unique genes
covering a total of 58,912 base pairs (34,879 coding exons) in addition to 37 MIPs corresponding
to three duplicated genes covering a total of 4,144 base pairs (2,175 coding exons) (Tables S1,
S2). After rebalancing, 480 unique and 33 duplicated gene MIPs remained. We successfully
captured >90% of exonic base pairs with a median average coverage of 337 per base per unique
gene and 1,865 per base1 per duplicated gene among 120 probands (85 deletions, 35
duplications), 57 carrier family members (13 deletions, 44 duplications) and 264 family members
with no event (Table S3). Included in this set were 71 families where complete trios or quads
were present. While most genes capture well, we note that some genes such as MAZ had low
median coverage (Table S4). All libraries were initially tested on the Illumina MiSeq for
performance and sequenced on an Illumina HiSeq 2000 and/or Illumina MiSeq.
For the 16p11.2 exon targeting MIPs, overlapping sequence reads were merged using PEAR
v0.9.282, mapped using BWA-MEM version 0.0.783 to the hg19 chromosome 16 reference
genome with the telomeric most segmental duplications hard-masked, and SNV/indel variants
called using FreeBayes v0.9.14 across the critical region chr16:29649996-30199854 (hg19).
Variants were called adjusting for the copy number of the 16p11.2 region in individual carriers
and allowing a minimum of 5% alternate allele reads. We considered all variants QUAL >20 and
read depth >10, removed dbSNP sites excluding sites after build 129, removed Mills and 1000
Genomes gold standard indels, and removed SNPs present with frequency >1% in dbSNP144.
Variants were annotated using the program Alamut Batch version 1.4.484, which provides
1 Interestingly, the median copy number of these genes is 6 and 1865/6=310.8, almost exactly the median coverage
for the unique genes.

51
functional predictions for RefSeq isoforms of each gene. We additionally annotated the called set
for the non-psychiatric cases in Exac
(ftp://ftp.broadinstitute.org/pub/ExAC_release/release0.3/subsets/ExAC.r0.3.nonpsych.sites.vcf.
gz), and for the version 1.3 CADD scores85. For our analyses, we selected the transcript with the
most severe variant at each position in each gene. We selected 35 sites in the unique genes for
validation (Table S5).
3.3.2 Case and control resequencing
In order to assess the variation of the three duplicated genes, we designed a total of 7 BOLA2,
15 SLX1A, and 15 SULT1A MIPs targeting the exons of these genes and spiked into a pool of
2,642 MIPs (Table S6). After rebalancing, 3 SULT1A MIPs were removed. Samples were
prepared and sequenced as previously described2,86. Briefly, sequence reads were indexed by
barcode, the reads merged using PEAR v0.9.2, trimmed, and mapped using bwa version 0.7.3a to
a hg19 chromosome 16 contig with the centromeric copies of BOLA2, SLX1A, and SULT1A hard
masked in order to provide a single mapping location for each correctly targeted MIP.
Sequencing data were generated on the Illumina MiSeq (151 PE) and HiSeq2000 (101PE)
instruments.
We sequenced and analyzed a total of 11,100 cases with autism or intellectual disability and
2,782 controls (Table S7). We performed quality control on a per MIP and per sample basis.
First, we removed MIPs with median coverage per sample <30x across all samples with the
result that three MIPs were removed from subsequent analysis. Second, we removed samples
with >8 MIPs (out of 22 analyzed for BOLA2 and SLX1A) with per sample coverage less than 30
(Table S8). After quality control, a total of 8,440 cases and 2,139 controls remained.

52
We additionally resequenced the third duplicated gene SULT1A3 in our analysis. Due to the
high identity of SULT1A3 with the family of SULT genes throughout the genome, we performed
a similar but separate quality control analysis. In particular, we first removed MIPs with median
coverage per sample <30x across all samples. No additional MIPs were removed. Second, we
removed samples with >5 MIPs (out of 12 analyzed for SULT1A3) with per sample coverage less
than 30. After quality control, a total of 8,124 cases and 2,113 controls remained.
Variants were called using freebayes v0.9.21 over the region chr16:29,460,712-29,483,159 of
GRCh37 (hg19), which contains the genes BOLA2, SLX1A, and SULT1A. The copy number of
BOLA2, SLX1A and SULT1A3 ranges from 3-8 in humans, with a median of copy number of 638.
In order to call variants in individuals with up to 8 copies of BOLA2 or SLX1A, we first set the
minimum alternate fraction of observations supporting an alternate allele in a single individual (–
min-alternate-fraction flag) to 0.07. This means that at least 7 in 100 observations must be of the
alternate allele. Second, we kept the default minimum alternate count (–min-alternate-count flag)
at 2, which means that at least 2 reads must support an alternate allele in each individual. Across
all individuals, our average coverage per MIP for BOLA2 and SLX1A was 179.5 (range 49 to
828, excluding MIPs removed during quality control). We calculated the probability of detecting
an alternate variant in the extreme case assuming a high copy number state of 8 of BOLA2 and
SLX1A and a total coverage of 32x across these genes. If an alternate variant is present in only
one of the copies, 1 in 8 reads (12.5%), 4 reads in total should have the alternate allele in a
sample with 32x coverage. Our parameters for calling allow detection of such a variant. We used
the same parameters to call SULT1A. Our average coverage per MIP for SULT1A was 187 (range
31 to 668, excluding MIPs removed during quality control).

53
We applied several filters to achieve a final call set using the vcflib suite of programs87. We
required a variant quality of at least 20 and per-sample read depth of at least 30 (vcffilter –g
“DP>20” –f “QUAL>20” vcf.file), removed homopolymer repeats (grep -v
'AAAAAAAA\|TTTTTTTT\|ATATATATATATATATATAT'), and broke multi-allelic records
into single records (vcfbreakmulti). We annotated called variants using AlamutBatch v.1.4.3
(database version 1.4-2015.11.02) for two transcripts of BOLA2 (NM_001031827.1 and the
10kDa transcript discussed in Nuttle and Giannuzi et al.) and two transcripts of SLX1A
(NM_001014999.2 and NM_001015000.2). We used AlamutVisual v2.7.1, which uses the same
databases as AlamutBatch to annotate the single transcript of SULT1A3 (NM_177552.3). We
considered a variant a splice site variant if it was in intronic sequence and located within 1
basepair of the nearest annotated splice site. For each site we computed the Combined
Annotation Dependent Depletion (CADD) v1.3 scores85.
3.3.3 Copy number genotyping
We designed 206 MIPs to identifiers in the segmental duplications flanking the critical
region as well as in the critical region that allow assessment of copy number of the BOLA2,
SLX1A, and SULT1A3 and the critical region proper (Table S9). MIPs were designed and
analyzed according to a previously described method88.
3.3.4 Exome sequencing and analysis
In order to assess genome-wide exonic variation and its potential contribution to phenotypic
heterogeneity, we analyzed exome sequencing data from the Simons Variation in Individuals
Project (Simons VIP, https://sfari.org/resources/autism-cohorts/simons-vip). We analyzed a total

54
of 431 exomes from the VIP including 85 deletion probands and 34 duplication probands
(Tables 1 and S3). We applied several filters to the variants present in the exome VCF available
through SFARI base using the VCFlib87 and VCFtools89 software suites. For filtering we selected
only variants with a PASS flag, depth>10, QUAL>20, removed dbSNP sites excluding sites after
build 129, removed Mills and 1000 genomes gold standard indels, removed segmental
duplications and tandem repeats, removed variants found at >1% frequency in dbSnp144, and
removed sex chromosomes. We annotated using SeattleSeq build 138, selected the transcript
with the most severe annotation for the variant, and retained only non-synonymous and splice
variants. We additionally annotated each variant with the CADD v1.3 score85, the allele
frequency from the Exac database containing non-psychiatric cases
(ftp://ftp.broadinstitute.org/pub/ExAC_release/release0.3/subsets/ExAC.r0.3.nonpsych.sites.vcf.
gz), and the Residual Variation Intolerance Score90 (version 3_12_Mar16, columns all 0.1% and
%All 0.1%.)
Table 1: VIP exomes analyzed.
De novo
Deletion
Inherited
Deletion
Unknown
Deletion
De Novo
Duplication
Inherited
Duplication
Unknown
Duplication Triplication
Quads 23 1 0 1 8 0 1
Trios 21 2 0 4 6 0 0
Mother Only 9 2 6 1 3 0 0
Father Only 2 1 0 2 2 0 0
Proband Only 4 2 12 0 2 5 0
Total 59 8 18 8 21 5 1
In order to compare the critical region variants called by exome with those called by MIPs,
we extracted variants corresponding to the critical region genes. Variants were annotated using
the program Alamut Batch version 1.4.484, which provides functional predictions for RefSeq
isoforms of each gene, and uses the same databases used for annotating the MIP resequencing
data of the critical region genes. We additionally annotated the called set for the allele frequency
55
of non-psychiatric cases in Exac, and for the version 1.3 CADD scores85. For our analyses, we
selected the transcript with the most severe variant at each position in each gene (Table S10).
3.3.5 Diversity and selection across the critical region
In order to see if the critical region had any special population genetic characteristics, we
utilized the haplotype phased 1000 genomes phase 3 release
(ftp://ftp.1000genomes.ebi.ac.uk/vol1/ftp/release/20130502/) in order to determine if there is
selection over the critical region using average heterozygosity as well as Tajima’s D metrics. In
order to calculate the observed and expected heterozygosity we used the VCFlib suite of tools; in
order to calculate Tajima’s D, we used the VCFtools software suite. Given that there are
different methods to calculate Tajima’s D, and the estimates will depend on sample filtering, it is
crucial to compare the region of interest with a genome-wide distribution of similarly sized
regions. To do so, we calculated the genome-wide distribution of average heterozygosity for
550kbp regions from 2,500 individuals from the 1000 Genomes Phase 3 release sampled 100,000
times across autosomal regions not containing gaps or segmental duplications and performed the
same analysis across chromosome 16 sampling 30,000 times. In order to get better resolution
across the critical region, we reduced our window size to 10kbp with a 5kbp step across the
critical region and calculated thresholds for significance based on the chromosome 16 and the
genome-wide distribution of 10kbp windows of average heterozygosity. We performed the same
analyses for Tajima’s D, though calculated the statistic for non-overlapping 550kbp regions
genome-wide. Again, to assess selection in the critical region, we calculated Tajima’s D for
10kbp non-overlapping windows across the critical region and calculated thresholds for

56
significance based on the chromosome 16 and genome wide distributions of 10kbp windows of
Tajima’s D.
3.4 Results
3.4.1 Unique critical region genes
We designed and optimized 527 MIPs spanning 90.8% of the exons of the critical region
genes (Table S2). We sequenced these exons to a median sequence coverage of 337-fold per
sample per gene (Figure S1). We examined 85 deletion probands, 35 duplication probands, and
253 non-carrier family members (Table S3). In this analysis, we specifically searched for severe
variants, defined here as non-synonymous events with a CADD85 v.1.3 score >20.
Among the 16p11.2 deletion and duplication probands, we observe a trend towards a lower
SNV burden between probands and non-carrier parents after we corrected for allelic abundance
(Table S11). In particular, when we require the observed variants to be present at <0.1% Exac
frequency and with a CADD>20, we notice statistically significant differences in burden for both
deletions and duplications. However, this observation does not hold at other frequencies or
CADD score cutoffs. Based on our haplotype assessment of the individuals carrying a 16p11.2
duplication and a rare protein-altering variant (private in cohort families, <1% frequency Exac),
we observe a bias for the protein-altering variants to occur in a single copy (allele balance ~0.33,
(36/36 alleles among 12 individuals map to a single copy, p=2.91x10⁻¹¹ two-sided binomial,
Table S12).
Of the 70 families for which we have inheritance information, we identified one de novo
protein-altering event in de novo deletion proband 14701.x7, a missense variant in the gene
QPRT, quinolinate phosphoribosyltransferase (Table 2). Two private loss-of-function variants
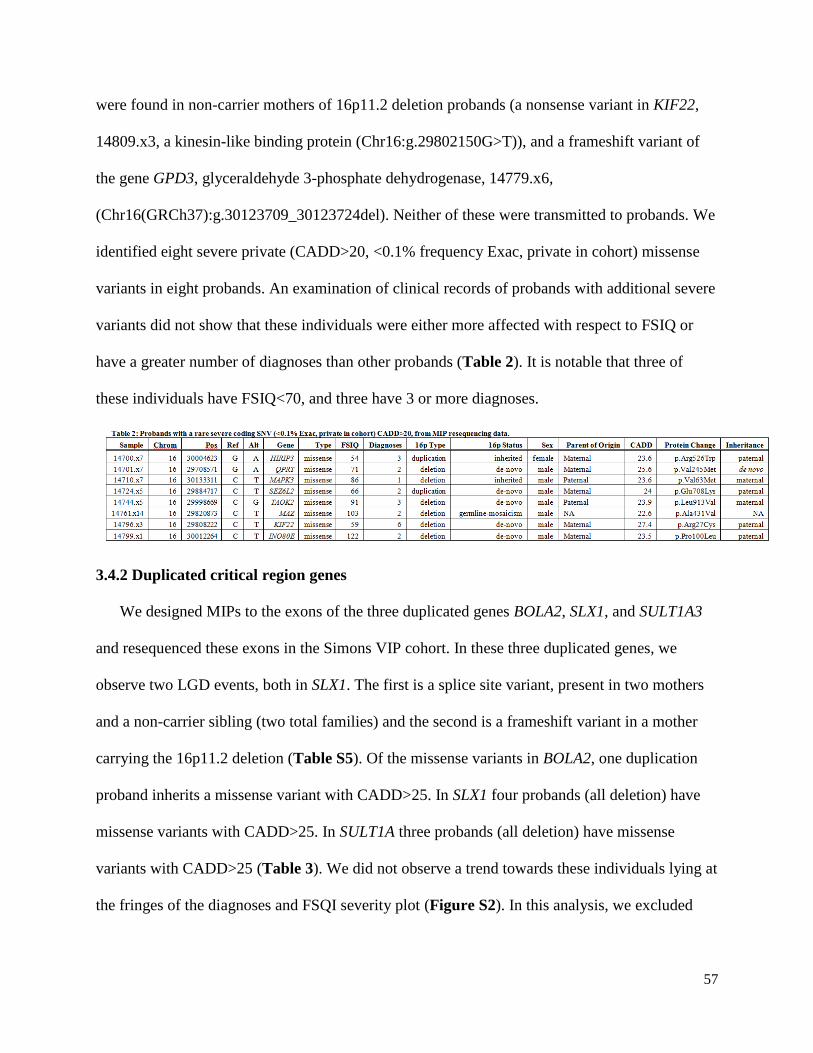
57
were found in non-carrier mothers of 16p11.2 deletion probands (a nonsense variant in KIF22,
14809.x3, a kinesin-like binding protein (Chr16:g.29802150G>T)), and a frameshift variant of
the gene GPD3, glyceraldehyde 3-phosphate dehydrogenase, 14779.x6,
(Chr16(GRCh37):g.30123709_30123724del). Neither of these were transmitted to probands. We
identified eight severe private (CADD>20, <0.1% frequency Exac, private in cohort) missense
variants in eight probands. An examination of clinical records of probands with additional severe
variants did not show that these individuals were either more affected with respect to FSIQ or
have a greater number of diagnoses than other probands (Table 2). It is notable that three of
these individuals have FSIQ<70, and three have 3 or more diagnoses.
3.4.2 Duplicated critical region genes
We designed MIPs to the exons of the three duplicated genes BOLA2, SLX1, and SULT1A3
and resequenced these exons in the Simons VIP cohort. In these three duplicated genes, we
observe two LGD events, both in SLX1. The first is a splice site variant, present in two mothers
and a non-carrier sibling (two total families) and the second is a frameshift variant in a mother
carrying the 16p11.2 deletion (Table S5). Of the missense variants in BOLA2, one duplication
proband inherits a missense variant with CADD>25. In SLX1 four probands (all deletion) have
missense variants with CADD>25. In SULT1A three probands (all deletion) have missense
variants with CADD>25 (Table 3). We did not observe a trend towards these individuals lying at
the fringes of the diagnoses and FSQI severity plot (Figure S2). In this analysis, we excluded

58
variants present in more than 50% of families because such variants likely represent sequencing
errors or paralog specific variants (PSVs).
We determined if high or low copy number of BOLA2 correlated to a particular phenotype.
Restricting to deletion individuals, and separating into copy number 3 and 3> groups, we found
that the individuals with BOLA2 copy number 3 are enriched for anemia (p=0.00124, Fisher’s
Exact).
Figure 3.1: Severity plot for 16p11.2 CNV probands. Jittered plot of full scale IQ (FSIQ) and number
of additional diagnoses for deletion and duplication probands. Red triangles indicate probands with
BOLA2 copy number of 3 and blue a copy number of 8 or 9. Extremes of copy number do not appear to
associate with a more or less severe phenotype based on these metrics.
We utilized MIP copy number estimates in conjunction with the exon resequencing data of
the duplicated genes for two purposes. First, we explored the relationship of copy number of the
three duplicated genes with severity of disorder, as defined by number of diagnoses and FSIQ
(Figure 3.1). We observe no correlation between copy number of these genes and severity.
Second, in those probands with a severe variant in the duplicated genes, we used the allele

59
balance of the variant multiplied by the copy number predicted by MIP to determine in how
many copies the variant is found (Table 3). In all cases, the number rounds to 1, suggesting that
the variant is present on a single copy in these individuals.
Since variation over these genes is not well-understood, we mapped each discovered variant
(excluding variants present in >50% of families) to the protein models of these genes (Figure
3.2).
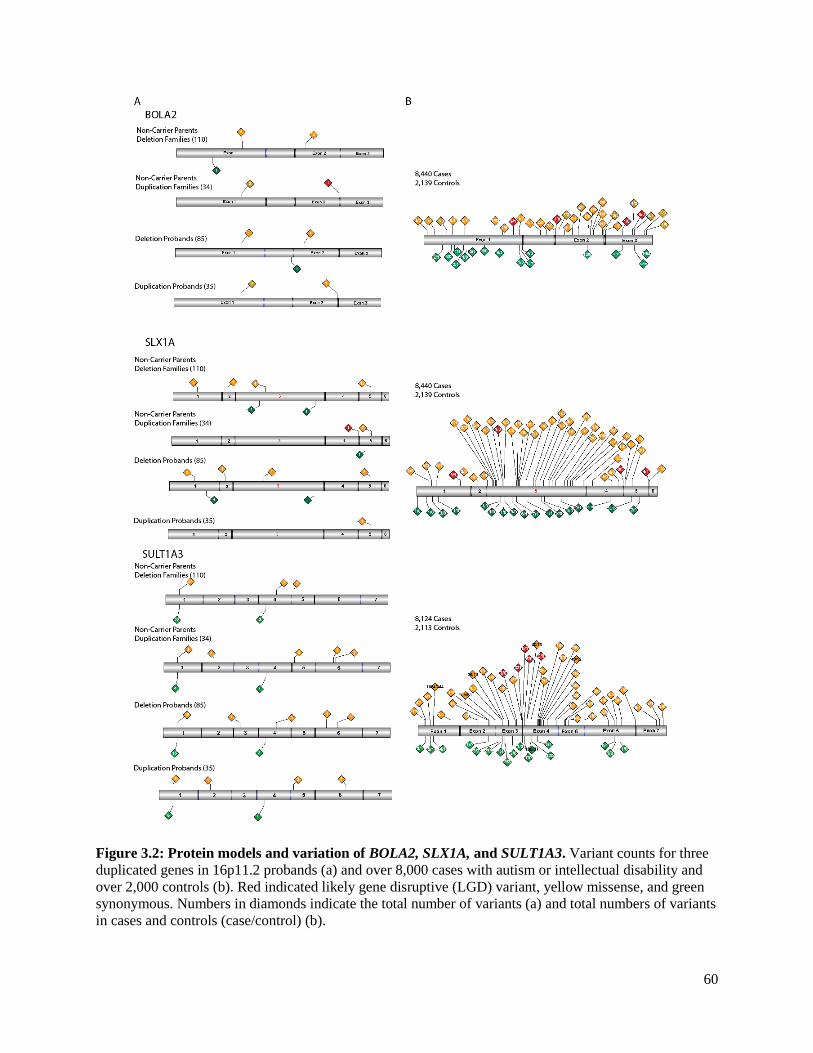
60
Figure 3.2: Protein models and variation of BOLA2, SLX1A, and SULT1A3. Variant counts for three
duplicated genes in 16p11.2 probands (a) and over 8,000 cases with autism or intellectual disability and
over 2,000 controls (b). Red indicated likely gene disruptive (LGD) variant, yellow missense, and green
synonymous. Numbers in diamonds indicate the total number of variants (a) and total numbers of variants
in cases and controls (case/control) (b).

61
3.4.3 Resequencing critical region genes in cases and controls
Since BOLA2, SLX1, and SULT1A are not well-covered in exome sequencing studies,
variation in case and control populations is not well-understood. In the Exac database
(exac.broadinstitute.org), which contains the exomes of over 60,000 individuals, BOLA2 has 0
mean coverage, SLX1 mean coverage 7.737, and SULT1A mean coverage 4.068. Given that the
median copy number of these genes in humans is 638, SLX1A, the duplicated gene with the best
coverage, has mean effective coverage per copy of 7.737/6=1.29, insufficient to call variation. In
order to better understand variation in these duplicated genes at a population level, we
resequenced the exons of these genes in 11,100 cases with autism or intellectual disability and
2,782 controls. After quality control assuring sufficient coverage to allow comparison between
cases and controls, we had remaining a total of 8,440 cases and 2,139 controls to assess BOLA2
and SLX1 and a total of 8,124 cases and 2,113 controls to assess SULT1A.
We assessed both common and rare exonic variants in two transcripts of BOLA2
(NM_001031827.1 and the shorter and more common 10kDa transcript discussed in Nuttle and
Giannuzi et al.), two transcripts of SLX1A (NM_001014999.2 and NM_001015000.2) and the
single transcript of SULT1A3 (NM_177552). In total, we discovered 8 LGD variants for the more
common 10kDa transcript of BOLA2 of which 2 were private. The LGD events were discovered
only in cases (p=0.3719, Fisher’s Exact). In the canonical transcript of SLX1A
(NM_001014999.1), we discovered 23 LGD variants (16 cases, 7 controls, p=0.29 Fisher’s
Exact) of which 1 was private and found only in a case. In SULT1A3, we observed 14 LGD
variants (12 cases, 2 controls, p=0.75 Fisher’s Exact) of which 2 are private and found only in
controls. We did not observe any statistically significant differences between cases and controls,
even when restricting to private or likely damaging events based on CADD score (Table S13).

62
Since each gene exists in a multiple copy state ranging from 3-8 copies, with median copy
number 6, we assessed the allele balance of each variant in BOLA2 and SLX1A to determine in
how many copies discovered variants were found (Table S14). We excluded SULT1A3 from this
analysis due to its high identity with the SULT family of genes elsewhere in the genome. For
each low frequency variant (<100 samples with the variant in the sequenced population), we
plotted the allele balance density between cases and controls (Figure 3.3). The median copy
number of BOLA2 and SLX1A in each individual is 6, and assuming this copy number across all
individuals, we would expect an allele balance of 1/6=0.2 if all individuals had the variant
present in a single copy. The mean allele balance is just below 0.2 in both BOLA2 and SLX1A
suggesting that the vast majority of variants are present in a single copy. Furthermore, none of
the likely gene disruptive variants in cases had an allele balance >0.3.
Figure 3.3: Allele balance across discovered variants in BOLA2 and SLX1A. The distribution of allele
balance for these duplicated genes shows a mean allele balance just below 0.2. The average copy number
of these genes is 6, and if a variant is present in one copy, we expect and allele balance of 1/6=1.67,
which is what we observe for the majority of variants.

63
Since there is a high identity between the SULT family of genes we performed a multiple
sequence alignment on the coding sequence (CDS) of all 14 members of the SULT family using
the program clustal v2.1 and visualized the results in Jalview v2.9.0b2. We used a custom script
to determine the percent identity of SULT1A3 coding sequence when compared with the coding
sequences of all 13 other members of the family (Table S15). SULT1A3 shares greater than 95%
identity with both SULT1A1 and SULT1A2 whereas it shares a range of 43% to 68% identity
with other members of the SULT family of genes. We also used a custom script to determine
differences in the coding sequences of the SULT genes that allow us to differentiate SULT1A3
from all other (a) members of the SULT family of genes (Table S16), (b) members of the SULT
family of genes excluding SULT1A1 and SULT1A2 (Table S16) and (c) from SULT1A1 and
SULT1A2 (Table S17). This information allows determination of variants unique to the SULT1A
subfamily.
3.4.4 Copy number genotyping
We used MIPs targeting markers in the segmental duplications flanking the 16p11.2 critical
region to assess the copy number of the block of genes BOLA2, SLX1A, and SULT1A3 as well as
MIPs targeting markers in the critical region to allow inference of the critical region copy
number. We observed no correlation between those individuals with the lowest copy number (3)
or highest copy number (8 or 9) and severity of phenotype as defined by FSIQ and number of
diagnoses (Figure 3.1).
We confirmed the assessed copy number of the critical region in screened individuals and
found that it was consistent in terms of copy number state (deletion or duplication) with a recent
SNP microarray analysis of this same cohort91. However, upon analysis of the MIP copy number
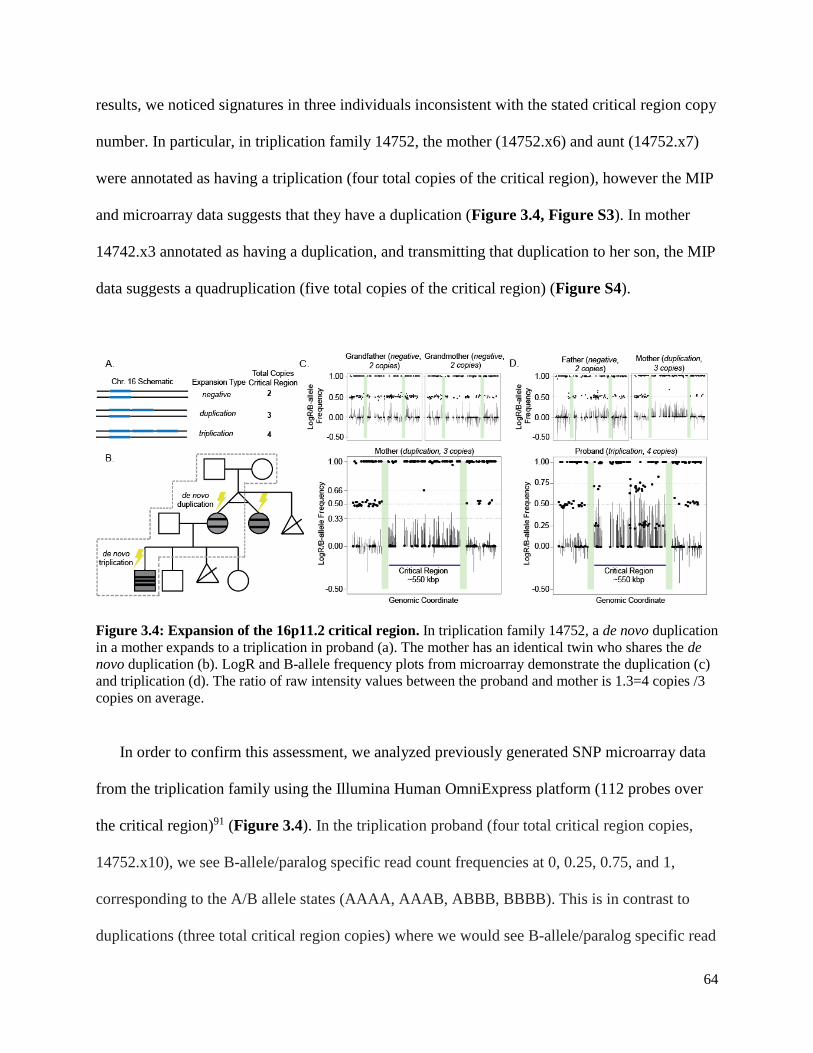
64
results, we noticed signatures in three individuals inconsistent with the stated critical region copy
number. In particular, in triplication family 14752, the mother (14752.x6) and aunt (14752.x7)
were annotated as having a triplication (four total copies of the critical region), however the MIP
and microarray data suggests that they have a duplication (Figure 3.4, Figure S3). In mother
14742.x3 annotated as having a duplication, and transmitting that duplication to her son, the MIP
data suggests a quadruplication (five total copies of the critical region) (Figure S4).
Figure 3.4: Expansion of the 16p11.2 critical region. In triplication family 14752, a de novo duplication
in a mother expands to a triplication in proband (a). The mother has an identical twin who shares the de
novo duplication (b). LogR and B-allele frequency plots from microarray demonstrate the duplication (c)
and triplication (d). The ratio of raw intensity values between the proband and mother is 1.3=4 copies /3
copies on average.
In order to confirm this assessment, we analyzed previously generated SNP microarray data
from the triplication family using the Illumina Human OmniExpress platform (112 probes over
the critical region)91 (Figure 3.4). In the triplication proband (four total critical region copies,
14752.x10), we see B-allele/paralog specific read count frequencies at 0, 0.25, 0.75, and 1,
corresponding to the A/B allele states (AAAA, AAAB, ABBB, BBBB). This is in contrast to
duplications (three total critical region copies) where we would see B-allele/paralog specific read

65
count frequencies at 0, 0.33, 0.66, and 1, corresponding to states (AAA, AAB, ABB, BBB). For
the individuals not carrying an event (two total critical region copies), we would see ratios of 0,
0.5, and 1, corresponding to states (AA, AB, and BB).
The mother of the triplication proband (14752.x6) and her identical twin (14752.x7) are
homozygous across the critical region, with the exception of one probe found at a B-allele
frequency of 0.66 (as expected for the ABB, a state found in an individual with a duplication).
The mother and aunt have B-allele states of AAA and BBB across the critical region assuming
duplication or AAAA and BBBB assuming triplication. This homozygosity is the reason we
don't see the AABB state in the triplication proband (band at ratio 0.5).
Because the B-allele frequency/ratio data alone in the critical region in family 14752 cannot
definitively distinguish the copy number state of the mother and aunt, we used the MIP and
microarray data in two additional ways. First, we looked at the paralog specific read count
frequencies at targeted loci within the segmentally duplicated sequence where telomeric and
centromeric copies are distinguishable by SNV markers. Normally an individual has 4 total
copies of this region, 2 that are centromeric and 2 that are telomeric38. Individuals with a 16p11.2
duplication have 5 total copies (3 telomeric + 2 centromeric based on analysis of where
breakpoint nearly always maps), while individuals with a triplication have 6 total copies (4
telomeric + 2 centromeric). Individuals with a duplication have 3 telomeric out of 5 total copies
of the region, and 2 centromeric out of 5 total copies of the region, giving paralog specific count
frequencies at 3/5=0.6 and 2/5=0.4. Similarly, for the triplication, we expect paralog specific
count frequencies at 4/6 = 0.66 and 2/6=0.33. Here the mother of family 14752 (14752.x6) and
her identical twin (14752x7) show the duplication signature where the proband (14752.x10)
shows the triplication signature. Second, we looked at the signal intensity data over the critical

66
region from the microarray. The ratio of the raw intensity data (2^logR) between the proband
and the mother is 1.3=4/3 on average, as expected if the proband has a triplication (four total
copies) and the mother a duplication (three total copies).
Since we have SNP microarray data from the grandmother (14752.x1) and grandfather
(14752.x4), we can assign the parent of origin of the de novo 16p11.2 duplication present in the
mother and aunt. In particular, since the grandmother and grandfather are not homozygous over
the critical region, we can use the haplotype of the mother and aunt across the critical region to
phase the parents. Since all three copies over the critical region in mother and aunt are
homozygous but the parents are not homozygous over this region, the mechanism of unequal
crossing over must be intrachromosomal. Not assuming any phase information, we compute the
number of markers that partially or perfectly support a maternal or paternal parent of origin and
inter or intrachromosomal mechanism of crossing over (Table S18). Out of the 112 markers, we
observe 27 supporting a maternal parent of origin, 5 supporting a paternal of origin; and 58
markers supporting an intrachromosomal mechanism and 0 supporting an interchromosomal
mechanism. This evidence strongly suggests that the de novo duplication occurred on a
grandmaternal haplotype by means of an intrachromosomal mechanism of unequal crossover.
Based on the haplotype of the proband (three identical copies and one distinct copy of the
critical region), we can phase the father and using the father the two non-carrier siblings of the
proband (14752.x11 and 14752.x12). Since there is no exchange of markers flanking the 16p11.2
critical region, we infer that the expansion from duplication to triplication also occurred by an
intrachromosomal mechanism (Table S19).
Using a similar approach, we observe a contraction from five to three total copies, from a
mother (14742.x3) to a proband (14742.x6). In particular, allele read count frequencies as well as

67
B-allele frequencies in the mother (14742.x3) cluster around 0, 1/5, 2/5, 3/5, 4/5, and 1
(corresponding to AAAAA, AAAAB, AAABB, AABBB, ABBBB, BBBBB) and suggest five
total copies of the critical region whereas the proband has allele read count frequencies as well as
B-allele frequencies (14742.x6) that cluster around 0, 1/3, 2/3, 1 (corresponding to AAA, AAB,
ABB, and BBB) suggesting three total copies (Figure S4).
3.4.5 Exome analysis
In order to understand the effect of exonic single nucleotide and indel variation outside of the
critical region, as well as to compare our MIP resequencing results with another dataset, we
analyzed exome sequencing data available for the Simons VIP (Table S3).
For the 66 trio and quad families, we have inheritance information from both mother and
father, and can determine whether or not a variant is de novo. In order to call a variant as de
novo, we required no alternate allele reads in mother and father, the variant had to be private in
the cohort, not found in the Exac database, not have a dbSNP variant at the same site, and have at
least 5 alternate allele supporting reads (Table S20). In total, we found 12 unique de novo non-
synonymous variants (6 in probands). None are associated with autism or intellectual disability.
We find a de novo frameshift variant in a female non-carrier sibling in FBXO15, an F-box
protein associated with autism92.
In deletion and duplication probands, we assessed the total numbers of deleterious variants
compared to non-carrier parents and non-carrier siblings. In particular, we selected variants with
RVIS<50, CADD>25, Exac <0.01% frequency, and private in the cohort. These filters resulted
in 203 unique variants across 101 families, including 179 variants found in 92 probands. Of these
families, family 14702 had significantly more variants than the other families, suggesting a
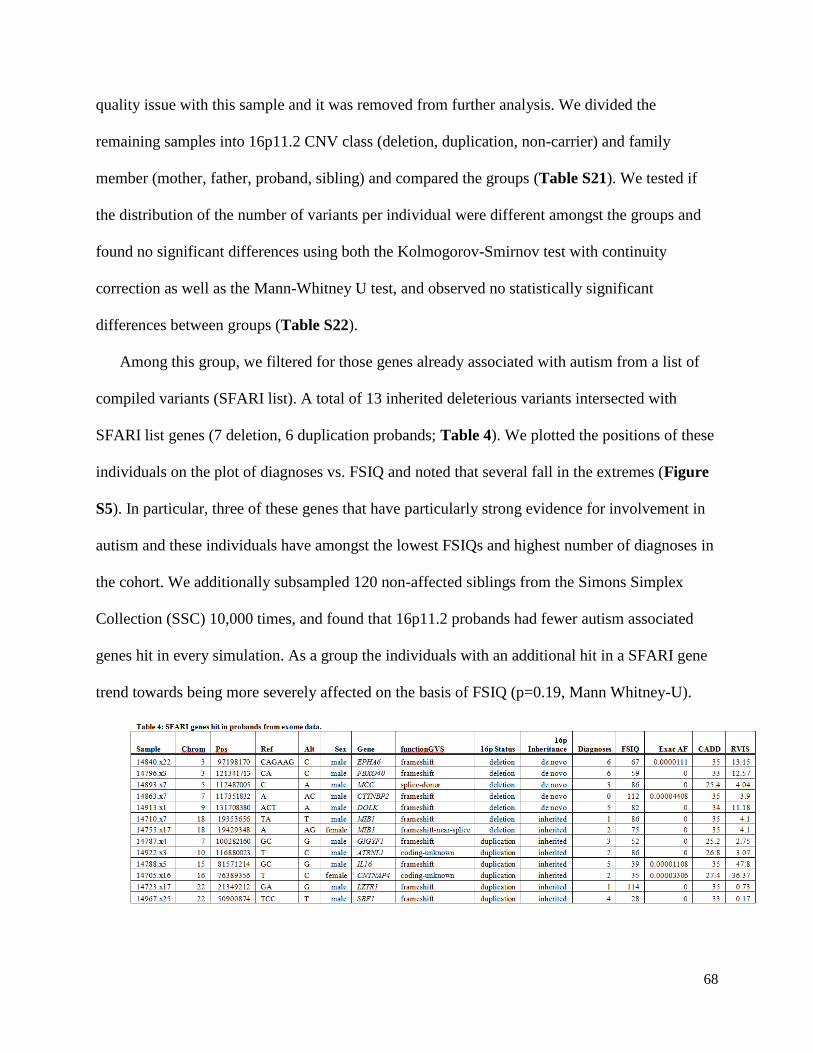
68
quality issue with this sample and it was removed from further analysis. We divided the
remaining samples into 16p11.2 CNV class (deletion, duplication, non-carrier) and family
member (mother, father, proband, sibling) and compared the groups (Table S21). We tested if
the distribution of the number of variants per individual were different amongst the groups and
found no significant differences using both the Kolmogorov-Smirnov test with continuity
correction as well as the Mann-Whitney U test, and observed no statistically significant
differences between groups (Table S22).
Among this group, we filtered for those genes already associated with autism from a list of
compiled variants (SFARI list). A total of 13 inherited deleterious variants intersected with
SFARI list genes (7 deletion, 6 duplication probands; Table 4). We plotted the positions of these
individuals on the plot of diagnoses vs. FSIQ and noted that several fall in the extremes (Figure
S5). In particular, three of these genes that have particularly strong evidence for involvement in
autism and these individuals have amongst the lowest FSIQs and highest number of diagnoses in
the cohort. We additionally subsampled 120 non-affected siblings from the Simons Simplex
Collection (SSC) 10,000 times, and found that 16p11.2 probands had fewer autism associated
genes hit in every simulation. As a group the individuals with an additional hit in a SFARI gene
trend towards being more severely affected on the basis of FSIQ (p=0.19, Mann Whitney-U).
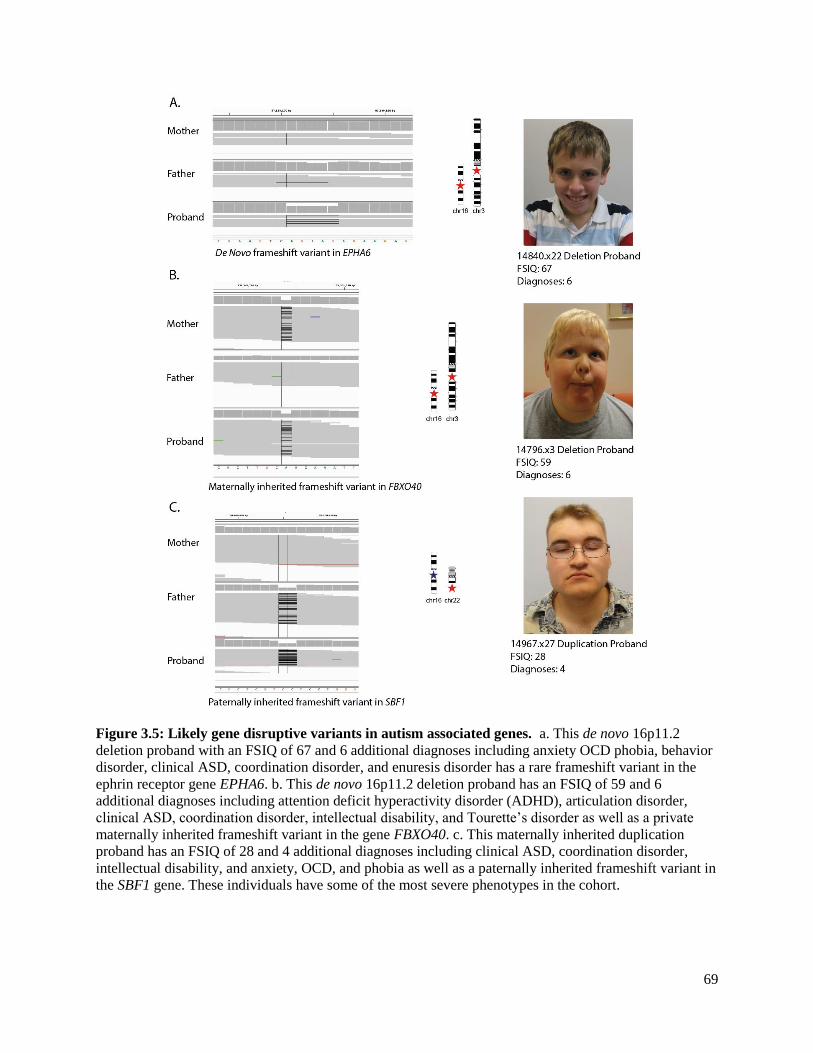
69
Figure 3.5: Likely gene disruptive variants in autism associated genes. a. This de novo 16p11.2
deletion proband with an FSIQ of 67 and 6 additional diagnoses including anxiety OCD phobia, behavior
disorder, clinical ASD, coordination disorder, and enuresis disorder has a rare frameshift variant in the
ephrin receptor gene EPHA6. b. This de novo 16p11.2 deletion proband has an FSIQ of 59 and 6
additional diagnoses including attention deficit hyperactivity disorder (ADHD), articulation disorder,
clinical ASD, coordination disorder, intellectual disability, and Tourette’s disorder as well as a private
maternally inherited frameshift variant in the gene FBXO40. c. This maternally inherited duplication
proband has an FSIQ of 28 and 4 additional diagnoses including clinical ASD, coordination disorder,
intellectual disability, and anxiety, OCD, and phobia as well as a paternally inherited frameshift variant in
the SBF1 gene. These individuals have some of the most severe phenotypes in the cohort.

70
De novo male deletion proband 14840.x22, for example, has an FSIQ of 67 and 6 additional
diagnosis including anxiety OCD phobia, behavior disorder, clinical ASD, coordination disorder,
and enuresis disorder as well as a frameshift variant in the ephrin receptor gene EPHA6 (Figure
3.5a). This variant is rare, found in less than 2 in 45,000 individuals ascertained from the Exac
database. While this variant is not found in the father, the mother did not have sufficient
coverage to make a variant call, but the variant appears de novo. Rare copy number variants in
this gene have been found in individuals with autism93,94, the gene is a candidate for
susceptibility to schizophrenia95, the gene is differentially expressed in Angelman syndrome
mice96, and genetic inhibition of the gene in mice produce behavioral deficits in learning and
memory97. Interestingly, this individual also has a paternally inherited duplication affecting the
gene CACNA2D3 which has been previously associated with autism91.
De novo male deletion proband 14796.x3 has an FSIQ of 59 and 6 additional diagnoses
including attention deficit hyperactivity disorder (ADHD), articulation disorder, clinical ASD,
coordination disorder, intellectual disability, and Tourette’s disorder as well as a maternally
inherited frameshift variant in the gene FBXO40 private in the cohort and not found in the Exac
database (Figure 3.5b). In autism individuals, CNVs were statistically enriched in this gene that
were not observed in controls98, and a rare variant in this gene has been identified in two
individuals with ASD99. This individual did not have any additional rare CNVs disrupting genes
associated with neurogenic disorders.
Maternally inherited male duplication proband 14967.x25 has an FSIQ of 28 and 4 additional
diagnoses including clinical ASD, coordination disorder, intellectual disability, and anxiety,
OCD, and phobia as well as a paternally inherited frameshift variant in the Set-Binding Factor 1
gene, SBF1 that is private both in the cohort and not found in over 45,000 individuals from the

71
Exac database (Figure 3.5c). De novo and rare inherited missense variants in this gene have been
found in exome sequencing studies of autism individuals and individuals with neurogenic
disorders3,66,100,101. Homozygous variants in this gene are also associated with Charcot-Marie-
Tooth disease, type 4B3102,103 (Omim 615284). This individual did not have any additional rare
CNVs disrupting genes associated with neurogenic disorders.
We additionally used the exome data, annotated using the same methods as for the MIP
resequencing data, in order to validate and compare our MIP resequencing results for the critical
region genes (Table S23). In particular, we compared variants found in probands in <0.1%
frequency in Exac, and private in the cohort. In samples assessed by both exome and MIP
resequencing (111 probands), we called 24 variants from the exome and 22 from the MIP
resequencing study. Of the 46 total variants called, 34 were shared, 7 were called only from the
exome, and 5 only from resequencing. In order to determine where the 12 variants called using
only one method came from, we assessed the raw read data. In 11/12 cases, the variant had been
filtered, typically for low coverage.
3.4.6 Selection analysis
Based on the heterozygosity and Tajima’s D analysis we find that the critical region shows
signatures of selection. In particular, the critical region lies in the lowest 2% of 550kbp regions
for average heterozygosity genome-wide (Figure S6) and in the lowest 3% of Tajima’s D
windows genome-wide (Figure S7). This is in contrast to the flanking 550kbp telomeric flanking
region which lies in the 50th percentile for Tajima’s D and 61st percentile for observed average
heterozygosity, respectively.
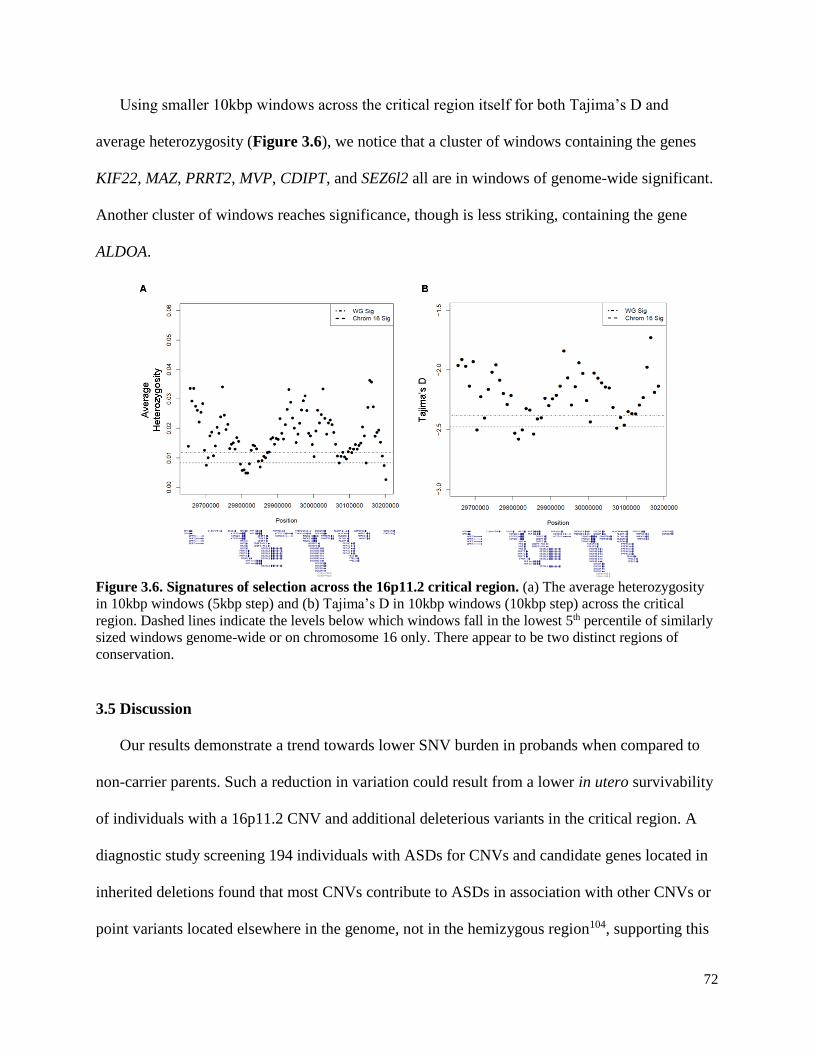
72
Using smaller 10kbp windows across the critical region itself for both Tajima’s D and
average heterozygosity (Figure 3.6), we notice that a cluster of windows containing the genes
KIF22, MAZ, PRRT2, MVP, CDIPT, and SEZ6l2 all are in windows of genome-wide significant.
Another cluster of windows reaches significance, though is less striking, containing the gene
ALDOA.
Figure 3.6. Signatures of selection across the 16p11.2 critical region. (a) The average heterozygosity
in 10kbp windows (5kbp step) and (b) Tajima’s D in 10kbp windows (10kbp step) across the critical
region. Dashed lines indicate the levels below which windows fall in the lowest 5th percentile of similarly
sized windows genome-wide or on chromosome 16 only. There appear to be two distinct regions of
conservation.
3.5 Discussion
Our results demonstrate a trend towards lower SNV burden in probands when compared to
non-carrier parents. Such a reduction in variation could result from a lower in utero survivability
of individuals with a 16p11.2 CNV and additional deleterious variants in the critical region. A
diagnostic study screening 194 individuals with ASDs for CNVs and candidate genes located in
inherited deletions found that most CNVs contribute to ASDs in association with other CNVs or
point variants located elsewhere in the genome, not in the hemizygous region104, supporting this
73
hypothesis. From population estimates, the 16p11.2 CNV occurs in ~0.05% of the population30, a
rate high enough that the CNV itself may act as a sieve for genetic variation in this region. The
concept of a “monoploid” sieve has been developed in plants, where the presence of lethal or
deleterious alleles in the monoploid region prevents regeneration105.
Analysis of 2,500 individuals from the 1000 Genomes Project suggests that the 16p11.2
critical region is under selection, as its Tajima’s D and average heterozygosity values lie in the
lowest 3% of similarly sized regions genome-wide (Figures S6 and S7). A refined analysis of
10kbp windows across the critical region revealed two clusters of genes which lie in the lowest
5% of such windows for both Tajima’s D and average heterozygosity (Figure 3.6) including
KIF22, MAZ, PRRT2, MVP, CDIPT, SEZ6L2 and ALDOA. Of these KIF22 is associated with
skeletal dysplasia and joint laxity106, PRRT2 is a key component of calcium neurotransmitter
machinery107, and has been associated with epilepsy108 and paroxysmal diseases109, and MVP
potentially play a role in autism110 and higher copy number has been linked to chemotherapy
resistant cancers111. As no one critical region gene has come to significance in exome sequencing
studies of large numbers of individuals with autism3,3–5, and no focal deletions have been found
to associate with particular phenotypes it is likely that dosage imbalance of the 27 critical region
genes, or a subset thereof, leads to the observed clinical phenotype.
We found no loss of function variants in probands in critical region genes and the probands
with a severe (CADD>20) missense variant did not have a more severe phenotype as assessed by
FSIQ and number of diagnoses. One explanation is that a LGD variant on the background of a
16p11.2 CNV is non-viable. Of the severe variants discovered among probands with a 16p11.2
duplication, all occurred in a single copy. It remains to be seen if deleterious variants existing on
multiple copies exist and what phenotype impact they have.

74
Analysis of exome resequencing data from the Simons VIP identifies 13 probands with a
LGD variant in a gene that has a prior for involvement in autism and/or intellectual disability. Of
these 13 individuals, 8 have 3 or more diagnoses and/or an FSIQ less than 70, suggesting that
additional rare, exonic variation outside of the critical region contributes to the severity of
phenotype (Figure S5). These individuals trend towards being more severely affected on the
basis of FSIQ compared to the population of probands. Interestingly, 16p11.2 carriers tend to
have fewer variants in autism associated genes than controls, suggesting that such variation is
particularly damaging in the background of a 16p11.2 CNV. A comparison of critical region MIP
resequencing data and critical region exome sequencing data showed good agreement, with the
variants missed using either approach over 90% of the time due to low coverage.
The three genes lying in segmental duplications flanking the critical region, BOLA2, SLX1A,
and SULT1A3 are not well-covered by exome sequencing and hence diversity in these genes has
not been assessed. In the 16p11.2 cohort, we observe no likely gene-disruptive events in
probands and those probands carrying a severe missense variant (CADD>25) do not have more
severe phenotypes on the basis of FSIQ and number of diagnoses (Figure S2) suggesting that
severe variation in these genes has the potential to affect phenotype. We observe no correlation
between copy number of these genes and phenotype severity, however, it is possible that a
deleterious variant present in an individual with low copy number of these genes may have a
more severe clinical presentation than an individual with a higher copy number. The severe
variants that we discovered almost always exist on a single copy, suggesting a recent origin.
To gain a sense of natural variation in the three duplicated genes, we resequenced the exons
of these genes in over 8,000 autism and intellectual disability cases and over 2,000 controls. The
presence of LGD variants suggests that loss of a single genic copy is not lethal. While we do not

75
observe a statistically significant difference in the number of LGD variants between cases and
controls in BOLA2, a bonafide Homo sapiens specific duplicated gene, it is interesting that LGD
variants only are found in cases.
BOLA2, SLX1A and SULT1A3 lie in a region of high diversity in the human and great ape
lineages. Of particular interest, BOLA2 and putatively SLX1A exist in a higher copy number state
than all other great apes as well as the ancient hominins Neanderthal and Denisova. Moreover,
these genes lie in sequence that is specifically duplicated in Homo sapiens.38 While the function
of BOLA2 is not specifically known, there is evidence that it plays a role in cell cycle signaling
and in the formation of iron-sulfur complexes,112 helping to control the redox state of the cell.113
The higher copy number state of BOLA2 could potentially be important in the developing human
brain, as the human brain experiences greater oxidative stress during development than does
chimpanzee.114 Strikingly, we find that 16p11.2 deletion individuals with the lowest copy
number (copy number 3) are enriched for anemia, suggesting that BOLA2 has an effect in a
hematological pathway. If replicated, low BOLA2 copy number is a definite modifier of the
16p11.2 phenotype, and one of the only genetic variants known that increases susceptibility to
anemia.
The function of SLX1A is better known. Through interaction with the protein SLX4, SLX1
functions as an important regulator of genome stability, acting as an endonuclease against
replication forks, 5’ loops and resolving Holliday junctions into linear duplex products.115–120
Furthermore, there is evidence that SLX1 catalyzes nucleolytic resolution of telomere DNA
structures, suggesting a role in telomere homeostasis and may contribute to genome stability in
humans.121–123
76
Interestingly, the 5-prime UTR of BOLA2 and the 5-prime UTR and first translated exon of
SLX1A overlap, as the two genes are transcribed from opposing strands and they presumably
share a promoter (Figure S8). Hence, even if the complete SLX1A gene is not specifically
duplicated in Homo sapiens, the first exon which contains the first 64 amino acids and the active
site of the GIY-YIG nuclease domain124 is. Given that maintenance of telomeres as well as
oxidative stress are important in the aging process, BOLA2 and SLX1A may contribute to the
longer lifespan of humans compared to great apes. There is also evidence that oxidative stress
may be important in the pathogenesis of certain subtypes of autism.125
Based on our analysis of allele balance in the population, we infer that most variants are
present in a single copy of BOLA2 or SLX1A (Figure 3.3). However, we do observe variants in
some transcripts that are frequent in the population. This is particularly the case with SLX1A,
where a subset of events is found in nearly all individuals, suggesting the presence of paralogous
sequence variants. Interestingly there is a relative dearth of private synonymous variation when
compared to missense and LGD variants (Table S11). Also, the majority of the sites of variation
in SLX1A lie in exon 3, which is not present in the shorter transcript NM_001015000.2.
While SULT1A3 lies in the region of segmental duplication and shares its copy number with
BOLA2 and SLX1A, the gene itself is not part of a Homo sapiens specific duplication.
Furthermore, the cytosolic sulfotransferases, of which SULT1A3 is a member, share a high
degree of identity, which can render mapping variation to the correct gene challenging. There are
14 genes in the family of cytosolic sulfotransferases (Table S15). The identity of the genes in
this family is high; for example there is >93% identity between the SULT1A paralogs126. The 4
SULT1A genes lie at 16p a subfamily of the cytosolic sulfotransferases which likely originated
as a result of duplication and recombination.
77
SULT1A3, a cytosolic sulfotransferase, catalyzes the sulfation of dopamine, other
catecholamines, and structurally related drugs which is significant in that over 95% of the
circulating dopamine and approximately 70% of the surface norepinephrine is sulfate-
conjugated126,127. Within the SULT1A subfamily, SULT1A1 favors simple phenolic substrates
like p-nitrophenol where SULT1A3 prefers monoamine substrates like dopamine128. Despite
>93% sequence identity, these enzymes have remarkable substrate specificity. Structural studies
have shown that residues 84-89 and 143-148 play important roles in stereoselectivity and
sulfating activity129. In particular residue Glu146 in SULT1A3 can form electrostatic interaction
with dopamine and could play a role in stereoseletivity and sulfating activity128,130 and Asp86
appears to be critical to the Mn2+-stimulation of the Dopa/tyrosine-sulfating activity130. In
SULT1A3, three residues are acidic instead of hydrophobic as in SULT1A1, which results in a
more negatively charged binding pocket that can better interact with the amino group of
catecholamines. In the entire family of sulfotransferases, SULT1A3 is the only one that can
efficiently bind dopamine129.
While the role of SULT1A3 in the gut is in the pre-systemic elimination of dietary
catecholamines131 the identification of SULT1A3 in the brain, including the dopaminergic
regions of the midbrain132 suggests that it has a role in eliminating dopamine in the brain as well.
To better understand the specific function of SULT1A3 in neuron-like cells, Sidharthan et al.
performed a series of assays and showed that (1) dopamine induces SULT1A3 via a dopamine
D1-NMDA receptor-coupled mechanism and (2) that induction of SULT1A3 significantly
protects cells from dopamine neurotoxicity133. Furthermore, the genotype-tissue expression
dataset (GTEx), shows that SULT1A3 is preferentially expressed in the brain (cerebellar
hemisphere, and cerebellum) and in the small intestine (terminal illium) (Figure S9). Through
78
SULT1A3, dopamine can induce its own metabolism and protect neuron-like cells from damage,
suggesting that reduced SULT1A3 activity could be a risk factor for dopamine-dependent
neurodegenerative disease and other dopamine influence disorders such as ADHD and
schizophrenia.
Strikingly, SULT1A3 appears specific to primates as no ortholog has been identified in
nonprimate species. Furthermore, several researchers have speculated that evolutionary pressure
from a greater catecholamine demand in primates may be responsible for its emergence80,134–136.
We can hypothesize that SULT1A3 copy number might be a risk factor in catecholamine-induced
neurodegenerative disease as enhanced extracellular dopamine can lead to increased cytosolic
oxidative stress that can lead to long-lasting neuronal damage.
Our sequence analysis indicates a >95% sequence identity between SULT1A3 and SULT1A1
and SULT1A2 and a >42% sequence identity between the other members of the gene family
(Table S15). Six sites corresponding to four residues (44, 84, 89, 144), uniquely distinguish
SULT1A3 from all other members of the SULT family (Tables S15, S24). Three of these
residues (84, 89, 144) have been implicated in determining the substrate specificity of SULT1A3.
If we compare SULT1A3 to SULT1A1 and SULT1A2, we identify 19 codons that distinguish
SULT1A3 (Table S24). Unsurprisingly, these include 4 out of the 6 residues from region 84-89
and 4 out of the 6 residues from region 143-148, which are known to be important in determining
the substrate specificity of SULT1A3.
In SULT1A3, we observe 14 LGD variants of which 2 are private and only found in controls.
Furthermore, we did not observe any statistically significant differences between cases and
controls, even when restricting to private or likely damaging events based on CADD score
(Table S13 and Figure S2).
79
Overall, variation does exist across the genes BOLA2, SLX1A, and SULT1A3 and the majority
of such variation is rare (<0.1% of samples) or private and exists in only one copy of the locus.
Future studies must incorporate a method to assess the absolute copy number in each individual
in order to better assess variant rates and more sophisticated variant models.
Our results demonstrate that critical region copy number is viable in numbers greater than 3
(duplication) and that critical region copy number can both expand and contract. In triplication
family 14752, for example, the grandmother has two copies of the critical region, the mother
three copies (duplication) and the proband four copies (triplication) (Figure 3.4). That both these
expansions occurred via an intrachromosomal mechanism and a shared critical region haplotype
between grandparents suggests that duplication may occur preferentially by intrachromosomal
mechanism on select haplotypes. Similarly, we observe a contraction from a mother with copy
number 5 (quadruplication) to a proband with copy number 3 (duplication) (Figure S4). Such
heterogeneity in copy number of the critical region shows that this region is dynamic and
susceptible to change.
There are several limitations of our work. First, targeted resequencing using MIPs is not
perfect, and not all bases are adequately captured. However, this technique allows sequencing of
regions, including regions not targeted by traditional exome capture that have eluded sequencing.
Second, assigning variants is challenging in duplicated space. For BOLA2 and SLX1A we know
variants map to these genes, however we do not know to which copy. We can use allele balance
and copy number estimates to determine in how many copies a variant exists. The SULT genes,
however, are highly identical. Hence variants that we discovered in SULT1A3 may map to
another member of this family. Third, we did not recall the publically available exome
sequencing data, relying on the original researcher’s calls. We could lose variants in this way.

80
Our results show a relative dearth of variation across the 16p11.2 critical region unique and
duplicated genes. The duplicated genes had not been assessed and we provide a resource to
understand variation across these genes and provide a model for how, moving forward, variation
should be assessed in such genes. We find loss of function variants in genes with a prior for
autism outside of the critical region, suggesting that such variation is important in determining
phenotype outcome. The presence of additional risk factors discovered by either sequencing or
diagnostic microarray will be important for projecting the disease trajectory and the diverse
outcomes associated with this pathogenic CNV.
81
4. Exome sequencing of a local cohort reveals genes implicated in
neurocognitive disorders and high-functioning autism
This chapter has not been published. Evan Eichler and I designed the study. Raphe Bernier and I
selected the samples. The Northwest Genomics Center and Center for Mendelian Genetics
performed library preparation and sequencing experiments and provided unfiltered GATK
variant calls. Carl Baker and I performed PCR validations. I performed all analyses and wrote
this section.
4.1 Summary
Autism spectrum disorders are characterized by phenotypic heterogeneity and genetic locus
heterogeneity. We assess a locally collected cohort of 42 families with an autism spectrum
disorder (ASD) of which 29 have an individual with high functioning autism. We find de novo
and rare inherited variants in novel autism candidate genes, including LPHN1 and NUMBL as
well as variants in autism associated genes, such as CLSTN3 and POGZ. The presence of
multiplex families allows inference of variants, such as an LGD variant transmitted from affected
father to son in DNM1L, as responsible for a high functioning ASD phenotype. In high
functioning families, we observe a higher rare inherited variant burden (p<0.007) when
compared with individuals who have autism with intellectual disability. We also find evidence
for enrichment in the actin genes in high functioning autism families (p=2.51x10⁻²). Our results
confirm the extreme locus heterogeneity associated with the ASDs, and show progress towards
defining genetic characteristics of autism in the absence of intellectual disability.
4.2 Introduction
The autism spectrum disorders (ASDs) are among the most common mental health disorders,
affecting an approximate 1 in 68 school-aged children137 and are characterized by persistent
difficulties in social communication and interaction and restricted and repetitive patterns of
behavior, interests, or activities138. The ASDs have a large heterogeneity in clinical presentation

82
and additional diagnoses can include intellectual disability, seizures, and attention deficit
hyperactivity disorder (ADHD). Despite this phenotypic heterogeneity twin studies have
estimated a genetic contribution to the disorder of 40-90%139,140. Array and exome sequencing
studies of thousands of autism families have revealed extreme locus heterogeneity of the
disorder5,59,66,141–143 and more than 30 genes are now implicated in the etiology of autism144.
Analysis of individuals with variants in the same gene has revealed clinical presentations and co-
morbidities more consistent with one another, than with the autism population as a whole33.
Despite the discovery of recurrent likely gene disruptive (LGD) variants in autism cases,
much of the etiology of the ASDs remains unknown. Studies have shown the importance of
inherited and missense variation145 and multiple variants may be necessary to lead to a clinically
ascertainable phenotype24. The majority of LGD variants are associated with severe phenotypes,
and the genetic factors leading to autism without intellectual disability are largely unknown.
Over the past six years, a collection of over 400 families with autism, ID, and other
communication disorders was assembled at the University of Washington, with clinical data and
DNA samples available. The goal of this study was two-fold: (1) To assess rare de novo and
inherited variation in multiplex and high functioning autism (HFA) families; (2) To determine if
there are particular genes involved in autism without intellectual disability.
4.3 Subjects and methods
4.3.1 Samples
DNA samples were derived from peripheral blood obtained from 148 individuals from 42
families as part of the Serial Analysis of Gene Expression (SAGE) project at the University of
Washington. Diagnoses included autism spectrum disorder (ASD), developmental delay (DD),

83
and intellectual disability (ID). Of the families assessed, 26 were multiplex, 29 had at least one
high functioning individual as defined by a DSM-IV-TR diagnosis of Asperger’s or autism with
no diagnosis of intellectual disability, and all were of European Ancestry (Table S1). Study
participants were ascertained in three ways: (1) The Seattle Children’s Hospital Autism Center
Clinic Registry, which consists of families who expressed interest in participating in research, (2)
Seattle area listservs for families with ASD, DD, or ID, including listservs pertaining to Autism
Speaks, Parent to Parent (P2P), The Arc, FEAT, and others. (3) Providers who work with
individuals with ASD, DD or ID.
We additionally assessed four subsets of high functioning individuals from the Simons
Simplex Collection (SSC)40. Subset 1 consists of individual who have a diagnosis of high
functioning autism (HFA) as defined by any one of the following: (1) A collaborative programs
of excellence in autism (CPEA) diagnosis of Asperger’s Syndrome146 (Table S2); (2) A clinician
assessment of high functioning autism or Asperger’s syndrome, with a certainty score of 4 or 5
(on a scale of 1 to 5, where 1 is highly certain and 5 is completely certain), even if the proband
did not meet strict DSM-IV criteria. Subset 2 are probands with a full scale intelligence quotient
(FSIQ) > 100 (Table S3). Subset 3 are probands with FSIQ<70. Subset 4 consists of all
sequenced siblings. For the first two subsets we filtered out any individuals with an FSIQ<80 or
with an additional DSM-IV axis I or axis II diagnosis or diagnosis reported with an International
Statistical Classification of Diseases and Related Health Problems 9th revision (ICD-9) code.
All procedures for clinical assessment and blood extraction were approved by the
institutional review boards (IRBs) of participating institutions, and informed consent was
obtained for participation in this research.

84
4.3.2 Phenotypic assessment
For the SAGE cohort, psychiatric and neurodevelopmental conditions were diagnosed by
experienced, licensed clinicians following DSM-IV-TR criteria31 using all available information,
including clinical observation, caregiver history, and records review. Pedigrees were obtained
from family interview and formal diagnosis was assessed after a clinical visit. An individual was
determined to have high functioning autism by review of clinical information, if available, and/or
pedigree review from a clinical visit.
As part of participation in the Simons SSC40, standardized assessments, including
psychiatric, neurocognitive, behavioral, motor, and neurologic evaluation, were conducted at 12
Simons SSC clinical sites along with collection of a detailed medical history through interview
and medical records review for each participant. Psychiatric and neurodevelopmental conditions
were diagnosed by experienced, licensed clinicians following DSM-IV-TR criteria31 using all
available information, including clinical observation, caregiver history, and records review.
Diagnostic foci included: ASD, attention deficit hyperactivity disorder (ADHD), communication
disorders, anxiety disorders, mood disorders, intellectual disability, tic disorders, elimination
disorders, learning disorders, and behavioral disorders, totaling 27 diagnostic codes. Full-scale
intelligence quotient (FSIQ) was determined by the developmentally appropriate cognitive
measure (Mullen Scales of Early Learning52), the Differential Abilities Scale, Second Edition53,
or the Wechsler Abbreviated Scales of Intelligence54. We used the version 15 release of the SSC
phenotype data.

85
4.3.3 Variant detection from exome sequencing
SAGE:
We selected 42 families from the SAGE cohort on which to perform exome sequencing
(Table S1). These families were: (1) multiplex or had an individual with high functioning autism
(HFA) and; (2) did not contain a >100 kbp rare CNV (present in <0.1% of controls). Genomic
DNA was derived from whole blood and exomes for the 42 families (148 individuals) were
captured with NimbleGen EZ Exome V2.0. Reads were mapped to human genome reference
assembly GRCh37 (hg19) with decoy sequence using bwa-mem version 1.46, and variants were
called on all samples together using GATK 3.2 haplotype caller (multisample calling). We
required the following filters: (1) Passing records only; (2) depth<10; (3) QUAL<10; (4) dbSNP
excluding sites after release 129; (5) Mills and 1000 genomes gold standard indels; (6) Variants
lying in segmental duplications or tandem repeats; (7) SNPs >1% frequency in dbSNP 144; (8)
homopolymer repeats. We assessed only the autosomes of these individuals. After filtration we
broke multiallelic records into single entries and annotated discovered variants with Seattle Seq
137. If multiple transcripts were present, we chose the most severe annotation. We annotated
each variant with v1.3 of the CADD score85 and with a frequency from the Exac database
(%ExAC_0.05%,
ftp://ftp.broadinstitute.org/pub/ExAC_release/release0.3/subsets/ExAC.r0.3.nonpsych.sites.vcf.g
z)., and each gene for presence in a list of genes associated with autism (SFARI gene list,
https://gene.sfari.org/, Accessed 1 April 2016), and the Residual Variation Intolerance Score
(RVIS, release v3_12Mar16).90 We determined putative inheritance for each variant using the
called genotype and performed Sanger sequencing on a subset of variants called de novo and a
subset of potentially impactful variants (Tables S4 and S5). We utilized the exome sequencing

86
read-depth data in order to call putative CNVs as previously described with the program
CoNIFER147.
SSC:
For the Simons Simplex Collection (SSC) samples, we used the SNV and indel call sets from
a complete reanalysis of the Simons Simplex Collection148. We annotated this dataset with the
v1.3 CADD scores, Exac allele frequency, RVIS scores, and the SFARI gene list.
4.3.4 Network and enrichment analysis
We used the Panther database149 to perform pathway analyses and statistical
overrepresentation tests. We used stringdb150 to visualize gene networks.
4.4 Results
We focused on severe private inherited and de novo variation in the SAGE cohort; variants
that were private to a family, not found in the Exac database, and had a RVIS Score of <50. For
missense variants we also required a CADD score>30 (Table S6). We used the same filters for
the SSC cohort subsets analyzed. In total we identified 138 variants in probands and 59 variants
in siblings meeting these criteria. These included 6 variants in probands and 4 in siblings hitting
genes with a prior for autism based on the SFARI gene list. There were 131 variants in probands
for +59hich perfect inheritance information was available which included 4 de novo (3%), 59
paternal (45%) and 68 maternal (52%) events. In siblings, there were 55 variants for which
perfect inheritance information was available which included 5 de novo (9%), 24 paternal (44%),
and 26 maternal (47%) events.

87
Among the 86 variants in probands with high functioning autism with perfect inheritance
information, we observe 1 de novo (1%), 40 paternal (47%), and 45 maternal (52%) events.
Among the 10 variants in siblings with high functioning autism, we observe 4 maternal, 5
paternal, and 1 de novo event.
For the 215 variants for which we have inheritance information (even if only from one
parent), we observe a median of 3 severe variants per individual and observe the same for the
high functioning individuals (Table S7).
4.4.1 De novo variation
We observe a total of 26 coding de novo variants in probands (8 LGD, 18 missense) with one
missense variant with CADD>30. Among the high functioning individuals, we observe a total of
12 de novo variants (2 LGD, 10 missense), and none of the missense variants have a CADD
score >30. We attempted validation of 32 de novo events. Of these, we validated 30 and
invalidated 2 private de novo LGD variants (Table S5). Among the de novo variants discovered
were several with a prior for involvement in neuropsychiatric disorders, including variants in
THBS1, LACTB, NSUN2, LPHN1, POGZ, NUMBL, and CLSTN3 (Figure 4.1).

88
Figure 4.1: Families with de novo severe variants in autism and neurocognitive associated genes. a.
We validated a de novo stop-gain variant in exon 18 of 22 of the thrombospondin I gene (THBS1) in
female sibling of family 396 who has a diagnosis of autism with a mixed receptive-expressive disorder.
Thrombospondin I is an adhesive glycoprotein that mediates cell-to-cell and cell-to-matrix interactions
and has a role in synaptogenesis in the developing brain. b. We validated a de novo stop-gain variant in
exon 2 of 24 of the Latrophillin-1 (ADGRL1/LPHN1) gene found in a male proband with a diagnosis of
ADHD and PDD-NOS. Latrophillin-1 is a neuronal receptor of α-latrotoxin, that is implicated in
neurotransmitter release and control of presynaptic Ca2+. c. We validated a de novo stop-gain variant in
exon 7 of 10 of the numb homolog (Drosophil)-like (NUMBL) found in the proband of family 271with
autism and slow to develop language skills. NUMBL, the numb homolog (Drosophil)-like, can directly
bind and inhibit the Notch1 intracellular domain, and hence plays an essential role in neural cell fate
determination. d. We discovered and validated a private de novo missense variant ILE -> THR in exon 5
of 18 of the calsyntenin-3 gene (CLSTN3) in cadherin domain of the male high functioning autism sibling
of family 187. Calsyntenin-3, is an autism candidate gene and promotes excitatory and inhibitory synapse
development. While the identified variant is likely pathogenic, other rare variants shown could also
contribute to the pathogenicity.
4.4.2 Variants shared between siblings
Because the quads and quint in this study have at least two affected offspring, shared variants
have a higher prior probability of contributing to the observed disorder. Because we are not
focusing on somatic variants, we removed monozygotic twins from this analysis. Among the 21

89
families, we observe 35 private severe variants that are shared between two or more offspring in
the same family. This includes 0 de novo (as expected), 14 LGD, and 21 severe missense
variants (Table S7). Among the private LGD and severe missense variants there are several that
have been implicated in autism or neurodegeneration as defined as being on the SFARI list of
autism genes, having an OMIM ID related to a neurocognitive process, or have functional
literature relating to neuronal processes. These include LEMD3, LACTB, BBS5, and JMJD1C.
4.4.3 Inherited cases
For several of the families, there is a history of neuropsychiatric disease on the maternal or
paternal side. In some cases, the parent is diagnosed with a neuropsychiatric disorder, for example
in family 258 an LGD variant in DNM1L is transmitted from affected father (father has high-
functioning autism), in family 329 a missense variant in NCOR is transmitted from affected mother
(mother has anxiety issues, father has social challenges), and in family 406 a LGD variant in
NGDN is transmitted from the mother (mother has ADHD) (Figure 4.2).

90
Figure 4.2: Mendelian candidates for pathogenicity. In three families, a likely pathogenic variant
segregates with phenotype from parent to child. In family 258 (a) we validated a LGD variant in DMN1L
that segregates from the father with high functioning autism to the son with the same diagnosis. DNM1L
codes for the dynamin-like protein 1, is associated with autosomal dominant encephalopathy, plays an
important role in the division of the growing mitochondria and peroxisomes, and is associated with
autism. In family 329 (b), there is a severe maternally transmitted missense variant in NCOR, the nuclear
receptor corepressor. Genes associated with the NCOR/HDAC3 complex have been implicated in autism.
In family 406 (c) the proband and the sibling both have ASD diagnoses and the mother has an ADHD
diagnosis, we discovered a frameshift variant transmitted to both sequenced offspring in the gene
neuroguidin (NGDN). Neuroguidin is a eukaryotic initiation factor 4E binding protein and associated with
the fragile X mental retardation protein (FMRP).
4.4.4 SAGE high functioning autism cases
We next restricted our analysis to look specifically at the 29 families in our cohort with a
diagnosis of high functioning autism. Several variants in this cohort are associated with
neurocognitive disorders. For example, among the de novo variants, we discovered a stop-gain
variant in exon 5 of 10 of the matrix metalloproteinase 13 gene (MMP13). Variants in MMP13
(OMIM 602111) have been associated with autosomal dominant metaphyseal anadysplaia. A de
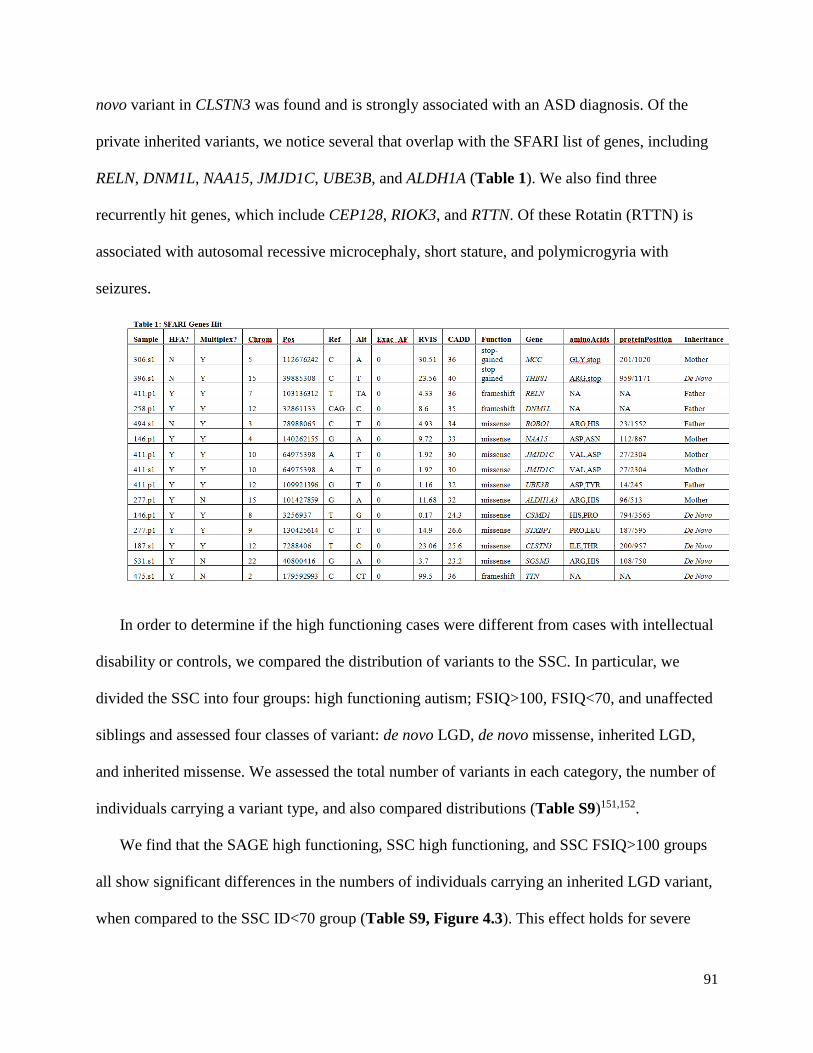
91
novo variant in CLSTN3 was found and is strongly associated with an ASD diagnosis. Of the
private inherited variants, we notice several that overlap with the SFARI list of genes, including
RELN, DNM1L, NAA15, JMJD1C, UBE3B, and ALDH1A (Table 1). We also find three
recurrently hit genes, which include CEP128, RIOK3, and RTTN. Of these Rotatin (RTTN) is
associated with autosomal recessive microcephaly, short stature, and polymicrogyria with
seizures.
In order to determine if the high functioning cases were different from cases with intellectual
disability or controls, we compared the distribution of variants to the SSC. In particular, we
divided the SSC into four groups: high functioning autism; FSIQ>100, FSIQ<70, and unaffected
siblings and assessed four classes of variant: de novo LGD, de novo missense, inherited LGD,
and inherited missense. We assessed the total number of variants in each category, the number of
individuals carrying a variant type, and also compared distributions (Table S9)151,152.
We find that the SAGE high functioning, SSC high functioning, and SSC FSIQ>100 groups
all show significant differences in the numbers of individuals carrying an inherited LGD variant,
when compared to the SSC ID<70 group (Table S9, Figure 4.3). This effect holds for severe

92
rare inherited missense variation amongst the SSC high functioning and SSC FSIQ>100 groups
as well. We notice a similar effect when we compare the median number of variants in each
individual between groups using the Mann-Whitney U test.
Figure 4.3: Variants per individual in two SSC cohorts. We assessed the number of private inherited
LGD and private inherited severe missense variants per individual in the SSC individuals with FSIQ<70
and those with high functioning autism. We notice that those with high functioing autism tend to have
more severe inherited variants per individuals that low functioning cases.
Leveraging the de novo variants discovered in the SSC high functioning group, we find a
protein-protein interaction network underlying several of the de novo variants (Figure 4.4). This
network appears to be associated with the NOTCH signaling pathway. Finally, we found that
severe variants in the SAGE high functioning samples are enriched in the actin-binding pathway
(Panther-Go Slim molecular function, 7.63 fold enrichment, p=2.51x10⁻²).

93
Figure 4.4: Network of connected proteins from de novo LGD and severe missense variants from
SSC high functioning cases. A protein-protein interaction network for de novo variants from the high
functioning autism individuals from the SSC shows an importance of the NOTCH pathway.
4.5 Discussion
Our results demonstrate the presence of rare likely gene disruptive and severe missense
variants that contribute to the pathogenesis of the ASDs. We observe that mothers transmit more
variants than fathers , both in all families (p=0.727) and when restricting to high functioning
families (p=0.746), potentially corroborating previous evidence that mothers tend to transmit
more deleterious variants to their affected offspring77,139,148. Of the families assessed, 26 are
multiplex, several with diagnoses from the father’s side which might dampen the observed
transmission bias.
We observe the presence of de novo variants with strong evidence for involvement in
neurocognitive function and neuronal development. The available case reports show specific
94
phenotypes associated with these variants. For example, we discovered and validated a de novo
stop-gain variant in exon 18 of 22 of the thrombospondin I gene (THBS1) in female sibling
396.s1 who has a diagnosis of autism with a mixed receptive-expressive disorder. According to
the clinical record, this individual has a normal head size and there were no concerns until
regression at age 3 including loss of language and interactions with others. She was administered
the WISC-IV and was notable for a verbal comprehension in the 0.5th percentile and a working
memory in the 18th percentile.
Thrombospondin I is an adhesive glycoprotein that mediates cell-to-cell and cell-to-matrix
interactions and has a role in synaptogenesis in the developing brain153 and has been implicated
in autism154. This individual also has a validated paternally inherited private frameshift variant in
the LACTB gene, which codes for the mitochondrial ribosomal protein L56 which is also shared
by her sibling who has an autism diagnosis155 as well as two private inherited severe missense
variants (Figure 4.1a). One of these genes, NSUN2 (maternal) is associated with autosomal
recessive intellectual disability156,157.
We discovered and validated a de novo stop-gain variant in exon 2 of 24 of the Latrophillin-1
(ADGRL1/LPHN1) gene found in a male proband with a diagnosis of ADHD and PDD-NOS
(330.p1) as well as a validated de novo private missense variant in the delta-aminolevulinate
synthase 1 gene (ALAS1, CADD=18.6). The family history is significant for high functioning
autism and dyslexia on the mother’s side, and notable in that all inherited severe missense
variants were maternal in origin (Figure 4.1b). The proband has a WISC-IV intelligence
quotient (IQ) of 96.
Latrophillin-1 is a neuronal receptor of α-latrotoxin, that is implicated in neurotransmitter
release and control of presynaptic Ca(2+)158,159. As an adhesion G-protein-coupled receptor,

95
LPH1 can convert cell surface interactions into intracellular signaling160. ALAS1 is a nuclear
encoded mitochondrial housekeeping gene that catalyzes the condensation of glycine with
succinyl-coA to form delta-aminolevulinic acid161. This proband also had one additional
inherited stop-gain variant and one inherited severe missense variant. The sibling in this family
with a diagnosis of high functioning autism has a duplication disrupting the gene POGZ, which
has already been strongly implicated in autism162,163.
We discovered and validated a de novo stop-gain variant in exon 7 of 10 of the numb
homolog (Drosophil)-like (NUMBL) found in the proband of family 271with autism. This
proband was slow to develop language skills with phrase speech only emerging at 27 months. In
clinical visits, the family’s concerns were related to challenges with language skills, oppositional
behavior and poor impulse control including grimacing, rhythmic humming, and hand flapping
when excited. These concerns were reflected on the PKS 2nd edition which revealed a low score
for social skills (58) and a high score for problem behavior (136) with main problem behaviors
including tantrums and being overly sensitive to criticism or scolding. The proband’s brother has
high functioning autism, and there is a history of epilepsy, bipolar, and depression on the
mother’s side (Figure 4.1c). NUMBL, the numb homolog (Drosophil)-like, can directly bind and
inhibit the Notch1 intracellular domain, and hence plays an essential role in neural cell fate
determination164–166. We discovered an additional maternal severe missense variant in this
individual.
We discovered and validated a private de novo missense variant ILE -> THR in exon 5 of 18
of the calsyntenin-3 gene (CLSTN3) in cadherin domain of the male high functioning autism
sibling of family 187 (Figure 4.1d). There is a history of fragile X, ASDs, and developmental
delays on the mother’s side and this individual has a brother with autism. This de novo variant
96
has a CADD score of 25.6. The protein, calsyntenin-3, promotes excitatory and inhibitory
synapse development and is an autism candidate gene167. In addition, the sibling has 2 inherited
LGD and one severe missense variant.
NUMBL has not yet been implicated in a neurological phenotype, but plays a role in neuronal
cell differentiation and is hence a strong candidate for a developmental disorder. In these cases,
even though there are strong candidates for genetic etiology of the disorder, the probands also
inherit variants in genes associated with neurocognitive disorders suggesting that multiple hits may
be necessary to lead to a penetrant phenotype.
In three families (258, 329, and 406), we observe disruptive variants that segregate with a
diagnosis from the parent (Figure 4.2). In family 258, we observe an LGD variant in DNM1L
that segregates from the father with high functioning autism to the son who has the same
diagnosis (Figure 4.2a). This variant is found in exon 5 of 22 and the gene is associated with
autism168. DNM1L codes for the dynamin-like protein 1, is associated with autosomal dominant
encephalopathy, and plays an important role in the division of the growing mitochondria and
peroxisomes169. Additional variants could be playing a role in this case, as the proband also has a
maternally inherited frameshift variant in SPRED2 which has some evidence for involvement in
childhood speech apraxia170 as well as 8 other rare inherited variants.
In family 329, where the proband has a high functioning autism diagnosis, the mother has
anxiety issues and the father has social challenges, there is a severe maternally transmitted
missense variant in NCOR, the nuclear receptor corepressor 1 (Figure 4.2b). In a recent network
analysis of de novo variants in autism, genes associated with the NCOR/HDAC3 complex have
been implicated in autism171. The mother also transmits a missense variant in TRPM (CADD
29.1), the transient receptor potential cation channel, subfamily M, member 1, in which an

97
excess of rare deletions in autism cases was found94. The father with social challenges transmits
a severe missense variant in the MYO9B gene (CADD 29.5), which codes for Myosin IXB, and
was identified as a gene strongly enriched for variants likely to affect ASD risk66. In family 406,
where the proband and the sibling both have ASD diagnoses and the mother has an ADHD
diagnosis (Figure 4.2c), we discovered a frameshift variant transmitted to both sequenced
offspring in the gene neuroguidin (NGDN). Neuroguidin is a eukaryotic initiation factor 4E
binding protein and associated with the fragile X mental retardation protein (FMRP)172,173. The
first and second examples demonstrate the variable expressivity of disruptive variants, while the
third demonstrates the extreme heterogeneity and points towards missing heritability of the
ASDs.
We observe likely impactful de novo and inherited variation in both simplex and multiplex
families. In multiplex family 330, for example, we observe a phenomenon whereby there are two
de novo variants, one in the proband and one in the sibling, likely contributing to the diagnosis.
The proband has a stop-gain variant in the LPHN1 gene, the product of which is implicated in
neurotransmitter release158,159 while the sibling has a <100kbp duplication disrupting the gene
POGZ, already implicated in the etiology of ASD162,163. We observe variants transmitted to both
affected proband and sibling in several families, including those with a prior for involvement in a
neuropsychiatric disorder, such as LEMD3, LACTB, BBS5, and JMJD1C. Phenotypic
categorization into multiplex and simplex families is useful, however our results demonstrate that
both de novo and inherited variation can play a role in such families.
A major focus of this study was to assess variation in individuals with autism in the absence
of intellectual disability. Despite the fact that over half of our families have a diagnosis of high
functioning autism, we find few impactful de novo variants and we find only a single LGD variant
98
in the gene CHRM4. We do find two private inherited LGD and five severe missense variants in
genes strongly associated with autism from the SFARI list as well as two families with a hit in the
Rotatin gene, associated with microcephaly and polymicrogyria151,152. Using high functioning and
>100 FSIQ cases from the SSC allowed us to statistically assess variant burden. While our cohort
of high functioning cases is restricted, due to its size, we observe trends towards differences in
inherited LGD and missense variant burden when compared to SSC control siblings and <70 FSIQ
individuals. Both the SSC high functioning autism, and FSIQ>100 cohorts show statistically
significant differences in de novo LGD, inherited LGD, and inherited missense burden when
compared to the <70 FSIQ individuals. Somewhat surprisingly, the data suggest that low
functioning samples are closer to controls in terms of inherited variant burden when compared to
high functioning samples (Figure 4.3). Interestingly, the burden for inherited variants is greater
per individual in high functioning than low functioning cases.
Curiously, we notice a difference in de novo LGD variant burden between the SSC high
functioning cases and unaffected siblings, but not between the FSIQ>100 group and unaffected
siblings. Individuals can have high functioning autism with an FSIQ as low as 80, suggesting that
LGD de novo variants decrease FSIQ in addition to contributing to an autism diagnoses.
The fact that de novo severe variants from the SSC high functioning group form a protein-
protein interaction network involving the NOTCH pathway (Figure 4.4), suggests that similar
genes, but likely different types of variants in those genes, are associated with high functioning
autism. The role of actin is important for remodeling of neurons174,175, and enrichment for these
genes in the SAGE high functioning cohort suggest this class of protein may also be important in
autism without intellectual disability. Shank3, a known autism gene, has been shown to interact

99
with actin regulators and Shank3 deficient mice can be rescued by manipulation of actin
regulators176.
Our results confirm the massive locus and phenotype heterogeneity observed in the ASDs.
Breaking autism cohorts into distinct phenotypic groups allows assessment of genetic differences
associated with subtypes of autism. While our sample size for this study is relatively small, we
discovered several novel autism candidate genes and rediscovered several more. Our results point
to the importance of both inherited and de novo variation, and suggest that inherited variation may
be a driving factor in the etiology of high functioning ASDs.

100
5. Summary and Future Directions
Our work on the heterogeneity of neuropsychiatric disorders sets the stage for future studies.
Individuals with a known pathogenic variant, such as a large CNV, are often excluded from
exome sequencing and genome sequencing studies. However, insight into the additional
variation discovered in these individuals will provide better understanding of the modifiers that
lead to phenotype heterogeneity in individuals with a known pathogenic variant.
My study of genetic modifiers in the Simons VIP 16p11.2 cohort led us to discover several
features of variation that could account for the observed phenotype heterogeneity. I discovered a
maternal inheritance bias of rare (<0.1% in controls) additional deletions in addition to the
16p11.2 CNV and that the number of additional rare deletions negatively correlated with FSIQ.
Despite the cohort being screened for additional large, likely pathogenic CNVs, I discovered 9
additional CNVs that disrupt genes already implicated in autism and neuropsychiatric disorders.
Many individuals with such events had distinct (more severe) phenotypes, including facial
dysmorphologies, and tended to be female.
A distinct advantage of the Simons VIP is the presence of parents and additional family
members that allowed us not only to determine the inheritance status of the 16p11.2 CNV, but
also of additional CNVs and exonic variants. The SNP microarray data allowed us to assess the
parent-of-origin of the 16p11.2 de novo events and led us to examine genome-wide
recombination rate data. Over 90% of de novo 16p11.2 CNVs (deletions and duplications) occur
on the maternal haplotype, likely as a result of heterochiasmy (difference in recombination rates
between male and female) at the 16p11.2 locus. Data from a large Icelandic cohort shows that
the fecundity of the 16p11.2 deletion is lower in males than in females, suggesting that an
additional mechanism could also contribute30. The SNP microarray data also allowed us to

101
determine no apparent difference in the mechanism of unequal crossing over for de novo 16p11.2
deletions or duplications.
Analysis of exonic variation internal and external to the critical region revealed a relative
lack of variation across the 16p11.2 critical region and there was a trend for less variation in
probands than non-carrier family members. Population genetics analysis using the 2,500
individuals from the 1000 Genomes Phase III project demonstrates that the 16p11.2 critical
region lies in the lower 3rd percentile for both the average heterozygosity and Tajima’s D
statistics, when compared to the distribution of similarly sized regions genome-wide. These data
suggest that the critical region, despite being predisposed to recurrent deletion and duplication, is
under selection.
Genes lying in duplicated sequence are not well-captured through targeted sequencing
approaches, such as exome sequencing. My analysis of the three duplicated critical region genes
revealed, for the first time, natural variation in BOLA2, SLX1A, and SULT1A3. I determined that
variants typically occur in a single copy of these genes (median copy number 6 in human
populations). In BOLA2, a gene with little known function and under intense study because it is
part of a Homo sapiens specific duplication, I found only 8 individuals with an LGD variant in a
population of over 8,000 cases with autism of intellectual disability. Furthermore, no individual
in the Simons VIP cohort had an LGD variant in BOLA2. From our reanalysis of exome
sequencing data from the Simons VIP cohort, I find 13 likely gene disruptive variants in
probands in genes with a prior for autism or intellectual disability and these probands were
among those most severely affected. That deletion individuals with the lowest BOLA2 copy
number (CN=3) were enriched in anemia gives evidence of BOLA2 copy number as a phenotype
modifier, and one of the only known genetic variants leading to an anemia phenotype.
102
Our analysis of a locally collected cohort of individuals with autism and intellectual
disability revealed several previously uncharacterized variants likely contributing to the
diagnosis. Leveraging the Simons Simplex Collection for additional high functioning cases I find
that de novo variants amongst this group are enriched for genes in the Notch signaling pathway.
Our results show that high functioning cases are less similar to controls in terms of burden of
rare inherited variants compared to individuals with FSIQ<70, suggesting this is an important
form of variation in high functioning cases. I find some evidence that actin binding proteins may
be important in the etiology of high functioning autism.
These results support the conclusions from other studies and pave the way for future
research. For example, in the 16p11.2 cohort as well as the SAGE cohort, I see a bias toward
maternal transmission of deleterious variants. These data support the hypothesis that females
have a “buffering capacity” against deleterious variation. The striking maternal parent-of-origin
bias and relative lack of diversity across the critical region warrants parent-of-origin,
recombination rate, and population genetic studies of other microdeletion and duplication
regions. In my study, I observe several trends: the number of rare deletions in 16p cases is
negatively correlated with FSIQ; there is lower variation in 16p11.2 probands than non-carrier
family members; and de novo duplications tend to occur by an intrachromosomal mechanism of
crossing over. In order to confirm or refute these trends, a large sample size is needed.
Both the Simons VIP and SAGE study designs provide an important blueprint for going
forward on a much larger scale. The rapid recruitment of such a large number of participants was
achieved from a network of local providers (for SAGE) and from the Simons VIP Connect
(https://simonsvipconnect.org/). The Simons VIP Connect specifically leverages the internet and
serves as a portal for clinicians, genetic counselors and families with a 16p11.2 copy number
103
variant (CNV) diagnosis to network and become involved in specific research studies. While
website recruitment introduces a level of ascertainment bias, the fact that participants were flown
(at no expense to the family) to a site where standardized testing could be performed, provided
not only sufficient numbers but a more rigorous phenotypic assessment. Efforts to network
families with specific variants and researchers/clinicians are also occurring in Europe often for
the same genes or CNVs (http://www.rarechromo.org/, www.humandiseasegenes.com). The
Simons 16p11.2 CNV and SAGE projects provide a powerful roadmap on how to balance the
interests of affected individuals, researchers and clinicians.
With exome and genome sequencing becoming routine clinical practice, the genotype-first
approach will likely soon spread beyond autism and developmental delay to include genes and
CNVs associated with other psychiatric disorders. Routine sequencing will increase numbers to
discover additional cases of rare, likely gene-disruptive variants, such as those discussed in the
SAGE cohort.
A fundamental goal of my research is to elucidate understanding of genetic variation for use
in a clinical context. In the case of 16p11.2 carriers, we found that CNVs and SNVs disrupting
autism associated genes may be more important modifiers than those local to the critical region.
While sample size is small, and larger cohorts will confirm or refute these trends, the results of
this research outline a clinical approach. As therapies are tested for particular autism associated
genes, individuals with an additional hit in such genes may benefit from individualized
treatments. Trends towards greater global burden of SNVs and CNVs can give families some
explanation of their child’s case. In terms of prenatal diagnosis, individuals with additional rare
variants have a prior for being more severely affected.

104
Moving forward, experimental techniques need to capture all variation. Our experimental
methods did not capture copy number variation between 50bp-50kbp, nor single nucleotide and
indel variation genome-wide. It is possible that regulatory variation internal or external to the
critical region may play a crucial role as a phenotype modifier as is suggested from recent whole-
genome studies177. Whole-genome sequencing of affected individuals is a logical way forward to
assess all types of variation and refute or confirm observed trends in the data. An understanding
of the complete repertoire of variation will provide further insight into phenotype modifiers.
Genome sequencing will allow study of all forms of variation, including non-coding
regulatory variation. There are three immediate benefits: 1) establishing or rejecting phenotype–
genotype correlations with statistical rigor; 2) networking families with other families in order to
provide real-life solutions to often idiosyncratic problems associated with a specific genetic
disorder; and 3) linking affected individuals and their families with clinical and basic researchers
specifically focused on understanding the biology of a gene or gene network. The latter will
ultimately lead to the design of clinical trials and the large number of affected individuals
assembled will speed their implementation. The pioneering families recruited through these
networks will likely be the most informed by research advances and have the benefit of being at
the head of the line when such clinical trials are implemented for their specific genetic subtype of
neurocognitive disorder.
In the near future, we will have the ability to analyze over 100,000 individuals with
comprehensive whole genome sequencing and phenotype data. This sort of dataset will allow us
to ask new questions, and better understand phenotype modifiers in particular, and genetic
variation in general.

105
Researchers will continue to utilize the genotype- and phenotype-first methodologies,
however one might not have to plan a study as such. As sequencing moves into the clinic, and
whole populations are sequenced, we will have access to a trove of genotype and phenotype data
for a variety affected and unaffected individuals. Since the data to answer questions will already
be present, there can be productive interplay between the phenotype- and genotype-first
approaches. Take, for example, autism spectrum disorder. One could look at the genetic data
from 100,000 individuals with ASD and their unaffected family members for recurrent variation.
Say researchers identify 300 genes and 100 regulatory regions that contain recurrent severe
variants. We could look again at variants in a particular gene identified in a population database,
and ask what phenotypes are associated. Is it always autism? What are the comorbidities? Is it
syndromic? This approach will not only elucidate the variants associated with particular
disorders but also the disorders associated with particular variants.
The comprehensive analysis of phenotype is crucial in two ways. First, we must have a
relatively small number of phenotype metrics that help explain the heterogeneity associated with
a particular disorder or variant (if such heterogeneity exists) and variables should be minimally
correlated with one another. Several examples of such scores have been proposed24,178. Second,
phenotype can guide ascertainment. In the most recent exome and targeted resequencing studies
of ASD individuals, those with recurrent variants such as in CHD8 and DYRK1A are more
similar to one another than the ASD population as a whole33,179. Instead of ascertaining on ASD,
ascertainment of ASD in addition to another phenotype may enrich for particular variants in
phenotypically heterogeneous populations. Such ascertainment would be facilitated by
comprehensive electronic medical records (EMR).

106
Large datasets are amenable to algorithmic discovery, but must be organized in such a way to
make this possible. Annotation of both genotype and phenotype is key in this process. For
variants, important annotation includes type (missense, loss of function, regulatory, etc.),
location, conservation, and more. For phenotype, biological system and severity are important. In
addition to these “first tier” annotations, stepping back a level, and looking at meta-annotations is
crucial. For example, genes are connected via protein-protein interaction networks and
classifying genes in this way may provide statistical power for variant discovery. Such
refinement is challenging, but has proven useful in autism171,180,181, and other neurocognitive
disorders182.
At present, loss of function variants provide the most power for associating particular genes
with a disorder. Other types of variation, such as missense and regulatory, are also important in
determining clinical outcome. Loss of function variants provide more statistical power because,
in most cases, loss of function variants remove a functional copy of a gene. However, not all
missense or non-coding variants may affect molecular function. Larger cohorts will enable the
identification of which missense and non-coding variants affect a gene, and functional
characterization can potentially help identify protein domains and regulatory regions.
At the same time, not all variation in a gene leads to the same phenotype, and different types
of variation in the same gene might be associated with distinct clinical sequelae. For example,
missense variants clustering in an 11-bp interval of the gene SETBP1 cause Schinzel-Giedeon
syndrome characterized by severe ID and specific craniofacial features183. However, loss of
function variants elsewhere in the gene and microdeletions show moderate non-syndromic ID
without the typical craniofacial features of Schinzel-Giedeon syndrome184. Finally, rare variation
107
has a higher likelihood of pathogenicity, but common variation can play a role, especially in the
presence of a known pathogenic variant.
Population based cohorts can refine our study of genetic modifiers in several ways. We will
use the 16p11.2 CNV discussed in this thesis as an example. Population-based cohorts will allow
unbiased ascertainment of genotype-first cohorts. One might argue that the VIP cohort discussed
in this thesis was not collected in a true genotype-first manner. To be included in the cohort each
individual was ascertained on the presence of a 16p11.2 CNV, but we only knew if a 16p11.2
CNV was present if the individual had already had some form of genotyping done. Clinical
genotyping requires a phenotype that is severe enough to necessitate a clinical microarray.
Ascertained individuals also had no large, likely pathogenic CNVs. Therefore, our 16p11.2
cohort represents a subset of the true population of 16p11.2 carriers.
Large population cohorts would allow ascertainment blinded to phenotype and permit
understanding of the true breadth of phenotypes associated with the 16p11.2 CNV and a
population-based Icelandic cohort of over 100,000 individuals provides a model moving
forward30. The researchers identified 26 neuropsychiatric CNVs based on the literature and
separate the cohort into groups: population controls, controls carrying a neuropsychiatric CNV,
controls carrying a non-neuropsychiatric CNV, and individuals with a diagnosis of
schizophrenia. The researchers assessed a subset of the cohort for neuropsychiatric metrics
including: the adult mathematical history questionnaire (ARHQ), the adult reading history
questionnaire (ARHQ), category fluency (CF), global assessment of functioning (GAF), letter
fluency (LF), logical memory I and II (LM I and II), perseverative errors (Pers. Errors),
performance IQ (P IQ), rapid visual information processing (RVIP), spatial working memory
(SWM), verbal IQ (V IQ). A main finding was that the cognitive impairment of controls carrying
108
a neuropsychiatric CNV fell between that of the individuals with schizophrenia and the other
controls (Figure 5.1). Furthermore, when restricting to individuals with the 16p11.2 CNV,
deletion carriers showed the greatest impairment in the same cognitive domains as the control
carriers, which was not the case for the duplication carriers. In particular, the deletion associated
with impaired verbal IQ and deficits in verbal letter and category fluency tests, whereas the
duplication impairs spatial working memory and executive functions. This study shows the
usefulness of a population cohort for exploring the variable expressivity of neuropsychiatric
CNVs and allows systematic searching for biochemical foundations of cognitive differences
between affected and unaffected carriers of a neurocognitive CNV.
Such an unbiased collection of neuropsychiatric CNV carriers points to ways in which the
16p11.2 VIP has ascertainment bias. First, all initially identified probands have a clinically
recognized phenotype. Second, non-carrier parents in the VIP tend to have a higher intelligence
quotient than the population average (Figure 2.3). One explanation is that individuals who find
out about the study via the internet or bring their child to a genetic clinic tend to have higher
intelligence. Third, some individuals with a 16p11.2 duplication tend to be severely affected.
Based on large CNV case-control studies, the deletion has a higher odds ratio than the
duplication, and these severe duplication cases are relatively unexpected50. If we ascertain a large
16p11.2 CNV cohort from the population the phenotypes and observed modifiers will likely be
more diverse than those we discovered in the VIP and provide deeper insight into the etiology of
the phenotypes associated with the 16p11.2 CNV.
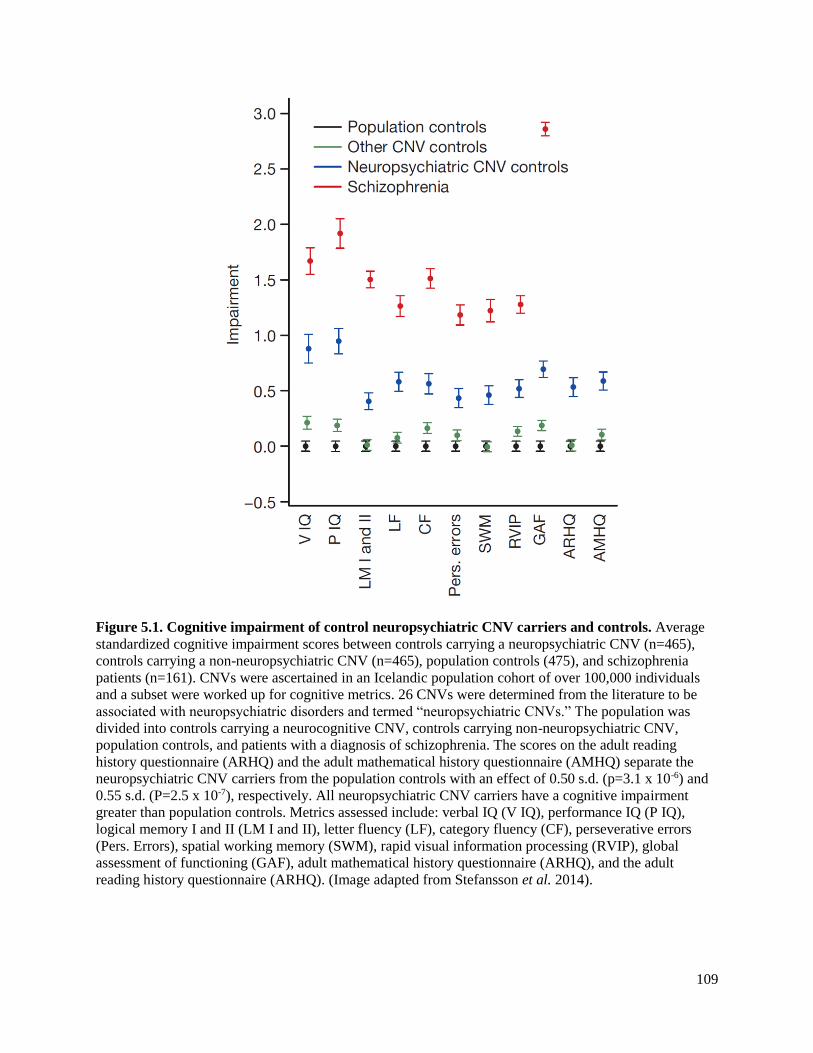
109
Figure 5.1. Cognitive impairment of control neuropsychiatric CNV carriers and controls. Average
standardized cognitive impairment scores between controls carrying a neuropsychiatric CNV (n=465),
controls carrying a non-neuropsychiatric CNV (n=465), population controls (475), and schizophrenia
patients (n=161). CNVs were ascertained in an Icelandic population cohort of over 100,000 individuals
and a subset were worked up for cognitive metrics. 26 CNVs were determined from the literature to be
associated with neuropsychiatric disorders and termed “neuropsychiatric CNVs.” The population was
divided into controls carrying a neurocognitive CNV, controls carrying non-neuropsychiatric CNV,
population controls, and patients with a diagnosis of schizophrenia. The scores on the adult reading
history questionnaire (ARHQ) and the adult mathematical history questionnaire (AMHQ) separate the
neuropsychiatric CNV carriers from the population controls with an effect of 0.50 s.d. (p=3.1 x 10⁻⁶) and
0.55 s.d. (P=2.5 x 10⁻⁷), respectively. All neuropsychiatric CNV carriers have a cognitive impairment
greater than population controls. Metrics assessed include: verbal IQ (V IQ), performance IQ (P IQ),
logical memory I and II (LM I and II), letter fluency (LF), category fluency (CF), perseverative errors
(Pers. Errors), spatial working memory (SWM), rapid visual information processing (RVIP), global
assessment of functioning (GAF), adult mathematical history questionnaire (ARHQ), and the adult
reading history questionnaire (ARHQ). (Image adapted from Stefansson et al. 2014).
110
The sequencing of large population cohorts and indeed whole countries is a real possibility
and is already being pursued in projects such as the UK10K, which will include exome and/or
whole genome sequencing for more than 6,000 individuals with particular disease phenotypes.
The proposition of sequencing populations is especially powerful in countries where all medical
information is present in a comprehensive database. The Icelandic study30 shows us that the
recurrence rate of the 16p11.2 deletion is 0.058 and duplication 0.067, meaning that with a
population size of 100,000, we should have a true “genotype-first” cohort of approximately 58
16p11.2 deletion and 67 16p11.2 duplication carriers, in addition to carriers of a wide variety of
other variants. Such large population cohorts allow the systematic study of the relationship
between genotype and phenotype. However, as genetic data become ubiquitous, the ethical
aspects of genetic data generation, analysis, and sharing must be considered.
Suppose we live in a world where hundreds of thousands of people have had whole genome
sequencing performed, and we have found strong correlations between particular genotypes and
phenotypes. Several ethical challenges arise. First, who owns the genetic data? If researchers
work out the genetics of certain forms of cancers with these data, enabling a new generation of
therapeutics, what reciprocation will the study participants receive? If there is a crime for which
DNA evidence is available, can the government or another entity screen a genetic database for a
match? Do genetic variants count as “pre-existing conditions” or something else that insurance
companies can use to modulate premiums? Second, what is the impact for clinical medicine and
primary care? If we understand which medications or interventions to prescribe based on
genotype, we can tailor therapies for the individual. Most variants have variable expressivity or
penetrance associated with them. In the primary care clinic, it is crucial that providers understand
and explain to patients the implication of these studies, in particular probabilities behind

111
genotype-phenotype associations. Just because a variant is present does not mean the patient has
a particular disease or disorder. Third, what will be the ramifications for reproductive medicine?
Will we allow parents to choose for or against certain traits? If so, which ones? How will this
affect the fitness of the population as a whole? While the genotype-phenotype connection will
not happen overnight, and will require a great deal of methods development and functional
annotation, the advent of personalized medicine and the understanding of molecular mechanism
of disease will improve health and well-being for human kind. Like any new technology, these
data can steer society towards benefaction and success or towards misery and failure; it is up to
us to decide the path to take.
112
References
1. Mendel, G. (1866). Versuche über Pflanzenhybriden. Verhandlungen Naturforschenden
Vereines Brunn 4 3 44,.
2. O’Roak, B.J., Vives, L., Fu, W., Egertson, J.D., Stanaway, I.B., Phelps, I.G., Carvill, G.,
Kumar, A., Lee, C., Ankenman, K., et al. (2012). Multiplex targeted sequencing identifies
recurrently mutated genes in autism spectrum disorders. Science 338, 1619–1622.
3. O’Roak, B.J., Vives, L., Girirajan, S., Karakoc, E., Krumm, N., Coe, B.P., Levy, R., Ko, A.,
Lee, C., Smith, J.D., et al. (2012). Sporadic autism exomes reveal a highly interconnected protein
network of de novo mutations. Nature 485, 246–250.
4. Sanders, S.J., Murtha, M.T., Gupta, A.R., Murdoch, J.D., Raubeson, M.J., Willsey, A.J.,
Ercan-Sencicek, A.G., DiLullo, N.M., Parikshak, N.N., Stein, J.L., et al. (2012). De novo
mutations revealed by whole-exome sequencing are strongly associated with autism. Nature 485,
237–241.
5. Neale, B.M., Kou, Y., Liu, L., Ma’ayan, A., Samocha, K.E., Sabo, A., Lin, C.-F., Stevens, C.,
Wang, L.-S., Makarov, V., et al. (2012). Patterns and rates of exonic de novo mutations in autism
spectrum disorders. Nature 485, 242–245.
6. Julien, P., Miñana, B., Baeza-Centurion, P., Valcárcel, J., and Lehner, B. (2016). The
complete local genotype-phenotype landscape for the alternative splicing of a human exon. Nat.
Commun. 7, 11558.
7. Simons Vip Consortium (2012). Simons Variation in Individuals Project (Simons VIP): a
genetics-first approach to studying autism spectrum and related neurodevelopmental disorders.
Neuron 73, 1063–1067.
8. Weiss, L.A., Shen, Y., Korn, J.M., Arking, D.E., Miller, D.T., Fossdal, R., Saemundsen, E.,
Stefansson, H., Ferreira, M.A.R., Green, T., et al. (2008). Association between microdeletion and
microduplication at 16p11.2 and autism. N. Engl. J. Med. 358, 667–675.
9. Kumar, R.A., KaraMohamed, S., Sudi, J., Conrad, D.F., Brune, C., Badner, J.A., Gilliam,
T.C., Nowak, N.J., Cook, E.H., Jr, Dobyns, W.B., et al. (2008). Recurrent 16p11.2
microdeletions in autism. Hum. Mol. Genet. 17, 628–638.
10. de Vries, B.B.A., Pfundt, R., Leisink, M., Koolen, D.A., Vissers, L.E.L.M., Janssen, I.M.,
Reijmersdal, S. van, Nillesen, W.M., Huys, E.H.L.P.G., Leeuw, N. de, et al. (2005). Diagnostic
genome profiling in mental retardation. Am. J. Hum. Genet. 77, 606–616.
11. Sharp, A.J., Hansen, S., Selzer, R.R., Cheng, Z., Regan, R., Hurst, J.A., Stewart, H., Price,
S.M., Blair, E., Hennekam, R.C., et al. (2006). Discovery of previously unidentified genomic
disorders from the duplication architecture of the human genome. Nat. Genet. 38, 1038–1042.

113
12. Sebat, J., Lakshmi, B., Malhotra, D., Troge, J., Lese-Martin, C., Walsh, T., Yamrom, B.,
Yoon, S., Krasnitz, A., Kendall, J., et al. (2007). Strong association of de novo copy number
mutations with autism. Science 316, 445–449.
13. Shinawi, M., Liu, P., Kang, S.-H.L., Shen, J., Belmont, J.W., Scott, D.A., Probst, F.J.,
Craigen, W.J., Graham, B.H., Pursley, A., et al. (2010). Recurrent reciprocal 16p11.2
rearrangements associated with global developmental delay, behavioural problems,
dysmorphism, epilepsy, and abnormal head size. J. Med. Genet. 47, 332–341.
14. Rosenfeld, J.A., Coppinger, J., Bejjani, B.A., Girirajan, S., Eichler, E.E., Shaffer, L.G., and
Ballif, B.C. (2010). Speech delays and behavioral problems are the predominant features in
individuals with developmental delays and 16p11.2 microdeletions and microduplications. J.
Neurodev. Disord. 2, 26–38.
15. Zufferey, F., Sherr, E.H., Beckmann, N.D., Hanson, E., Maillard, A.M., Hippolyte, L., Macé,
A., Ferrari, C., Kutalik, Z., Andrieux, J., et al. (2012). A 600 kb deletion syndrome at 16p11.2
leads to energy imbalance and neuropsychiatric disorders. J. Med. Genet. 49, 660–668.
16. Walters, R.G., Jacquemont, S., Valsesia, A., de Smith, A.J., Martinet, D., Andersson, J.,
Falchi, M., Chen, F., Andrieux, J., Lobbens, S., et al. (2010). A new highly penetrant form of
obesity due to deletions on chromosome 16p11.2. Nature 463, 671–675.
17. Girirajan, S., Rosenfeld, J.A., Cooper, G.M., Antonacci, F., Siswara, P., Itsara, A., Vives, L.,
Walsh, T., McCarthy, S.E., Baker, C., et al. (2010). A recurrent 16p12.1 microdeletion supports
a two-hit model for severe developmental delay. Nat. Genet. 42, 203–209.
18. McCarthy, S.E., Makarov, V., Kirov, G., Addington, A.M., McClellan, J., Yoon, S., Perkins,
D.O., Dickel, D.E., Kusenda, M., Krastoshevsky, O., et al. (2009). Microduplications of 16p11.2
are associated with schizophrenia. Nat. Genet. 41, 1223–1227.
19. Cooper, G.M., Coe, B.P., Girirajan, S., Rosenfeld, J.A., Vu, T.H., Baker, C., Williams, C.,
Stalker, H., Hamid, R., Hannig, V., et al. (2011). A copy number variation morbidity map of
developmental delay. Nat. Genet. 43, 838–846.
20. Kaminsky, E.B., Kaul, V., Paschall, J., Church, D.M., Bunke, B., Kunig, D., Moreno-De-
Luca, D., Moreno-De-Luca, A., Mulle, J.G., Warren, S.T., et al. (2011). An evidence-based
approach to establish the functional and clinical significance of copy number variants in
intellectual and developmental disabilities. Genet. Med. Off. J. Am. Coll. Med. Genet. 13, 777–
784.
21. Sanders, S.J., Ercan-Sencicek, A.G., Hus, V., Luo, R., Murtha, M.T., Moreno-De-Luca, D.,
Chu, S.H., Moreau, M.P., Gupta, A.R., Thomson, S.A., et al. (2011). Multiple recurrent de novo
CNVs, including duplications of the 7q11.23 Williams syndrome region, are strongly associated
with autism. Neuron 70, 863–885.
22. Chen, R., Shi, L., Hakenberg, J., Naughton, B., Sklar, P., Zhang, J., Zhou, H., Tian, L.,
Prakash, O., Lemire, M., et al. (2016). Analysis of 589,306 genomes identifies individuals
resilient to severe Mendelian childhood diseases. Nat. Biotechnol. 34, 531–538.

114
23. Girirajan, S., and Eichler, E.E. (2010). Phenotypic variability and genetic susceptibility to
genomic disorders. Hum. Mol. Genet. 19, R176-187.
24. Girirajan, S., Rosenfeld, J.A., Coe, B.P., Parikh, S., Friedman, N., Goldstein, A., Filipink,
R.A., McConnell, J.S., Angle, B., Meschino, W.S., et al. (2012). Phenotypic heterogeneity of
genomic disorders and rare copy-number variants. N. Engl. J. Med. 367, 1321–1331.
25. Bassuk, A.G., Geraghty, E., Wu, S., Mullen, S.A., Berkovic, S.F., Scheffer, I.E., and
Mefford, H.C. (2013). Deletions of 16p11.2 and 19p13.2 in a family with intellectual disability
and generalized epilepsy. Am. J. Med. Genet. A. 161A, 1722–1725.
26. Nadeau, J.H. (2001). Modifier genes in mice and humans. Nat. Rev. Genet. 2, 165–174.
27. Badano, J.L., and Katsanis, N. (2002). Beyond Mendel: an evolving view of human genetic
disease transmission. Nat. Rev. Genet. 3, 779–789.
28. Kajiwara, K., Berson, E.L., and Dryja, T.P. (1994). Digenic retinitis pigmentosa due to
mutations at the unlinked peripherin/RDS and ROM1 loci. Science 264, 1604–1608.
29. Hanson, E., Bernier, R., Porche, K., Jackson, F.I., Goin-Kochel, R.P., Snyder, L.G., Snow,
A.V., Wallace, A.S., Campe, K.L., Zhang, Y., et al. (2015). The cognitive and behavioral
phenotype of the 16p11.2 deletion in a clinically ascertained population. Biol. Psychiatry 77,
785–793.
30. Stefansson, H., Meyer-Lindenberg, A., Steinberg, S., Magnusdottir, B., Morgen, K.,
Arnarsdottir, S., Bjornsdottir, G., Walters, G.B., Jonsdottir, G.A., Doyle, O.M., et al. (2014).
CNVs conferring risk of autism or schizophrenia affect cognition in controls. Nature 505, 361–
366.
31. American Psychiatric Association, and American Psychiatric Association (2000). Diagnostic
and statistical manual of mental disorders: DSM-IV-TR (Washington, DC: American Psychiatric
Association).
32. Stessman, H.A., Bernier, R., and Eichler, E.E. (2014). A genotype-first approach to defining
the subtypes of a complex disease. Cell 156, 872–877.
33. Bernier, R., Golzio, C., Xiong, B., Stessman, H.A., Coe, B.P., Penn, O., Witherspoon, K.,
Gerdts, J., Baker, C., Vulto-van Silfhout, A.T., et al. (2014). Disruptive CHD8 mutations define
a subtype of autism early in development. Cell 158, 263–276.
34. Golzio, C., Willer, J., Talkowski, M.E., Oh, E.C., Taniguchi, Y., Jacquemont, S., Reymond,
A., Sun, M., Sawa, A., Gusella, J.F., et al. (2012). KCTD13 is a major driver of mirrored
neuroanatomical phenotypes of the 16p11.2 copy number variant. Nature 485, 363–367.
35. Blaker-Lee, A., Gupta, S., McCammon, J.M., De Rienzo, G., and Sive, H. (2012). Zebrafish
homologs of genes within 16p11.2, a genomic region associated with brain disorders, are active
during brain development, and include two deletion dosage sensor genes. Dis. Model. Mech. 5,
834–851.

115
36. Horev, G., Ellegood, J., Lerch, J.P., Son, Y.-E.E., Muthuswamy, L., Vogel, H., Krieger,
A.M., Buja, A., Henkelman, R.M., Wigler, M., et al. (2011). Dosage-dependent phenotypes in
models of 16p11.2 lesions found in autism. Proc. Natl. Acad. Sci. U. S. A. 108, 17076–17081.
37. Wu, N., Ming, X., Xiao, J., Wu, Z., Chen, X., Shinawi, M., Shen, Y., Yu, G., Liu, J., Xie, H.,
et al. (2015). TBX6 null variants and a common hypomorphic allele in congenital scoliosis. N.
Engl. J. Med. 372, 341–350.
38. Xander Nuttle, and Giuliana Gianuzzi Emergence of a Homo sapiens-specific gene family
and the evolution of autism risk at chromosome 16p11.2. Submitted.
39. Zhang, F., Gu, W., Hurles, M.E., and Lupski, J.R. (2009). Copy number variation in human
health, disease, and evolution. Annu. Rev. Genomics Hum. Genet. 10, 451–481.
40. Fischbach, G.D., and Lord, C. (2010). The Simons Simplex Collection: a resource for
identification of autism genetic risk factors. Neuron 68, 192–195.
41. Weiss, L.A., Shen, Y., Korn, J.M., Arking, D.E., Miller, D.T., Fossdal, R., Saemundsen, E.,
Stefansson, H., Ferreira, M.A.R., Green, T., et al. (2008). Association between microdeletion and
microduplication at 16p11.2 and autism. N. Engl. J. Med. 358, 667–675.
42. Moreno-De-Luca, A., Evans, D.W., Boomer, K.B., Hanson, E., Bernier, R., Goin-Kochel,
R.P., Myers, S.M., Challman, T.D., Moreno-De-Luca, D., Slane, M.M., et al. (2015). The role of
parental cognitive, behavioral, and motor profiles in clinical variability in individuals with
chromosome 16p11.2 deletions. JAMA Psychiatry 72, 119–126.
43. Maillard, A.M., Ruef, A., Pizzagalli, F., Migliavacca, E., Hippolyte, L., Adaszewski, S.,
Dukart, J., Ferrari, C., Conus, P., Männik, K., et al. (2015). The 16p11.2 locus modulates brain
structures common to autism, schizophrenia and obesity. Mol. Psychiatry 20, 140–147.
44. Hanson, E., Bernier, R., Porche, K., Jackson, F.I., Goin-Kochel, R.P., Snyder, L.G., Snow,
A.V., Wallace, A.S., Campe, K.L., Zhang, Y., et al. (2014). The Cognitive and Behavioral
Phenotype of the 16p11.2 Deletion in a Clinically Ascertained Population. Biol. Psychiatry.
45. Qureshi, A.Y., Mueller, S., Snyder, A.Z., Mukherjee, P., Berman, J.I., Roberts, T.P.L.,
Nagarajan, S.S., Spiro, J.E., Chung, W.K., Sherr, E.H., et al. (2014). Opposing brain differences
in 16p11.2 deletion and duplication carriers. J. Neurosci. Off. J. Soc. Neurosci. 34, 11199–
11211.
46. Steinberg, S., de Jong, S., Mattheisen, M., Costas, J., Demontis, D., Jamain, S., Pietiläinen,
O.P.H., Lin, K., Papiol, S., Huttenlocher, J., et al. (2014). Common variant at 16p11.2 conferring
risk of psychosis. Mol. Psychiatry 19, 108–114.
47. Reinthaler, E.M., Lal, D., Lebon, S., Hildebrand, M.S., Dahl, H.-H.M., Regan, B.M., Feucht,
M., Steinböck, H., Neophytou, B., Ronen, G.M., et al. (2014). 16p11.2 600 kb Duplications
confer risk for typical and atypical Rolandic epilepsy. Hum. Mol. Genet. 23, 6069–6080.
116
48. Jacquemont, S., Reymond, A., Zufferey, F., Harewood, L., Walters, R.G., Kutalik, Z.,
Martinet, D., Shen, Y., Valsesia, A., Beckmann, N.D., et al. (2011). Mirror extreme BMI
phenotypes associated with gene dosage at the chromosome 16p11.2 locus. Nature 478, 97–102.
49. Cooper, G.M., Coe, B.P., Girirajan, S., Rosenfeld, J.A., Vu, T.H., Baker, C., Williams, C.,
Stalker, H., Hamid, R., Hannig, V., et al. (2011). A copy number variation morbidity map of
developmental delay. Nat. Genet. 43, 838–846.
50. Coe, B.P., Witherspoon, K., Rosenfeld, J.A., van Bon, B.W.M., Vulto-van Silfhout, A.T.,
Bosco, P., Friend, K.L., Baker, C., Buono, S., Vissers, L.E.L.M., et al. (2014). Refining analyses
of copy number variation identifies specific genes associated with developmental delay. Nat.
Genet. 46, 1063–1071.
51. Simons Vip Consortium (2012). Simons Variation in Individuals Project (Simons VIP): a
genetics-first approach to studying autism spectrum and related neurodevelopmental disorders.
Neuron 73, 1063–1067.
52. Mullen, E. (1995). Mullen Scales of Early Learning, AGS Edition.
53. Eliot, C. (2007). Differential Abilities Scale, 2nd ed.
54. Wechsler, D. (1999). Wechsler Abbreviated Scale of Intelligence.
55. Sudmant, P.H., Mallick, S., Nelson, B.J., Hormozdiari, F., Krumm, N., Huddleston, J., Coe,
B.P., Baker, C., Nordenfelt, S., Bamshad, M., et al. (2015). Global diversity, population
stratification, and selection of human copy-number variation. Science 349, aab3761.
56. Manichaikul, A., Mychaleckyj, J.C., Rich, S.S., Daly, K., Sale, M., and Chen, W.-M. (2010).
Robust relationship inference in genome-wide association studies. Bioinforma. Oxf. Engl. 26,
2867–2873.
57. Girirajan, S., Brkanac, Z., Coe, B.P., Baker, C., Vives, L., Vu, T.H., Shafer, N., Bernier, R.,
Ferrero, G.B., Silengo, M., et al. (2011). Relative burden of large CNVs on a range of
neurodevelopmental phenotypes. PLoS Genet. 7, e1002334.
58. Brys, G., Hubert, M., and Struyf, A. (2004). A Robust Measure of Skewness. J. Comput.
Graph. Stat. 13, 996–1017.
59. Sanders, S.J., He, X., Willsey, A.J., Ercan-Sencicek, A.G., Samocha, K.E., Cicek, A.E.,
Murtha, M.T., Bal, V.H., Bishop, S.L., Dong, S., et al. (2015). Insights into Autism Spectrum
Disorder Genomic Architecture and Biology from 71 Risk Loci. Neuron 87, 1215–1233.
60. 1000 Genomes Project Consortium, Abecasis, G.R., Auton, A., Brooks, L.D., DePristo,
M.A., Durbin, R.M., Handsaker, R.E., Kang, H.M., Marth, G.T., and McVean, G.A. (2012). An
integrated map of genetic variation from 1,092 human genomes. Nature 491, 56–65.
61. Kong, A., Thorleifsson, G., Gudbjartsson, D.F., Masson, G., Sigurdsson, A., Jonasdottir, A.,
Walters, G.B., Jonasdottir, A., Gylfason, A., Kristinsson, K.T., et al. (2010). Fine-scale

117
recombination rate differences between sexes, populations and individuals. Nature 467, 1099–
1103.
62. Xu, D., Shen, W., Guo, R., Xue, Y., Peng, W., Sima, J., Yang, J., Sharov, A., Srikantan, S.,
Yang, J., et al. (2013). Top3β is an RNA topoisomerase that works with fragile X syndrome
protein to promote synapse formation. Nat. Neurosci. 16, 1238–1247.
63. Stoll, G., Pietiläinen, O.P.H., Linder, B., Suvisaari, J., Brosi, C., Hennah, W., Leppä, V.,
Torniainen, M., Ripatti, S., Ala-Mello, S., et al. (2013). Deletion of TOP3β, a component of
FMRP-containing mRNPs, contributes to neurodevelopmental disorders. Nat. Neurosci. 16,
1228–1237.
64. Hao, Y., Sekine, K., Kawabata, A., Nakamura, H., Ishioka, T., Ohata, H., Katayama, R.,
Hashimoto, C., Zhang, X., Noda, T., et al. (2004). Apollon ubiquitinates SMAC and caspase-9,
and has an essential cytoprotection function. Nat. Cell Biol. 6, 849–860.
65. Iossifov, I., O’Roak, B.J., Sanders, S.J., Ronemus, M., Krumm, N., Levy, D., Stessman,
H.A., Witherspoon, K.T., Vives, L., Patterson, K.E., et al. (2014). The contribution of de novo
coding mutations to autism spectrum disorder. Nature 515, 216–221.
66. De Rubeis, S., He, X., Goldberg, A.P., Poultney, C.S., Samocha, K., Cicek, A.E., Kou, Y.,
Liu, L., Fromer, M., Walker, S., et al. (2014). Synaptic, transcriptional and chromatin genes
disrupted in autism. Nature 515, 209–215.
67. Wang, K., Zhang, H., Ma, D., Bucan, M., Glessner, J.T., Abrahams, B.S., Salyakina, D.,
Imielinski, M., Bradfield, J.P., Sleiman, P.M.A., et al. (2009). Common genetic variants on
5p14.1 associate with autism spectrum disorders. Nature 459, 528–533.
68. Miyashita, A., Arai, H., Asada, T., Imagawa, M., Matsubara, E., Shoji, M., Higuchi, S.,
Urakami, K., Kakita, A., Takahashi, H., et al. (2007). Genetic association of CTNNA3 with late-
onset Alzheimer’s disease in females. Hum. Mol. Genet. 16, 2854–2869.
69. Hehir-Kwa, J.Y., Rodríguez-Santiago, B., Vissers, L.E., de Leeuw, N., Pfundt, R., Buitelaar,
J.K., Pérez-Jurado, L.A., and Veltman, J.A. (2011). De novo copy number variants associated
with intellectual disability have a paternal origin and age bias. J. Med. Genet. 48, 776–778.
70. Kong, A., Steinthorsdottir, V., Masson, G., Thorleifsson, G., Sulem, P., Besenbacher, S.,
Jonasdottir, A., Sigurdsson, A., Kristinsson, K.T., Jonasdottir, A., et al. (2009). Parental origin of
sequence variants associated with complex diseases. Nature 462, 868–874.
71. Delio, M., Guo, T., McDonald-McGinn, D.M., Zackai, E., Herman, S., Kaminetzky, M.,
Higgins, A.M., Coleman, K., Chow, C., Jalbrzikowski, M., et al. (2013). Enhanced maternal
origin of the 22q11.2 deletion in velocardiofacial and DiGeorge syndromes. Am. J. Hum. Genet.
92, 439–447.
72. López-Correa, C., Dorschner, M., Brems, H., Lázaro, C., Clementi, M., Upadhyaya, M.,
Dooijes, D., Moog, U., Kehrer-Sawatzki, H., Rutkowski, J.L., et al. (2001). Recombination
hotspot in NF1 microdeletion patients. Hum. Mol. Genet. 10, 1387–1392.

118
73. Baran, Y., Subramaniam, M., Biton, A., Tukiainen, T., Tsang, E.K., Rivas, M.A., Pirinen,
M., Gutierrez-Arcelus, M., Smith, K.S., Kukurba, K.R., et al. (2015). The landscape of genomic
imprinting across diverse adult human tissues. Genome Res. 25, 927–936.
74. Luedi, P.P., Dietrich, F.S., Weidman, J.R., Bosko, J.M., Jirtle, R.L., and Hartemink, A.J.
(2007). Computational and experimental identification of novel human imprinted genes. Genome
Res. 17, 1723–1730.
75. Wang, J., Fan, H.C., Behr, B., and Quake, S.R. (2012). Genome-wide single-cell analysis of
recombination activity and de novo mutation rates in human sperm. Cell 150, 402–412.
76. Krumm, N., Turner, T.N., Baker, C., Vives, L., Mohajeri, K., Witherspoon, K., Raja, A.,
Coe, B.P., Stessman, H.A., He, Z.-X., et al. (2015). Excess of rare, inherited truncating mutations
in autism. Nat. Genet. 47, 582–588.
77. Jacquemont, S., Coe, B.P., Hersch, M., Duyzend, M.H., Krumm, N., Bergmann, S.,
Beckmann, J.S., Rosenfeld, J.A., and Eichler, E.E. (2014). A higher mutational burden in
females supports a “female protective model” in neurodevelopmental disorders. Am. J. Hum.
Genet. 94, 415–425.
78. Männik, K., Mägi, R., Macé, A., Cole, B., Guyatt, A.L., Shihab, H.A., Maillard, A.M.,
Alavere, H., Kolk, A., Reigo, A., et al. (2015). Copy number variations and cognitive phenotypes
in unselected populations. JAMA 313, 2044–2054.
79. Iossifov, I., Ronemus, M., Levy, D., Wang, Z., Hakker, I., Rosenbaum, J., Yamrom, B., Lee,
Y.-H., Narzisi, G., Leotta, A., et al. (2012). De novo gene disruptions in children on the autistic
spectrum. Neuron 74, 285–299.
80. Dajani, R., Hood, A.M., and Coughtrie, M.W. (1998). A single amino acid, glu146, governs
the substrate specificity of a human dopamine sulfotransferase, SULT1A3. Mol. Pharmacol. 54,
942–948.
81. Dennis, M.Y., Nuttle, X., Sudmant, P.H., Antonacci, F., Graves, T.A., Nefedov, M.,
Rosenfeld, J.A., Sajjadian, S., Malig, M., Kotkiewicz, H., et al. (2012). Evolution of human-
specific neural SRGAP2 genes by incomplete segmental duplication. Cell 149, 912–922.
82. Zhang, J., Kobert, K., Flouri, T., and Stamatakis, A. (2014). PEAR: a fast and accurate
Illumina Paired-End reAd mergeR. Bioinforma. Oxf. Engl. 30, 614–620.
83. Li, H., and Durbin, R. (2010). Fast and accurate long-read alignment with Burrows-Wheeler
transform. Bioinforma. Oxf. Engl. 26, 589–595.
84. Alamut Software.
85. Kircher, M., Witten, D.M., Jain, P., O’Roak, B.J., Cooper, G.M., and Shendure, J. (2014). A
general framework for estimating the relative pathogenicity of human genetic variants. Nat.
Genet. 46, 310–315.

119
86. Boyle, E.A., O’Roak, B.J., Martin, B.K., Kumar, A., and Shendure, J. (2014). MIPgen:
optimized modeling and design of molecular inversion probes for targeted resequencing.
Bioinforma. Oxf. Engl. 30, 2670–2672.
87. Garrison, E. VCFlib.
88. Nuttle, X., Huddleston, J., O’Roak, B.J., Antonacci, F., Fichera, M., Romano, C., Shendure,
J., and Eichler, E.E. (2013). Rapid and accurate large-scale genotyping of duplicated genes and
discovery of interlocus gene conversions. Nat. Methods 10, 903–909.
89. Danecek, P., Auton, A., Abecasis, G., Albers, C.A., Banks, E., DePristo, M.A., Handsaker,
R.E., Lunter, G., Marth, G.T., Sherry, S.T., et al. (2011). The variant call format and VCFtools.
Bioinforma. Oxf. Engl. 27, 2156–2158.
90. Petrovski, S., Wang, Q., Heinzen, E.L., Allen, A.S., and Goldstein, D.B. (2013). Genic
intolerance to functional variation and the interpretation of personal genomes. PLoS Genet. 9,
e1003709.
91. Duyzend, M.H., Nuttle, X., Coe, B.P., Baker, C., Nickerson, D.A., Bernier, R., and Eichler,
E.E. (2016). Maternal Modifiers and Parent-of-Origin Bias of the Autism-Associated 16p11.2
CNV. Am. J. Hum. Genet. 98, 45–57.
92. Christian, S.L., Brune, C.W., Sudi, J., Kumar, R.A., Liu, S., Karamohamed, S., Badner, J.A.,
Matsui, S., Conroy, J., McQuaid, D., et al. (2008). Novel submicroscopic chromosomal
abnormalities detected in autism spectrum disorder. Biol. Psychiatry 63, 1111–1117.
93. Pinto, D., Pagnamenta, A.T., Klei, L., Anney, R., Merico, D., Regan, R., Conroy, J.,
Magalhaes, T.R., Correia, C., Abrahams, B.S., et al. (2010). Functional impact of global rare
copy number variation in autism spectrum disorders. Nature 466, 368–372.
94. Girirajan, S., Dennis, M.Y., Baker, C., Malig, M., Coe, B.P., Campbell, C.D., Mark, K., Vu,
T.H., Alkan, C., Cheng, Z., et al. (2013). Refinement and discovery of new hotspots of copy-
number variation associated with autism spectrum disorder. Am. J. Hum. Genet. 92, 221–237.
95. Ikeda, M., Tomita, Y., Mouri, A., Koga, M., Okochi, T., Yoshimura, R., Yamanouchi, Y.,
Kinoshita, Y., Hashimoto, R., Williams, H.J., et al. (2010). Identification of novel candidate
genes for treatment response to risperidone and susceptibility for schizophrenia: integrated
analysis among pharmacogenomics, mouse expression, and genetic case-control association
approaches. Biol. Psychiatry 67, 263–269.
96. Low, D., and Chen, K.-S. (2010). Genome-wide gene expression profiling of the Angelman
syndrome mice with Ube3a mutation. Eur. J. Hum. Genet. EJHG 18, 1228–1235.
97. Savelieva, K.V., Rajan, I., Baker, K.B., Vogel, P., Jarman, W., Allen, M., and Lanthorn, T.H.
(2008). Learning and memory impairment in Eph receptor A6 knockout mice. Neurosci. Lett.
438, 205–209.
120
98. Glessner, J.T., Wang, K., Cai, G., Korvatska, O., Kim, C.E., Wood, S., Zhang, H., Estes, A.,
Brune, C.W., Bradfield, J.P., et al. (2009). Autism genome-wide copy number variation reveals
ubiquitin and neuronal genes. Nature 459, 569–573.
99. Vaags, A.K., Lionel, A.C., Sato, D., Goodenberger, M., Stein, Q.P., Curran, S., Ogilvie, C.,
Ahn, J.W., Drmic, I., Senman, L., et al. (2012). Rare deletions at the neurexin 3 locus in autism
spectrum disorder. Am. J. Hum. Genet. 90, 133–141.
100. Alazami, A.M., Patel, N., Shamseldin, H.E., Anazi, S., Al-Dosari, M.S., Alzahrani, F.,
Hijazi, H., Alshammari, M., Aldahmesh, M.A., Salih, M.A., et al. (2015). Accelerating novel
candidate gene discovery in neurogenetic disorders via whole-exome sequencing of prescreened
multiplex consanguineous families. Cell Rep. 10, 148–161.
101. Alvarez-Mora, M.I., Calvo Escalona, R., Puig Navarro, O., Madrigal, I., Quintela, I.,
Amigo, J., Martinez-Elurbe, D., Linder-Lucht, M., Aznar Lain, G., Carracedo, A., et al. (2016).
Comprehensive molecular testing in patients with high functioning autism spectrum disorder.
Mutat. Res. 784–785, 46–52.
102. Alazami, A.M., Alzahrani, F., Bohlega, S., and Alkuraya, F.S. (2014). SET binding factor 1
(SBF1) mutation causes Charcot-Marie-tooth disease type 4B3. Neurology 82, 1665–1666.
103. Nakhro, K., Park, J.-M., Hong, Y.B., Park, J.H., Nam, S.H., Yoon, B.R., Yoo, J.H., Koo,
H., Jung, S.-C., Kim, H.-L., et al. (2013). SET binding factor 1 (SBF1) mutation causes Charcot-
Marie-Tooth disease type 4B3. Neurology 81, 165–173.
104. Nava, C., Keren, B., Mignot, C., Rastetter, A., Chantot-Bastaraud, S., Faudet, A.,
Fonteneau, E., Amiet, C., Laurent, C., Jacquette, A., et al. (2014). Prospective diagnostic
analysis of copy number variants using SNP microarrays in individuals with autism spectrum
disorders. Eur. J. Hum. Genet. EJHG 22, 71–78.
105. Veilleux, R.E., Shen, L.Y., and Paz, M.M. (1995). Analysis of the genetic composition of
anther-derived potato by randomly amplified polymorphic DNA and simple sequence repeats.
Genome Natl. Res. Counc. Can. Génome Cons. Natl. Rech. Can. 38, 1153–1162.
106. Boyden, E.D., Campos-Xavier, A.B., Kalamajski, S., Cameron, T.L., Suarez, P.,
Tanackovic, G., Tanackovich, G., Andria, G., Ballhausen, D., Briggs, M.D., et al. (2011).
Recurrent dominant mutations affecting two adjacent residues in the motor domain of the
monomeric kinesin KIF22 result in skeletal dysplasia and joint laxity. Am. J. Hum. Genet. 89,
767–772.
107. Valente, P., Castroflorio, E., Rossi, P., Fadda, M., Sterlini, B., Cervigni, R.I., Prestigio, C.,
Giovedì, S., Onofri, F., Mura, E., et al. (2016). PRRT2 Is a Key Component of the Ca(2+)-
Dependent Neurotransmitter Release Machinery. Cell Rep. 15, 117–131.
108. Maini, I., Iodice, A., Spagnoli, C., Salerno, G.G., Bertani, G., Frattini, D., and Fusco, C.
(2016). Expanding phenotype of PRRT2 gene mutations: A new case with epilepsy and benign
myoclonus of early infancy. Eur. J. Paediatr. Neurol. EJPN Off. J. Eur. Paediatr. Neurol. Soc. 20,
454–456.

121
109. Ebrahimi-Fakhari, D., Saffari, A., Westenberger, A., and Klein, C. (2015). The evolving
spectrum of PRRT2-associated paroxysmal diseases. Brain J. Neurol. 138, 3476–3495.
110. Corominas, R., Yang, X., Lin, G.N., Kang, S., Shen, Y., Ghamsari, L., Broly, M.,
Rodriguez, M., Tam, S., Trigg, S.A., et al. (2014). Protein interaction network of alternatively
spliced isoforms from brain links genetic risk factors for autism. Nat. Commun. 5, 3650.
111. Navarro, L., Gil-Benso, R., Megías, J., Muñoz-Hidalgo, L., San-Miguel, T., Callaghan,
R.C., González-Darder, J.M., López-Ginés, C., and Cerdá-Nicolás, M.J. (2015). Alteration of
major vault protein in human glioblastoma and its relation with EGFR and PTEN status.
Neuroscience 297, 243–251.
112. Li, H., Mapolelo, D.T., Randeniya, S., Johnson, M.K., and Outten, C.E. (2012). Human
glutaredoxin 3 forms [2Fe-2S]-bridged complexes with human BolA2. Biochemistry (Mosc.) 51,
1687–1696.
113. Banci, L., Camponeschi, F., Ciofi-Baffoni, S., and Muzzioli, R. (2015). Elucidating the
Molecular Function of Human BOLA2 in GRX3-Dependent Anamorsin Maturation Pathway. J.
Am. Chem. Soc. 137, 16133–16143.
114. Nowick, K., Gernat, T., Almaas, E., and Stubbs, L. (2009). Differences in human and
chimpanzee gene expression patterns define an evolving network of transcription factors in
brain. Proc. Natl. Acad. Sci. U. S. A. 106, 22358–22363.
115. Fekairi, S., Scaglione, S., Chahwan, C., Taylor, E.R., Tissier, A., Coulon, S., Dong, M.-Q.,
Ruse, C., Yates, J.R., Russell, P., et al. (2009). Human SLX4 is a Holliday junction resolvase
subunit that binds multiple DNA repair/recombination endonucleases. Cell 138, 78–89.
116. Wyatt, H.D.M., Sarbajna, S., Matos, J., and West, S.C. (2013). Coordinated actions of
SLX1-SLX4 and MUS81-EME1 for Holliday junction resolution in human cells. Mol. Cell 52,
234–247.
117. Muñoz, I.M., Hain, K., Déclais, A.-C., Gardiner, M., Toh, G.W., Sanchez-Pulido, L.,
Heuckmann, J.M., Toth, R., Macartney, T., Eppink, B., et al. (2009). Coordination of structure-
specific nucleases by human SLX4/BTBD12 is required for DNA repair. Mol. Cell 35, 116–127.
118. Svendsen, J.M., Smogorzewska, A., Sowa, M.E., O’Connell, B.C., Gygi, S.P., Elledge, S.J.,
and Harper, J.W. (2009). Mammalian BTBD12/SLX4 assembles a Holliday junction resolvase
and is required for DNA repair. Cell 138, 63–77.
119. Fricke, W.M., and Brill, S.J. (2003). Slx1-Slx4 is a second structure-specific endonuclease
functionally redundant with Sgs1-Top3. Genes Dev. 17, 1768–1778.
120. Saito, T.T., Mohideen, F., Meyer, K., Harper, J.W., and Colaiácovo, M.P. (2012). SLX-1 is
required for maintaining genomic integrity and promoting meiotic noncrossovers in the
Caenorhabditis elegans germline. PLoS Genet. 8, e1002888.
122
121. Wan, B., Yin, J., Horvath, K., Sarkar, J., Chen, Y., Wu, J., Wan, K., Lu, J., Gu, P., Yu,
E.Y., et al. (2013). SLX4 assembles a telomere maintenance toolkit by bridging multiple
endonucleases with telomeres. Cell Rep. 4, 861–869.
122. Wilson, J.S.J., Tejera, A.M., Castor, D., Toth, R., Blasco, M.A., and Rouse, J. (2013).
Localization-dependent and -independent roles of SLX4 in regulating telomeres. Cell Rep. 4,
853–860.
123. Sarkar, J., Wan, B., Yin, J., Vallabhaneni, H., Horvath, K., Kulikowicz, T., Bohr, V.A.,
Zhang, Y., Lei, M., and Liu, Y. (2015). SLX4 contributes to telomere preservation and regulated
processing of telomeric joint molecule intermediates. Nucleic Acids Res. 43, 5912–5923.
124. Gaur, V., Wyatt, H.D.M., Komorowska, W., Szczepanowski, R.H., de Sanctis, D., Gorecka,
K.M., West, S.C., and Nowotny, M. (2015). Structural and Mechanistic Analysis of the Slx1-
Slx4 Endonuclease. Cell Rep.
125. Chauhan, A., and Chauhan, V. (2006). Oxidative stress in autism. Pathophysiol. Off. J. Int.
Soc. Pathophysiol. ISP 13, 171–181.
126. Hildebrandt, M.A.T., Salavaggione, O.E., Martin, Y.N., Flynn, H.C., Jalal, S., Wieben,
E.D., and Weinshilboum, R.M. (2004). Human SULT1A3 pharmacogenetics: gene duplication
and functional genomic studies. Biochem. Biophys. Res. Commun. 321, 870–878.
127. Aksoy, I.A., and Weinshilboum, R.M. (1995). Human thermolabile phenol sulfotransferase
gene (STM): molecular cloning and structural characterization. Biochem. Biophys. Res.
Commun. 208, 786–795.
128. Brix, L.A., Barnett, A.C., Duggleby, R.G., Leggett, B., and McManus, M.E. (1999).
Analysis of the substrate specificity of human sulfotransferases SULT1A1 and SULT1A3: site-
directed mutagenesis and kinetic studies. Biochemistry (Mosc.) 38, 10474–10479.
129. Allali-Hassani, A., Pan, P.W., Dombrovski, L., Najmanovich, R., Tempel, W., Dong, A.,
Loppnau, P., Martin, F., Thornton, J., Thonton, J., et al. (2007). Structural and chemical profiling
of the human cytosolic sulfotransferases. PLoS Biol. 5, e97.
130. Lu, J.-H., Li, H.-T., Liu, M.-C., Zhang, J.-P., Li, M., An, X.-M., and Chang, W.-R. (2005).
Crystal structure of human sulfotransferase SULT1A3 in complex with dopamine and 3’-
phosphoadenosine 5’-phosphate. Biochem. Biophys. Res. Commun. 335, 417–423.
131. Goldstein, D.S., Swoboda, K.J., Miles, J.M., Coppack, S.W., Aneman, A., Holmes, C.,
Lamensdorf, I., and Eisenhofer, G. (1999). Sources and physiological significance of plasma
dopamine sulfate. J. Clin. Endocrinol. Metab. 84, 2523–2531.
132. Salman, E.D., Kadlubar, S.A., and Falany, C.N. (2009). Expression and localization of
cytosolic sulfotransferase (SULT) 1A1 and SULT1A3 in normal human brain. Drug Metab.
Dispos. Biol. Fate Chem. 37, 706–709.

123
133. Sidharthan, N.P., Minchin, R.F., and Butcher, N.J. (2013). Cytosolic sulfotransferase 1A3 is
induced by dopamine and protects neuronal cells from dopamine toxicity: role of D1 receptor-N-
methyl-D-aspartate receptor coupling. J. Biol. Chem. 288, 34364–34374.
134. Riches, Z., Stanley, E.L., Bloomer, J.C., and Coughtrie, M.W.H. (2009). Quantitative
evaluation of the expression and activity of five major sulfotransferases (SULTs) in human
tissues: the SULT “pie.” Drug Metab. Dispos. Biol. Fate Chem. 37, 2255–2261.
135. Dajani, R., Cleasby, A., Neu, M., Wonacott, A.J., Jhoti, H., Hood, A.M., Modi, S., Hersey,
A., Taskinen, J., Cooke, R.M., et al. (1999). X-ray crystal structure of human dopamine
sulfotransferase, SULT1A3. Molecular modeling and quantitative structure-activity relationship
analysis demonstrate a molecular basis for sulfotransferase substrate specificity. J. Biol. Chem.
274, 37862–37868.
136. Gamage, N., Barnett, A., Hempel, N., Duggleby, R.G., Windmill, K.F., Martin, J.L., and
McManus, M.E. (2006). Human sulfotransferases and their role in chemical metabolism.
Toxicol. Sci. Off. J. Soc. Toxicol. 90, 5–22.
137. Christensen, D.L., Baio, J., Braun, K.V.N., Bilder, D., Charles, J., Constantino, J.N.,
Daniels, J., Durkin, M.S., Fitzgerald, R.T., Kurzius-Spencer, M., et al. (2016). Prevalence and
Characteristics of Autism Spectrum Disorder Among Children Aged 8 Years — Autism and
Developmental Disabilities Monitoring Network, 11 Sites, United States, 2012. MMWR
Surveill. Summ. 65, 1–23.
138. American Psychiatric Association (2013). Diagnostic and statistical manual of mental
disorders: DSM-5 (Washington, D.C: American Psychiatric Association).
139. Werling, D.M., and Geschwind, D.H. (2015). Recurrence rates provide evidence for sex-
differential, familial genetic liability for autism spectrum disorders in multiplex families and
twins. Mol. Autism 6, 27.
140. Hallmayer, J., Cleveland, S., Torres, A., Phillips, J., Cohen, B., Torigoe, T., Miller, J.,
Fedele, A., Collins, J., Smith, K., et al. (2011). Genetic heritability and shared environmental
factors among twin pairs with autism. Arch. Gen. Psychiatry 68, 1095–1102.
141. O’Roak, B.J., Vives, L., Fu, W., Egertson, J.D., Stanaway, I.B., Phelps, I.G., Carvill, G.,
Kumar, A., Lee, C., Ankenman, K., et al. (2012). Multiplex targeted sequencing identifies
recurrently mutated genes in autism spectrum disorders. Science 338, 1619–1622.
142. O’Roak, B.J., Deriziotis, P., Lee, C., Vives, L., Schwartz, J.J., Girirajan, S., Karakoc, E.,
Mackenzie, A.P., Ng, S.B., Baker, C., et al. (2011). Exome sequencing in sporadic autism
spectrum disorders identifies severe de novo mutations. Nat. Genet. 43, 585–589.
143. O’Roak, B.J., Vives, L., Girirajan, S., Karakoc, E., Krumm, N., Coe, B.P., Levy, R., Ko, A.,
Lee, C., Smith, J.D., et al. (2012). Sporadic autism exomes reveal a highly interconnected protein
network of de novo mutations. Nature 485, 246–250.
124
144. Hoischen, A., Krumm, N., and Eichler, E.E. (2014). Prioritization of neurodevelopmental
disease genes by discovery of new mutations. Nat. Neurosci. 17, 764–772.
145. Robinson, E.B., St Pourcain, B., Anttila, V., Kosmicki, J.A., Bulik-Sullivan, B., Grove, J.,
Maller, J., Samocha, K.E., Sanders, S.J., Ripke, S., et al. (2016). Genetic risk for autism
spectrum disorders and neuropsychiatric variation in the general population. Nat. Genet.
146. Risi, S., Lord, C., Gotham, K., Corsello, C., Chrysler, C., Szatmari, P., Cook, E.H.,
Leventhal, B.L., and Pickles, A. (2006). Combining information from multiple sources in the
diagnosis of autism spectrum disorders. J. Am. Acad. Child Adolesc. Psychiatry 45, 1094–1103.
147. Krumm, N., Sudmant, P.H., Ko, A., O’Roak, B.J., Malig, M., Coe, B.P., NHLBI Exome
Sequencing Project, Quinlan, A.R., Nickerson, D.A., and Eichler, E.E. (2012). Copy number
variation detection and genotyping from exome sequence data. Genome Res. 22, 1525–1532.
148. Krumm, N., Turner, T.N., Baker, C., Vives, L., Mohajeri, K., Witherspoon, K., Raja, A.,
Coe, B.P., Stessman, H.A., He, Z.-X., et al. (2015). Excess of rare, inherited truncating mutations
in autism. Nat. Genet. 47, 582–588.
149. Mi, H., Muruganujan, A., Casagrande, J.T., and Thomas, P.D. (2013). Large-scale gene
function analysis with the PANTHER classification system. Nat. Protoc. 8, 1551–1566.
150. Szklarczyk, D., Franceschini, A., Wyder, S., Forslund, K., Heller, D., Huerta-Cepas, J.,
Simonovic, M., Roth, A., Santos, A., Tsafou, K.P., et al. (2015). STRING v10: protein-protein
interaction networks, integrated over the tree of life. Nucleic Acids Res. 43, D447-452.
151. Kheradmand Kia, S., Verbeek, E., Engelen, E., Schot, R., Poot, R.A., de Coo, I.F.M.,
Lequin, M.H., Poulton, C.J., Pourfarzad, F., Grosveld, F.G., et al. (2012). RTTN mutations link
primary cilia function to organization of the human cerebral cortex. Am. J. Hum. Genet. 91,
533–540.
152. Shamseldin, H., Alazami, A.M., Manning, M., Hashem, A., Caluseiu, O., Tabarki, B.,
Esplin, E., Schelley, S., Innes, A.M., Parboosingh, J.S., et al. (2015). RTTN Mutations Cause
Primary Microcephaly and Primordial Dwarfism in Humans. Am. J. Hum. Genet. 97, 862–868.
153. Christopherson, K.S., Ullian, E.M., Stokes, C.C.A., Mullowney, C.E., Hell, J.W., Agah, A.,
Lawler, J., Mosher, D.F., Bornstein, P., and Barres, B.A. (2005). Thrombospondins are
astrocyte-secreted proteins that promote CNS synaptogenesis. Cell 120, 421–433.
154. Lu, L., Guo, H., Peng, Y., Xun, G., Liu, Y., Xiong, Z., Tian, D., Liu, Y., Li, W., Xu, X., et
al. (2014). Common and rare variants of the THBS1 gene associated with the risk for autism.
Psychiatr. Genet. 24, 235–240.
155. Smith, T.S., Southan, C., Ellington, K., Campbell, D., Tew, D.G., and Debouck, C. (2001).
Identification, genomic organization, and mRNA expression of LACTB, encoding a serine beta-
lactamase-like protein with an amino-terminal transmembrane domain. Genomics 78, 12–14.

125
156. Khan, M.A., Rafiq, M.A., Noor, A., Hussain, S., Flores, J.V., Rupp, V., Vincent, A.K.,
Malli, R., Ali, G., Khan, F.S., et al. (2012). Mutation in NSUN2, which encodes an RNA
methyltransferase, causes autosomal-recessive intellectual disability. Am. J. Hum. Genet. 90,
856–863.
157. Martinez, F.J., Lee, J.H., Lee, J.E., Blanco, S., Nickerson, E., Gabriel, S., Frye, M., Al-
Gazali, L., and Gleeson, J.G. (2012). Whole exome sequencing identifies a splicing mutation in
NSUN2 as a cause of a Dubowitz-like syndrome. J. Med. Genet. 49, 380–385.
158. Clark, A.W., Mauro, A., Longenecker, H.E., and Hurlbut, W.P. (1970). Effects of black
widow spider venom on the frog neuromuscular junction. Effects on the fine structure of the frog
neuromuscular junction. Nature 225, 703–705.
159. Longenecker, H.E., Hurlbut, W.P., Mauro, A., and Clark, A.W. (1970). Effects of black
widow spider venom on the frog neuromuscular junction. Effects on end-plate potential,
miniature end-plate potential and nerve terminal spike. Nature 225, 701–703.
160. Silva, J.-P., and Ushkaryov, Y.A. (2010). The latrophilins, “split-personality” receptors.
Adv. Exp. Med. Biol. 706, 59–75.
161. Bishop, D.F., Henderson, A.S., and Astrin, K.H. (1990). Human delta-aminolevulinate
synthase: assignment of the housekeeping gene to 3p21 and the erythroid-specific gene to the X
chromosome. Genomics 7, 207–214.
162. Stessman, H.A.F., Willemsen, M.H., Fenckova, M., Penn, O., Hoischen, A., Xiong, B.,
Wang, T., Hoekzema, K., Vives, L., Vogel, I., et al. (2016). Disruption of POGZ Is Associated
with Intellectual Disability and Autism Spectrum Disorders. Am. J. Hum. Genet. 98, 541–552.
163. White, J., Beck, C.R., Harel, T., Posey, J.E., Jhangiani, S.N., Tang, S., Farwell, K.D.,
Powis, Z., Mendelsohn, N.J., Baker, J.A., et al. (2016). POGZ truncating alleles cause syndromic
intellectual disability. Genome Med. 8, 3.
164. Petersen, P.H., Zou, K., Hwang, J.K., Jan, Y.N., and Zhong, W. (2002). Progenitor cell
maintenance requires numb and numblike during mouse neurogenesis. Nature 419, 929–934.
165. Li, H.S., Wang, D., Shen, Q., Schonemann, M.D., Gorski, J.A., Jones, K.R., Temple, S.,
Jan, L.Y., and Jan, Y.N. (2003). Inactivation of Numb and Numblike in embryonic dorsal
forebrain impairs neurogenesis and disrupts cortical morphogenesis. Neuron 40, 1105–1118.
166. Petersen, P.H., Zou, K., Krauss, S., and Zhong, W. (2004). Continuing role for mouse
Numb and Numbl in maintaining progenitor cells during cortical neurogenesis. Nat. Neurosci. 7,
803–811.
167. Pettem, K.L., Yokomaku, D., Luo, L., Linhoff, M.W., Prasad, T., Connor, S.A., Siddiqui,
T.J., Kawabe, H., Chen, F., Zhang, L., et al. (2013). The specific α-neurexin interactor
calsyntenin-3 promotes excitatory and inhibitory synapse development. Neuron 80, 113–128.
126
168. Anitha, A., Nakamura, K., Thanseem, I., Yamada, K., Iwayama, Y., Toyota, T., Matsuzaki,
H., Miyachi, T., Yamada, S., Tsujii, M., et al. (2012). Brain region-specific altered expression
and association of mitochondria-related genes in autism. Mol. Autism 3, 12.
169. Pitts, K.R., McNiven, M.A., and Yoon, Y. (2004). Mitochondria-specific function of the
dynamin family protein DLP1 is mediated by its C-terminal domains. J. Biol. Chem. 279,
50286–50294.
170. Laffin, J.J.S., Raca, G., Jackson, C.A., Strand, E.A., Jakielski, K.J., and Shriberg, L.D.
(2012). Novel candidate genes and regions for childhood apraxia of speech identified by array
comparative genomic hybridization. Genet. Med. Off. J. Am. Coll. Med. Genet. 14, 928–936.
171. Hormozdiari, F., Penn, O., Borenstein, E., and Eichler, E.E. (2015). The discovery of
integrated gene networks for autism and related disorders. Genome Res. 25, 142–154.
172. De Rubeis, S., and Bagni, C. (2011). Regulation of molecular pathways in the Fragile X
Syndrome: insights into Autism Spectrum Disorders. J. Neurodev. Disord. 3, 257–269.
173. Richter, J.D., Bassell, G.J., and Klann, E. (2015). Dysregulation and restoration of
translational homeostasis in fragile X syndrome. Nat. Rev. Neurosci. 16, 595–605.
174. Dillon, C., and Goda, Y. (2005). The actin cytoskeleton: integrating form and function at
the synapse. Annu. Rev. Neurosci. 28, 25–55.
175. Fischer, M., Kaech, S., Knutti, D., and Matus, A. (1998). Rapid actin-based plasticity in
dendritic spines. Neuron 20, 847–854.
176. Duffney, L.J., Zhong, P., Wei, J., Matas, E., Cheng, J., Qin, L., Ma, K., Dietz, D.M.,
Kajiwara, Y., Buxbaum, J.D., et al. (2015). Autism-like Deficits in Shank3-Deficient Mice Are
Rescued by Targeting Actin Regulators. Cell Rep. 11, 1400–1413.
177. Turner, T.N., Hormozdiari, F., Duyzend, M.H., McClymont, S.A., Hook, P.W., Iossifov, I.,
Raja, A., Baker, C., Hoekzema, K., Stessman, H.A., et al. (2016). Genome Sequencing of
Autism-Affected Families Reveals Disruption of Putative Noncoding Regulatory DNA. Am. J.
Hum. Genet. 98, 58–74.
178. de Vries, B.B., White, S.M., Knight, S.J., Regan, R., Homfray, T., Young, I.D., Super, M.,
McKeown, C., Splitt, M., Quarrell, O.W., et al. (2001). Clinical studies on submicroscopic
subtelomeric rearrangements: a checklist. J. Med. Genet. 38, 145–150.
179. van Bon, B.W.M., Coe, B.P., Bernier, R., Green, C., Gerdts, J., Witherspoon, K., Kleefstra,
T., Willemsen, M.H., Kumar, R., Bosco, P., et al. (2015). Disruptive de novo mutations of
DYRK1A lead to a syndromic form of autism and ID. Mol. Psychiatry.
180. Willsey, A.J., Sanders, S.J., Li, M., Dong, S., Tebbenkamp, A.T., Muhle, R.A., Reilly, S.K.,
Lin, L., Fertuzinhos, S., Miller, J.A., et al. (2013). Coexpression networks implicate human
midfetal deep cortical projection neurons in the pathogenesis of autism. Cell 155, 997–1007.

127
181. Parikshak, N.N., Luo, R., Zhang, A., Won, H., Lowe, J.K., Chandran, V., Horvath, S., and
Geschwind, D.H. (2013). Integrative functional genomic analyses implicate specific molecular
pathways and circuits in autism. Cell 155, 1008–1021.
182. Parikshak, N.N., Gandal, M.J., and Geschwind, D.H. (2015). Systems biology and gene
networks in neurodevelopmental and neurodegenerative disorders. Nat. Rev. Genet. 16, 441–
458.
183. Hoischen, A., van Bon, B.W.M., Gilissen, C., Arts, P., van Lier, B., Steehouwer, M., de
Vries, P., de Reuver, R., Wieskamp, N., Mortier, G., et al. (2010). De novo mutations of
SETBP1 cause Schinzel-Giedion syndrome. Nat. Genet. 42, 483–485.
184. Filges, I., Shimojima, K., Okamoto, N., Röthlisberger, B., Weber, P., Huber, A.R.,
Nishizawa, T., Datta, A.N., Miny, P., and Yamamoto, T. (2011). Reduced expression by
SETBP1 haploinsufficiency causes developmental and expressive language delay indicating a
phenotype distinct from Schinzel-Giedion syndrome. J. Med. Genet. 48, 117–122.

128
Appendix A. Supplemental Information for Chapter 2
Supplemental Figures
S1. The sensitivity of the SNP microarray platforms used in this study
S2. Average difference in female-male recombination rates for 550 kbp windows genome-wide
S3. Incorrect inheritance pattern for family 14784
S4. Monozygotic twins in family 14824 with a de novo 16p11.2 deletion
S5. Atypical 16p11.2 de novo deletion
S6. Correlation of FSIQ and the number of secondary CNVs in screened probands
S7. Secondary deletions of CTNNA3 in 16p11.2 duplication families
S8. Male and female recombination rates across chromosome 16
Supplemental Appendix
Method for determining parent-of-origin of de novo 16p11.2 CNVs
Method for determining mechanism of unequal crossing over of de novo 16p11.2 CNVs
Supplemental Tables
S1. Simons VIP samples screened
S2. Samples run on a custom array CGH platform
S3. Rare CNV calls (frequency <0.1% controls) in the 16p11.2 probands screened
S4. Markers and probabilities indicating the parent-of-origin of the 16p11.2 de novo deletions
S5. Markers and probabilities indicating the parent-of-origin and mechanism of crossing over of the
16p11.2 de novo duplications
S6. Individuals in the Simons Simplex Collection carrying a 16p11.2 CNV
S7. Markers and probabilities indicating the parent-of-origin of the 16p11.2 de novo deletions using only
one parent
S8. Parent-of-origin of 16p11.2 inherited CNVs
S9. Evidence for unequal crossing over in probands with a 16p11.2 de novo CNV
S10. Number of inter and intrachromosomal crossing over events inferred
S11. Expanded secondary CNV table
S12. Rare secondary CNVs disrupting genes associated with autism risk variants
S13. Clinical characteristics of screened probands
S14. Possible combinations of alleles yielding a 16p11.2 de novo duplication
S15. Characteristics of the 27 genes in the 16p11.2 critical region
Supplemental Web Resources
Supplemental References

129
Supplemental Figures

130
Figure S1: The sensitivity of the SNP microarray platforms used in this study. The number of probes
required in each simulated CNV is listed. We used the method for calculating sensitivity by Coe et al.1
Figure S2: Average difference in female-male recombination rates for 550 kbp windows genome-
wide. The average difference in female and male recombination rates were calculated for ten thousand
550 kbp windows (the same size as the 16p11.2 critical region), excluding sex chromosomes, regions
with segmental duplications, and gaps. The 16p11.2 critical region is in the 87th percentile for the average
difference amongst these regions.
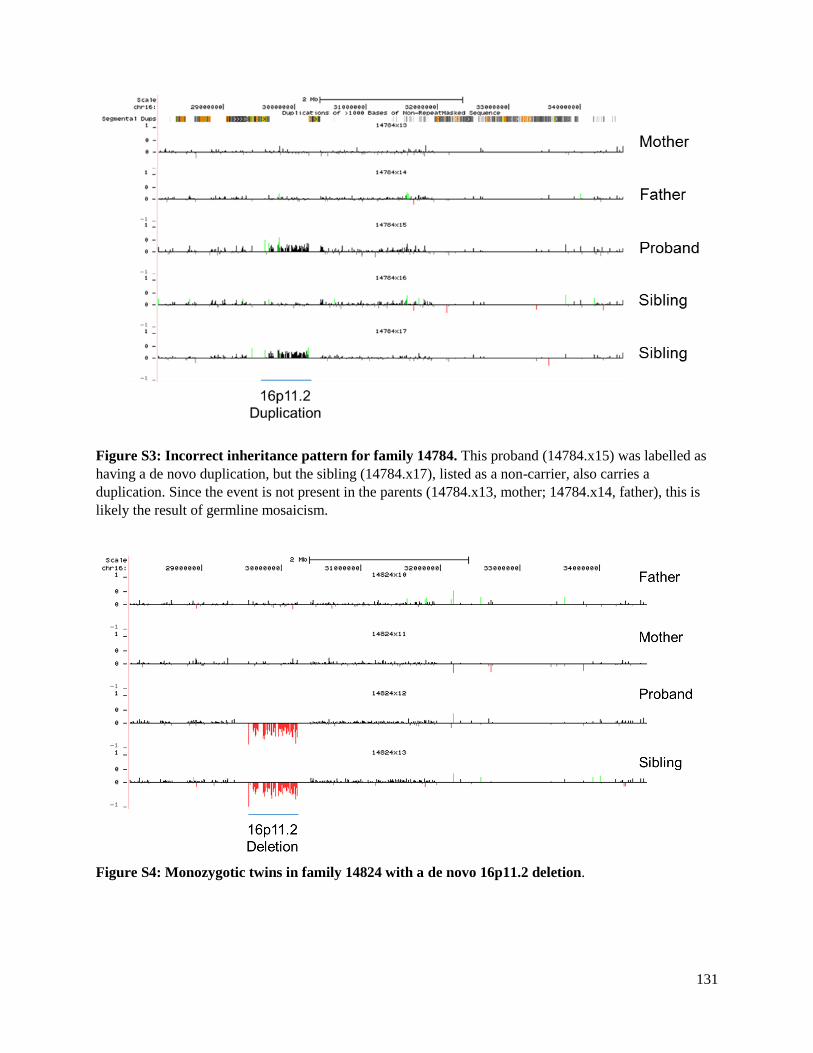
131
Figure S3: Incorrect inheritance pattern for family 14784. This proband (14784.x15) was labelled as
having a de novo duplication, but the sibling (14784.x17), listed as a non-carrier, also carries a
duplication. Since the event is not present in the parents (14784.x13, mother; 14784.x14, father), this is
likely the result of germline mosaicism.
Figure S4: Monozygotic twins in family 14824 with a de novo 16p11.2 deletion.

132
Figure S5: Atypical 16p11.2 deletion. One individual in the cohort (14720.x10) had an atypical de novo
16p11.2 deletion that extends from breakpoint 2 beyond breakpoint 5 with nearly 2 Mbp of genomic
DNA deleted.
Figure S6: Correlation of FSIQ and the number of secondary CNVs in screened probands. There is
a modest, statistically significant correlation between the FSIQ and number of secondary CNVs present in
the screened probands (R2=0.04, p=0.03).

133
a.
b.
Figure S7: Secondary deletions of CTNNA3 in 16p11.2 duplication families. We found a recurrent
secondary deletion in two 16p11.2 duplication families affecting a gene associated with autism risk
variants, αT-catenin, CTNNA3. (a) A ~150 kbp deletion involving CTNNA3 is transmitted from mother to
daughter who also carries a 16p11.2 de novo duplication. (b) A ~50 kbp deletion transmitted from father
to son. Both father and son carry the 16p11.2 duplication. While both of these CNVs are individually rare,
there are a similar number of cases and controls with events across CTNNA.2 However, two large studies
have found genetic association between CTNNA3 and autism3,4 and rare deletions have been identified in
individuals with ASD.5

134
a.
b.
Figure S8: Male and female recombination rates across chromosome 16. a) Not including the
telomeres, males have a decreased recombination rate across chromosome 16 compared to females, using
data from Kong et al.6. The lavender bar is the critical region. b) The standardized female recombination
rate in females (red) and males (blue) across the 16p11.2 critical region. Note the maternal recombination
hotspot in the left-hand most side of the region. (Plotted using the GViz R package7.)

135
Supplemental Appendix
This Supplemental Appendix includes the methods for determining the parent-of-origin and mechanism
of unequal crossing over of de novo 16p11.2 CNVs.
Method for determining parent-of-origin of de novo 16p11.2 CNVs
De novo 16p11.2 deletions
We used the B-allele frequency data from the SNP microarrays to infer if de novo events originated on
the maternal or paternal haplotype. For this analysis, we used data from probes (112, for OmniExpress
arrays) falling in the 16p11.2 critical region. In deletion individuals, only one copy of the critical region
remains. Therefore, possible SNP genotypes for probes are A or B with corresponding B-allele frequency
of 0 or 1. This is tabulated below:
Deletion:
Affected Haplotype: Unaffected Haplotype: B-allele Frequency:
NA A 0
NA B 1
In the case where we had genotype information on both parents (trios), we used the parental genotypes to
infer the inheritance of the unaffected haplotype in the proband.
We define the probabilities as follows:
𝑃(𝑚𝑜𝑡ℎ𝑒𝑟|𝑝𝑟𝑜𝑏𝑒𝑠) : Probability of inheritance of the unaffected haplotype from mother given the
probes
𝑃(𝑓𝑎𝑡ℎ𝑒𝑟|𝑝𝑟𝑜𝑏𝑒𝑠) : Probability of inheritance of the unaffected haplotype from father given the
probes
𝑃(𝑚𝑜𝑡ℎ𝑒𝑟) : Prior probability of inheritance of the unaffected haplotype from mother
𝑃(𝑝𝑟𝑜𝑏𝑒𝑠) : Posterior probability of the observed probes
By Bayes’ theorem,
𝑃(𝑚𝑜𝑡ℎ𝑒𝑟|𝑝𝑟𝑜𝑏𝑒𝑠) =𝑃(𝑝𝑟𝑜𝑏𝑒𝑠 | 𝑚𝑜𝑡ℎ𝑒𝑟) ∗ 𝑃(𝑚𝑜𝑡ℎ𝑒𝑟)
𝑃(𝑝𝑟𝑜𝑏𝑒𝑠)
And similarly for the father,
𝑃(𝑓𝑎𝑡ℎ𝑒𝑟|𝑝𝑟𝑜𝑏𝑒𝑠) =𝑃(𝑝𝑟𝑜𝑏𝑒𝑠 | 𝑓𝑎𝑡ℎ𝑒𝑟) ∗ 𝑃(𝑚𝑜𝑡ℎ𝑒𝑟)
𝑃(𝑝𝑟𝑜𝑏𝑒𝑠)
Since the prior probability of inheritance of the unaffected haplotype from either parent is 0.5, we have
that:
𝑃(𝑚𝑜𝑡ℎ𝑒𝑟) =1
2
and,
𝑃(𝑓𝑎𝑡ℎ𝑒𝑟) =1
2

136
Since the unaffected haplotype must come from either the mother or the father, we also have that,
𝑃(𝑚𝑜𝑡ℎ𝑒𝑟 | 𝑝𝑟𝑜𝑏𝑒𝑠) + 𝑃(𝑓𝑎𝑡ℎ𝑒𝑟 | 𝑝𝑟𝑜𝑏𝑒𝑠) = 1
Using this relationship, we see that,
𝑃(𝑝𝑟𝑜𝑏𝑒𝑠) =𝑃(𝑝𝑟𝑜𝑏𝑒𝑠 | 𝑓𝑎𝑡ℎ𝑒𝑟) + 𝑃(𝑝𝑟𝑜𝑏𝑒𝑠 | 𝑚𝑜𝑡ℎ𝑒𝑟)
2
To determine the quantity 𝑃(𝑝𝑟𝑜𝑏𝑒𝑠 | 𝑚𝑜𝑡ℎ𝑒𝑟), the probability of observing the set of probes given that
the unaffected haplotype comes from the mother, we make the assumption that probe signals are
independent and recognize that,
𝑃(𝑝𝑟𝑜𝑏𝑒𝑠 | 𝑚𝑜𝑡ℎ𝑒𝑟) = ∏ 𝑃(𝑝𝑟𝑜𝑏𝑒𝑖 | 𝑚𝑜𝑡ℎ𝑒𝑟)
𝑛
𝑖=1
where probei is the ith probe out of n in the critical region.
To compute 𝑃(𝑝𝑟𝑜𝑏𝑒𝑖 | 𝑚𝑜𝑡ℎ𝑒𝑟), we recognize that each site in the unaffected haplotype will have a
genotype of either A or B. Since the mother is diploid over the critical region, at each site she has possible
genotypes of AA, AB, or BB. Assuming the probability of a genotyping error is 0.001, as suggested by
Illumina (see Supplemental Web Resources), we build the following probability table:
Mother Genotype at probe i Proband Genotype at probe i P(probei|mother)
AA A 0.999
AB A 0.5
BB A 0.001
AA B 0.001
AB B 0.5
BB B 0.999
The approach is identical to compute 𝑃(𝑝𝑟𝑜𝑏𝑒𝑠|𝑓𝑎𝑡ℎ𝑒𝑟).
In the cases where we had only one parent available, we estimated the probability of the unobserved
parent using the known allele frequencies for that particular probe from the 1000 Genomes Project, when
it existed. In these cases, even though we did not have SNP microarray data from the missing parent, in
all cases the 16p11.2 CNV was determined to be de novo by clinical microarray or another method. We
model the genotype of the missing parent at each probe using the allele frequencies calculated from the
1000 Genomes Project and we only use probes that are present in dbSNP 140 (95 probes). For the missing
parent, the probability 𝑃(𝑝𝑟𝑜𝑏𝑒𝑖|𝑀𝑖𝑠𝑠𝑖𝑛𝑔𝑃𝑎𝑟𝑒𝑛𝑡) now depends on the genotype frequencies. Let ai be
the allele frequency of the A allele at a probe i and bi be the allele frequency of the B allele at a probe i.
Then, assuming the probability of a genotyping error is 0.001, we construct the following probability
table:

137
Missing
Parent
Genotype
at probe i
P(Missing
Parent
Genotype at
probe i)
Proband
Genotype
at probe i P(probei|MissingParent)
AA ai2
A 0.999
AB 2*ai*bi A 0.5
BB bi2 A 0.001
AA ai2 B 0.001
AB 2*ai*bi B 0.5
BB bi2 B 0.999
Then, using Hardy-Weinberg we have:
𝑃(𝑝𝑟𝑜𝑏𝑒𝑖 = 𝐴|𝑀𝑖𝑠𝑠𝑖𝑛𝑔𝑃𝑎𝑟𝑒𝑛𝑡) = 0.999 ∗ 𝑎𝑖2 + 0.5 ∗ 2 ∗ 𝑎𝑖 ∗ 𝑏𝑖 + 0.001 ∗ 𝑏𝑖
2
and
𝑃(𝑝𝑟𝑜𝑏𝑒𝑖 = 𝐵|𝑀𝑖𝑠𝑠𝑖𝑛𝑔𝑃𝑎𝑟𝑒𝑛𝑡) = 0.999 ∗ 𝑏𝑖2 + 0.5 ∗ 2 ∗ 𝑎𝑖 ∗ 𝑏𝑖 + 0.001 ∗ 𝑎𝑖
2
In this way, we calculate the exact probability that the unaffected haplotype was inherited from the
mother or father.
In cases where a different version of the same array was run (i.e., Omni1 vs. Omni2), we selected
only those probes present on each array in the family.
De novo 16p11.2 duplications
Duplication individuals have three copies of the critical region. The possible SNP genotypes for each
probe over the critical region in duplication individuals are AAA, AAB, ABB, and BBB with
corresponding B-allele frequencies of 0, 1/3, 2/3, and 1, respectively. Due to the possibilities of either
inter or intrachromosomal mechanisms of crossing over, we evaluate the genotypes of both parents and
the proband to determine the parent-of-origin. In particular, we compute all possible outcomes of
rearrangement given a particular parent-of-origin and mechanism of crossing over (Table S14). At each
probe i, this provides the probabilities of parent-of-origin and, in some cases, mechanism of unequal
crossing over. We count the number of partially informative markers (probability >0.5 and <1) and fully
informative markers (probability=1) to determine the parent-of-origin of the observed event (Table S5).

138
Genotype Parent-of-Origin Mechanism
Mother Father Proband
Prob.
Mother
Prob.
Father
Prob.
Inter
Prob.
Intra
AA AA AAA 0.50 0.50 0.50 0.50
AA AA AAB NA NA NA NA
AA AA ABB NA NA NA NA
AA AA BBB NA NA NA NA
AA AB AAA 0.66 0.33 0.33 0.66
AA AB AAB 0.50 0.50 0.50 0.50
AA AB ABB 0.00 1.00 0.00 1.00
AA AB BBB NA NA NA NA
AA BB AAA NA NA NA NA
AA BB AAB 1.00 0.00 0.50 0.50
AA BB ABB 0.00 1.00 0.50 0.50
AA BB BBB NA NA NA NA
AB AA AAA 0.33 0.66 0.33 0.66
AB AA AAB 0.50 0.50 0.50 0.50
AB AA ABB 1.00 0.00 0.00 1.00
AB AA BBB NA NA NA NA
AB AB AAA 0.50 0.50 0.00 1.00
AB AB AAB 0.50 0.50 0.66 0.33
AB AB ABB 0.50 0.50 0.66 0.33
AB AB BBB 0.50 0.50 0.00 1.00
AB BB AAA NA NA NA NA
AB BB AAB 1.00 0.00 0.00 1.00
AB BB ABB 0.50 0.50 0.75 0.25
AB BB BBB 0.33 0.66 0.33 0.66
BB AA AAA NA NA NA NA
BB AA AAB 0.00 1.00 0.50 0.50
BB AA ABB 1.00 0.00 0.50 0.50
BB AA BBB NA NA NA NA
BB AB AAA NA NA NA NA
BB AB AAB 0.00 1.00 0.00 1.00
BB AB ABB 0.50 0.50 0.75 0.25
BB AB BBB 0.66 0.33 0.33 0.66
BB BB AAA NA NA NA NA
BB BB AAB NA NA NA NA
BB BB ABB NA NA NA NA
BB BB BBB 0.50 0.50 0.50 0.50

139
Method for determining mechanism of unequal crossing over of de novo 16p11.2 CNVs
Nonallelic homologous recombination (NAHR) can occur between homologous chromosomes or between
or within sister chromatids:
We used the below method to determine the mechanism of unequal crossover.
Quads:
When possible, we used full quads in order to perfectly phase the parents using the sibling.
(1) Phase the proband and sibling
We phased the proband and sibling into maternal and paternal alleles by comparison with the parental
genotypes. To determine the mechanism of unequal crossing over, we consider only the haplotype on
which the de novo 16p event occurred (maternal or paternal). The possibilities are shown below:
Mother Father Child
Maternal
Allele
Paternal
Allele
AA AA AA A A
AA AB AA A A
AA AB AB A B
AA BB AB A B
AB AA AA A A
AB AA AB B A
AB AB AA A A
AB AB AB NA NA
AB AB BB B B
AB BB AB A B
AB BB BB B B
BB AA AB B A
BB AB AB B A
BB AB BB B B
BB BB BB B B
Mechanisms of unequal crossing over.
(a) NAHR can occur between
homologous chromosomes or (b)
between or within sister chromatids.

140
Only those sites that can distinguish between the two chromosomes in the parent on which the 16p11.2 de
novo event originated are informative. For example, if the event occurred on the maternal haplotype, then
only heterozygous genotypes in the mother are informative. In total, we considered a total of 314 markers
telomeric and 314 markers centromeric of the critical region as possibly informative. For the rest of this
discussion, we assume for simplicity that the 16p11.2 de novo CNV occurs on the maternal haplotype.
(2) Compare the proband and sibling maternal haplotypes
We assume that no crossing over event has occurred in the 16p11.2 region in the sibling on the haplotype
of interest. Therefore, the maternal haplotype present in the sibling should represent perfectly one of the
two maternal chromosomes. We determine if the maternal alleles flanking the critical region match the
sibling alleles (314 markers on the left, 314 markers on the right). There are four possibilities, shown
below:
Left Flank Right Flank Conclusion
Match Match Intrachromosomal
Don't Match Match Interchromosomal
Match Don't Match Interchromosomal
Don't Match Don't Match Intrachromosomal
(3) Calculate a probability that the event occurred by an inter or intrachromosomal mechanism
We developed a probability model to calculate the probability of an interchromosomal versus an
intrachromosomal event given the number of alleles in the left and right flanks (called flank 1 and flank 2
for simplicity) that match the sibling markers. Each marker gets the number 0 if the proband does not
match the sibling and 1 if the proband matches the sibling. We notice that the probability of an
intrachromosomal event is the probability of the left flank and right flanks of the proband either matching
the sibling or both not matching the sibling. We also assume independence of the flanks, so we have that:
𝑃(𝐼𝑛𝑡𝑟𝑎𝑐ℎ𝑟𝑜𝑚𝑜𝑠𝑜𝑚𝑎𝑙|𝑃𝑟𝑜𝑏𝑒𝑠)
= 𝑃 (((𝑓𝑙𝑎𝑛𝑘1 = 0 ∩ 𝑓𝑙𝑎𝑛𝑘2 = 0) ∪ (𝑓𝑙𝑎𝑛𝑘1 = 1 ∩ 𝑓𝑙𝑎𝑛𝑘2 = 1))|𝑝𝑟𝑜𝑏𝑒𝑠)
= 𝑃(𝑓𝑙𝑎𝑛𝑘1 = 0|𝑝𝑟𝑜𝑏𝑒𝑠)𝑃(𝑓𝑙𝑎𝑛𝑘2 = 0|𝑝𝑟𝑜𝑏𝑒𝑠) + 𝑃(𝑓𝑙𝑎𝑛𝑘1 = 0|𝑝𝑟𝑜𝑏𝑒𝑠)𝑃(𝑓𝑙𝑎𝑛𝑘2 = 0|𝑝𝑟𝑜𝑏𝑒𝑠)
Similarly, if the flanks do not match each other, than we have an interchromosomal event. That is:
𝑃(𝐼𝑛𝑡𝑒𝑟𝑐ℎ𝑟𝑜𝑚𝑜𝑠𝑜𝑚𝑎𝑙|𝑃𝑟𝑜𝑏𝑒𝑠)
= 𝑃 (((𝑓𝑙𝑎𝑛𝑘 1 = 0 ∩ 𝑓𝑙𝑎𝑛𝑘 2 = 1) ∪ (𝑓𝑙𝑎𝑛𝑘 1 = 0 ∩ 𝑓𝑙𝑎𝑛𝑘 2 = 1))|𝑝𝑟𝑜𝑏𝑒𝑠)
= 𝑃(𝑓𝑙𝑎𝑛𝑘1 = 0|𝑝𝑟𝑜𝑏𝑒𝑠)𝑃(𝑓𝑙𝑎𝑛𝑘2 = 1|𝑝𝑟𝑜𝑏𝑒𝑠) + 𝑃(𝑓𝑙𝑎𝑛𝑘1 = 0|𝑝𝑟𝑜𝑏𝑒𝑠)𝑃(𝑓𝑙𝑎𝑛𝑘2 = 1|𝑝𝑟𝑜𝑏𝑒𝑠)
From this we note that:
𝑃(𝐼𝑛𝑡𝑟𝑎𝑐ℎ𝑟𝑜𝑚𝑜𝑠𝑜𝑚𝑎𝑙|𝑃𝑟𝑜𝑏𝑒𝑠) + 𝑃(𝐼𝑛𝑡𝑒𝑟𝑐ℎ𝑟𝑜𝑚𝑜𝑠𝑜𝑚𝑎𝑙|𝑃𝑟𝑜𝑏𝑒𝑠) = 1
Using this relationship, we only have to calculate 𝑃(𝐼𝑛𝑡𝑟𝑎𝑐ℎ𝑟𝑜𝑚𝑜𝑠𝑜𝑚𝑎𝑙|𝑃𝑟𝑜𝑏𝑒𝑠). To do so, we must
calculate each of the four components that make up this probability. We will show how to do this for the
first two components corresponding to flank 1, as the second two follow. Using Bayes’ theorem, we have
that:

141
𝑃(𝑓𝑙𝑎𝑛𝑘1 = 0|𝑝𝑟𝑜𝑏𝑒𝑠) =𝑃(𝑓𝑙𝑎𝑛𝑘1 = 0) ∗ 𝑃(𝑝𝑟𝑜𝑏𝑒𝑠|𝑓𝑙𝑎𝑛𝑘1 = 0)
𝑃(𝑝𝑟𝑜𝑏𝑒𝑠)
and also that:
𝑃(𝑓𝑙𝑎𝑛𝑘1 = 1|𝑝𝑟𝑜𝑏𝑒𝑠) =𝑃(𝑓𝑙𝑎𝑛𝑘1 = 1) ∗ 𝑃(𝑝𝑟𝑜𝑏𝑒𝑠|𝑓𝑙𝑎𝑛𝑘1 = 1)
𝑃(𝑝𝑟𝑜𝑏𝑒𝑠)
We assume the probability that proband and sibling match in flank 1 is equal to the probability that they do
not match. Therefore,
𝑃(𝑓𝑙𝑎𝑛𝑘1 = 0) = 0.5
and,
𝑃(𝑓𝑙𝑎𝑛𝑘1 = 1) = 0.5
To calculate P(probes) we note that:
𝑃(𝑓𝑙𝑎𝑛𝑘1 = 0|𝑝𝑟𝑜𝑏𝑒𝑠) + 𝑃(𝑓𝑙𝑎𝑛𝑘1 = 1|𝑝𝑟𝑜𝑏𝑒𝑠) = 1
Expanding this, we have that:
𝑃(𝑝𝑟𝑜𝑏𝑒𝑠) =𝑃(𝑝𝑟𝑜𝑏𝑒𝑠|𝑓𝑙𝑎𝑛𝑘1 = 0) + 𝑃(𝑝𝑟𝑜𝑏𝑒𝑠|𝑓𝑙𝑎𝑛𝑘1 = 1)
2
Finally, we assume independence of individual markers and note that:
𝑃(𝑝𝑟𝑜𝑏𝑒𝑠|𝑓𝑙𝑎𝑛𝑘1 = 0) = ∏ 𝑃(𝑝𝑟𝑜𝑏𝑒𝑖|𝑓𝑙𝑎𝑛𝑘1 = 0)
𝑝𝑟𝑜𝑏𝑒𝑠
and,
𝑃(𝑝𝑟𝑜𝑏𝑒𝑠|𝑓𝑙𝑎𝑛𝑘1 = 1) = ∏ 𝑃(𝑝𝑟𝑜𝑏𝑒𝑖|𝑓𝑙𝑎𝑛𝑘1 = 1)
𝑝𝑟𝑜𝑏𝑒𝑠
To compute the probabilities for the individual probes, we take that the probability of a genotyping error is
0.001. Therefore, we construct the following probability table:
Sibling/Proband
Markers P(probei|flank1=0) P(probei|flank1=1)
Don't Match (0) 0.999*0.001*2 0.9992*0.0012
Match (1) 0.9992*0.0012 0.999*0.001*2
To determine the accuracy of the assumption that no crossing over events occurred in the sibling, we
asked how many crossover events were predicted between the leftmost and rightmost marker in our
analysis. Based on the data from Kong et al.1, the genetic distance between the leftmost and rightmost
markers in our analysis is 6.20 centimorgans for the female and 0.45 centimorgans for the male, which
corresponds to a probability of crossover of 6.2% for the female and 0.45% for the male. Therefore, the
number of false positives (an intrachromosomal event being interpreted as an interchromosomal event or
vice versa) is 1 in 16 for de novo events originating on the maternal haplotype and 1 in 222 for events
originating on the paternal haplotype.
Trios:

142
In the trio case, we do not have a sibling for phasing the haplotypes of the parent-of-origin. Therefore, we
performed statistical phasing of the mothers. The approach was similar to that used for the quads:
(1) Phase the proband
We phased the proband into maternal and paternal alleles by comparison with the parental genotypes. As
before, we are only concerned with the informative markers that allow us to distinguish between parental
haplotypes, i.e., those cases when the parent-of-origin is heterozygous for a particular allele.
(2) Phase the parent-of-origin haplotypes
Since a sibling is not present to phase the haplotypes of the parent-of-origin, we instead need to
statistically phase the parent-of-origin haplotypes. To do this we used the program Beagle v4.0
(http://faculty.washington.edu/browning/beagle/beagle.html) and used the phased 1000 Genomes Project
phase 3 chromosome 16 reference panel for phasing
(http://bochet.gcc.biostat.washington.edu/beagle/1000_Genomes_phase3_v5/).
The exact command used is below:
java -Xmx10G -jar beagle.r1399.jar gt=Input.vcf.gz ref=chr16.1kg.phase3.v5.vcf.gz out=
phased_data.out impute=false
(3) Compare the proband to the parent-of-origin
Next, we compare the proband’s haplotype from the parent-of-origin of the 16p11.2 event to one of the
haplotypes from the parent-of-origin. As before, the probes will either match or not match in each flank
and we use the same probability model as before to compute the probability of an inter or
intrachromosomal event.
Duplications
As mentioned above, for duplications certain combinations of maternal, paternal, and proband genotypes
are partially or perfectly informative of a mechanism of unequal crossing over. When the flanking
marker-based approach did not yield a consistent result, we compared this approach to the approach using
probes in the critical region (Table S5).
Supplemental Web Resources
Beagle: http://faculty.washington.edu/browning/beagle/beagle.html
cnvPartition Algorithm: http://www.illumina.com/content/dam/illumina-
marketing/documents/products/technotes/technote_cnv_plug_ins.pdf
Genotype Rare Variants Tech Note: http://support.illumina.com/content/dam/illumina-
marketing/documents/products/technotes/technote_genotyping_rare_variants.pdf
Supplemental References
1. Coe, B.P., Ylstra, B., Carvalho, B., Meijer, G.A., Macaulay, C., and Lam, W.L. (2007). Resolving the
resolution of array CGH. Genomics 89, 647–653.
2. Coe, B.P., Witherspoon, K., Rosenfeld, J.A., van Bon, B.W.M., Vulto-van Silfhout, A.T., Bosco, P.,
Friend, K.L., Baker, C., Buono, S., Vissers, L.E.L.M., et al. (2014). Refining analyses of copy number
variation identifies specific genes associated with developmental delay. Nat. Genet. 46, 1063–1071.
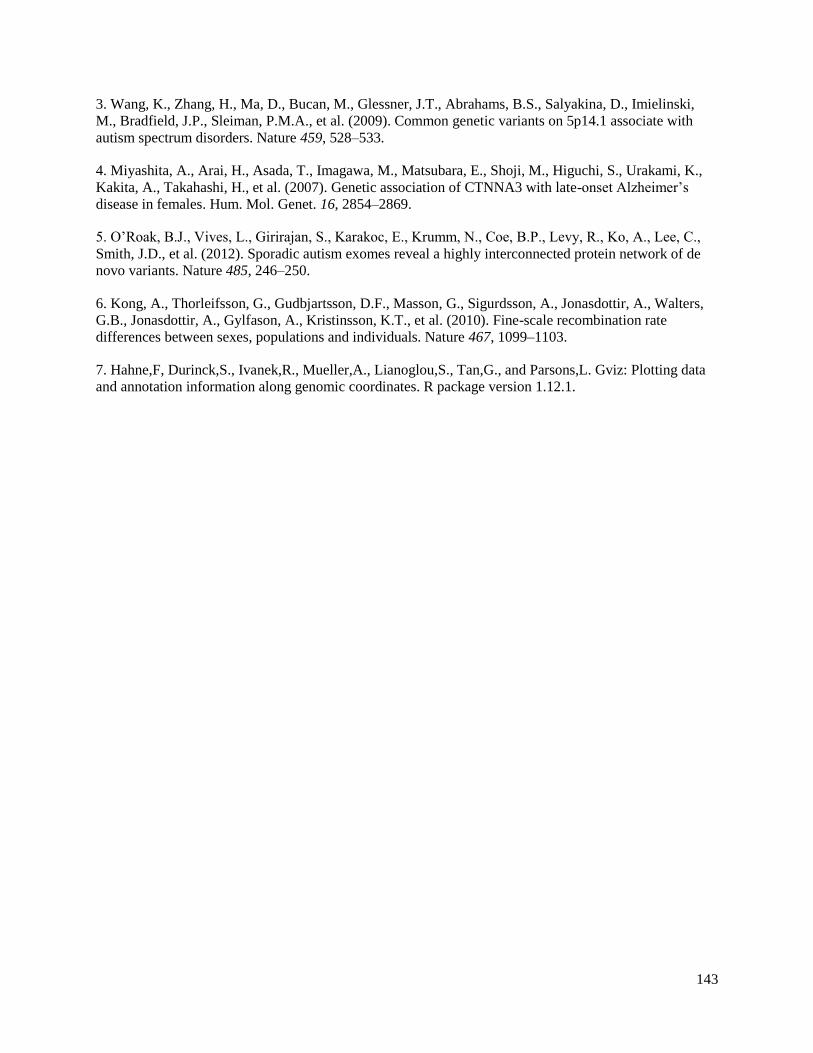
143
3. Wang, K., Zhang, H., Ma, D., Bucan, M., Glessner, J.T., Abrahams, B.S., Salyakina, D., Imielinski,
M., Bradfield, J.P., Sleiman, P.M.A., et al. (2009). Common genetic variants on 5p14.1 associate with
autism spectrum disorders. Nature 459, 528–533.
4. Miyashita, A., Arai, H., Asada, T., Imagawa, M., Matsubara, E., Shoji, M., Higuchi, S., Urakami, K.,
Kakita, A., Takahashi, H., et al. (2007). Genetic association of CTNNA3 with late-onset Alzheimer’s
disease in females. Hum. Mol. Genet. 16, 2854–2869.
5. O’Roak, B.J., Vives, L., Girirajan, S., Karakoc, E., Krumm, N., Coe, B.P., Levy, R., Ko, A., Lee, C.,
Smith, J.D., et al. (2012). Sporadic autism exomes reveal a highly interconnected protein network of de
novo variants. Nature 485, 246–250.
6. Kong, A., Thorleifsson, G., Gudbjartsson, D.F., Masson, G., Sigurdsson, A., Jonasdottir, A., Walters,
G.B., Jonasdottir, A., Gylfason, A., Kristinsson, K.T., et al. (2010). Fine-scale recombination rate
differences between sexes, populations and individuals. Nature 467, 1099–1103.
7. Hahne,F, Durinck,S., Ivanek,R., Mueller,A., Lianoglou,S., Tan,G., and Parsons,L. Gviz: Plotting data
and annotation information along genomic coordinates. R package version 1.12.1.

144
Appendix B. Supplemental Information for Chapter 3

145

146
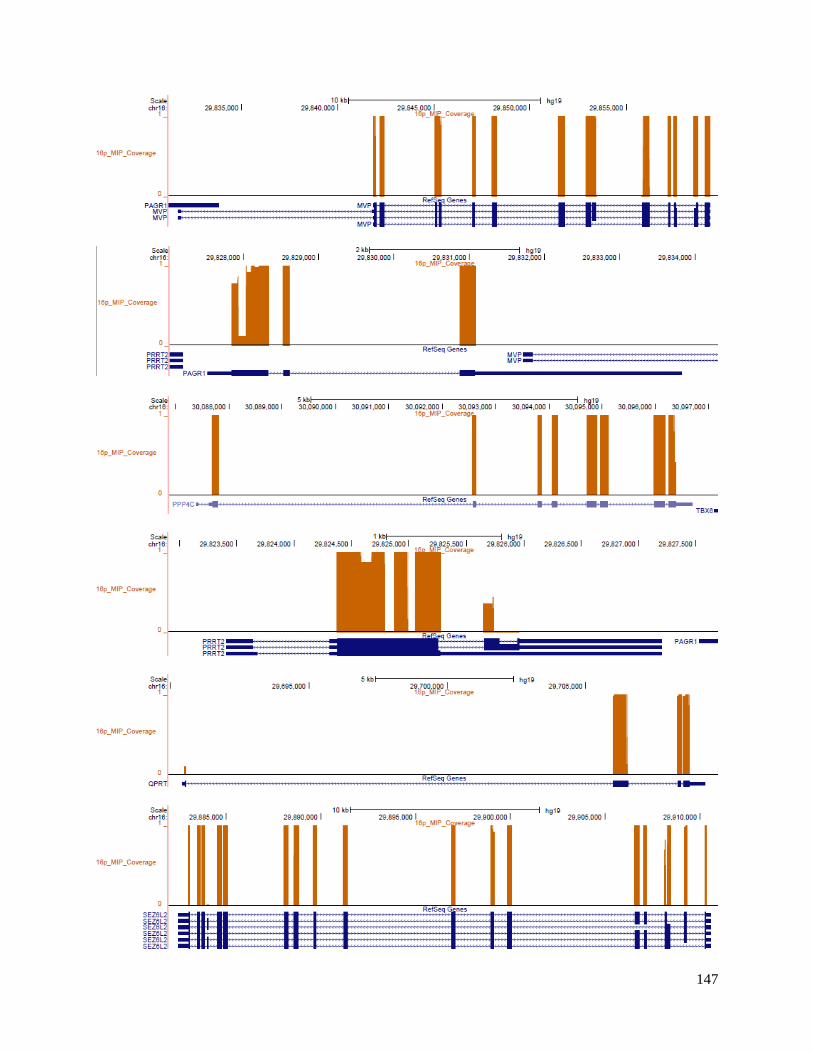
147
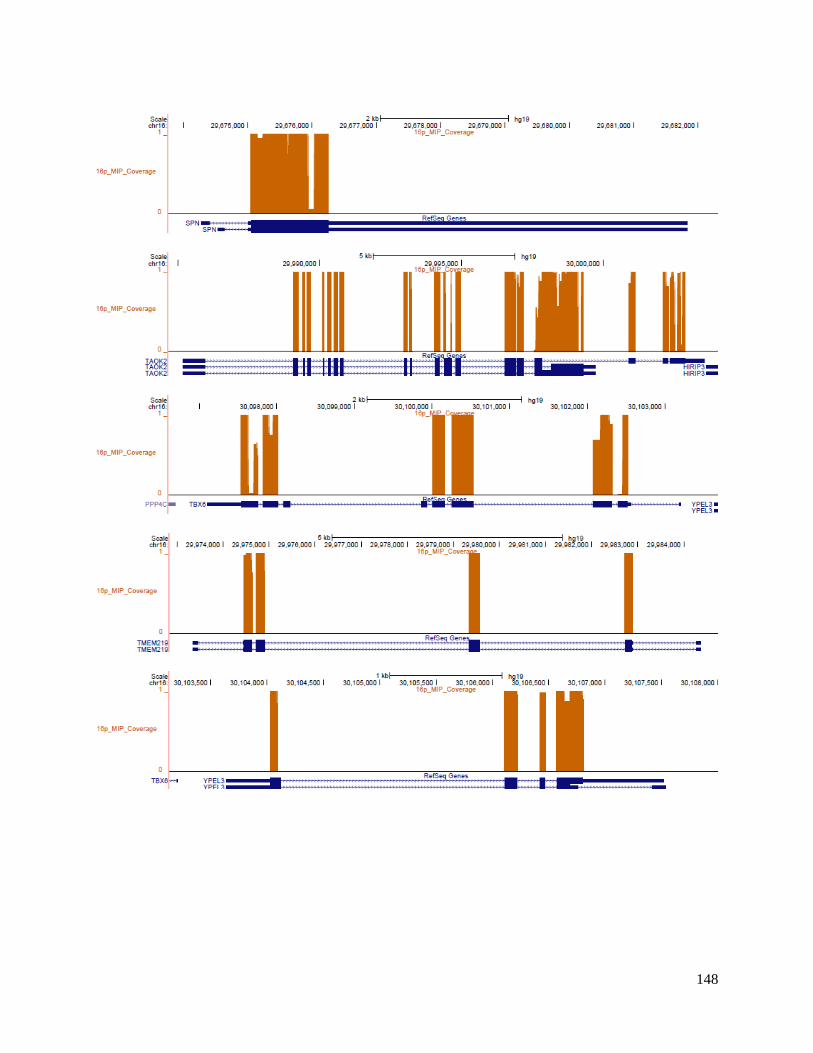
148

149
Figure S1. MIP coverage over 27 genes in the critical region. The fraction of samples with quality
sequence over each MIP is plotted for each of the 27 unique critical region genes.
Figure S2. Severity plot for proband with a severe variant in a duplicated gene. Individuals with a
severe missense variant in a duplicated gene plotted in red.
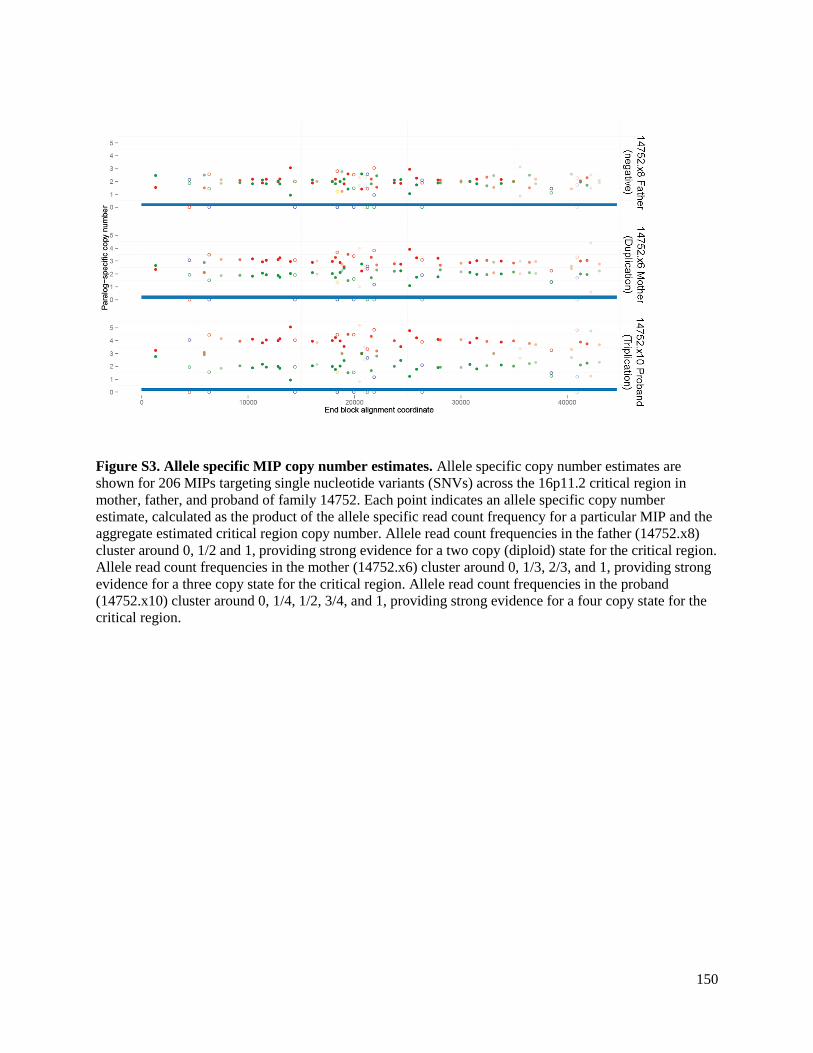
150
Figure S3. Allele specific MIP copy number estimates. Allele specific copy number estimates are
shown for 206 MIPs targeting single nucleotide variants (SNVs) across the 16p11.2 critical region in
mother, father, and proband of family 14752. Each point indicates an allele specific copy number
estimate, calculated as the product of the allele specific read count frequency for a particular MIP and the
aggregate estimated critical region copy number. Allele read count frequencies in the father (14752.x8)
cluster around 0, 1/2 and 1, providing strong evidence for a two copy (diploid) state for the critical region.
Allele read count frequencies in the mother (14752.x6) cluster around 0, 1/3, 2/3, and 1, providing strong
evidence for a three copy state for the critical region. Allele read count frequencies in the proband
(14752.x10) cluster around 0, 1/4, 1/2, 3/4, and 1, providing strong evidence for a four copy state for the
critical region.

151
Figure S4. Discovery of an individual with five copies of the 16p11.2 critical region. a) Allele specific
copy number estimates are shown for 206 MIPs targeting single nucleotide variants (SNVs) across the
16p11.2 critical region in mother, father, and proband of family 14742. Each point indicates an allele
specific copy number estimate, calculated as the product of the allele specific read count frequency for a
particular MIP and the aggregate estimated critical region copy number. Allele read count frequencies in
the mother (14742.x3) cluster around 0, 1/5, 2/5, 3/5, 4/5, and 1, providing strong evidence for a five copy
state for the critical region in this individual. b) The corresponding B-allele frequency plots from the SNP
microarray.

152
Figure S5. Severity plot of 13 probands with severe exonic variants in SFARI genes. Individuals with
severe exonic variants are plotted as red triangles.

153
Figure S6. Distribution of average heterozygosity across 500kbp windows. A. The genome-wide
distribution of average heterozygosity for 550kbp regions from 2500 individuals from the 1000 genomes
phase 3 release sampled 100,000 times. Lines indicate the average heterozygosities of the 550kbp
telomeric flank, centromeric flank and critical region. The critical region lies in the bottom 2.5 percentile
of the distribution. B. The chromosome 16 distribution of average heterozygosity for 550kbp regions
from 2500 individuals from the 1000 genomes phase 3 release sampled 30,000 times. Lines indicate the
average heterozygosities of the 550kbp telomeric flank, centromeric flank and critical region. The critical
region lies in the bottom 5.6 percentile of the distribution.
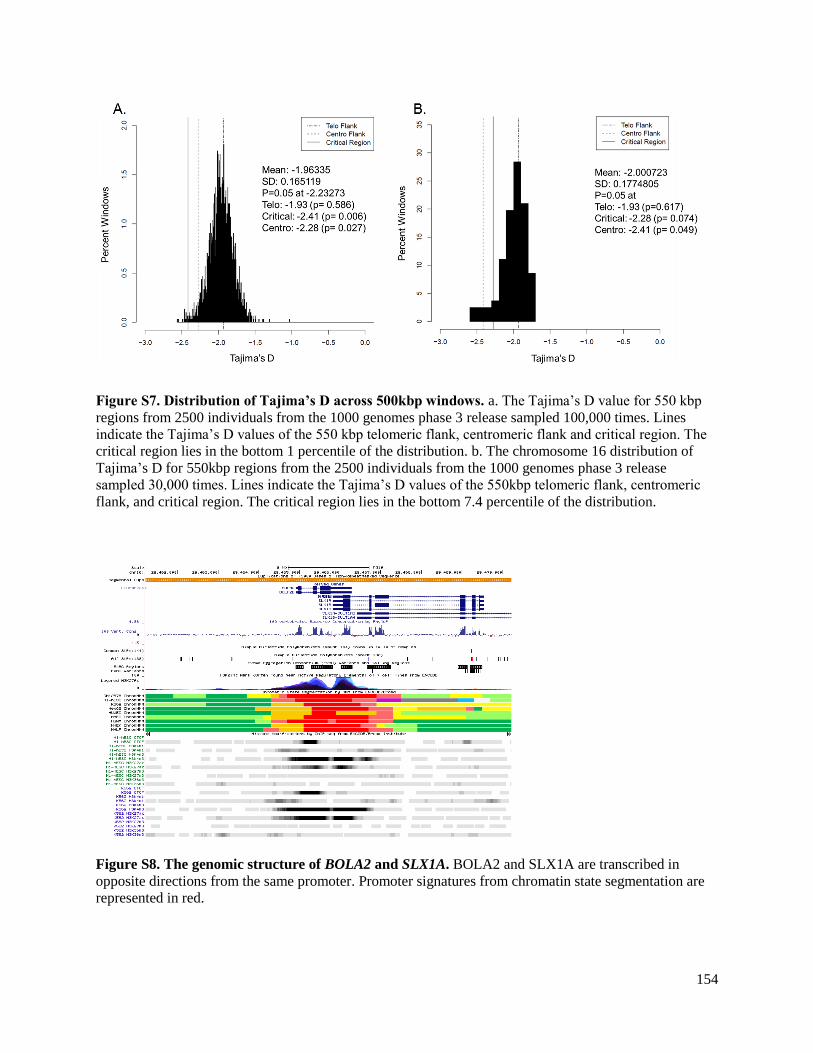
154
Figure S7. Distribution of Tajima’s D across 500kbp windows. a. The Tajima’s D value for 550 kbp
regions from 2500 individuals from the 1000 genomes phase 3 release sampled 100,000 times. Lines
indicate the Tajima’s D values of the 550 kbp telomeric flank, centromeric flank and critical region. The
critical region lies in the bottom 1 percentile of the distribution. b. The chromosome 16 distribution of
Tajima’s D for 550kbp regions from the 2500 individuals from the 1000 genomes phase 3 release
sampled 30,000 times. Lines indicate the Tajima’s D values of the 550kbp telomeric flank, centromeric
flank, and critical region. The critical region lies in the bottom 7.4 percentile of the distribution.
Figure S8. The genomic structure of BOLA2 and SLX1A. BOLA2 and SLX1A are transcribed in
opposite directions from the same promoter. Promoter signatures from chromatin state segmentation are
represented in red.

155
Figure S9. SULT1A3 tissue expression from the GTeX database.