understanding the market & identifying models to … · web viewfinancial services are...
TRANSCRIPT

Off-grid solar market assessment in Niger& design of market-based solutionsFinal report – June 2017
The findings, interpretations, and conclusions expressed in this paper are entirely those of the authors. They do not necessarily represent the view of the Lighting Africa Program, its affiliated organizations, or the governments they represent.

Open Capital Advisors
Contents
1 Executive summary..............................................................................................72 Introduction & methodology.................................................................................93 Grid power and grid expansion..........................................................................12
3.1 Generation & consumption.........................................................................153.2 The current grid network and efforts to increase grid access.....................16
4 The market opportunity for stand-alone solar systems......................................204.1 Households.................................................................................................23
4.1.1 Market for solar home devices with no consumer finance......................264.1.2 Market for SL and SHS with consumer financing.....................................274.1.3 Consumer benefits from switching to solar.............................................294.1.4 The market impact of current customs duties.........................................31
4.2 Public institutions (education, health & governance).................................334.2.1 Educational institutions...........................................................................334.2.2 Health facilities........................................................................................364.2.3 Public buildings.......................................................................................38
4.3 Agricultural irrigation..................................................................................404.3.1 Large irrigation schemes (ONAHA)..........................................................414.3.2 Small scale, individual irrigation schemes...............................................44
4.4 Crop processing..........................................................................................484.5 Water provision..........................................................................................504.6 Solar street lights.......................................................................................54
5 Supply of solar technology and the supporting ecosystem................................565.1 The supply-side landscape..........................................................................565.2 Niger’s financial sector...............................................................................625.3 Mobile network operators...........................................................................65
6 Challenges to solar market growth....................................................................697 Recommended market interventions for stand-alone solar systems.................74
7.1 Overarching systemic interventions...........................................................77
2

Open Capital Advisors
7.2 Financial interventions for household-level solar solutions.........................807.3 Financial interventions for the irrigation market.........................................91
Appendices...............................................................................................................95App. A: Assessment of the opportunity for grid extension and mini-grids................95
A.1 Assessment of the opportunity to extend the grid..........................................95A.2 Assessment of the opportunity for investment in mini-grids...........................99
A.2.1 Critical decision factors for investment in mini-grids..............................100A.2.2 The regulatory environment for mini-grids in Niger................................101A.2.3 Different PPP structures for mini-grid investments.................................102A.2.4 Identifying high potential locations for mini-grids...................................104
App. B: Methodology & assumptions used for market sizing..................................107B.1 Households....................................................................................................107B.2 Public institutions..........................................................................................108
B.2.1 Educational institutions...........................................................................109B.2.2 Health facilities.......................................................................................110B.2.3 Public buildings.......................................................................................111
B.3 Agricultural irrigation....................................................................................112B.3.1 Large irrigation schemes.........................................................................113B.3.2 Small scale, individual irrigation schemes..............................................114
B.4 Crop processing............................................................................................117B.5 Water provision.............................................................................................118
Table of figuresFigure 1: Scope of research – market definition....................................................................10Figure 2: Focus group participants in Maradi.........................................................................13Figure 3: Brief country introduction.......................................................................................15Figure 4: Energy production in Niger.....................................................................................16Figure 5: Electricity tariffs in selected West African countries...............................................17Figure 6: Map of the grid network, centres isolés, and grid extension plans in Niger............18Figure 7: Map of electricity demand for selective consumer segments (annual demand in GWh)..................................................................................................................................... 23Figure 8: Overview of key insights gained from focus group discussions in Niger.................24Figure 9: Solar lantern and solar home system sales volume potential without consumer financing...............................................................................................................................28Figure 10: Solar lantern and solar home system market by Region without consumer financing...............................................................................................................................28
3

Open Capital Advisors
Figure 11: Solar lantern and solar home system sales volume potential with consumer financing...............................................................................................................................29Figure 12: Solar lantern and solar home system market by Region with consumer financing.............................................................................................................................................. 30Figure 13: Annual cost of basic lighting by different lighting alternatives.............................31Figure 14: Cost comparison of a LED flashlight with a solar lantern with phone charging capabilities............................................................................................................................32Figure 15: Cost comparison of a diesel generator with a basic solar home system...............33Figure 16: Scatterplot of annualized cost savings for schools in Niger..................................37Figure 17: Lifetime cost savings per solar street light...........................................................58Figure 18: The business environment in Niger......................................................................60Figure 19: Overview of recent key solar initiatives in Niger..................................................64Figure 20: Mobile penetration and mobile money uptake in Niger........................................71Figure 21: Key implementation steps for technical advisory services for solar operators.....85Figure 22: Summary of inputs to the financial projections for a solar business in Niger........87Figure 23: Key implementation steps for the grant funding program....................................96Figure 24: Summary of inputs to the financial projections for a solar water pump business in Niger.....................................................................................................................................98Figure 25: Grid reach and expansion potential in number of households............................103Figure 26: Map of Niger presenting off-grid energy demand by grid proximity...................104Figure 27: Example PPP models for mini-grids....................................................................110
4

Open Capital Advisors
Table of tablesTable 1: Overview of focus group discussions conducted......................................................12Table 2: Solar market size by different segments.................................................................21Table 3: Representative solar devices for market sizing.......................................................25Table 4: Attainable price points for solar systems by household expenditure decile (2016 est.).......................................................................................................................................26Table 5: Comparison of market size with and without 50% customs duties..........................34Table 6: Comparison of energy access with and without 50% customs duties......................35Table 7: Annualized cost savings from solar usage for different educational institutions......36Table 8: Number of schools and solar market size by region................................................38Table 9: Annualized cost savings from solar usage for different health facilities..................39Table 10: Number of health facilities and solar market size by region..................................40Table 11: Annualized cost savings from solar usage for different public buildings................41Table 12: Number of other public buildings and solar market size by region........................42Table 13: Overview of ONAHA’s large irrigation schemes by Region.....................................43Table 14: The business case for selective AHAs....................................................................44Table 15: Effect of pumping station size on the business case..............................................45Table 16: Different scenarios to present potential annualized market size...........................45Table 17: Overview of water and power needs of different farm sizes and water sources....47Table 18: Annualized cost savings from switching to solar-powered water pumps for irrigation...............................................................................................................................48Table 19: Total market size in annualized sales volume and revenues after affordability considerations.......................................................................................................................50Table 20: Annualized costs and cost savings from solar for different mill sizes....................51Table 21: Solar market for crop processing in Niger..............................................................52Table 22: Solar market size for crop processing at different processing levels.....................52Table 23: Average pump size, electricity consumption, and solar system size by pumping station................................................................................................................................... 54Table 24: Overview of annualized costs of different power alternatives for pumping stations.............................................................................................................................................. 55Table 25: Annualized cost savings of switching to solar power for water pumping stations. .56Table 26: Assumptions on alternative power sources for water providers.............................57Table 27: Solar market for water providers by water station type and region.......................57Table 28: Recommended interventions for standalone solar systems...................................79Table 29: Estimated funding requirements for an initial 2-year market development program.............................................................................................................................................. 81Table 30: Recommended areas for provision of technical assistance....................................83Table 31: Inventory financing facility capitalization requirements........................................89Table 32: Credit guarantee scheme for inventory financing facility exposure levels.............89Table 33: Consumer loan financing facility capitalization requirements................................91Table 34: Credit guarantee scheme for consumer finance loan facility exposure levels.......92Table 35: Revised cashflows after provision of working capital facilities...............................93Table 36: Facility capitalization requirements for RBF direct product subsidies....................94Table 37: Facility capitalization requirements for subsidized interest rates..........................94Table 38: Recommended grant structure to incentivize market entry and expansion..........95Table 39: Financial and impact performance projections for solar water pump distributor.. .99
5

Open Capital Advisors
Table 40: Solar pumping kits - Inventory financing facility and guarantee funding requirements.........................................................................................................................99Table 41: Solar pumping kits – Consumer finance loan facility and guarantee funding requirements.......................................................................................................................100Table 42: Nigerien localities by population size...................................................................101Table 43: The largest localities more than 20 kilometers of the grid...................................111Table 44: Range of solar systems included in analysis for public institutions......................115Table 45: Electronic appliances by school type...................................................................116Table 46: Assumptions on current electricity sources for schools.......................................116Table 47: Electronic appliances by type of health facility....................................................117Table 48: Assumptions on current electricity sources for health facilities...........................117Table 49: Electronic appliances by public building type......................................................118Table 50: Assumptions on current electricity sources for other public buildings.................118Table 51: Irrigation water needs and average flow capacities of pumping stations............119Table 52: Overview of solar system needs for selective AHA..............................................120Table 53: Breakdown of irrigated land by farm type (small scale, individual irrigation schemes).............................................................................................................................121Table 54: Irrigated land area by Region and breakdown of irrigated area by water source 122Table 55: Overview of pumping solutions for irrigation.......................................................123Table 56: Overview of key crops, and estimation of energy consumption for milling..........124Table 57: Overview of different mill sizes and milling capacities (theoretical construct).....125Table 58: Number of different water stations by region......................................................126Table 59: Water volume assessment by water point...........................................................126Table 60: Average borehole depth & surface pumping distance by region and water station............................................................................................................................................ 127Table 61: Pumping station size requirements in kW by type and Region............................128Table 62: Average pump size, electricity consumption, and solar system size by pumping station.................................................................................................................................128
6
Open Capital Advisors
1 Executive summary
For many years, Niger has been one of the poorest countries in the world, and in 2016, the United Nations ranked Niger as the second least developed country in the world based on its Human Development Index.1 Agriculture is the main source of income for around 90% of the population, and limited economic development and diversification translates into few prospects for work other than subsistence farming and herding.2
Access to electricity is a key enabler of economic development, and has a significant positive impact on living conditions and security within communities. In Niger, only around 10% of the overall population and 1% of the rural population have access to electricity from the grid. Grid-connections experience frequent brownouts and blackouts, and the grid supply is heavily dependent on energy imports. Despite efforts to increase generation and grid connectivity, the grid is unlikely to meet Niger’s increasing energy demand. Efforts to extend the grid are impeded by low population densities and purchasing power: an estimated 27% of the Nigerien population live in localities with a population of less than 500 people, and further 42% in localities with a population ranging from 501 to 2,000.
Our analysis finds that around 33% of households in Niger are off-grid but live within 5 kilometers of the grid, and should therefore be well suited for relatively inexpensive grid extension initiatives, despite these challenges. In contrast, around 17% of households are situated beyond 20 kilometers from the grid, and are unlikely to be reached by the grid for many years, and as a result represent an opportunity for off-grid solutions, including solar.
This report assesses the market opportunity for off-grid solar for selected customer segments, including private households, public institutions, large- and small-scale irrigation schemes, crop processing, water provision and public street lights. Our analysis of each segment shows that there is a significant market opportunity for solar products, estimated at around US $ 200 million per year. The largest market segment is water providers, who could use solar technology for water pumping, both to lift water out of boreholes, and to distribute it to delivery points. The second largest segment is private households. Currently, the preferred lighting option of off-grid households in Niger are LED flashlights, and our analysis shows that households can achieve significant cost savings from switching from LED flashlights or generators to solar technology.
1 United Nations Development Programme: Human Development Report 2016; available at http://hdr.undp.org/en/2016-report/download2 CIA: The World Factbook, Country Report Niger; June 2017; available at https://www.cia.gov/library/publications/the-world-factbook/geos/ng.html
7

Open Capital Advisors
This represents an interesting market opportunity for solar home systems and solar lanterns meeting Lighting Global Quality Standards (formerly known as Lighting Africa Quality Standards), but unlocking this market in one of the world’s poorest countries, will require significant increases in access to consumer financing. Consumer finance allows the poorest households to enter the market, and those already in the market to afford larger, more versatile systems. After water providers and households, the third largest market segment is small scale irrigation. Irrigation is currently performed mostly manually, or by operating costly diesel-powered generators, leaving an opportunity to serve farmers with small solar water pumping kits to make the irrigation process more effective and efficient.
After this paper establishes the existence of a significant market opportunity for solar products, the supply side and ecosystem is assessed to understand any potential barriers holding back the solar market in Niger. In depth market research and consultations with many stakeholders has revealed that the solar supply side in Niger is in a very early stage of development. The majority of Nigerien solar businesses only offer contract work for large institutional clients, including community electrification projects, solar street lights, and solar water pumping facilities. Total’s Awango program is currently the only active supplier of solar lanterns meeting Lighting Global Quality Standards in the market, and a previous attempt by one business to distribute solar lanterns and solar home systems directly to private households was short lived due to a range of operational and financial challenges. In the absence of a formal market, distribution of small solar devices is dominated by the informal sector. Products sold in the informal sector are often of low quality and limited durability, which has had significant negative impacts on the market’s perception of solar; in addition, as these products typically avoid taxation and duties, informal traders are able to dramatically undercut the prices of sellers of quality-verified products with similar specifications.
Reflective of its 150th position in the World Bank’s ‘Ease of Doing Business’ ranking in 2016, businesses in Niger face a whole range of challenges. Consultations with solar businesses active in Niger identified the following key challenges to scaling the solar market:
(i) Excessive levels of taxation and import duties; (ii) Limited access to corporate finance; (iii) Low consumer purchasing power and lack of consumer finance;(iv) Lack of established partners for distribution and maintenance; (v) Competition from informal players and market spoilage; and(vi) Low mobile money penetration limiting the potential of MNO-Solar business
partnerships for payments and distribution.
These many challenges lead international solar players to prioritize more attractive opportunities elsewhere. Generally, established operators prefer markets with larger populations, higher levels of purchasing power, and a more developed private
8

Open Capital Advisors
sector for distribution and financing partnerships. As a result, solar market stimulation efforts in Niger will need to target local rather than international businesses, at least in the near-term.
Finance, both for businesses and consumers will be key to rapid market acceleration. In 2015, Niger had 11 commercial banks and 42 microfinance institutions, but only 6.7% of the population had bank accounts (both banks and MFIs).3 Consultations unanimously revealed that accessing finance as an SME in Niger is very challenging and subject to prohibitive terms, especially as the solar sector is often seen as too early-stage to finance at its current state. In addition, a broader availability of Sharia-compliant financial services will be required to reach businesses and the population at scale.
Rapid improvement to the low electrification rates in Niger only appears possible through an approach leveraging multiple delivery technologies, including the grid. In simple terms, off-grid solutions can be broken down into two categories: (i) community level solutions, such as mini-grids, and (ii) household level solutions, such as solar home systems and solar lanterns. Mini-grids are, especially in remote rural areas with low population densities, surrounded with concerns about market potential, business viability, and long times to break-even. These sustainability concerns are often accompanied with an underdeveloped, non-transparent and unpredictable regulatory environment, which restrains private sector investment in mini-grids. Despite the new electricity code in Niger, the regulatory framework - especially for mini-grids, which are not specifically covered in the code - remains ambiguous. One strategy to encourage private sector investment for mini-grids will be the promotion of public-private partnerships to align interests and de-risk investment for the private sector.
But, similarly to grid extension, the construction of mini-grids will be slow to implement, and will only benefit small population pockets. Therefore, to reach the off-grid population more broadly in the short term, we recommend focusing initial interventions on market stimulation for small household systems and solar pumping kits4. The general market sensitization and ecosystem development required for this will likely provide collateral benefits to the whole solar market. More specifically, we recommend implementing an integrated market development program covering the following interventions:
(i) Tax and duties exemption on solar technology,(ii) Consumer education programs,(iii) Inventory and consumer loan financing facilities,(iv) Credit guarantee schemes for the inventory and consumer loan financing
facilities,3 Financial Sector Reform and Strengthening Initiative (FIRST), The Program Management Unit, Improving Access to Financial Services in Niger, 20164 Small solar pumping kits are sold as ‘complete solution packages’, which include a pump and the solar system to power the pump (integrated sets).
9

Open Capital Advisors
(v) Market entry and expansion grants, and(vi) Technical assistance for the government, financial sector, solar companies,
MNOs and solar technicians.
The combination of these efforts has the potential to help overcome barriers on both the supply and demand side, and to support the acceleration of market growth at this early development stage of the solar market in Niger.
2 Introduction & methodology
This report aims to describe the market opportunity for solar products in Niger and to provide recommendations on government and development sector initiatives to stimulate rapid private sector growth. After the executive summary (chapter 1), and this chapter, which describes the aim and methodology of the research (chapter 2), our analysis is structured as follows: we first assess the current state of on-grid electricity access in Niger, discussing power generation, consumption, grid distribution and planned grid extension, as well as the opportunity for further grid extension and mini-grids (chapter 3). Next, we estimate the potential market for off-grid solar products (chapter 4); we explore a range of different market segments that we believe together capture the majority of the solar opportunity, including households, public institutions, and productive users. These segments are summarized in Figure 1 below. All our demand analysis is conducted at the Commune level, based either on actual data or best-estimate assumptions where concrete data is unavailable.Figure 1: Scope of research – market definition
10

Open Capital Advisors
Our analysis for each individual segment is supported by detailed financial models that calculate the potential cost savings (or lack thereof) for switching to solar technology, and the ensuing overall market opportunity. These models are based on information from a combination of intensive secondary research, three site visits to Niger, as well as ongoing consultations both in Niger and elsewhere.
In chapter 5, we provide a detailed overview of the supply side and the ecosystem for businesses operating in the Nigerien solar sector. We provide a high-level overview of the current activities of Nigerien private sector solar businesses and how well these are aligned with achieving rapid, market-led growth. We also explore the broader ecosystem for complementary actors in Niger, providing an assessment based on information collected from secondary research and dozens of stakeholder consultations in Niger. The ecosystem assessment includes:
the financial services sector, including banks and MFIs active in Niger, to understand the consumer and corporate finance landscape and levels of access to finance; and
Mobile network operators (MNOs), in particular their potential and appetite for partnerships with solar businesses (e.g. for mobile money transactions, distribution and marketing).
We then synthesize these findings to determine the key barriers currently impeding market growth of the solar sector in Niger (chapter 6).
We believe that significant levels of government and development sector intervention will be required to support the market and stimulate rapid growth. Based on our analysis, the two sectors most primed for rapid market-led growth are household solar devices and solar irrigation. Our recommended interventions therefore focus on overarching systemic interventions, financial interventions for the solar home systems market, and financial interventions for the agricultural solar pumping kit market. We also size these interventions and suggest potential delivery mechanisms where appropriate (chapter 7).
In addition to the main report, the appendices contain an assessment of the opportunity for grid expansion, assessing how many households are within 5km and 10km reach of the current network, and estimating investment levels required to reach these households (Appendix A.1). We further look at the opportunity for developing mini-grids, discussing critical decision factors for investment, the regulatory environment in Niger, and different PPP structures for investment in mini-grids. We also assess the size and type of demand for energy and solar in each Commune, with the aim of identifying a shortlist of localities with sufficient demand (and distance to the current and future grid) to be well-suited as locations for new mini-grid construction (Appendix A.2). We then provide details on the methodology used and key assumptions made for assessing the business case and market size
11

Open Capital Advisors
for each of the potential market segments (Appendix B), followed by draft terms of reference for fund managers and technical assistance providers (Appendix C).
Methodology
The findings in this report are the result of intensive secondary market research, more than thirty stakeholder consultations, and six focus group discussions. Consultations were held with diverse industry stakeholders both in Niger and internationally to gain a broad understanding of the market, including:
• Solar market players,• Other importers and distributors,• Government authorities,• Development organizations,• Commercial banks,• Microfinance institutions, and• Mobile network operators.
To gain a detailed understanding of market perceptions and preferences for solar products, we further conducted six focus group discussions in Niamey, Tahoua and Maradi. The focus group discussions were held in semi-urban and rural areas:Table 1: Overview of focus group discussions conducted
Region Locality Context
Niamey Koubia Keyna Semi-urban, off-gridBongoula Rural, off-grid
Tahoua Bazaga Rural, off-gridGari Isaa Semi-urban, off-grid
Maradi Baratoua Rural, off-gridRiadi Safo Semi-urban, on-grid
On average, the focus groups had 15 participants each, who were selected to ensure a diverse mix of perspectives to be able to gain broad insights on perceptions and preferences. The only on-grid locality was Riadi Safo; in this focus group around 30% of participants had household grid access. Overall, around 10% of participants are currently using, or have used, solar products, compared to 90% without any direct solar usage experience. Around 35% of participants were female, and ages ranged from under 20 to over 60, with a strong concentration between (i) 20 to 40 years of age (48%), and (ii) between 40 to 60 years (43%).
12

Open Capital Advisors
Figure 2: Focus group participants in Maradi
3 Grid power and grid expansion
Access to electricity in Niger remains among the lowest in Africa. Only around 10% of the population has access to electricity from the grid, far below the Sub-Saharan Africa average of 31%. Grid access to electricity is largely concentrated in urban areas: around 70% of the population living in Niamey have access to electricity, while only 1% of the rural population currently has access to electricity.5
Even for grid-connected consumers, however, power access is highly sporadic. Brownouts and blackouts are extremely frequent due to low generation capacity and underdeveloped infrastructure, and continue to drive heavy reliance on energy imports and back-up power solutions, mostly diesel generators.
There are already many detailed, informative reports on the state of grid electricity in Niger. We therefore only provide a brief summary in this chapter to set the context for the market opportunity for solar solutions.
In the course of our research, we also assessed the opportunity of reaching localities with high demand density through grid extension or construction of mini-grids. Our research revealed that in addition to the estimated 11% of households currently on-grid, an estimated additional 33% live within 5km of the grid, and might therefore be well suited for relatively inexpensive grid extension initiatives in line with the Sociéte Nigerienne d’Electricité’s (NIGELEC) broad objective to electrify communities within 5km of the current grid. An additional 39% of households are within 5-20km of the grid and may still be accessible, but at increasing costs. Finally, 17% of households are situated over 20km from the grid, and are unlikely to be grid-connected in the near term in the absence of significantly more substantial investment in infrastructure.
5 World Bank, World Bank help to Increase Access to Electricity in Niger (Dec. 16th, 2015) available at http://www.worldbank.org/en/news/press-release/2015/12/16/world-bank-help-to-increase-access-to-electricity-in-niger
13

Open Capital Advisors
Based on our analysis, we estimate total costs of approximately US $1.1 billion to extend grid access to the one million off-grid households within 5km of the grid, or around US $1,100 on average, per household. An estimated 460,000 households are situated 5-10km of the grid, and to reach these would require an additional estimated investment of approximately US $ 1.3 billion (around US $ 2,900 per household). Finally, around 785,000 households are estimated to be between 10-20km of the grid. To reach these would require an estimated investment of US $ 4.7 billion dollars, or around US $ 6,000 per household. These costs only reflect the immediate costs of grid line extension and household connections, but exclude the cost of producing more energy. Further details on this analysis are provided in Appendix A.1.
Given the costs, many geographic areas in Niger are unlikely to be reached by the grid in the short- to medium-term, and therefore represent an opportunity to be served by off-grid solutions. While individual microsystems have the potential to positively change the current electricity landscape in Niger, they are unsuited for many commercial applications, are often difficult and costly to distribute, and the upfront investment requirements often limit the affordable energy consumption profile. An additional alternative to individual microsystems are mini-grids; they typically operate on a community scale, and are managed by an independent provider selling energy as a utility service. We further explore this topic in Appendix A.2, looking at critical decision factors for investment in mini-grids, the regulatory environment for mini-grids in Niger, different PPP structures for mini-grid investments, and the process for identifying high impact potential locations for mini-grids.
14

Open Capital Advisors
15
A brief introduction to NigerNiger is divided into 8 regions, 63 departments and 266 communes. In 2015, Niger’s population was estimated to be 19.9 million people with approximately 82% classified as rural and residing along the River Niger basin and the southern border with Nigeria. In the same year, the national average population density was at 15.7 inhabitants per square kilometer, less than half the African average.
Niger’s economy largely depends on agriculture and services. In 2015, GDP (constant 2011 US$) was recorded at US$ 17.8 billion with the livestock and agriculture sector accounting for 36% and employing more than half of the total population. The mining sector, while politically significant, accounts for only 0.6% of GDP.
Poverty is widespread with around 75% of the population living on an income below $3.10 a day, and 50% living below $1.90 a day; around 90% of the poor live in rural areas. Niger remains one of the poorest countries in the world, ranking last in the 2014 Human Development Index (HDI) of the United Nations Development Program. A significant share of the population survives on subsistence farming, which is becoming increasingly challenging due to declining and erratic rainfall and a concomitant reduction in arable land area.
Niger shares the West African CFA Franc with 7 other West African states. The currency averaged at 591 CFA Franc for one US$ in 2015 with a high of 624 CFA Franc and a low of 542 CFA Franc in the same period while inflation during the same period was low at 1%.
Source: World Bank, World Development Indicators; World Bank: “Niger Overview,” (April 13, 2016); United Nations Department of Economic and Social Affairs
Figure 3: Brief country introduction

Open Capital Advisors
3.1 Generation & consumption
Five distinct generation companies make up Niger’s total 172 MW on-grid capacity, as shown in Figure 4. NIGELEC, the principal state energy company and utility accounts for about 50% of generation.6 Other power generation companies include a range of regional providers and IPPs, many of which supply energy predominantly to uranium mines, refineries, and other large industrial clients. The vast majority of this power comes from traditional fossil fuels, with oil and coal accounting for close to 98% of all generation in Niger.7 The remaining 2% is made up of smaller PV installations servicing clients such as telco towers, more affluent private households, and isolated community installations (mini-grids).
Besides the grid network, around 80 decentralized mini-grids supply electricity at service levels ranging from continuous power to only a few hours of power per day. These mini-grids are diesel generator-powered systems with generation capacities ranging from around 25-100 kW. Due to the combination of high operating costs of diesel-based power generation, and low affordability of end-consumers in rural communities, all currently active decentralized mini-grids are loss making.8
Only around 50% of Niger’s installed capacity goes to public consumption, the rest supplies mines and other industrial uses. As a result, Niger is highly dependent on power imports from neighboring countries, particularly Nigeria. Power imports range between 130 MW and 190 MW9, and NIGELEC reports total sales of 1,024 GWh in 2015, of which around 77% was sourced from Nigeria.10 This imported power is generally cheap at a wholesale price of around US $0.04 per kWh11. Local production in Niger is significantly more expensive. NIGELEC purchases electricity from Nigerien oil-powered plants at US $0.22/kWh and from coal-powered plants at
6 International Renewable Energy Agency (IRENA), Niger Renewable Readiness Assessment (2013), available at http://www.irena.org/DocumentDownloads/Publications/RRA_Niger.pdf7 Ibid8 OCA Consultations and NIGELEC data9 Ibid10 Societé Nigerienne d’electricité NIGELEC (June 2016), Plan d’affaires 2016-202711 International Renewable Energy Agency (IRENA), Niger Renewable Readiness Assessment (2013), available at http://www.irena.org/DocumentDownloads/Publications/RRA_Niger.pdf
16
Figure 4: Energy production in Niger
Source: Niger Renewable Readiness Assessment (2013)

Open Capital Advisors
US $0.12/kWh12. Consequently, incentives to expand domestic power generation have been limited.
Electricity consumption in Niger is generally low. In 2013, per capita electricity consumption was less than 50 kWh13 against an African average of 575 kWh and a global average of over 2,770 kWh.14 This makes the average Nigerien citizen among the lowest consumers of electricity in the world. However, over the period 2001-2014 electricity consumption in Niger grew at an average 8.5% per year, much faster than the GDP growth of about 4%.15
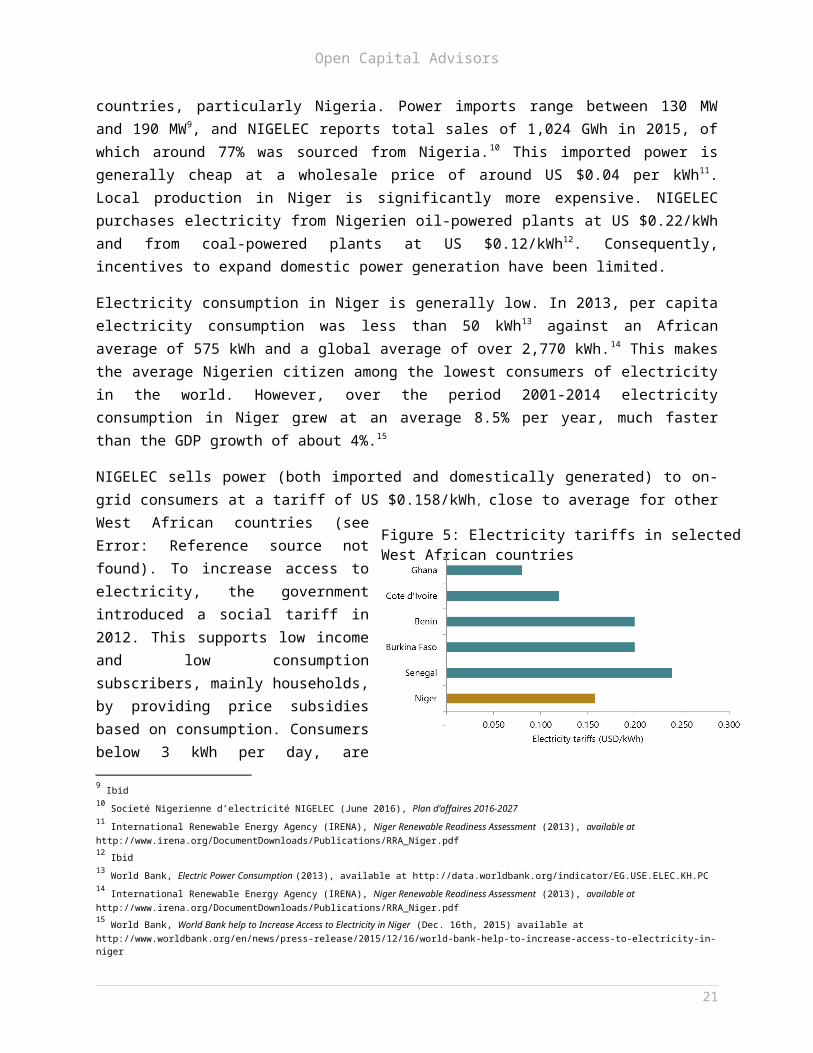
NIGELEC sells power (both imported and domestically generated) to on-grid consumers at a tariff of US $0.158/kWh, close to average for other West African countries (see Figure 5). To increase access to electricity, the government introduced a social tariff in 2012. This supports low income and low consumption subscribers, mainly households, by providing price subsidies based on consumption. Consumers below 3 kWh per day, are charged US $0.11/kWh for the first 50 kWh of electricity consumed. Fixed concessionary rates also apply to industrial consumers (US $0.11/kWh) and agricultural facilities (US $0.07/kWh).16
3.2 The current grid network and efforts to increase grid access
Figure 6 shows the current reach of the grid and community-level mini-grids (“centres isolés”) in Niger, as well as planned grid extension based on information provided by NIGELEC. Although the grid currently only reaches under 11% of the population and only covers a small portion of Niger’s total area, a significant share of the off-grid population lives within relatively close distance to the grid due to high population concentration the south and south-west of the country. Nonetheless, NIGELEC currently distributes electricity to only around 300,000 client connections, most of which experience frequent power outages.17
12 Ibid13 World Bank, Electric Power Consumption (2013), available at http://data.worldbank.org/indicator/EG.USE.ELEC.KH.PC14 International Renewable Energy Agency (IRENA), Niger Renewable Readiness Assessment (2013), available at http://www.irena.org/DocumentDownloads/Publications/RRA_Niger.pdf15 World Bank, World Bank help to Increase Access to Electricity in Niger (Dec. 16th, 2015) available at http://www.worldbank.org/en/news/press-release/2015/12/16/world-bank-help-to-increase-access-to-electricity-in-niger16 Ibid17 Societé Nigerienne d’electricité NIGELEC (June 2016), Plan d’affaires 2016-2027
17
Figure 5: Electricity tariffs in selected West African countries

Open Capital Advisors
Figure 6: Map of the grid network, centres isolés, and grid extension plans in Niger18
18 This map serves to give an indicative picture only; the accuracy of geographic location of the grid, extension plans, and centres isolés is limited by the quality of available data.
18

Open Capital Advisors
The Nigerien Government, in partnership with various development partners and governments, has begun projects to increase the supply of electricity and extend the grid. Further major projects are motivated by Niger’s membership in the West African Power Pool (WAPP) based on an agreement to participate in the generation and transmission of electricity in the region. WAPP expansion projects are led by the countries’ respective utility companies.
In June 2016, NIGELEC reported its strategic plan for the years 2016-2027, which provides an overview of efforts to expand grid energy supply. The most notable ongoing and planned construction projects to increase production include:19
80MW thermal power plant in Goroubanda; operations to start late 2016 or early 2017
130MW hydroelectric plant at Kandadji; operations expected to start in 2022 (initially planned for 2015)
200MW (expandable to 600MW) coal plant at Salkadamna; operations expected to start in 2022 (initially planned for 2016)
Multiple solar PV power plants including (i) 20MW in Guesselbody; (ii) 20MW in Goroubanda; (iii) 10MW in Maradi; (iv) 7MW in Malbaza; and (v) 5MW in Zinder
60MW thermal power station near Zinder (SORAZ) 12MW thermal power station in Maradi 18MW thermal power station in Malbaza
In addition to increasing supply over the coming years, the strategic plan also includes notable grid extension projects. These include plans to extend transformation and distribution, and interconnect current grid access zones to allow better servicing of zones with production deficits. Ongoing and planned transmission line extensions include:
330kV transmission lines, agreed by WAPP, that connect Niger to Nigeria, Burkina Faso, Benin and Togo; completion planned for 2022, with first priorities being:
o The “dorsale Nord” project to connect Birnin-Kebbi (Nigeria), Niamey (Niger), Ouagadougou (Burkina Faso), and Malanville (Benin)
o Interconnection of zones by constructing a 330kV transmission line from Niamey to Salkadamna
Multiple 132kV lines, including among others, connections of: (i) Salkadamna, Tahoua, Malbaza and Maradi; (ii) Kandadji to Niamey; and (iii) Zinder to Tanout
19 Societé Nigerienne d’electricité NIGELEC (June 2016), Plan d’affaires 2016-2027
19

Open Capital Advisors
Beyond those already covered by the grid extensions mentioned above, NIGELEC is also currently considering extending the grid to reach the community-level mini-grids, and connecting these to the grid.20
Further projects are currently focusing on increasing the number of households reached close to the major transmission and distribution lines; i.e. branching off the artery lines into substations and small distribution lines. For many of these projects, the government and NIGELEC are receiving considerable support – both financial and technical – from international development banks and agencies. Some of the most notable projects to increase rural energy access include:“Programme special d’electrification du President de la Republique”. This government program was launched in 2011, with the goal of electrifying 500 villages by 2016, i.e. to reach an additional 100 villages each year, with these typically being situated within 5 km of the current grid infrastructure. The goal of reaching 100 villages per year will increase to 200 villages per year from 2017 onwards.
Electricity Access Expansion Project (NELACEP). In December 2015, the World Bank approved an IDA credit of US $54.5 million and a grant of US $10.5 million to increase energy access in Niger. The funding will be used to finance NIGELEC investments in distribution, with a focus on increasing grid density, through short leader line extensions, in seven major urban areas, including Niamey; the project is expected to benefit around 330,000 people, including households, small business, and public institutions.21 AFD program to expand electricity access in Niamey. This program is run by the French Development Agency (AFD) and aims to extend urban electricity distribution, with a focus on providing electricity in several currently off-grid peri-urban neighborhoods of Niamey.22 An additional AFD program focused on rural grid extension is currently in planning.
In addition, the new Electricity Act called for the establishment of further authorities to promote rural electrification and regulate the energy sector. This led to the creation of the National Agency for the Promotion of Electrification in Rural Areas (ANPER) in January 2015, whose main mandate is to extend electricity access into rural areas of Niger.
20 OCA Consultations21 The World Bank, World Bank help to increase access to electricity in Niger (December 16, 2015), available at http://www.worldbank.org/en/news/press-release/2015/12/16/world-bank-help-to-increase-access-to-electricity-in-niger22 AFD Website, Energy context in Niger, http://www.afd.fr/home/pays/afrique/geo-afr/portail-niger/nos-projets/energie-3
20
Open Capital Advisors
4 The market opportunity for stand-alone solar systems
In this section, we attempt to estimate demand for solar technology for a range of market segments. For each segment, we compare the costs of using solar technology against conventional energy sources (diesel generators, the grid, candles and kerosene, etc.) to determine whether there is a business case for solar. For private households, the “business case” is determined by current expenditure on energy-related products.
We map this demand at the Commune level, using either direct Commune data or allocating regional or national-level data based on population or other relevant metrics. Table 2 summarizes the overall annualized market size estimated for the different segments at the national level.Table 2: Solar market size by different segments23
SegmentEstimated annualizedmarket size 24
ThereofLighting Global
Thereofsolar pumping kits
Private households 25 US $ 56.5 million US $ 56.5 millionSchools US $ 1.6 million US $ 1.4 millionHealth centers US $ 0.4 million US $ 0.1 millionPublic buildings US $ 0.4 millionLarge irrigation schemes US $ 1.2 millionSmall scale irrigation 24 US $ 33.4 million US $ 29.5 million
Crop processing26 US $ 12.5 millionWater provision US $ 96.6 million27
Street lights US $ 1.0 million28
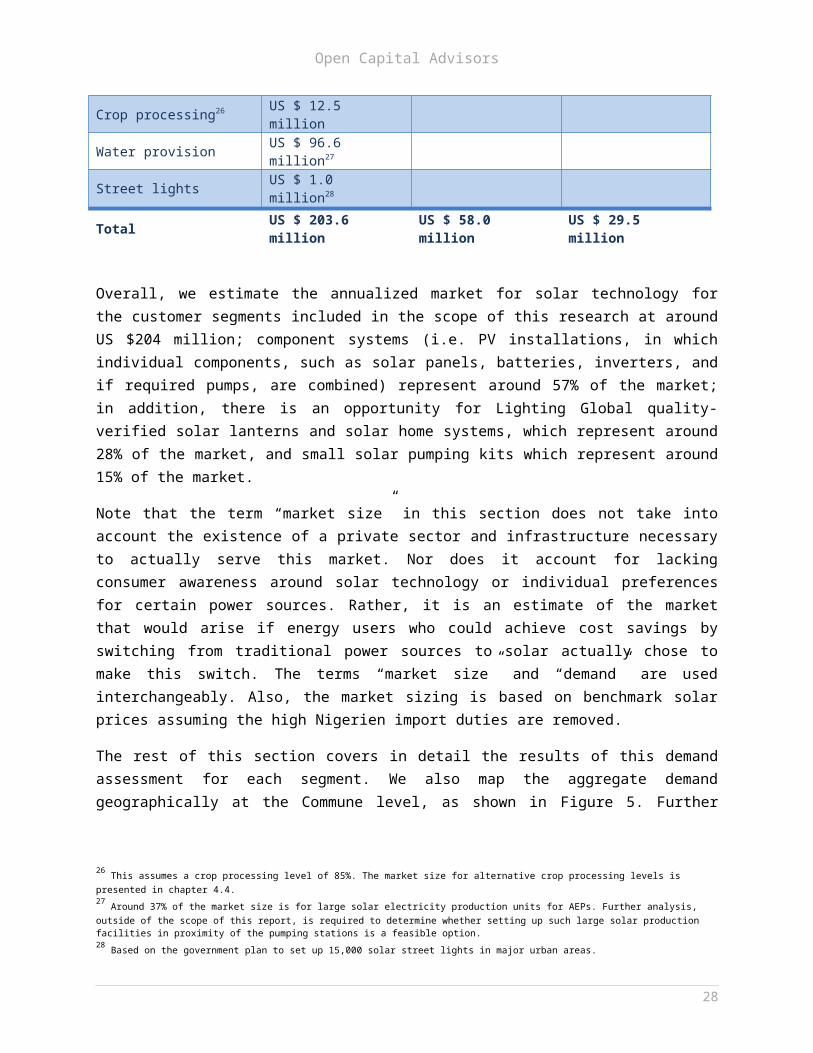
Total US $ 203.6 million US $ 58.0 million US $ 29.5 million
23 All market size estimations are indicative only and based on the best available data; in absence of quality data for many markets, the analysis is substantially driven by assumptions. Further information can be found within the respective chapters.24 The annualized market size is defined as the maximum sales revenues achievable in any given year if all potential customers are accessible, interested, and there are no further barriers (e.g. affordability) preventing the transaction. ‘Annualized’ refers to the average annual sales potential under consideration of product lifetimes. If for example 100 households want to buy a solar system, and the solar system has an expected lifetime of 5 years, then the ‘annualized’ sales volume is 20 units (100 units divided by 5 years). 25 The market size shown assumes that consumer financing schemes are available for solar lanterns, solar home systems and solar pumping kits for smallholder farmers. The availability of consumer financing schemes makes the market accessible for many households that would not be able to afford the same product in an over-the-counter cash transaction. Further information on consumer financing is provided in the relevant chapters. 26 This assumes a crop processing level of 85%. The market size for alternative crop processing levels is presented in chapter 4.4. 27 Around 37% of the market size is for large solar electricity production units for AEPs. Further analysis, outside of the scope of this report, is required to determine whether setting up such large solar production facilities in proximity of the pumping stations is a feasible option.28 Based on the government plan to set up 15,000 solar street lights in major urban areas.
21

Open Capital Advisors
Overall, we estimate the annualized market for solar technology for the customer segments included in the scope of this research at around US $204 million; component systems (i.e. PV installations, in which individual components, such as solar panels, batteries, inverters, and if required pumps, are combined) represent around 57% of the market; in addition, there is an opportunity for Lighting Global quality-verified solar lanterns and solar home systems, which represent around 28% of the market, and small solar pumping kits which represent around 15% of the market.
Note that the term “market size” in this section does not take into account the existence of a private sector and infrastructure necessary to actually serve this market. Nor does it account for lacking consumer awareness around solar technology or individual preferences for certain power sources. Rather, it is an estimate of the market that would arise if energy users who could achieve cost savings by switching from traditional power sources to solar actually chose to make this switch. The terms “market size” and “demand” are used interchangeably. Also, the market sizing is based on benchmark solar prices assuming the high Nigerien import duties are removed.
The rest of this section covers in detail the results of this demand assessment for each segment. We also map the aggregate demand geographically at the Commune level, as shown in Figure 7. Further information on the methodology and assumptions made for this analysis is presented in Appendix B.
22

Open Capital Advisors
Figure 7: Map of electricity demand for selective consumer segments (annual demand in GWh)29
29 This map serves to give an indicative picture only; the accuracy of geographic locations is limited by the quality of available GIS-data.
23

Open Capital Advisors
4.1 Households
Private households present a huge potential market segment for solar in Niger. With nearly 90% of Niger’s households off-grid, domestic solar solutions have the potential to transform the country’s household energy access landscape. Given the extreme levels of poverty in Niger, however, this market depends crucially on the ability of solar providers or banks and MFIs to provide consumer finance30.
30 Consumer financing is defined as the availability of any type of lending scheme that enables buyers of solar products to spread the initial purchase price over a longer repayment period; i.e. it refers to schemes that grant credit to consumers to enable them to possess solar products. One form of consumer financing is the “Pay-as-you-go” (PAYG) concept which allows consumers pay in installments rather than upfront; in many cases the installment payment activates the device for usage.
24
Key insights from focus groups held in Niger Across all 6 focus groups, only 8 of around 90 participants (~ 9%) use or have used
solar products, all of them low-quality imitation brands; of the 8 solar users, 3 used solar lanterns, and 5 used small solar home systems.
Across all socio-economic levels, LED flashlights are the main source of lighting for off-grid households (90% of participants); a few more affluent households use fuel generators or solar home systems.
The three key reasons for the limited uptake of solar products are:1. Non-availability. Some participants did not think solar products were available
in Niger yet.2. Affordability. Many of the participants earn below US $2 per day, so solar
products are perceived as very expensive; only few participants were aware of consumer financing schemes.
3. Quality of solar products. Users and non-users of solar products alike, all think of small solar products as non-durable. Solar lanterns often break in less than a month, and the solar home systems require frequent, expensive battery replacements, often every 6 months.
In other cases, solar traders demanded upfront payments and never returned, leading to mistrust of solar vendors.
Many participants would purchase solar if good products were available and affordable
Solar was often considered as brighter, safer, and cheaper in the long run than alternatives
Strong demand for domestic mobile phone charging, mainly to save costs, but also for convenience
Participants would access microfinance for solar purchases if available Solar products are supposedly easiest to purchase from the ‘Grand Marché’ in Niamey,
or in small town markets close to the Nigerian border.
Figure 8: Overview of key insights gained from focus group discussions in Niger
Open Capital Advisors
We conducted a market sizing analysis for the Nigerien market, examining (i) off-grid private households, and (ii) on-grid private household as a potential market for grid backup solutions. Due to the widespread poverty and generally low income levels, the key consideration for estimating the market size is affordability. Consequently, the market size was determined using national household expenditure distribution data combined with data on average household expenditure on lighting-related products.
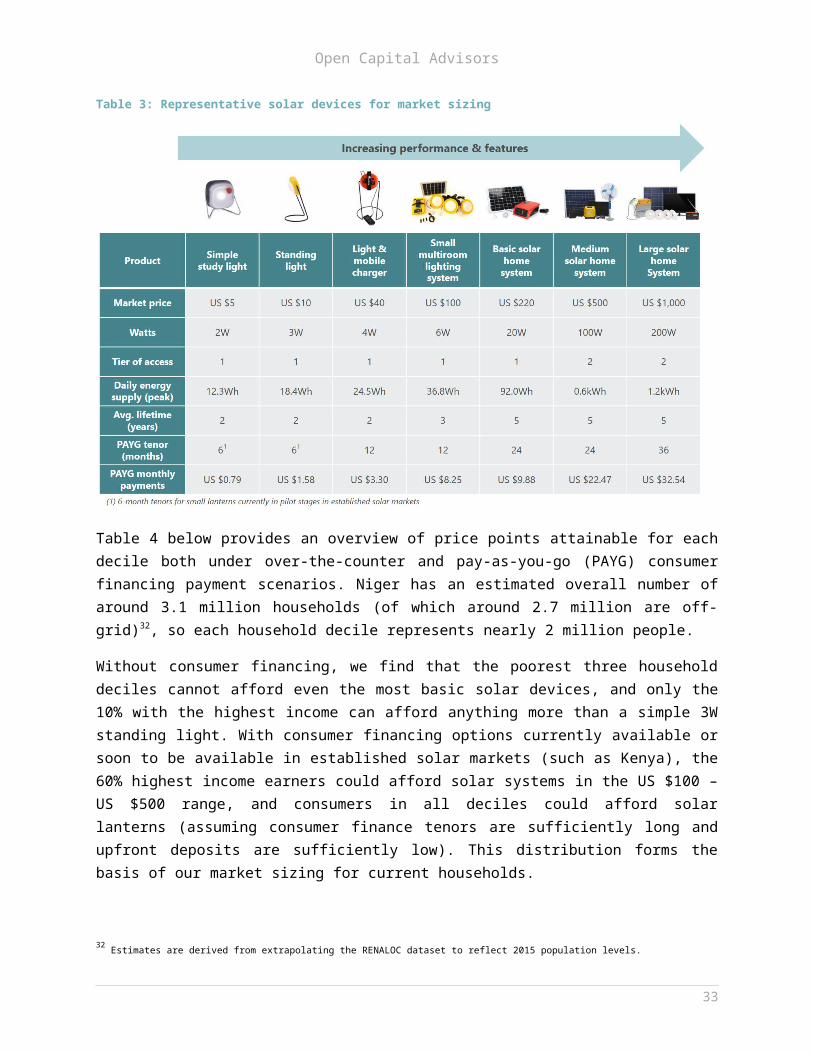
To ensure sufficient granularity in matching appropriate solar products to expenditure deciles, the market sizing includes a broad range of products ranging from simple study lights at US $5 that can provide up to 4 hours of lighting to large solar home systems (200W) at US $1,000 that can power more energy-intensive household appliances for many hours; the solar devices are summarized in
below. Note that this analysis does not yet take into account whether these products are currently available in Niger or what would be required to introduce them to the Nigerien market, but rather estimates a potential market that could theoretically be served at regional benchmark solar price points.31 Table 3: Representative solar devices for market sizing
Table 4 below provides an overview of price points attainable for each decile both under over-the-counter and pay-as-you-go (PAYG) consumer financing payment
31 These prices are benchmarks from other African countries where solar products are import duty exempt.
25

Open Capital Advisors
scenarios. Niger has an estimated overall number of around 3.1 million households (of which around 2.7 million are off-grid)32, so each household decile represents nearly 2 million people.
Without consumer financing, we find that the poorest three household deciles cannot afford even the most basic solar devices, and only the 10% with the highest income can afford anything more than a simple 3W standing light. With consumer financing options currently available or soon to be available in established solar markets (such as Kenya), the 60% highest income earners could afford solar systems in the US $100 – US $500 range, and consumers in all deciles could afford solar lanterns (assuming consumer finance tenors are sufficiently long and upfront deposits are sufficiently low). This distribution forms the basis of our market sizing for current households. Table 4: Attainable price points for solar systems by household expenditure decile (2016 est.)
Based on our analysis, we estimate the annualized market for solar lanterns and solar home systems at around US $12 million in the absence of consumer financing, representing an annual sales volume potential of around 760,000 units, for the most part consisting of entry-level solar lantern products; of these, we estimate around 630,000 units are sold to off-grid customers, representing nearly 25% of off-grid households. Based on our analysis and assumptions made, consumer financing would unlock an additional US $44 million in annual market size, reach an additional 460,000 households each year, increase total off-grid household reach to above 40% per year, and raise levels of energy access to include more sophisticated solar home systems. Further details on the analysis are presented in the next two 32 Estimates are derived from extrapolating the RENALOC dataset to reflect 2015 population levels.
26

Open Capital Advisors
chapters, first for the over-the-counter market, and then for consumer financing. The methodology is described in detail in Appendix B.1.
4.1.1 Market for solar home devices with no consumer finance
In the absence of consumer finance options – that is assuming that consumers have to pay the full cash value for products up-front – we estimate the total market for solar home devices in Niger at around US $12 million. Figure 9 breaks the market size down by product; in the absence of financing, almost 80% of this market in terms of units is in the form of small standing lights, which also make up around 50% of the market in terms of value. The small light and mobile charger makes up nearly 20% of the remaining sales volume (and 49% of market size).
With an annual sales volume of around 2,000 units of the small multi-room lighting system, the market for solar home systems without consumer financing is negligible, which is unsurprising given Niger’s low income levels. Somewhat counter-intuitively, this analysis shows no market for the cheapest device considered, simple study lights. This is mostly an artefact of our modelling, however, as the decile boundaries and our pricing assumptions happen to be such that the lowest income levels are either excluded from the market entirely or can afford the standing light. Similarly, while Table 4 shows that, based on average expenditure levels, the 4th decile can at most afford the simple study light in over-the-counter transactions, no Nigerien commune matches the national average -- the commune level analysis reveals that there are no sales of the simple study light. As it happens, this aligns well with consumer focus group and consultation insights, that consumers want slightly larger lanterns, ideally with phone charging capabilities, and the simple study light does not offer sufficient features to compete with the cheaper informal market products.
27
Open Capital Advisors
Figure 9: Solar lantern and solar home system sales volume potential without consumer financing
The demand distribution across regions (Figure 10) broadly reflects larger populations and higher concentration of agricultural wealth in Niger’s south and south east, with the exception of Niamey, which has a much higher grid connection rate than other regions (72% vs. 16%).
Note that dividing consumer expenditure into deciles (or any discrete number of expenditure buckets) means that inevitably some detail is lost, particularly at the extremes of the distribution. In all likelihood, there will be a long tail of more affluent off-grid households in the top decile that is able to afford large solar home systems or home installations. In absolute terms, however, we would expect this to only have a marginal impact on overall market size.
28
Figure 10: Solar lantern and solar home system market by Region without consumer financing

Open Capital Advisors
As mentioned, in the absence of exact data about consumers’ attitudes to saving, this analysis assumes that if consumers are sufficiently aware of the benefits of home solar technology compared to traditional lighting methods (and compared to having to travel to town centers to charge their phones), they would be able and willing to allocate three months’ worth of household energy spending to over-the-counter purchases of solar devices, either by saving for the product or by foregoing consumption in other areas. This assumption will likely break down for the poorest households who struggle to meet even basic needs, but as shown in Table 4, these are excluded from the market in any case without some sort of consumer financing or affordability intervention.
4.1.2 Market for SL and SHS with consumer financing
Adding a consumer finance dimension to the same products increases the size of the potential market to almost US $57 million. The inclusion of this option means the poorest households can enter the market while those already in the market are now able to afford larger, more versatile systems. Similarly, consumer finance creates an additional market for larger solar home systems that was entirely absent in the scenario without financing. As shown in Figure 11, larger solar home systems (>10W) now make up around 10% of the market by sales volumes, but over 55% of its value. In contrast, the simple study light represents 57% of market sales volume, but only 6% of value. Figure 11: Solar lantern and solar home system sales volume potential with consumer financing
29

Open Capital Advisors
As in the case with no consumer financing above, the proximity of the lower deciles to one another in terms of energy expenditure means that the market size for cheaper products is highly sensitive to small changes in pricing and financing parameters. In this case, the decile distribution means that poorer consumers are either able to afford only the simple study light, or are already able to afford the light and mobile charger, leaving a gap for the standing light. In reality, we would expect that some of the market from the study light and the light and mobile charger would spill over into the standing light market. Figure 12: Solar lantern and solar home system market by Region with consumer financing
The analysis assumes that households that are able to regularly make a payment towards a solar device are also able to save up to three months to pay the upfront deposit (typically 10% of the over-the-counter purchase price, representing up to 3 times the monthly payment). If instead households are only able to spend their existing monthly energy spend on the upfront deposit, for instance, the market shrinks by about 25%. Further data on household saving patterns and non-financial forms of wealth (e.g. livestock) would be needed to test this assumption more closely. On the other hand, the model is potentially conservative in that it assumes that each household only purchases one unit. Our experience from other Sub Saharan African markets suggest that typically a significant number of households would purchase more than one unit, especially for smaller, lower-cost systems.
4.1.3 Consumer benefits from switching to solar
We now analyze household consumer benefits from switching from traditional lighting methods to solar. Our focus groups revealed that the number one lighting method currently used in off-grid Niger is LED flashlights, which confirms the findings of market research performed by SNV in 2012.33 To better understand why LED flashlights have such high uptake – which is relatively exceptional in Africa – we 33 SNV Niger, Improved cook stoves and solar energy – Market and sector analysis (July-Sept. 2012); available at: http://www.snv.org/public/cms/sites/default/files/explore/download/niger_market_analysis_re_english.pdf
30

Open Capital Advisors
performed a cost analysis on different traditional lighting methods. Our analysis reveals that in Niger LED flashlights are over twice as cost-effective as candles or kerosene. This is summarized in Figure 13 below34. We therefore determine consumer benefits in two scenarios: (i) using a solar light and mobile charger (2-year lifetime) against using LED flashlights; and (ii) using a basic solar home system (5-year lifetime) against using a diesel generator. Figure 13: Annual cost of basic lighting by different lighting alternatives
As shown in Figure 14, off-grid, low income households in Niger using LED flashlights as their primary lighting source spend around US $29 for lighting, and an additional US $13 for mobile phone charging each year35. The ‘light and mobile charger’ has a market price of US $40 with a (conservatively) estimated lifetime of 2 years, so that the annualized cost is US $20. As a result, households can save around US $22 per year by switching from LED flashlights to solar.
34 This analysis assumes that an LED flashlight costs $US1.60, lasts for 6 months, and that consumers spend $0.50 a week on batteries; that a kerosene lamp costs $US1.50, lasts for 2 years, and that consumers spend $1.30 per week on fuel; and that candles cost US$0.20 but that households need buy 10 candles per week35 Consumer focus groups
31

Open Capital Advisors
Figure 14: Cost comparison of a LED flashlight with a solar lantern with phone charging capabilities
Next, we analyze consumer benefits from using a basic solar home system against using a small diesel generator; this analysis is based on the following assumptions:
The household has a daily energy need of around 100Wh per day to:1. Charge two mobile phones,2. Light 3 3W LED lightbulbs for 3 hours each, and3. Play a small radio for around 4 hours.
A basic solar home system (20W) costs US $220 and has a lifetime of around 5 years36
Insolation in Niger is around 6.1 kWh per square meter per day37
Small diesel generators are available for around US $85, and consume around 0.35 liters of diesel per kWh of useful energy; the cost of one liter of diesel is assumed to be US $0.95
Generator lifetime of 2 yearsThe analysis shows that while the upfront investment for a solar system is much higher than for a diesel generator, these upfront costs are well invested in a durable system that has no ongoing running costs for usage. Figure 15 shows that the annualized costs savings expected from using a basic solar home system compared to a generator are around US $11; over the lifetime of 5 years, this results in cost savings of US $55, or 20% as compared to the diesel generator. 36 Note this assumes a high-quality system meeting Lighting Global Standards; knock-off products have considerably shorter battery lives37 http://africanenergy.com/new/wp-content/uploads/2012/08/africainsolationtable.pdf
32
Open Capital Advisors
Figure 15: Cost comparison of a diesel generator with a basic solar home system
Besides environmental, health, safety and noise considerations, deciding whether to invest in a diesel generator or a solar home system is a trade-off between lower upfront costs with ongoing running costs against higher upfront costs and no running costs (ignoring component replacements which become required every ~ 5 years for larger PV installations). With increasing electricity consumption levels, diesel becomes very expensive – besides being subject to constant market price volatility – and solar systems are generally the cheaper alternative over their lifetimes.
4.1.4 The market impact of current customs duties
Currently, solar imports to Niger are subject to high tax and duty charges, which in aggregate often reach up to around 50% of the customs value of the product. While solar panels are exempted from customs duties, batteries, inverters, solar fridges and other solar accessories are charged with 20% customs duties. In addition, all products, including solar panels are subject to 19% VAT as well as diverse charges and taxes38. This additional cost to solar distributors is passed on to end consumers making market prices for solar systems in Niger considerably higher than the benchmark prices applied in our market sizing analysis.
As shown in Table 5, the customs duties have a significant impact on the annual sales volume potential in our analysis. Even in the presence of consumer finance, we estimate that the customs duties reduce the size of the market by around 27%. This decrease comes mainly at the expense of the poorest end of the market – a
38 These include for example the impôt sur le benefice (3%), redevance statistique à l’import (1%), taxe vérification des importation (1%), prélèvement communautaire solidarité (1%), and the prélèvement communautaire (1%).
33

Open Capital Advisors
significant number of households are locked out of the market as they simply cannot afford to pay US $7.50 for the simple solar lantern, even with consumer financing options available. At the top end of the market, the duties significantly reduce sales volume potential across all solar home systems, while households that could afford these devices in the absence of import duties are pushed down into the market for light and mobile chargers.
Interestingly, this reshuffling of the market sales volume across the products has no material impact on the annualized market size, which decreases marginally to around US $56 million. This is mainly due to consumers shifting from products that need replacing every 5 years to products that need replacing every 2 years, so that the number of transactions more than doubles. Note that this also means, however, that the average level of energy access is considerably lower under this scenario, as people can no longer afford more sophisticated home systems. The analysis for the market without consumer financing leads to similar results, and the market remains at around US $12 million with or without import duties. Table 5: Comparison of market size with and without 50% customs duties
Benchmark(BM)
BM + 50%custom
Benchmark(BM)
BM + 50%custom
Changein %
Benchmark(BM)
BM + 50%custom
Changein %
Simple study light 5 8 697 219 (69%) 3.5 1.6 (53%)Standing light 10 15 - 43 - 0.7 Light & mobile charger 40 60 289 542 88% 11.6 32.5 182%Small multiroom lighting system 100 150 102 36 (65%) 10.2 5.3 (48%)Basic solar home system (20W) 220 330 116 47 (60%) 25.6 15.4 (40%)Medium solar home system (100W) 500 750 9 1 (87%) 4.5 0.9 (81%)Large solar home system (200W) 1000 1500 1 - (100%) 1.2 - (100%)
1,215 888 (27%) 57 56 (0%)
Annualized market size in US $ million
Sales volume potential p.a. in '000s(with consumer financing)Market price in US $
It is important to note, however, that as explained above this analysis is based purely on the purchasing power of different income levels in Niger, and therefore neglects the important aspect that the quality-verified solar products considered here lose competitiveness in the market against cheap, informal imports and other lighting alternatives such as LED flashlights and diesel generators.
As mentioned, the customs duties also have a significant negative impact on energy access levels. As shown in Table 6, the decreasing sales volume potential combined with the shift towards smaller devices results in a 40% decrease in power generating capacity supplied to the market per year.
34

Open Capital Advisors
Table 6: Comparison of energy access with and without 50% customs duties
Benchmark(BM)
BM + 50%custom duties
Changein %
Simple study light 2 1,394 439 (69%)Standing light 3 - 130 Light & mobile charger 4 1,155 2,169 88%Small multiroom lighting system 6 612 214 (65%)Basic solar home system (20W) 20 2,326 930 (60%)Medium solar home system (100W) 100 910 118 (87%)Large solar home system (200W) 200 236 - (100%)
6,634 4,000 (40%)
Electricity capacity supplied in kWWatts (peak)per unit
4.2 Public institutions (education, health & governance)
Public institutions present a strong opportunity for solar technology, either as direct customers themselves or as the beneficiaries of broader government electrification programs. In this section, we estimate the potential demand for solar for three types of institutions: schools, health facilities, and public buildings. Though the overall annualized market for institutions at around US $2.4 million is small compared to private households, our modelling shows a strong business case for switching to solar both from traditional lighting methods and from diesel generators.
The methodology applied for the market sizing is presented in Appendix B.2.
4.2.1 Educational institutions
To estimate potential solar demand for schools, we separately consider nurseries, primary schools, secondary schools, and tertiary institutions (universities). For each type of educational institution, we assume a number of appliances in the common areas, and in each class room (see Appendix B.2.1).
Business case
Table 7 provides an overview of the average annualized costs of different energy and lighting sources by school type, and the annualized cost savings (i.e. the “business case”). The business cases shown are:
i) vs. Grid (100%). Having a self-sufficient solar system and disconnecting from the grid.
ii) vs. Diesel generator. Using a solar system rather than a diesel generator as power source.
iii) vs. Kerosene lamps & gas appliances. Using a solar system rather than using kerosene lamps for lighting and gas for larger appliances, e.g. a fridge.
iv) as backup option. As the grid in Niger is characterized by frequent, and often long power outages, larger public buildings are increasingly being
35

Open Capital Advisors
equipped with grid backup options. We compare using a solar system against using a generator to meet backup needs of tertiary institutions.
Table 7: Annualized cost savings from solar usage for different educational institutions
(all figures in US$)
Average annualized costs of different energy/lighting sourcesi) Solar systemii) Grid (100%)iii) Diesel generatoriv) Kerosene lamps & gas appliances*
Grid backup options for long power cutsi) Solar backupii) Generator backup
Annualized cost savings from switching to solar in USD in % in USD in % in USD in % in USD in %
i) vs. Grid (100%) (77) (207%) (49) (95%) (127) (44%) (2,241) (47%)ii) vs. Diesel generator (11) (11%) 20 17% 100 19% 1,785 20%iii) vs. Kerosene lamps & gas appliances* 139 52% 204 59% 791 73% 8,650 82%iv) as backup option 294 27%
* Only basic lighting and gas fridge included; for comparability purposes, the solar system also only covers basic lighting (incl. light bulb replacements) and fridge.
Nursery Primary TertiarySecondary
268
10252122346
11437103
1,080
6,9624,7218,746
808
10,551
415287514
1,102
Based on our assumptions, there is a positive theoretical business case for switching to solar for the majority of use cases considered; only grid electricity is sufficiently cheap that solar systems are outpriced across all institutions. All institutions using candles, kerosene and gas would realize considerable cost savings from switching, and all institutions except for nurseries would benefit from switching from diesel to solar generators.
There are two reasons why, in this analysis, solar is shown as not cost competitive compared to diesel generators for nurseries:
i) Around 55% of nurseries have power needs below 200W and consequently fall into the relatively more expensive market for products meeting Lighting Global Quality Standards. The average cost per kW of around US $5,000 for a quality-verified solar home system is significantly higher than the average cost per kW for larger PV installations, which as a consequence limits the economic viability of serving small, off-grid institutions; and
ii) for many of the remaining nurseries electricity consumption is not sufficiently high to offset the incremental investment required as compared to generators, which have relatively lower fixed costs and higher variable costs.
The case for substituting a diesel back-up generator for a solar back-up generator is positive for tertiary institutions. Unsurprisingly, higher energy demand is associated with a stronger absolute business case for solar. This is shown graphically in the figure below, which shows the absolute annualized cost savings in percent of switching from stand-alone diesel generators to stand-alone solar generators for the
36
Open Capital Advisors
different types of educational institutions. Cost savings for secondary schools are uniformly higher for a given level of average daily energy consumption on a school day. This is driven by the assumption that secondary schools are equipped with a fridge that needs to run 365 days per year as compared to the remaining electronic devices being used only 200 days per year. Figure 16: Scatterplot of annualized cost savings for schools in Niger
Market size
Using the business cases developed above, we estimate the overall market size for solar in educational institutions in Niger. To do this, we assume that every institution for which there is a positive business case would opt to switch to solar if they had the necessary funding or financing, along with the following additional assumptions:
The on-grid/off-grid split for institutions is the same as for households (since grid connection data is available for households but not explicitly for institutions); the exception are the tertiary universities which are all on-grid.
Off-grid institutions currently use either diesel generators or traditional sources of lighting (candles, kerosene, etc.); specifically, we assume that generators are only prevalent among tertiary and secondary educational institutions.
We calculate the market size based only on institutions for which there is a positive business case for switching to solar. Note that this does not yet take into consideration how institutions would fund any new equipment, or what amount and type of financing would need to be made available to achieve this. The annualized
37
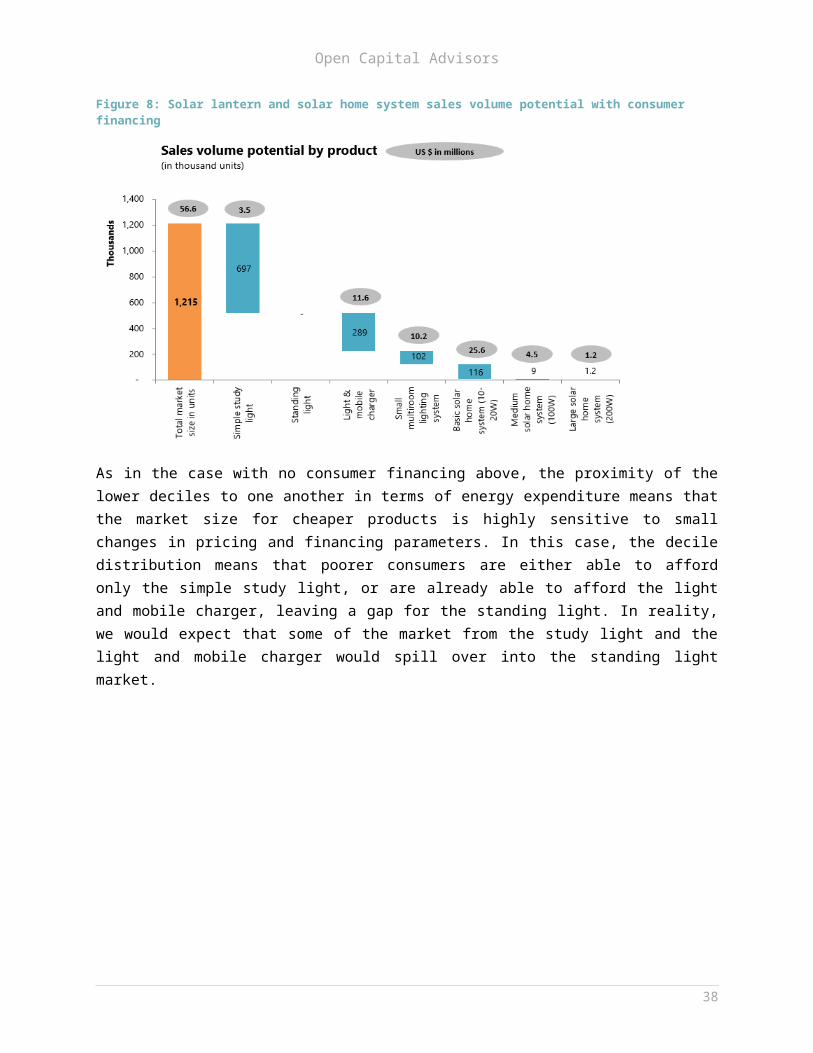
Open Capital Advisors
market size for solar in education institutions is thus estimated at around US $1.6 million (thereof around US $1.4 million for quality-verified products).
Based on the data received from the Ministry of Education and INS, around 84% of the 16,500 educational institutions in Niger are primary schools, of which we estimate around 88% to be off-grid. As a result, primary schools represent nearly 80% of the solar market size. Together with nurseries, the primary schools are – due to their relatively limited electricity needs – also the key driver of the market opportunity for medium and large solar home systems meeting Lighting Global Quality Standards. Table 8 summarizes these results at the Region level. Table 8: Number of schools and solar market size by region
AGADEZ DIFFA DOSSO MARADI NIAMEY TAHOUA TILLABERI ZINDER NIGER
# of schools1
Nursery 55 58 210 259 235 305 243 287 1,652 Primary 459 634 2,157 2,524 308 2,204 2,918 2,624 13,828 Secondary 72 43 146 170 20 149 199 179 978 Tertiary - - - 1 1 1 1 1 5 Total 586 735 2,513 2,954 564 2,659 3,361 3,091 16,463
Potential sales volume in unitsNursery 6 9 40 49 13 55 44 52 269 Primary 50 104 398 469 15 400 518 468 2,422 Secondary 2 2 7 8 0 7 9 8 44 Tertiary - - - 0 0 0 0 0 0 Total 58 115 445 527 28 463 571 529 2,736 of which Lighting Global 56 113 438 519 27 455 562 520 2,691
Market size in US$Nursery 3,800 4,700 19,900 24,700 7,600 27,600 21,800 26,200 136,300 Primary 30,600 55,000 198,900 244,000 15,151 214,100 261,800 245,900 1,265,451 Secondary 13,013 7,407 32,305 37,057 2,022 33,511 39,482 37,966 202,763 Tertiary - - - 301 2,664 327 301 450 4,042 Total 47,413 67,107 251,105 306,058 27,437 275,538 323,382 310,516 1,608,557 of which Lighting Global 34,400 59,700 218,800 268,700 22,751 241,700 283,600 272,100 1,401,751
1 Source: OCA Analysis & Consultations; List of schools received from Ministry of Education;Breakdown into school type based on region and department level INS statistics (including private schools)
Of the total annual potential sales volume of around 2,700 quality-verified products, the medium solar home system sold at US $500 accounts for nearly 2,600 units. The PV installations for secondary schools have an average capacity of 1.3kW, ranging from 1.1kW to 3.0kW. As all tertiary institutions are on-grid, the small market here (average annual volumes below 1) is purely for grid backup options; on average, these backup options have a capacity of 2.8kW, ranging from 1kW to 10kW.
4.2.2 Health facilities
Our analysis for health facilities closely mirrors that of schools above; we separately consider the following public health facilities:
38

Open Capital Advisors
i) Cases de Santé. Small health kiosks managed by registered nurses; provision of most basic outpatient health services e.g. for simple colds and flu.
ii) Centres de Santé 1 (“CSI 1”). Small health centers, typically with a waiting room and treatment room, managed by a doctor or clinical officer, often with nurse support; provision of a broad range of outpatient preventative and curative health services.
iii) Centres de Santé 2 (“CSI 2”). Medium sized health centers, often with multiple treatment rooms and a maternity room, managed by one or several doctors with several nurses; broad range of outpatient services including maternity and laboratory.
For each type of health facility, we assume different quantities of basic electric appliances as well as more sophisticated medical devices, based on consultations with the Ministry of Health (see Appendix B.2.2).
Business case
Table 9 shows the business case under the same scenarios as for schools. This is positive under all scenarios for CSI 1 and CSI 2 except those that operate exclusively on grid power – that is, all facilities would realize cost savings by switching to solar whether they are replacing a stand-alone diesel generator, are on-grid but replacing a diesel back-up generator, or are switching from traditional lighting sources. The business case for Cases de Santé is only positive for switching from traditional lighting methods, as the solar capacity needs of around 135W represent an investment of USD 1,000 for a solar home system, which does not amortize over a 5-year period against average annualized costs of around US $95 to power the facility with a generator.Table 9: Annualized cost savings from solar usage for different health facilities
(all figures in US$)
Average annualized costs of different energy/lighting sourcesi) Solar systemii) Grid (100%)iii) Diesel generatoriv) Kerosene lamps & gas appliances*
Grid backup options for long power cutsi) Solar backupii) Generator backup
Annualized cost savings from switching to solar in USD in % in USD in % in USD in %
i) vs. Grid (100%) (163) (438%) (12) (4%) (12) (3%)ii) vs. Diesel generator (105) (109%) 251 42% 340 41%iii) vs. Kerosene lamps & gas appliances* 84 59% 290 49% 351 53%iv) as backup option 118 45% 121 45%
* Only basic lighting and gas fridge included, laboratory equipment etc. not in use; for comparability purposes, the solar system also only covers basic lighting (incl. light bulb replacements) and fridge.
142 149260 270
588 659
47695 598 827
CSI 2
200 347 488
Cases de Santé CSI 1
37 335
142
39

Open Capital Advisors
As with educational institutions, the absolute business case is strongest across all scenarios for the largest institutions (CSI 2), and weakest for the smallest institutions (Cases de Santé).
Market size
We now estimate the total market size based on the business case above, assuming that the on-grid/off-grid split for health institutions is the same as for households, and that larger institutions are less likely to depend on traditional lighting technologies (see Appendix B.2.2).
Based on these assumptions and the results of our business case analysis, we estimate the annualized market size for public health institutions at US $0.4 million. This market is significantly smaller than for educational institutions simply due to the fact that there are almost five times as many educational institutions than health institutions in Niger. Table 10: Number of health facilities and solar market size by region
AGADEZ DIFFA DOSSO MARADI NIAMEY TAHOUA TILLABERI ZINDER NIGER
# of facilitiesCases de Santé 141 136 395 465 8 435 429 507 2,516 CSI 1 45 44 96 91 27 116 121 95 635 CSI 2 18 7 30 54 23 36 63 44 275 Total 204 187 521 610 58 587 613 646 3,426
Potential sales volume in unitsCases de Santé 15 23 73 87 0 79 76 90 442 CSI 1 2 2 5 5 1 6 6 5 32 CSI 2 1 0 2 3 1 2 3 2 14 Total 18 25 79 94 3 86 85 97 488 of which Lighting Global 15 23 73 87 0 79 76 90 442
Market size in US$Cases de Santé 3,344 4,972 16,016 19,096 88 17,336 16,720 19,756 97,328 CSI 1 11,514 13,428 31,690 29,954 5,469 37,812 39,754 31,959 201,579 CSI 2 5,732 3,076 13,616 25,322 5,800 16,204 27,341 19,090 116,181 Total 20,589 21,475 61,322 74,371 11,357 71,352 83,815 70,805 415,088 of which Lighting Global 3,344 4,972 16,016 19,096 88 17,336 16,720 19,756 97,328
1 Source: OCA Analysis & Consultations; Ministere de la Sante Publique - Annuaire des statistiques sanitaires du Niger 2015 The cases de santé present an opportunity, albeit a small one, for large solar home systems meeting Lighting Global Quality Standards; with a capacity need of 135W, the annual sales volume potential for large solar home systems is 442, representing a market size of around US $97,000. CSIs require larger PV installations of 1.1kW for CSI 1 and 1.6kW for CSI 2. The annual potential sales volume for CSI 1 is around 32 units generating revenues of around US $202,000, and 14 units with revenues of US $116,000 for CSI 2.
40

Open Capital Advisors
4.2.3 Public buildings
Finally, we repeat the analysis for public buildings, considering specifically Commune administration centers, Departement administration centers, police stations and court houses, and prisons. Based on consultations, we assume different appliance and energy consumption profiles for the different types of public buildings (see Appendix B.2.3).
Business case
Except for the cost comparison to pure on-grid power consumption, we find a positive business case for all public buildings under all scenarios, regardless of whether they are replacing i) stand-alone diesel generators with stand-alone solar systems, ii) traditional lighting methods with stand-alone solar systems, or iii) replacing diesel backup generators with solar backup generators. This occurs as even the lowest energy-consuming public building (the community administrative center) would require relatively large solar installations (1.25kW).Table 11: Annualized cost savings from solar usage for different public buildings
(all figures in US$)
Average annualized costs of different energy/lighting sourcesi) Solar systemii) Grid (100%)iii) Diesel generatoriv) Kerosene lamps & gas appliances*
Grid backup options for long power cutsi) Solar backupii) Generator backup
Annualized cost savings from switching to solar in USD in % in USD in % in USD in % in USD in %
i) vs. Grid (100%) (43) (12%) (319) (20%) (50) (14%) (48) (13%)ii) vs. Diesel generator 229 37% 827 30% 215 34% 207 34%iii) vs. Kerosene lamps & gas appliances* 83 23% 188 38% 106 28% 141 33%iv) as backup option 114 45%
* Only basic lighting and gas fridge included; for comparability purposes, the solar system also only covers basic lighting (incl. light bulb replacements) and fridge.
139254
353 497 385 433
359620 2,756 630 613
Comm' admin Depm't admin Police & courts Prisons
392 1,929 415 406349 1,610 364
Market size
We again assume that the on-grid/off-grid split for public buildings is the same as for households, and, based on consultations, make assumptions on current energy sources (see Appendix B.2.3).
Table 12 shows the annualized market size for solar in other public buildings. We estimate an annual market size of around US $0.4 million.
41

Open Capital Advisors
Table 12: Number of other public buildings and solar market size by region
AGADEZ DIFFA DOSSO MARADI NIAMEY TAHOUA TILLABERI ZINDER NIGER# of buildings
Comm' admin 15 12 43 47 5 44 45 55 266 Depm't admin 6 6 8 9 1 13 13 11 67 Police & courts 22 23 67 104 42 132 82 143 615 Prisons 5 7 11 30 11 34 19 35 152 Total 48 48 129 190 59 223 159 244 1,100
Potential sales volume in unitsComm' admin 1 1 2 2 - 2 2 3 13 Depm't admin 0 0 0 0 - 1 1 1 3 Police & courts 1 1 3 5 1 7 4 7 28 Prisons 0 0 1 2 0 2 1 2 7 Total 2 2 6 10 1 11 8 12 52 of which Lighting Global - - - - - - - - -
Market size in US$Comm' admin 3,892 3,113 11,156 12,194 - 11,415 11,675 14,269 67,714 Depm't admin 11,574 11,574 15,432 17,361 139 25,077 25,077 21,219 127,453 Police & courts 4,376 6,449 20,561 32,369 3,747 40,078 25,398 41,844 174,822 Prisons 1,317 1,844 2,898 7,904 1,054 9,243 5,006 9,364 38,630 Total 21,159 22,981 50,047 69,828 4,940 85,813 67,155 86,696 408,619 of which Lighting Global - - - - - - - - -
1 Source: OCA Analysis & Consultations
As there are only around 1,100 other public buildings, and these all require PV installations with 20 years’ lifetime, the annual potential sales volume is low, with 52 buildings being equipped with solar each year. The largest individual market segment is ‘police & courts’, as there are several small police stations spread nationwide.
4.3 Agricultural irrigation
Employing over half of Niger’s population, agriculture is a significant economic sector, and accounts for around 67% of annual freshwater pumping.39 A large share of this is used for irrigation to enable cultivation in Niger’s dry, hot conditions. This implies a significant market opportunity for irrigation technologies and related water pumping systems. Water pumps allow farmers to channel water into their irrigation systems, either by (i) pumping groundwater to the surface, or (ii) pumping water out of nearby rivers and dams. As grid reach is limited in rural, agricultural areas, there is a market opportunity for solar pumps for irrigation systems. In this chapter, we explore the market size for these technologies at the farm level, assessing the business case for solar compared to alternative power sources (that is, diesel powered generators), and then determining the resulting market size. We divide the analysis into large-scale irrigation schemes (ONAHA) and individual farms.
39 The World Bank: Development Indicators Database
42

Open Capital Advisors
4.3.1 Large irrigation schemes (ONAHA)
Large-scale public irrigation schemes for farming cooperatives are managed by ONAHA, a public but autonomously funded organization under the Ministry of Agriculture that organizes and supports farmer cooperatives. In total, there are 72 ONAHA-managed land plots or “AHA” (Amenagements Hydro Agricole) in Niger, covering a surface area of almost 17,000 hectares. The size of the AHA varies considerably from 15 hectares to 1,370 hectares.40 Each AHA is rented by a cooperative, which then sublets smaller plots to individual members who also pay fees for water pumping services. Historically these individual plots have covered an area of 0.25 hectares per plot, but ONAHA is currently in the process of increasing this to 0.5 hectares, so that the current average plot size stands at around 0.4 hectares.41
Table 13 provides an overview of the 72 AHAs, breaking them down by key crops and water source. Rice farming accounts for 69% of the irrigated land area, with the rest being polyculture (cultivation of several crops simultaneously). Most of the AHAs are situated in proximity to rivers, so that 93% of the irrigated land area can source its water directly from rivers and dams. The remaining 7% of irrigated land area requires wells as sources of water, and therefore the energy required – to pump water to the surface – is significantly higher for these. Table 13: Overview of ONAHA’s large irrigation schemes by Region
Rice Polyculture River/Dam WellAGADEZ 0 0 0 0 0 0DIFFA 7 367 367 0 367 0DOSSO 9 775 715 60 775 0MARADI 4 1,142 0 1,142 0 1,142NIAMEY 6 696 696 0 696 0TAHOUA 8 3,811 0 3,811 3,811 0TILLABERI 36 9,730 9,644 86 9,730 0ZINDER 2 150 0 150 100 50
72 16,671 11,422 5,249 15,479 1,192as % of Total 69% 31% 93% 7%
# of AHASurface area (ha)
Total by crops by water source
We estimate power requirements for irrigating AHAs based on (i) water volumes required (driven mainly by plot size and crop cultivated), (ii) the water source (e.g. wells require water to be pumped to the surface), and (iii) pumping distances (determined by the land area covered). Further details on the methodology of our analysis is available in Appendix B.3.1.
Business case
Comparing the cost of solar-powered with generator-powered pumping systems, we find that – assuming each pumping station covers a maximum surface area of 25 40 Overview of AHA provided by ONAHA41 OCA Consultations
43

Open Capital Advisors
hectares – there is a business case for all AHAs for changing from generator to solar. On the other hand, solar systems do not provide a cost-effective alternative for AHA with grid access, representing around 70% of the total surface area of ONAHA plots. Table 14 summarizes these results. Table 14: The business case for selective AHAs
Solar system Diesel generator
AHA de Saga 5,273 6,573 1,300 19.8%AHA de Gabou 3 6,026 7,142 1,117 15.6%AHA de Moulléla 3,537 4,080 543 13.3%AHA de Djirataoua 26,365 29,037 2,672 9.2%AHA de Kakibaré 33,898 41,640 7,742 18.6%
Annualized solar cost savings in
US $in %
Annualized costs per pumping station
Our analysis further shows that the strength of the business case is sensitive to two key factors: (i) the solar system size, and (ii) the capacity utilization42; pumping stations with exceptionally high utilization rates above 85% typically have the strongest business case. As solar panels are usually purchased in standard sizes, and excess capacity provides flexibility and safety, such high utilization rates are not necessarily common.
Because there is great variability in the amount of land area irrigated by any one pump in ONAHA plots, we model business cases for a variety of different maximum land area covered by a single pump. For instance, if the maximum area covered by a single pump is 10 Ha, then a 100 Ha plot would require 10 such pumps. The results of this analysis are shown in Table 15, and below we show the percentage of total ONAHA surface area – ignoring the boundaries of AHAs - that achieves cost savings from switching from diesel generator to solar.
We see that, for the five AHAs displayed, there is a positive business case for solar as compared to using a generator for all pumping station sizes above 10 hectares. Looking at the percentage of ONAHA surface area with solar cost savings reveals that from 25 Ha upwards, all AHAs have positive business cases. If the maximum land area served by a pumping station is 5 hectares, then there is only a positive business case of switching from generator to solar for 18% of total ONAHA surface area, and 76% for 10 hectares service area. The AHAs for which switching from generator to solar is not cost efficient all need solar system sizes of 2.9 kW to 4.9 kW, showing a range of smaller system sizes where the high upfront cost of solar cannot be justified as compared to investment in a generator-powered pumping system.
The findings align well with insights gained during consultations in Niger that solar pumping is currently relatively expensive and unreliable (power variations lead to inconsistent water flows) as compared to alternative technologies, and that the only 42 The capacity utilization is the extent to which the productive capacity of the pump is being used, e.g. if the pumping capacity is 100 liters per hour, but only 80 liters per hour are being pumped, then the pump is running at 80% capacity utilization.
44

Open Capital Advisors
two viable market segments currently in Niger are smallholder farmers, and large scale pumping schemes.Table 15: Effect of pumping station size on the business case
5ha 10ha 25ha 50ha 100ha 200ha
AHA de Saga 4.3% 7.0% 19.8% 19.1% 13.6% 12.7%AHA de Gabou 3 (1.3%) 5.4% 15.6% 15.0% 19.2% 18.4%AHA de Moulléla (11.4%) 3.8% 13.3% 13.1% 15.8% 15.8%AHA de Djirataoua 13.3% 16.1% 9.2% 16.8% 7.0% 9.6%AHA de Kakibaré 12.7% 18.8% 18.6% 12.9% 12.9% 12.9%% of ONAHA surface area with solar cost savings (vs. generators) 18% 76% 100% 100% 100% 100%
Annualized solar cost savings in % versus generatorsby different max. surface areas (ha) per pumping station
The business case analysis is purely focused on comparing alternatives for powering water pumps and does not take into consideration potential yield uplifts and other farm-level cost savings from applying good irrigation practices.
Market size
Table 16 shows the viable market size for a range of different scenarios of land area covered per pump. The annualized market size, assuming pumping stations service a maximum land area of 25 hectares, is estimated at around US $1.2 million (representing around 10.3 pumping stations being equipped per year, at an average selling price per system of around US $116,000). The average solar system size for one pumping station is around 22 kW, but sizes have high variability due to different crop types and water sources (ranging from around 6 kW to nearly 120 kW). Table 16: Different scenarios to present potential annualized market size43
5 10 25 50 100 200 Annual market size in US $ 1,187,664 216,226 836,892 1,187,664 1,403,138 1,110,351 1,308,760 % of market viable for solar systems* 25% 3% 20% 25% 26% 25% 25%
Scenarios for different pumping station size
Max. surface area (ha) per pumping station
We calculate the annualized market only for pumping stations for which there is a positive business case for switching to solar; while around 70% of the surface area is served by grid power, generators are considered the only viable alternative to solar for off-grid areas. Note that the market size displayed in Table 16 does not consider affordability, or what magnitude and type of financing mechanisms would need to be introduced to unlock this full market
43 Our analysis revealed various effects, besides the existence of a business case, that impacted the market size for different sizes of pumping stations. The limited market for smaller systems is predominantly due to lacking market viability, i.e. many of the smaller systems have no business case in direct comparison with diesel generators. As pumping stations become bigger, the effect of decreasing price per kW with increasing system size, is mitigated by the fact that larger systems have to pump (i) more water, for (ii) a greater distance; we ignore further efficiency effects from larger systems for the purpose of this analysis.
45

Open Capital Advisors
potential. In addition, further analysis at the individual localities will be required to evaluate if constructing and managing solar production facilities at the sites is a feasible opportunity.
This market sizing assumes all irrigation in the areas will be done with solar pumps and does not take into consideration any existing installed water pumps, whether fuel powered or manual.
4.3.2 Small scale, individual irrigation schemes
Total irrigated agricultural land area in Niger is estimated at 135,314 hectares44. Of this land area, only around 17,000 hectares (~ 12%)45 are part of ONAHA. The remainder is cultivated by independent smallholder and commercial farmers. Currently, irrigation is performed manually, or through generator powered pumping systems, suggesting a potential opportunity for solar-powered water pumping. In addition, irrigated land area in Niger is expected to expand considerably in the medium to long term. For instance, research from FAO indicates that the potential for irrigated land in the short to medium term is around 270,000 hectares46(that is, almost double what is currently under irrigation).
We analyze the irrigation water requirements in Niger as the basis for power requirements at the farm level (see Appendix B.3.2 for further details); for the purpose of this analysis, community-level boreholes and livestock-related water needs are considered separately later in the market sizing for water providers. We differentiate five different farm sizes, and identify suitable water pumping solutions for each farm size.
In Table 17, we provide an overview of the water needs, irrigation power needs, electricity consumption, and solar system sizes for the different farm sizes and for different water sources. We see that there is a market opportunity for small solar pumping kits to serve ‘Micro smallholder farmers’ (regardless of water source), and ‘Smallholder farmers’ (pumping from rivers, dams and shallow boreholes), as these provide sufficient pumping capacity for pumping size requirements up to 120 W.
44 Data received from the Ministry of Agriculture45 Data received from ONAHA46 FAO, available at http://www.fao.org/nr/water/aquastat/countries_regions/NER/
46

Open Capital Advisors
Table 17: Overview of water and power needs of different farm sizes and water sources
Average irrigated land area in hectaresAnnual irrigation water requirements in m3Flow capacity m3/hourIrrigation pumping system size in kW
River & dam pumpingBoreholes: Shallow (5 meters)Boreholes: Deep (15 meters)
River & dam pumpingBoreholes: Shallow (5 meters)Boreholes: Deep (15 meters)
Solar system capacity in kWRiver & dam pumpingBoreholes: Shallow (5 meters)Boreholes: Deep (15 meters)
8,560.7
Electricity consumption for water pumping (kWh p.a.)
0.040.11
0.130.29
0.751.37
2.504.05
3.484.737.21
53.2 156.8 885.6 2,964.8 5,609.3127.0 341.3 1,623.5 4,809.3
16.3 64.6 516.7 2,042.5 4,133.7
0.380.651.20
1.512.193.55
0.012
0.090.04
0.050.120.25
3.50 5.60
1.6 4.0 16.0 40.0 64.0
3.054.146.32
0.014 0.05 0.44 1.72
Micro SHF SHF Small CF Med. CF
2,168 5,421 21,683 54,2080.14 0.35 1.40
Large CF
86,733
Solar system sizes range from around 14 W to around 7.2 kW with increasing farm size and water pumping requirements. In our analysis, we have included two solar pumping kits47 as options for small-scale farming, one at a price of US $650, and a fictional micropump at a price of US $400. Consultations have revealed that small micropumps in that price level are currently being tested in Kenya and other African markets. The other options are component solutions offering a combination of conventional water pumps for agriculture and solar systems. The solar systems include solar panels, battery, inverter, and the required cables.
Further analysis was performed to assess how affordability would impact the market size for smallholder farmers; this analysis followed the same approach as the analysis for private households in section 4.1; see Appendix B.3.2 for further details.
Business case
Comparing the cost of solar-powered with generator-powered pumping systems, we find that there is a business case across all farm sizes and all water sources. In contrast, regardless of land area or water source, the solar systems do not provide a cost-effective alternative for those with grid access. The higher upfront investment for solar relative to generators is rapidly amortized through cost savings on diesel. Table 18 provides an overview of annualized costs for generator- and solar-powered pumping systems for different farm sizes and water sources, as well as the annualized costs savings from using solar.
The analysis reveals an exciting opportunity for solar pumping kits; the solar micropump is well suited for the irrigation needs of micro smallholder farmers 47 The small pumping kits are sold as ‘complete solution packages’, which include a pump and the solar system to power the pump (integrated sets). In contrast, component solutions are sales of individual components, such as solar panels, pumps, batteries, inverters etc., which are combined for larger solar pumping systems.
47
Open Capital Advisors
accessing water from nearby rivers or dams. The solar micropump sets are available at the market price of US $400, and have a life expectancy of 6 years, which results in an annualized cost of US $67. This compares with a lifetime cost (over 6 years) of around US $580 for a generator-powered system; this breaks down into an upfront investment of US $300 (US $200 for the pump, and US $100 for a cheap, short life generator), US$ 200 to replace the generator every two years48, and an additional annual cost of around US$ 13 for diesel. The US $650 pump we looked at meets slightly higher water pumping needs, specifically those of micro smallholder farms pumping water from boreholes, as well as smallholder farms pumping water either from rivers, dams or shallow boreholes. Table 18: Annualized cost savings from switching to solar-powered water pumps for irrigation
(all figures in US$)
Average annualized costs of different energy sources
i) Solar systemRiver & dam pumpingBoreholes: Shallow (5 meters)Boreholes: Deep (15 meters)
ii) Grid (100%)River & dam pumpingBoreholes: Shallow (5 meters)Boreholes: Deep (15 meters)
iii) Diesel generatorRiver & dam pumpingBoreholes: Shallow (5 meters)Boreholes: Deep (15 meters)
in USD in % in USD in % in USD in % in USD in % in USD in %
Annualized cost savings of solar
i) vs. Grid (100%)River & dam pumping (31) (87%) (66) (155%) (136) (128%) (380) (104%) (569) (79%)Boreholes: Shallow (5 meters) (67) (165%) (53) (95%) (151) (95%) (375) (73%) (695) (71%)Boreholes: Deep (15 meters) (57) (111%) (92) (113%) (311) (107%) (588) (71%) (780) (53%)
ii) vs. Diesel generatorRiver & dam pumping 30 31% 17 14% 40 14% 36 5% 153 11%Boreholes: Shallow (5 meters) 17 14% 17 14% 40 11% 51 5% 255 13%Boreholes: Deep (15 meters) 17 14% 42 20% 23 4% 184 11% 479 18%
41 55 158 51151 81 291 833
67309601
106
108108
36
108108
9781,470
Micro SHF SHF Small CF Med. CF Large CF
366
1,2921,6732,251
723
746886
1,421174
42
242
126 216 625 1,606 2,729
97 126 282 782 1,446126 126 349 938 1,927
The business case analysis is purely focused on comparing solar-powered water pumps with alternative power sources, and does not take into consideration potential yield uplifts and other farm-level cost savings from applying good irrigation practices.
48 Consultations in Niger revealed that cheap generators are available at US $100, but these have lifespans of at best around 2 years.
48
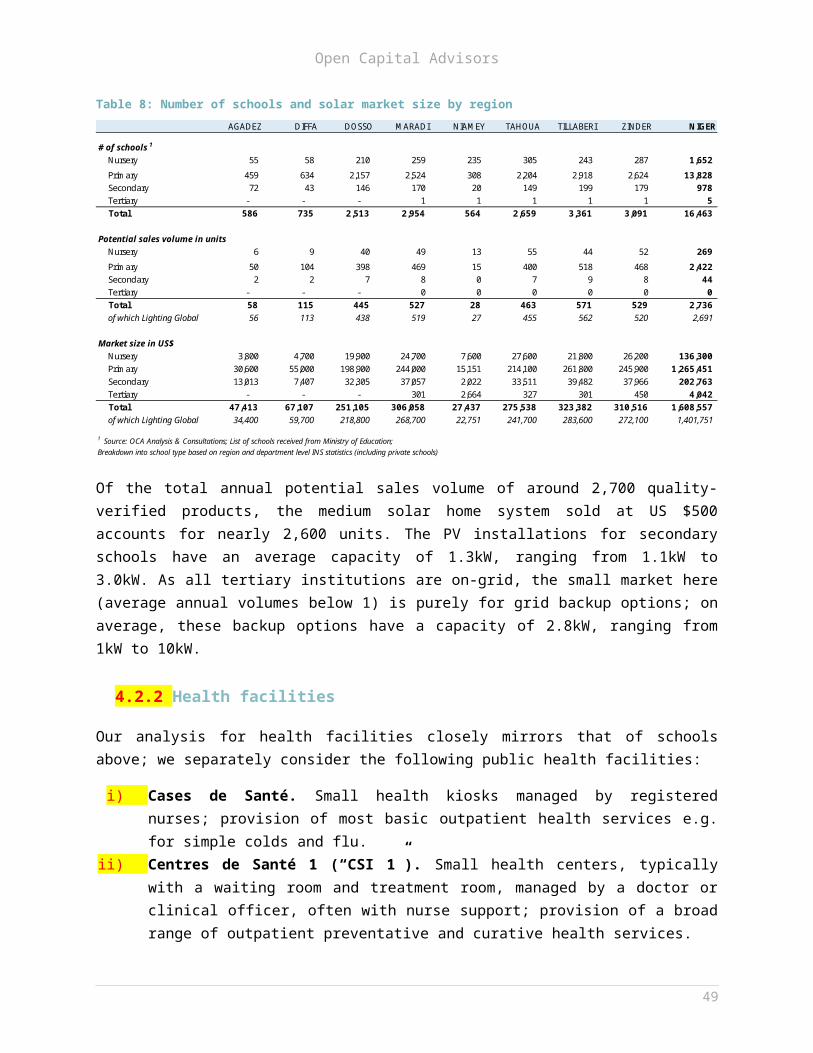
Open Capital Advisors
Market size
To estimate the market size, we take a two-phased approach: first we estimate the market size based on irrigated land area and the existence of a business case as compared to using diesel-generators, and then – specifically for smallholder and small commercial farms – we perform additional affordability analysis. In absence of data, we assume that all farms are off-grid49, as especially small commercial farming activities are typically performed in rural areas, and that the only option to solar technology are solar generators. Further we have broken the number of farms down by water source as shown in the methodology (Appendix B.3.2).
While smallholder farmers have cost benefits from solar pumping kits as compared to generators, consultations and focus groups have revealed that most smallholder farmers manually irrigate their farms. Our affordability analysis reveals that, without consumer financing options, the one-off payment for over-the-counter purchases exceeds farming households’ average ability-to-pay, even of the highest earning deciles. Consequently, consumer financing schemes will be essential to unlock the market; but serving smallholders comes with significant challenges: They are hard to access and service, and their low-income levels combined with limited access to suitable financial services limit the market. Financial services are frequently only available to farmers in formal, structured value chains, and most farmers in Niger, especially smallholder farmers, serve informal markets.
The market size determined by combining both approaches assumes that medium to large commercial farms have sufficient cashflows or have access to financial services to be able to afford the high upfront investment of solar pumping systems. In contrast, for smallholder farmers, and small commercial farms, the market for solar pumping systems is capped by affordability constraints. Overall, assuming there is a business case for irrigation on farm level (e.g. through an increase in number of harvests per year, general yield uplifts, cost savings etc.) and if suitable financing mechanisms are available to smallholder farmers and commercial farms, the market size derived appears a reasonable estimation of the potential for solar water pumping in Niger.
We again base our market sizing on the annualized market only for farms for which there is a positive business case for switching to solar; as shown in the Business Case section, this is the case for all farms across all regions, sizes, and water sources. Note that the market size displayed in Table 19 does not consider what magnitude and type of financing mechanisms would need to be introduced to unlock this full market potential. As shown in Table 19, the annualized market size for solar water pumping technology in the market for small scale, individual irrigation systems is estimated to be around US $33 million, representing an annual sales volume of around 50,000 units. 49 As shown above, there is no business case for farmers to switch from grid to solar; as a consequence, any farmers connected to the grid would anyway be excluded from the viable market. Effects from this assumption are not considered to have a material impact on the annualized market size.
49

Open Capital Advisors
Table 19: Total market size in annualized sales volume and revenues after affordability considerations
AGADEZ DIFFA DOSSO MARADI NIAMEY TAHOUA TILLABERI ZINDER NIGER
a) Sales volume (# of units)Micro SHF 1,457 3,114 3,428 - - 16,673 2,543 10,116 37,330 SHF - 911 2,528 1,238 - 4,172 690 2,532 12,071 Small CF - - 69 148 - 133 - 81 432 Medium CF 3 2 7 15 3 13 1 8 51 Large CF 1 1 1 3 1 3 - 1 10 Total 1,460 4,028 6,033 1,404 4 20,994 3,234 12,737 49,894 thereof integrated kits 1,457 4,025 5,956 1,238 - 20,845 3,233 12,647 49,401
b) Market size (revenues in US $)Micro SHF 764,925 1,634,850 1,799,508 - - 8,753,383 1,334,875 5,310,683 19,598,225 SHF - 632,468 1,753,870 858,916 - 3,783,576 547,426 2,296,056 9,872,312 Small CF - - 402,299 860,467 - 930,133 - 568,581 2,761,480 Medium CF 56,346 36,659 112,214 238,924 48,944 252,263 18,605 145,736 909,691 Large CF 21,257 14,826 26,686 102,106 23,721 89,726 - 18,091 296,413 Total 842,529 2,318,802 4,094,578 2,060,413 72,665 13,809,082 1,900,906 8,339,147 33,438,122 thereof integrated kits 764,925 2,267,318 3,553,379 858,916 - 12,536,960 1,882,301 7,606,739 29,470,537 Avg. selling price in US $ 577 576 679 1,468 19,639 658 588 655 670
The market sizing further reveals, that there is potentially an exciting opportunity to serve micro smallholder farms and smallholder farms with integrated solar water pumping kits; these integrated kits represent around 88% of the annual market (or 99% of annual sales volume). This market sizing assumes all irrigation in the areas will be done with solar pumps and does not take into consideration any existing installed water pumps, whether fuel powered or manual.
We performed the same market sizing analysis for the irrigated land potential of 253,329 hectares (that is 270,000 less ONAHA, with ONAHA land area being held constant). Our analysis reveals that unless the increase in irrigated land area translates directly into increasing income levels, the expansion of irrigated land area only has minor impact of around +5% on overall market size. If affordability is excluded from the analysis, expansion of irrigated land area has the potential to increase the annualized market up to around US $ 115 million (from the sale of 182,000 units p.a.); thereof US $98 million (~ 85%) is generated from the sale of solar pumping kits.
4.4 Crop processing
Along with irrigation, crop processing presents an additional opportunity for sales of solar powered systems in agriculture. The mills that process crops are typically run by small entrepreneurs, or are communally owned. Crop processing volumes are often small, depending on the availability of crop supplies, transportation infrastructure (to provide for purchases of supplies and sale of processed crops), and demand from the surrounding populations.
We evaluate the business case for solar power for milling and estimate the market size based on 2014 annual production volumes for the major crops in Niger, and apply international average power requirements for milling crops. We assess the
50

Open Capital Advisors
business case for three different mill sizes, and, in absence of market breakdown data, present the market size for two scenarios:
a. Scenario I assumes that 100% of milling for the main crops is performed by small village-level mills.
b. Scenario II assumes a breakdown characteristic of many African countries; 60% of total crop milling volume is processed in small village-level mills, 35% by medium-sized mills, and 5% by large mills.50
Further information on the methodology is provided in Appendix B.4.
Business case
In Table 20, we present the results from the business case analysis for crop processing in Niger, showing the annualized costs of different power sources, as well as the respective cost savings from switching to solar. We see that for all three mill sizes there is a business case to use solar power rather than diesel generators; in contrast, for mills connected to the grid, there is no business case to switch from grid to solar.Table 20: Annualized costs and cost savings from solar for different mill sizes
(all figures in US$)
Average annualized costs of different energy sourcesi) Solar systemii) Grid (100%)iii) Diesel generator
Annualized cost savings from switching to solarin USD in % in USD in % in USD in %i) vs. Grid (100%) (148) (9%) (382) (6%) (836) (3%)ii) vs. Diesel generator 1,327 42% 5,517 44% 24,233 45%
1,840 7,150 29,6001,692 6,768 28,7643,167 12,667 53,833
Small (village-level) Medium Large
Mill size
Across the three mill sizes, the annualized cost benefit from exchanging the generator for solar is estimated to be between 42% to 45% of energy costs, and thereby represents a significant opportunity for mills to reduce operating costs.
Market size
Table 21 summarizes the findings of the market sizing analysis; regardless of market breakdown, both scenarios show an annualized market size of around US $12.5 million. The sales volume changes by scenario, with an annual potential sales volume of 346 units for scenario I (representing an average selling price per unit of US $37,000), and 239 units for scenario II (average selling price per unit of US $53,000).
50 These market breakdown assumptions were required as no empirical data is available.
51

Open Capital Advisors
Table 21: Solar market for crop processing in Niger
Tons of crop milled - % breakdown by mill typeScenario I: 100% Small millsScenario II: Market breakdown
# of mills nationwideScenario I: 100% Small mills 6,917Scenario II: Market breakdown 4,776
Potential annual sales volume in unitsScenario I: 100% Small mills 346Scenario II: Market breakdown 239
Annualized market size in US $ thousandsScenario I: 100% Small mills 12,727Scenario II: Market breakdown 12,566
100% 0% 0%
Mill sizeSmall
(village-level) Medium Large
60% 35% 5%
12,7277,636
0605
6,9174,150
346
020
0030
04,327
208 1
0602
Total
In absence of empirical data of how much of the key crops is actually processed in Niger, we present the market size for both scenarios at different crop processing levels in Table 22. Table 22: Solar market size for crop processing at different processing levels
25% 50% 75% 100%Annualized market size in US $ thousands at different processing levels
Scenario I: 100% Small mills 3,743 7,487 11,230 14,973Scenario II: Market breakdown 3,696 7,392 11,088 14,784
The market size grows with increasing crop processing levels from around US $3.7 million if 25% of production is processed, to around US $15 million if 100% of crops are processed. Further analysis outside of the scope of this research will be required to determine a more accurate market size and the geographic locations of this market for solar energy.
4.5 Water provision
Besides irrigation, the second large segment for water pumping is nationwide public and private water provision, both for drinking water and productive use (domestic and industrial).
Water supply in Niger follows different distribution models in rural and urban areas. In urban areas, - that is in 54 cities across Niger - the responsibilities are shared between the government and a private sector corporation. A public holding company owns the water supply network and manages its expansion and maintenance, and a private corporation manages the water distribution. The contractual relationship within this public-private-partnership is that of a lease and affermage, with the private corporation being held accountable to meet network efficiency goals as determined by the government.51
51 Consultation with Taibou A. Maiga, World Bank Sr Water and Sanitation Specialist, Niamey
52

Open Capital Advisors
In rural areas, the government finances and oversees infrastructure development, and these assets are then passed over to communes for ownership and management. In most cases, these assets are then leased to private sector water providers who operate them and manage water sales to the public.
In the absence of sufficient data, i.e. number of and regional distribution of water providers, and their volumes of water pumped or energy consumption, to model the electricity needs of the different private and public sector water providers, the assessment of the market opportunity for solar water pumping is based on the number of water stations. A water station is defined as a well or a borehole with water pumping activities. Electricity needs for the water stations are derived from the fact that each water station needs to lift water to surface level, and then pump the water to water points or outlets, which can be for example connected households, public institutions, or communal water fountains in rural areas. The modeling approach by water station appears favorable as each water station will need pumping technology, and water providers vary considerably by the number of water stations under their management, with frequent changes to the number in management.
The different types of water stations serve different markets and pump vastly different water volumes. The breakdown of water stations for the purpose of this analysis is as follows, categorized into rural and urban areas: 52
Rural areas
Puits cimentés (“PC”): Boreholes and wells, currently operated with handpumps. PCs are for communal use and are typically found in settlements of fewer than 500 people; water is pumped to the surface and collected at the PC.
Forage equipés en pompe (“FPMH”): Boreholes and wells, currently operated with handpumps, typically found in settlements of fewer than 1,500 people; water is pumped to the surface and collected at the FPMH.
Pointe d’eau autonome (“PEA”): Deep wells and boreholes, currently operated with generator power (or in exceptional cases with grid-power)53, found in areas with populations greater than 1,500; water is provided at multiple water access points surrounding the PEA.
Station de pompage pastorale (“SPP”): Deep wells and boreholes, currently operated with generator power (or some with grid-power); located in areas with livestock, typically in places where there is a higher water need than can be met by a PEA (to supply both livestock and people). SPPs are equipped with a powered pumping station, water reservoir and 1-3 water outlets,
52 Consultation with Taibou A. Maiga, World Bank Sr Water and Sanitation Specialist, Niamey53 No information available on the breakdown by power source for the different pumping stations.
53

Open Capital Advisors
typically split into outlets for livestock drinking, and basic taps for other water needs.
Mini addition eau potable (“Mini-AEP”): Deep wells and boreholes, currently operated with either generator- or grid-power, with integrated water distribution infrastructure supplying water directly to diverse buildings and public water fountains in a village, or to many small interconnected settlements.
Urban areas Addition eau potable (“AEP”): Deep wells and boreholes, currently operated
with either generator- or grid-power, with large, integrated water distribution infrastructure for urban areas. AEPs supply water to multiple connections across user types (households, industries, public institutions and public water fountains). AEPs serve between 2,000 to 15,000 households, as well as several hundred institutions, water fountains and industrial water connections.
The PC and FPMH are currently equipped with handpumps but are a potential future market for solar water pumping technologies.
For each type of water station, we modelled the energy required to pump underground water to the surface factoring in regional differences in borehole depth (i.e. groundwater levels are much deeper in the drier Northern Niger than in the south), and the energy required to pump the water to the relevant place of extraction. Further details on the approach are available in Appendix B.5.
Table 23 gives an overview of the nationwide average size requirements for water pumps and solar systems, as well as daily electricity consumption by type of pumping station; note that there are significant size variances across each type of pumping station.
Table 23: Average pump size, electricity consumption, and solar system size by pumping station
PC FPM H PEA SPP Mini-AEP AEPPump size requirement in kW 0.3 0.9 29.2 61.0 2.4 368.8 Daily electricity consumption in kWh 6.0 15.4 526.0 1,098.5 42.3 6,638.5 Solar system size requirement in kW 1.0 2.5 85.8 179.2 6.9 1,083.0
Nationwide averages
Business case
54

Open Capital Advisors
We first assess the annualized cost of different energy sources to power the pumping stations; the outcome of this analysis, on Region-level average, is shown below in Table 24. Table 24: Overview of annualized costs of different power alternatives for pumping stations
Region PC FPM H PEA SPP Mini-AEP AEPa) Average annualized cost of diesel-generators in US $ thousands
Agadez 1.6 4.0 125.7 178.7 13.9 924.4Diffa 0.4 0.9 32.8 40.3 10.2 705.6Dosso 0.4 0.9 32.8 40.3 2.8 705.6Maradi 0.4 0.9 32.8 40.3 2.1 705.6Niamey 0.4 0.9 32.8 40.3 1.3 439.4Tahoua 0.9 2.0 67.7 92.3 3.9 680.8Tillaberi 0.5 1.1 40.6 51.8 5.9 722.9Zinder 0.9 2.0 67.7 92.3 3.5 626.7
b) Average annualized cost of grid-power in US $ thousandsAgadez 1.0 2.4 74.4 105.8 8.2 547.1Diffa 0.2 0.5 19.4 23.8 6.1 417.6Dosso 0.2 0.5 19.4 23.8 1.7 417.6Maradi 0.2 0.5 19.4 23.8 1.3 417.6Niamey 0.2 0.5 19.4 23.8 0.8 260.0Tahoua 0.5 1.2 40.1 54.6 2.3 402.9Tillaberi 0.3 0.7 24.0 30.7 3.5 427.9Zinder 0.5 1.2 40.1 54.6 2.1 370.9
c) Average annualized cost of solar systems in US $ thousandsAgadez 1.1 2.8 70.1 95.6 8.0 510.1Diffa 0.3 0.8 17.5 22.3 6.5 382.6Dosso 0.3 0.8 17.5 22.3 2.2 382.6Maradi 0.3 0.8 17.5 22.3 1.5 382.6Niamey 0.3 0.8 17.5 22.3 1.1 255.0Tahoua 0.8 1.5 38.3 51.0 2.8 382.6Tillaberi 0.4 0.8 22.3 28.7 4.1 382.6Zinder 0.8 1.5 38.3 51.0 2.2 350.7
While we show the business case for solar as compared to diesel-generators and grid power, consultations have revealed that the vast majority of PC, FPMH, PEA, SPP, and Mini-AEPs are in off-grid areas, leaving only hand pumping or generator-powered pumping as alternatives. In contrast, the AEPs are the urban water providers, and based on our understanding, all grid-powered.
Based on the power needs of the water stations, we find a positive business case for all pumping stations from using solar rather than diesel powered generators. The analysis also reveals that there is frequently a business case for using solar over the grid for large pumping stations of 8 kW and above. Our analysis is purely based on direct equipment cost, including replacement components, but does not account for additional operating expenses that would be incurred to manage large scale solar production facilities. In addition, such solar production sites would require vast land areas, which are not always available in direct proximity to water stations, especially for AEPs in urban locations. A breakdown of the business case by type of water station and region is provided in Table 25.
55

Open Capital Advisors
Table 25: Annualized cost savings of switching to solar power for water pumping stations
Region PC FPM H PEA SPP Mini-AEP AEPa) Average annualized cost savings of solar versus diesel-generators in %
Agadez 29% 29% 44% 46% 43% 45%Diffa 36% 13% 47% 45% 36% 46%Dosso 36% 13% 47% 45% 23% 46%Maradi 36% 13% 47% 45% 31% 46%Niamey 36% 13% 47% 45% 14% 42%Tahoua 10% 27% 44% 45% 28% 44%Tillaberi 20% 32% 45% 45% 30% 47%Zinder 10% 27% 44% 45% 38% 44%
b) Average annualized cost savings of solar versus the grid in %Agadez (19%) (18%) 6% 10% 3% 7%Diffa (19%) (51%) 10% 6% (8%) 8%Dosso (19%) (51%) 10% 6% (28%) 8%Maradi (19%) (51%) 10% 6% (16%) 8%Niamey (19%) (51%) 10% 6% (45%) 2%Tahoua (57%) (22%) 5% 7% (21%) 5%Tillaberi (47%) (17%) 7% 6% (18%) 11%Zinder (57%) (22%) 5% 7% (4%) 5%
Variations in the percentage of average annualized cost savings are, to some extent, also driven by the modelling approach, i.e. marginal increases in power needs lead to a significant jump in investment levels for solar technology as larger system sizes are required.
Besides powered water pumping solutions, hand pumping is a feasible alternative for smaller pumping stations, and is currently used for PCs and FPMHs. Consultations revealed that, purely from an initial investment cost perspective54, solar systems are currently priced too high to compete with handpumps. Handpumps will typically not require any replacement parts over a lifetime of up to five to ten years, if well maintained; and for example, a treadle pump we looked at – which is suited to pull water up out of depths to seven meters – is priced at around US $70 for the cheap alternative and US $170 for the more technically-sophisticated alternative.55
Market size
As shown in Table 26, for market sizing purposes, we have assumed that all rural water points can use either hand pumps, generator power or solar power, and that the urban AEPs are all powered by the grid. Currently, PC and FPM H water pumping stations only have manual pumps; we have assumed that 20% of these pumping stations are accessible for solar technology, and the remaining 80% represent a potential future market opportunity when affordability challenges can be overcome, either through technology cost reductions and/or if suitable financing becomes available.
54 This ignores potential costs incurred for wages to operate the manual hand pump.55 OCA Consultations
56

Open Capital Advisors
Table 26: Assumptions on alternative power sources for water providersManual
(Hand pumps)Diesel-
generatorsGrid
PC 80% 20%FPM H 80% 20%PEA 100%SPP 100%Mini-AEP 100%AEP 100%
We estimate a total annualized market size of around US $97 million (representing an annual sales volume of around 812 units, i.e. pumping stations equipped). Of the total market size, over 37% is for sales of large pumping systems to AEPs; further analysis at the individual locations will be required to evaluate if constructing and managing large solar production facilities at the sites of the pumping stations is a feasible opportunity. Table 27: Solar market for water providers by water station type and region
AGADEZ DIFFA DOSSO MARADI NIAMEY TAHOUA TILLABERI ZINDER NIGERPotential sales volume in units
PC 6.5 11.9 30.5 41.6 0.4 26.2 26.7 18.6 162 FPM H 1.2 1.3 18.2 14.6 0.5 5.2 27.6 31.9 101 PEA 0.8 1.7 6.7 2.3 0.2 5.2 9.1 3.1 29 SPP 4.1 0.6 0.9 2.7 - 4.5 0.6 0.9 14 Mini-AEP 13.0 14.5 96.3 127.0 - 119.1 55.0 75.8 501 AEP 0.3 0.1 0.3 0.9 1.9 1.0 0.2 0.8 5
Total 26 30 153 189 3 161 119 131 812
Market size in US$PC 147,458 59,748 153,086 209,069 1,808 407,524 212,291 288,423 1,479,406 FPM H 69,618 20,524 283,603 227,629 7,463 154,006 429,759 945,102 2,137,704 PEA 1,122,198 578,639 2,332,089 789,053 52,604 3,940,500 4,061,436 2,371,952 15,248,469 SPP 7,746,857 267,787 379,365 1,205,041 - 4,590,709 344,308 867,134 15,401,201 Mini-AEP 2,064,234 1,899,369 4,187,312 3,768,537 - 6,741,105 4,548,975 3,293,758 26,503,290 AEP 2,550,425 765,128 2,295,385 6,503,591 9,691,604 7,651,283 1,147,693 5,260,236 35,865,346
Total 13,700,790 3,591,195 9,630,840 12,702,920 9,753,479 23,485,127 10,744,461 13,026,605 96,635,416
4.6 Solar street lights
Most of Niger’s roads are currently both unlit and – outside of larger urban centers – remote from the grid. Though this does not represent a “market” as such, since the only viable customer would be the government or an external donor, solar street lights present a major opportunity for cost savings in national road lighting policy, and the government is already beginning to implement this technology.
Consultations revealed that the government intends to install 15,000 streetlights in major urban areas, with a main focus on the largest eight cities, nationwide over the coming years.
57

Open Capital Advisors
In this section, we calculate the lifetime cost savings from solar streetlights compared to regular (grid-powered) street lights, and finally arrive at solar streetlights’ overall cost savings potential based on the government’s plan of installing 15,000 streetlights.
Based on manufacturer data and consultations, we estimate lifetime savings of around US $2,000 for a single solar streetlight compared to conventional (grid-connected) streetlights. Note that this figure does not take into account any grid extension costs that would be necessary to actually install on-grid streetlights in currently off-grid communities or roads. Taking these into account would clearly strengthen the business case for solar streetlights even further. Figure 17: Lifetime cost savings per solar street light
Based on the government plans to install around 15,000 street lights, this equates to an overall nationwide cost savings opportunity of around US $30 million. Total investment cost for the 15,000 street lights is estimated to be around US $20 million (plus installation costs), depending on type and quality of product. With an expected lifetime of street lights of around 20 years, this represents an annualized market opportunity of around US $1million.
58
Open Capital Advisors
5 Supply of solar technology and the supporting ecosystem
5.1 The supply-side landscape
The supply side of Niger’s solar market is at a very early stage. To date, supply side activities have consisted almost entirely of Engineering, Procurement & Construction (EPC) firms installing and maintaining fixed solar installations in response to tenders by large institutional clients such as NGOs, DFIs, and the government. These tenders cover a broad range of activities, from solar irrigation to solar street lighting to community electrification projects, but to date very few businesses have attempted to supply solar products directly to end-consumers (e.g. households, farmers, communities) in a scalable, market-driven way. A small number of businesses have run small pilots for solar lanterns, but these have been hampered by a number of operational and external challenges – especially the combination of limited customer purchasing power and high market price levels due to taxes and customs duties levied on solar product imports – and have only reached a very small fraction of the total market. In addition, what little activity has occurred has been concentrated mainly in the periphery of Niamey.
59
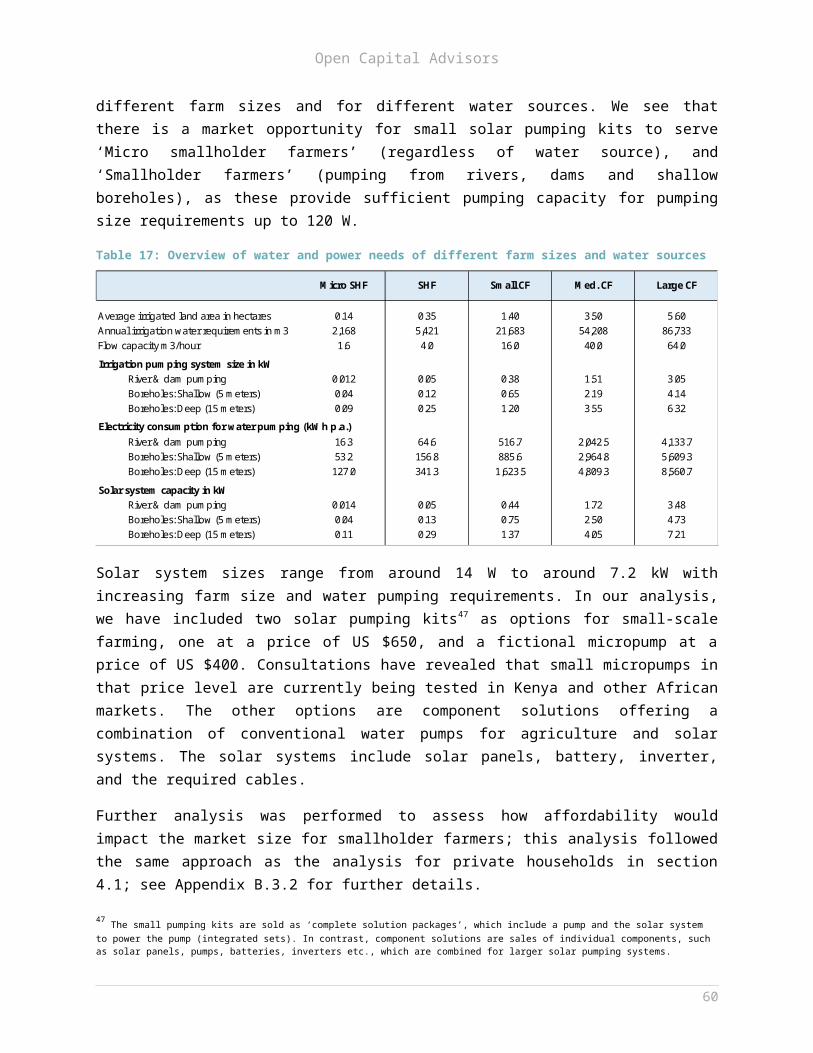
Open Capital Advisors
Larger international players, though interested in Niger as a long-term opportunity, do not see Niger as a priority market and are already stretched thin by recent expansion efforts in other countries. In addition, ongoing DFI initiatives to stimulate
solar sector growth in other Sub Saharan African countries continue to compete for these businesses’ attention. Instead, the end-consumer market has been dominated by informal players selling low-grade imitation products and with little capacity for scale.
This section summarizes the current state of supply side in Niger for local businesses, international businesses, and the informal sector. These findings are predominantly based on insights gained from dozens of stakeholder consultations in Niger; our consultations included businesses, both solar market players and other distributors, as well as intermediaries, NGOs, and other stakeholders.
60Figure 18: The business environment in Niger
Niger’s business climateDoing business in Niger is challenging. This is reflected in its ranking of 150th in the World Bank’s Ease of Doing Business rankings, with construction permits, electricity access, and paying taxes flagged as particular areas of difficulty. Nonetheless, Niger has made significant recent strides in improving its overall business climate. Notable examples of this include
Reducing the minimum capital requirement to start a business, and replacing the requirement for a physical copy of founders’ criminal records with sworn declarations at the time of company registration. This has made it easier for early-stage entrepreneurs to incorporate and has reduced the time needed to start a business to five days for individuals, and to seven days for legal entities.
Reducing the corporate income tax rate from 35% to 30% in 2010. Depending on the type of business, the Government of Niger negotiates with businesses and regularly waives taxes for companies involved in the import, export, and production of goods in Niger. Industrial investments under the Investment Code also enjoy some tax and customs exemptions, including in some cases exemptions from the value-added tax (VAT). Other potential tax exemptions include start-up costs, property, industrial and commercial profits, services and materials required for production, as well as energy use. Exemption periods range from 10 to 15 years and include waivers of duties and license fees. Specific additional investment incentives are available to companies operating in remote regions, energy, agro-industry and low cost housing sectors.
Enhancing related-party business transaction disclosure requirements to protect minority investor interests and combat insider dealing. This will give shareholders increased transparency into business transactions and affords them the right to appoint independent auditors.
Source: World Bank Doing Business, US State Department Investment Climate Statements for 2016, PriceWaterHouseCoopers: Paying Taxes 2011: The Global Picture

Open Capital Advisors
Local businesses
Though several businesses in Niger are active in the import, sale, installation, and maintenance of solar technology, only a small number of these are currently operating or are planning to operate scalable, market-driven business models focusing on sales to end-consumers (whether these end-consumers be households, productive users, or communities). Instead, based on extensive market consultations, the vast majority of solar activity to date has been concentrated in standalone, one-off projects for institutional clients such as NGOs, development organizations, and government agencies.
At present, there is only one entity in Niger engaged in direct distribution of solar devices to private household end-consumers. They offer a range of solar lanterns, some also including mobile phone charging capabilities, but sales have been relatively modest to date.
Niger’s second principal private-sector effort at developing a sustainable off-grid solar market came from a partnership between a local solar company and an NGO, both members of the industry association APE-Solaire, formed in 2013 between a group of solar companies, ASUSU, and SNV. This company imported several thousand solar kits into Niger, with the aim of unlocking the consumer market through consumer finance partnerships with ASUSU. Based on consultations with APE members, despite some initial success, the initiative ran into a number of obstacles including a lower than expected proportion of consumers who qualified for ASUSU consumer loans, low levels of consumer awareness around the benefits of high-quality solar products, as well as ongoing concerns about the impact of import duties on commercial sustainability.
A few other companies consulted are piloting or designing end-consumer business models, though these are at best early stage. There were also some attempts to roll out PAYG solar home systems models in Niger in the near future, but it is unclear if and when these companies will be able to deploy initial units, let alone reach scale; it appears likely that significant financial support and technical assistance will be required to set up the platform and systemic capabilities to operate a PAYG system.
The rest of Niger’s local solar supply side is made of a small group of 10-15 Engineering, Procurement and Construction firms (EPCs), who source, install, and maintain solar installations as one off-projects for institutional clients. Exact services provided vary by company, but typically include a combination of solar and non-solar offerings such as borehole digging, solar pumping, irrigation projects, solar street lighting, backup power systems for commercial and administrative buildings, and community electrification projects (e.g. mini-grids). Given the nature of these projects, system sizes tend to be relatively large, ranging from 500W or so at the very low end to several dozen kW for large irrigation projects. Some of these businesses expressed interest in diversifying into end-consumer distribution, though
61

Open Capital Advisors
most still saw plenty of commercial opportunity in their core business lines and very few expressed willingness to manage end-consumer financing in-house, preferring to partner with external finance providers.
In absence of a developed solar market for end consumer distribution, other market players including general electronics importers and distributors, as well as FMCG wholesalers and the large supermarket chains, might be best suited to fill the void in the distribution of household-level solar solutions, especially solar lanterns that can be sold over-the-counter without consumer finance. Unfortunately, many of these supply chains have limited reach outside of the major cities and towns. Also, consultations revealed that the market, especially for electronics distributors and wholesalers, is highly fragmented, and the many players vary considerably regarding sophistication level and size, with the majority being small players serving only one regional area. Consultations revealed that these channels are generally open to including solar products in their product ranges, but only once the market has been sufficiently catalyzed that a strong market pull for these products reduces their risk of low stock turns and inventory write-offs.
All solar companies and other distributors consulted are facing quite considerable challenges, as described in further detail in chapter 6. The solar market being in its infancy translates directly into lacking consumer awareness, but equally into lacking management experience. As a result, significant investment in technical assistance will likely be required to strengthen the management capacity of local solar businesses - especially if pay-as-you-go operations are to be introduced to the market - and ensure an efficient transfer of learnings from international markets.
International businesses
Several international solar companies have been extremely successful in serving end-consumer markets outside of Niger, particularly in East Africa, but increasingly also in a small number of countries in West Africa. These businesses include the major solar home systems businesses who jointly account for close to a million solar home systems sold across the continent, as well as end-consumer solar irrigation companies.
These companies’ efforts in West Africa have predominantly focused on larger, more developed markets, such as one company’s expansion into Cote d’Ivoire and another successfully raising a large sum in debt and equity financing to scale its pay-as-you-go solar activities in Nigeria. There has also been an example of an established player entering the less mature West African market, in Benin.
Several international solar companies consulted also view Niger as a potential long-term opportunity, but currently see other countries in the region as more attractive in terms of market size and ease to serve. For the most part, international businesses see more immediate opportunities in West African countries with larger
62
Open Capital Advisors
populations, higher levels of purchasing power, and a more developed private sector for potential distribution and financing partnerships. In addition, international players have raised concerns about product affordability in the Nigerien market while product imports are charged with high taxes and import duties.
International solar companies reported that several development partners had approached them to discuss the necessary nature and level of incentive to encourage market entry to Niger, and many companies noted that with the right structures (for the most part substantial, low-complexity market expansion grants and low-cost working capital) several would be open to the possibility. At the same time, however, there are currently several development finance initiatives attempting to draw a limited number of solar companies into a range of Sub Saharan African markets56, and the chances of success of new initiatives targeting international company expansion into Niger need to be considered with these other competing initiatives in mind. Indeed, many of the larger solar players in Sub-Saharan Africa are already thinly stretched across multiple countries due to both development finance incentive mechanisms and internal expansion decisions, and will need to consolidate in existing markets before considering potentially risky expansion propositions. In the short-term, it seems likely that initial market growth and development will need to be led predominantly by local players.
56See for instance Sida REEEP in Zambia; EnDev RBF facilities across East Africa; DBE WC facilities in Ethiopia
63

Open Capital Advisors
64
Current and recent solar initiatives in NigerPASE-SAFO (Safo-Maradi)
Program to increase access to energy services for the rural community of Safo (PASE – Safo). The program aims to contribute to economic and social growth, as well as poverty eradication by providing infrastructure to improve access to modern energy services. PASE-SAFO is the first phase of the Program of National Reference for Access to Modern Energy Services of Niger (PRASE) and is funded by the European Union (EU), United Nations Development Program (UNDP) and the Global Environment Facility (GEF).
In October 2013, five pilots for agricultural development were established to equip Safo with solar irrigation systems. Currently, pumping tests are underway to equip 10 additional villages with seven boreholes, as well as plans to drill an additional two large-scale boreholes to pump and supply farm units under a modern solar irrigation system.
ANPER
The Nigerien Agency for the Promotion of Electrification in Rural Areas (ANPER) is undertaking projects to increase access to electricity in 200 rural villages across Niger through solar photovoltaic systems. The specific goals of the project include installing 200 mini solar power stations in the 200 villages and equipping 45 MAEP and five farm sites with solar photovoltaic pumping systems.
Plan International
The Niger office of the international NGO Plan International issued a tender for the supply of a 27 5kW solar PV plant in the town of Gorou located in Tillaberi Region. The project will be funded by a grant made available by the Renewable Energy Centre and the ECOWAS Energy Efficiency program.
SNV
SNV had initiated a project to bring more than 1.2 million solar powered pico lighting systems into the Niger market. The project was the first to specifically target pico solar devices, and was set to run from 2014 through 2019, partnering with a private company to provide devices. Following recent changes to SNV country leadership, however, the future of the project has become somewhat uncertain according to SNV consultations.
AFD
AFD is carrying out multiple projects in the energy sector in Niger, mostly focused on grid extension. In addition, however, AFD is running various projects in water sanitation and water supply rural populations, including several infrastructure projects using solar pumps to provide drinking water to remote communities. AFD is also a minority shareholder (0.45%) in the state electricity company, NIGELEC.
Source: PASE-SAFO, ANPER, SNV, ESI Africa(see https://www.esi-africa.com/tenders/plan-international-niger-seek-solar-pv-services/ for PLAN tender)
Figure 19: Overview of recent key solar initiatives in Niger

Open Capital Advisors
Informal market players
In the absence of formal businesses supplying the end-user solar market, distribution of solar devices – particularly home solar devices – in Niger has to date been dominated by informal market sector players. These are predominantly importers – informally active to avoid customs duties and taxation – who operate across the Nigeria and Burkina Faso borders. They import what are commonly low-grade imitation products and then sell them on to small traders for retail distribution in kiosks and informal shops in urban and peri-urban areas.
Due to the low quality and cost of these products, as well as traders’ ability to evade Niger’s high duties on solar products (see challenges section below), informal traders are able to dramatically undercut sellers of quality-verified products with ostensibly similar specifications57. At the same time, though informal traders often have far-reaching local networks, they are unlikely to make for attractive distribution partners for formal businesses due to their highly unpredictable inventory cycles, lack of formal personnel and corporate structures, limited brand loyalty, and small individual sales volumes.
5.2 Niger’s financial sector
Brief overview of the financial sector 58
Niger’s financial sector is still nascent, but has been experiencing ongoing growth and development. It remains bank-centered, with the financial landscape mainly consisting of commercial banks, microfinance institutions (MFIs), social security organizations, and exchange bureaus. As of 2015, Niger had 11 commercial banks and 42 microfinance institutions.
In comparison to the commercial banking sector, microfinance institutions have a considerably larger footprint in Niger. In 2014, the number of people with a bank account was 438,170 compared to 722,533 with an MFI account. 59 Supervision of the microfinance sector is shared between Niger’s Microfinance Sector Regulation Agency (ARSM) the Banque Centrale des Etats de l'Afrique de l'Ouest (BCEAO), and the Central Bank for the West African Economic and Monetary Union (WAEMU). Jurisdiction is allocated based on the size of the financial institution: large MFIs (with deposits or loans outstanding exceeding CFA 2 billion / US $3.25M) are supervised by the BCEAO, while smaller MFIs are supervised by ARSM.
57 OCA consultations58 Based on: 1) Financial Sector Reform and Strengthening Initiative (FIRST), The Program Management Unit, Improving Access to Financial Services in Niger (2016), available at https://www.firstinitiative.org/projects/improving-access-financial-services-niger; 2) The World Bank, Global Findex Database, Financial Inclusion Data (2014), available at http://datatopics.worldbank.org/financialinclusion/country/niger; and 3) World Bank Project Appraisal Document (PAD)59 Financial Sector Reform and Strengthening Initiative (FIRST), The Program Management Unit, Improving Access to Financial Services in Niger (2016), available at https://www.firstinitiative.org/projects/improving-access-financial-services-niger
65

Open Capital Advisors
The MFI landscape is dominated by one large player. Growth of smaller MFIs, which account for about 30-40% of total MFI loans and deposits, are constrained by low levels of liquidity. Loans from banks to MFIs are rare and relatively small when they do occur (typical bank to MFI loans are under US $1 million).60 Nigerien authorities are currently focused on strengthening the regulatory environment for microfinance by improving oversight of lending operations, however, there is a need to further develop commercial loans from banks to MFIs to address the lack of liquidity and promote expansion of the sector.
Despite the presence of several financial institutions, access to finance remains limited overall. In 2014, only 6.7% of the population had accounts with financial institutions (both MFIs and banks). This represented a considerable increase over 2011 when only 1.5% of the population had an account, but was still significantly lower than the 2014 Sub Saharan African average of 34%. These figures are mirrored in low levels of financial access. Due to high banking costs, cumbersome documentation requirements, and limited geographic reach of branch networks, only around 3% of the population has access to commercial banking services (not including MFIs). Credit to the private sector at enterprise level as a percentage of GDP was also low at 13.4% as at June 2015, compared to, for example, Burkina Faso (another WAEMU country) at 26%.61 Low levels of access to finance have given rise to a market for digital finance and mobile money solutions. Uptake of these technologies remains slow, however, and only 14%62 of approximately 9 million mobile phone subscribers have registered mobile money accounts, of which only around 23% are active;63 see MNO section for more information on MNOs from consultations.
Key themes from financial sector consultations
As part of a site visit to Niamey in September 2016, the OCA team conducted in-person consultations with several Nigerien commercial banks and MFIs. In combination with insights gained from additional extensive consultations with SMEs – many of whom were seeking bank financing or had sought it in the past (see Supply Side section above) – several key themes emerged. Overall, our consultations painted a picture of a financial sector that, while acutely aware of the social and market potential of solar technology, had very little experience in solar lending and remained hesitant to engage in a sector that they viewed as underdeveloped and high-risk. Specifically, consultations converged on the following observations:
60 Financial Sector Reform and Strengthening Initiative (FIRST), The Program Management Unit, Improving Access to Financial Services in Niger (2016) 61 The World Bank, Domestic Credit to Private Sector (% of GDP), available at http://data.worldbank.org/indicator/FS.AST.PRVT.GD.ZS?locations=NE&name_desc=true62 OCA interviews with MNOs in Niger63 Ibid
66

Open Capital Advisors
Accessing financing as an SME in Niger is challenging. Banks have SME-lending programs in place but so far these have remained underutilized and were not an area of priority for banks consulted. As mentioned in the supply-section above, lending terms can often be prohibitively expensive for early-stage and growth-stage businesses. Though CFA currency union generally makes inflation and interest rates lower than in many other Sub-Saharan African markets, collateral requirements often reach 200% and typically include personal guarantees from company directors. SME lending is generally more accessible to businesses looking to finance equipment for one-off projects (both in solar and other asset-intensive businesses), but even then borrowers need to already either have a signed contract with an off-taker or the off-taker and borrower both have to be account holders at the bank. As a result, most businesses consulted made active efforts to avoid bank financing, and banks confirmed that uptake of SME products has been correspondingly low.
Banks reported ongoing initiatives to grow SME portfolios and stimulate lending to the sector as a whole, though with mixed success. One bank consulted had recently worked with a German consultancy under a World Bank-funded project to better structure its current banking systems and processes to SME requirements, with a particular focus on SMEs in agriculture. According to the bank, however, ambitions for the program were too high and local bank staff struggled to implement recommendations within the timeframe of the project. More systemic efforts include policies currently under development by the Central Bank of Niger to improve SME lending conditions, for instance by refinancing SME loans and creating a clearer SME policy framework (though note this is based on consultations with banks, not the Central Bank itself).
Several commercial banks consulted view the solar sector as very early-stage and are hesitant to lend to a nascent sector. Though banks reported that they were being approached for solar project finance by an increasing number of engineering firms in recent years, they also agreed that at present there were very few bankable opportunities for corporate finance in the solar sector. Potential borrowers – especially those applying for broader corporate finance as opposed to project finance – typically lacked the track record, collateral, and (in some cases) formality to qualify for bank lending. Banks consulted also raised concerns about the fundamental bankability of the solar business model in Niger, as there was a general perceived lack of capacity both for running business operations and for providing technical support and maintenance. Other concerns raised included the over-regulation of the sector in some areas (specifically import duties), and the under-regulation in others (lack of standards and licensing mechanisms that made it very difficult to distinguish legitimate, reputable businesses).
Guarantees can be effective in influencing lending decisions, but are unlikely to lead to fundamental shifts in lending strategy. Several guarantee programs from various international development organizations are already
67

Open Capital Advisors
available to Nigerien banks to stimulate lending across a range of sectors. Examples of this include AFD’s 50% partial credit guarantee program targeted at SMEs as well as various government guarantee schemes predominantly for road construction and other large-scale infrastructure. Banks consulted indicated that these guarantees made it easier to lend in specific cases, but only affected overall lending decisions in marginal cases where the guarantee helped to sufficiently de-risk loans that already fit into banks’ existing lending processes and strategy. For instance, one bank reported that given current internal capacity and priorities, it was unlikely that even a very generous guarantee would lead to substantial new lending for off-grid solar businesses that were operating both an untested business model and in untested markets. Lines of credit were seen as a more attractive potential intervention as they encouraged lending in addition to, rather than replacing, current lending practices, but again only if structured to fit well within banks’ existing processes and operations.
Commercial banks see consumer finance for smaller solar devices as the remit of MFIs, especially in rural off-grid areas. Banks consulted reported a limited product offering and low uptake of individual consumer finance loans for solar products. Almost all banks consulted had recently begun offering personal loans for home solar devices, though to date these have only been accessed by a few dozen borrowers (per bank). In addition, these programs are geared to larger kits (with typical loan sizes of over US $1,000 and power capacities of several hundred Watt) and only accessible to salaried account holders, who automatically make repayments from their salary every month.
Though some banks have begun piloting similar personal loans but for large-scale irrigation equipment, they did not view consumer finance for smaller solar devices, especially in rural areas, as a sustainable line of businesses or attractive future opportunity. Reasons cited in consultations included the small size of the loans, especially as viewed against typical bank transaction costs, and that few banks believed they had sufficient reach to service off-grid customers outside of urban areas.
The MFI sector in Niger is effective, but highly concentrated. As mentioned above, MFIs have significantly deeper levels of financial penetration and substantially larger asset bases than many commercial banks in Niger. The sector is highly concentrated, however, and the one dominant MFI is estimated to hold around 75-85% of total MFI accounts. The remaining MFI accounts are distributed across a fragmented system of smaller institutions and savings co-operatives.
The largest MFI has considerable reach with off-grid populations, as the vast majority of its clientele is based in rural areas, and its more than 50 branches cover broad sections of the country in both peri-urban and rural areas. Given their dominance, market penetration, and experience offering small asset loans, any consumer finance and affordability interventions will likely have to involve this large
68

Open Capital Advisors
MFI to some degree, while avoiding the pitfalls of previous partnership efforts between solar players and MFIs, by ensuring that responsibilities are clearly defined and that technical assistance is offered where needed.
Sharia compliant consumer lending models will be key to meeting the financial needs of a broader share of the population. With an estimated 98% of the Nigerien population being Muslims64, consultations revealed a potential opportunity to expand the supply of Sharia compliant financial services, both for households and businesses. While demand for Sharia finance is hard to quantify in absence of market research, provision of Sharia compliant finance will surely be an important consideration in stimulating broader uptake of consumer lending for solar products, especially in rural areas.
5.3 Mobile network operators
Overview of solar / MNO partnership opportunities 65
Mobile network operators (“MNOs”) have become key partners of solar distributors in many markets across Sub-Saharan Africa, bringing a combination of deep distribution networks, widely recognized brands, as well as financial inclusion and credit rating systems through mobile money technology. Examples of these partnerships range from GSM-enabled payment integration to full sales support including product co-branding, direct distribution through outlets, and data integration. To date these partnerships have focused mostly on household-level solar home systems and solar lanterns, though a growing number of mini-grid operators have also begun partnering with MNOs to automate payment and registration services66, and initial pilots are underway to link use of solar irrigation systems to regular mobile money payments67. Especially in areas with low population densities, mobile money is key to reducing operational costs to make small microfinance lending a viable business model.
These partnerships are also beneficial for MNOs, both in cash and non-cash terms. Cash benefits include mobile money transactions commission, and a revenue share or commission based on sales through shared distribution networks. Non-cash benefits include increase in airtime usage for customers who would not otherwise have access to phone charging and significant expansion of mobile money users, especially among demographics not otherwise reached by the MNO. The latter has been a powerful driver for MNOs. MNOs, including in Niger, have observed how challenging it is to raise awareness of mobile money, especially among rural
64 United States Department of State, Bureau of Democracy, Human Rights, and Labor, International Religious Freedom Report for 2015; available at: https://www.state.gov/documents/organization/256267.pdf65Adapted from similar section in recent OCA report on solar in Zambia for World Bank66 See, for instance, IFC mini-grids benchmarking (http://sun-connect-news.org/fileadmin/DATEIEN/Dateien/New/IFC_Minigrids_Benchmarking_Report_Single_Pages_January_2017.pdf)67 See, for instance, Azuri and Sunculture in Kenya
69
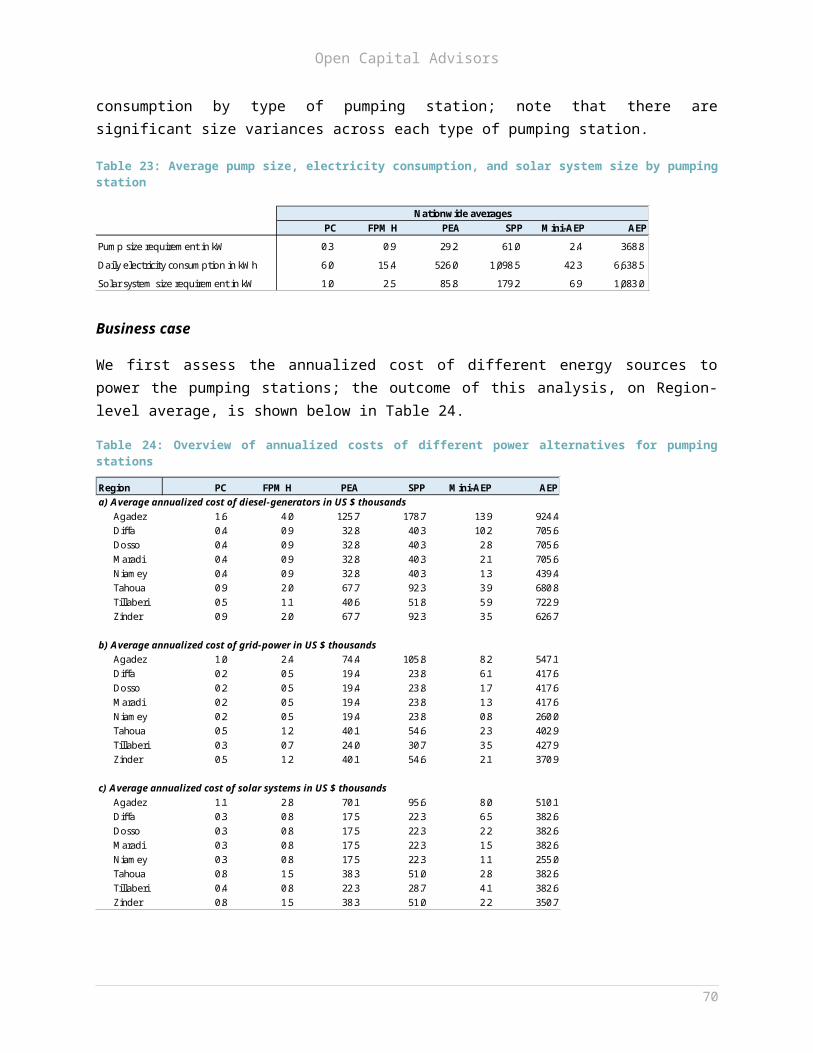
Open Capital Advisors
populations; by contrast, selling energy services is far easier and offers a direct entry point to mobile money usage.
Mobile Network Operators (MNOs) in Niger
Four MNOs currently make up the Nigerien market: Airtel, Orange, Moov and Sahelcom. Airtel is the market leader followed by Orange. Combined, these MNOs account for close to 9 million mobile subscriptions, equivalent to around 45 subscriptions per 100 people. Though MNOs consulted reported strong growth in the Nigerien telco sector, these levels remain well below more mature West African markets. For comparison, subscription rates in Nigeria and Cote d’Ivoire – two markets that have seen strong recent solar market growth – stand at around 90 and 105 respectively per 100 people68.
Mobile money penetration and usage in Niger is similarly low. Though MNOs have launched mobile money platforms in Niger in recent years, their use is still comparatively limited, especially outside of Niamey69. Currently, as shown in Figure20, only around 300,000 MNO customers, or 3% of registered mobile phone subscribers, are active mobile money users. Nigerien MNOs noted increasing mobile money usage as a key strategic priority, and are running several marketing initiatives to this effect. For instance, one MNO is working with informal savings groups to attract more subscribers in rural areas, as well as with insurance sector associations to digitize insurance payments and other social payments. This MNO has also launched mobile money integration into utilities payments, where customers can prepay for power and water. According to consultations, however, usage of these initiatives remains well below potential, and the lacking uptake in semi-rural and rural areas limits the opportunity of integrating mobile money into sales models targeting the off-grid population.
68World Bank, Mobile Cellular Subscriptions (2015) available at http://data.worldbank.org/indicator/IT.CEL.SETS?end=2015&locations=NE&start=2015&view=bar69 OCA consultations with Airtel
70

Open Capital Advisors
Figure 20: Mobile penetration and mobile money uptake in Niger
Partnership potential for solar in Niger
Given the successful experience of partnerships between MNOs and solar operators in other markets, MNOs have the potential to become a key distribution, branding, and payment partner for Niger’s solar sector. MNOs consulted understood the potential for energy products as a mechanism to their customer base and usage of their products, but still viewed the sector as too small and lacking a concrete value proposition. Brand risk to MNOs from failed partnerships is substantial, especially in an unproven sector made up of unproven entities.
In addition, Niger’s fragmented MNO distribution network may prove incongruous with structuring far-reaching distribution partnerships with solar businesses. The largest MNO networks, Airtel and Orange, have a total of 45,000 and 30,000 points of sales respectively, the vast majority of which are small, independent agents served by a network of a few dozen intermediary dealers who serve as primary distribution partners for different parts of the countries. Based on our consultations and experience structuring MNO partnerships in other markets, specific challenges are likely to include:
Complexity of integration: The cost and technical complexity of integrating new products into distribution channels is substantial, especially if products require a consumer financing component and/or the collection and capture of consumer data. Given the fragmented nature of MNO distributors and sub-distributors in Niger, distribution partnership beyond small pilots will likely entail considerable complexity
71

Open Capital Advisors
Limited distributor cash flows: Based on MNO consultations, distributor liquidity is low and few will have the ability or appetite to hold large amounts of inventory of solar devices. MNOs themselves expressed similar hesitation at the prospect of pre-funding solar devices off their own balance sheets. One possible solution for this is for MNO agents to sell on commission (though this would not address solar businesses’ considerable current working capital issues), but even then, experience in more established solar markets shows that solar companies or distributors typically ask for bank guarantees from sub-distributors to insure against loss, damage, or theft. Few MNO agents or sub-distributors are likely to be able to access these sorts of guarantees in Niger at present.
Lack of point-of-sale capacity: In addition to sufficient distributor working capital, successful distribution partnerships also require points-of-sale with both the physical and the technical capacity to store and sell units, and respond to customer service issues. Selling bulky, technically complex solar devices from small kiosks with limited retail space and technical know-how will likely prove challenging in the absence of substantial investment in infrastructure and capacity building.
Though it will be critical to keep MNOs involved in the broader conversation as much as possible, several factors make it unlikely, however, that MNOs offer a near-term opportunity for partnership or intervention.
72

Open Capital Advisors
6 Challenges to solar market growth
Despite the market opportunity for solar in Niger (see demand analysis chapter) and a small but capable set of solar suppliers, the market in Niger remains at an extremely early stage, especially for end-consumer-facing, market-driven business models. Businesses and other stakeholders consulted broadly agreed on the principal barriers to growth and unlocking the solar market. In summary, the main challenges reported were:
Import duties on solar devices Limited access to corporate finance Low consumer purchasing power and lack of consumer finance Lack of partners for distribution and maintenance Competition from informal players and market spoilage Low mobile money penetration70
The rest of this section discusses these challenges and their implications more fully.
Challenge 1: High import duties on solar devices
Business consulted unanimously agreed that Nigerien import duties on solar technology were perhaps the principal barrier to scale, and that removing or reducing these would be one of the most effective methods of unlocking rapid growth in the market.
At the time of writing, solar imports are subject to around 50% taxes and duties applied to the customs value of the product upon importation to Niger. Solar panels are exempted from customs duties, but batteries, inverters, solar fridges and other solar accessories are charged with 20% customs duties. Consultations revealed, that solar lanterns and solar home systems are also subject to the 20% customs duties if the solar panel is not packaged separately and invoiced as a separate component. In addition, all products, including solar panels, are subject to 19% VAT and diverse other charges and taxes 71; consultations revealed that the application of taxes and charges is quite ambiguous and that there is a lot of uncertainty surrounding which charges apply, and when. For companies to remain profitable, they must pass on these costs to end-consumers, which in turn limits the market they can address to well-funded institutional clients rather than direct sales to private households.
70 Low mobile money penetration is a challenge for organizations that want to offer consumer financing to private households for the purchase of small household systems. Private sector players, development organizations and financial service providers stated this as key hindrance to more rapid growth of microfinance options in this sector. 71 These include for example the impôt sur le benefice (3%), redevance statistique à l’import (1%), taxe vérification des importation (1%), prélèvement communautaire solidarité (1%), and the prélèvement communautaire (1%).
73

Open Capital Advisors
In addition to increasing input costs, these duties have further undermined solar businesses in Niger by contributing to the rise of a thriving informal sector for smaller-scale household devices, particularly solar lanterns. Though products entering through unofficial channels are typically of much lower quality and durability, bypassing customs duties allows informal traders to undercut market prices sufficiently to compensate for quality differentials, particularly in a country with limited consumer awareness of different solar brands and quality issues of low-cost products. One particularly flagrant example of the duty’ distortionary effect on the local solar sector was offered by Total, who reported having to compete with Total products smuggled into Niger from Burkina Faso by informal traders.
Challenge 2: Limited access to corporate finance
Along with import duties, local businesses mentioned lack of access to growth capital as the primary constraint to growth of the solar sector in Niger. Devices and equipment are in almost all cases shipped either from China or from Europe, creating long delivery lead times. Typical supplier payment terms are 30% upon placement of the production order and the remaining 70% upon shipment before any cargo has even left its port of origin. Coupled with delivery times of up to 3 months and long inventory holding times once products have arrived in Niger, this creates acutely high working capital requirements for businesses. These working capital requirements will only be intensified for any businesses in Niger considering offering consumer finance in-house (such as PAYG home solar devices), which additionally incurs large outstanding consumer receivables.
At present, very few sources of funding exist in Niger that are able or willing to meet these needs. Most solar SMEs consulted reported being unable to access working capital from banks at sustainable terms. Though reported interest rates of around 10-15% are significantly lower than in other Sub Saharan African markets (rates charged in East and Southern Africa are frequently double this level), local banks impose severe collateral requirements – typically in excess of 150% and in some cases up to 200% – on what they perceive to be an unproven, high-risk sector72. In addition, various hidden bank changes and administrative fees often increase effective interest charges significantly beyond nominal rates. For most entrepreneurs, meeting these requirements means offering real estate as collateral, which is in turn frequently undervalued by banks in the absence of reliable, independent appraisers.
According to our consultations, access to bank finance is somewhat easier for businesses borrowing for equipment purchases for projects with a guaranteed, institutional off-taker such as an NGO or development organization. In these cases, the purchase agreement with the institution gives the banks enough risk protection to be more willing to engage with smaller solar companies, though collateral
72 As an example, one business consulted reported having to post CFA 108M in collateral for a CFA 60M loan (approx. USD 200k)
74

Open Capital Advisors
requirements remain significant even in these cases. As a result, even businesses whose primary clients are institutional have often made deliberate efforts to avoid bank financing.
Access to non-bank sources of funding is equally challenging. Though Niger has attracted close to US $120 million in impact capital over the last 10 years, the overwhelming majority of this has come in the form of large debt and equity investments from international development finance institutions, with very little of this funding accessible to early-stage and growth-stage solar businesses73. With debt and equity markets largely closed off, solar companies have mostly been funded through owner equity and friends and family.
Challenge 3: Low purchasing power & access to end-user finance
Niger remains one of the poorest countries in the world and though the need for efficient solar power solutions is high, purchasing power for solar products of all varieties among end-consumers is low. Lack of perceived ability to pay is a significant factor in businesses’ decision to only serve institutional clients, as discussed above. Unanimously across all consultations we heard that to unlock end-consumer markets for solar devices in the near-term – whether for household systems or for agricultural use – would require some sort of end-consumer finance. Our market analysis chapter confirms this, showing an annualized market for household systems of US $45 million in the presence of consumer finance, and around US $7 million in its absence. This was confirmed through our focus groups, in which lacking purchasing power was named together with bad quality products and lacking availability as key reasons for not owning solar lighting solutions.
Consumer finance provision has been hampered by low levels of financial awareness and financial inclusion. Only an estimated 3% of Nigeriens hold an account at a financial institution, and only about 1.5% are active mobile money users – among the lowest levels in Sub Saharan Africa74. Though household dynamics are likely a factor in these low numbers as one adult will typically manage all financial matters in a large household, there is still additional need for broader financial inclusion and financial literacy initiatives to ensuring sufficient availability of credit.
At the same time, Niger boasts an active and promising MFI sector. MFI account holders, though still small as an overall percentage of the overall population, outnumber bank account holders by over 60% (~720,000 vs 440,000)75. This sector is dominated by one provider, ASUSU, with 52 agencies serving some 650,000 clients (both active and inactive), around 80% of whom are estimated to be in rural
73 GIIN West Africa Dalberg report74 World Bank Findex http://datatopics.worldbank.org/financialinclusion/country/niger75 ASMR via WB PAD
75

Open Capital Advisors
areas76. Despite this potential, MFIs have been hesitant to engage more broadly with the solar sector to date, and previous attempts to do so have been met with limited success (see supply side landscape section above). Several other businesses consulted expressed concern that the tenor and size of typical ASUSU loan products (~USD 80 over 6 months on average) were not well-suited for financing solar equipment beyond basic lanterns and home systems. Consultations further revealed that high collateral requirements often limit accessibility of microfinance services, especially as financial service providers are unwilling to accept traditional land that lacks formal documentation as such.
In addition, anecdotal evidence from consultations suggested that negative cultural attitudes to debt were another challenge, particularly for loans that did not demonstrate immediate, visible economic returns such as livestock and other productive assets. Demand for credit for solar products may therefore be low in the absence of consumer awareness campaigns to demonstrate the economic benefits of solar technology.
Challenge 4: Lack of partners for distribution & maintenance
As shown in the table above, very few solar businesses in Niger currently perform or are planning to perform end-user distribution. One-off projects for institutional clients have made up the bulk of solar market activity to date, and plans to diversify into more scalable business models are very early stage at best. In addition, consultations suggest that there are very few established last mile distribution networks, even in non-solar sectors. Sectors that in other markets often have deep local distribution networks and offer high-potential partnership opportunities for solar operators – agricultural inputs or consumer electronics distributors, for example – are fragmented in Niger or have limited reach outside Niamey and its periphery. The major MNOs, despite having broad national reach, operate predominantly through fragmented agent networks with limited working capital to purchase solar devices, and MNOs expressed reluctance to finance inventories themselves. As such, both local and international solar companies seeking to reach end-users in Niger will likely need to invest considerably in developing and maintaining sales and distribution channels.
The lack of distribution partners is paralleled by an equally important lack of qualified technicians and partners for installation, service and maintenance. Even at the small scale of the current solar market in Niger, solar businesses noted an acute shortage of competent technical personnel to maintain installations and respond to service events. In many cases, technical directors or company directors were personally required to drive to remote sites themselves to attend to repairs. This problem will only be exacerbated once businesses attempt to scale end-user
76 OCA consultations
76

Open Capital Advisors
distribution, and further reduces the number of attractive distribution partners if distributors are also to provide basic front-line servicing.
Challenge 5: Informal sector competition & market spoilage
As mentioned previously, several informal entrepreneurs have taken advantage of high import duties by illegal importing low-quality solar products ranging from solar lanterns to larger home installations. This has hurt the solar market in two ways. First, black-market traders are able to significantly undercut the prices of registered businesses who are still subject to high taxes and import duties. Second, these products are largely low-grade, failure-prone knock-offs that often have a lifespan of little more than a few weeks, which has exacerbated low levels of initial consumer awareness around solar technology by damaging perceptions of solar’s durability and reliability. Sensitizing consumers to the benefits of higher-quality products will therefore require significant investment in consumer awareness, a cost which few businesses are likely to want to incur on their own as first-movers.
Challenge 6: Low mobile money penetration
Mobile money has been instrumental in scaling solar technology in other Sub Saharan African markets, particularly for non-institutional end-consumers of devices such as pay-as-you-go solar home systems. At present, however, only around 7% of Nigeriens subscribe to mobile money services, and based on consultations with MNOs only around 1.5% are active users. Given Niger’s large unbanked population, mobile money could enable solar distributors to reach end-users through direct consumer finance, enabling scale beyond current MFI client bases and avoiding potentially cumbersome partnerships with financial institutions on sales and distribution. In addition, mobile money – whether used by an MFI or directly by a solar distributor – can significantly reduce consumer finance transaction costs compared to typical high-touch MFI models that incur significant administrative costs in client screening, selection, monitoring, and collection. In the absence of even a rudimentary end-user solar market this is likely a secondary challenge, but increased access to and usage of mobile money could be important to scaling access beyond the capabilities and appetites of a small number of MFIs in the longer term.
77

Open Capital Advisors
7 Recommended market interventions for stand-alone solar systems
As discussed in the previous chapter, consultations with solar technology distributors in Niger identified a range of key challenges and barriers to growth for private sector players, including:
High import duties on solar products Low end-user purchasing power Limited access to finance for both business and consumers Lack of formal distribution channels to reach peri-urban and rural off-grid
populations Market spoilage due to inflows of low-grade imitation products
Further, our consultations with businesses in the solar market revealed that most businesses provide one-off project services. Thus, there are currently no suppliers of Lighting Africa-approved solar home systems in the market, and Lighting Africa-approved solar lanterns are only distributed through Total’s petrol station network (‘Total Awango program’). Apart from Total, all other active solar businesses are focused on public and development sector contract work.
International solar companies are unlikely to enter Niger in the near future. These players currently consider other markets more attractive, based on considerations such as regulatory environment, size of addressable market, as well as availability of partnerships for sales and distribution (including MNOs). As a result, scaling solar in Niger will likely need to be a home-grown effort in the short term, with sales, distribution, and end-consumer service channels set up by local businesses.
Based on this assessment of the Nigerien market, we believe significant government and development sector support for the solar market will be required to accelerate private sector growth. At present, neither the supply side, the financial sector, nor end-consumers appear ready to drive solar market growth in the absence of significant intervention. In particular, we recommend focusing interventions on market stimulation for smaller household systems and solar pumping kits. Solar businesses serving institutional clients and large corporates are generally able to secure project financing from banks, and these sectors are mostly based on discrete tenders and contracts that are less suitable for rapid, market-led growth initiatives. Furthermore, businesses serving institutional clients will likely enjoy collateral benefits from systemic interventions aimed at unlocking household and irrigation markets.
Table 28 summarizes our recommendations:
78

Open Capital Advisors
Table 28: Recommended interventions for standalone solar systems
Intervention Description Rationale (in short)Tax exemptions on solar technology
Make solar products exempt from VAT and import duties
Currently costs to solar companies are artificially inflated by high import duties; these costs are passed on to customers, making solar less affordable.
Consumer education programs
Widespread, multi-channel consumer education and benefit awareness building campaigns
Target end-users and the supporting ecosystem including distributors and retailers
Coordinate efforts of private, public and development sector
Overcome negative consumer perceptions and build benefit awareness
Influence purchase decisions and ease access to distribution channels
Inventory financing facility (IFF)
Concessionary credit line so financial institutions (FI) can access liquidity for solar market lending
FI use liquidity to offer solar companies loans (potentially at subsidized rates) to refinance inventory holding
Loans available to all solar companies (small household systems, larger PV installations, and mini-grids)
Start with few FI, maybe ASUSU and one large bank, and gradually expand
Long inventory financing periods present a key challenge to growth for solar lantern and solar home system distributors
High upfront financing requirements present a key challenge to distributors of larger PV systems (including pumps)
Credit guarantee scheme for IFF
Private sector lending portfolio is de-risked through guarantees
Loss sharing agreements to cover irrecoverable inventory loans
De-risking encourages private sector lending to solar sector
Initial security until the proof case of economic viability of lending to solar businesses has been established
Consumer loan financing facility (CLFF)
Concessionary credit line so FI can access liquidity for solar market lending
FI offer consumer lending schemes to finance solar asset purchases
Focus on liquidity for private households
Sharia compliant financing required to reach broad share of population
Low purchasing power among private households is key constraint to growth for solar home systems (and larger solar lanterns)
Credit line and underlying guarantee required to establish proof case of economic viability of receivables financing
Facility can be expanded or transformed to provide PAYG operators financing of on-balance sheet consumer loans
Credit guarantee scheme for CLFF
Private sector lending portfolio is de-risked through guarantees
Loss sharing agreements to cover irrecoverable consumer loans
De-risking encourages private sector lending to solar sector
Initial security until the proof case of economic viability for solar consumer loans has been
79

Open Capital Advisors
Intervention Description Rationale (in short)established
Market entry and expansion grants
Combination of upfront grants and results-based financing to invest in infrastructure and working capital
Awarded to distributors of small household systems, as well as mini-grid operators
Significant upfront investment to build distribution network and source inventories to serve household market
Significant upfront investment and long amortization periods for mini-grids
Technical assistance
Government: Assistance in strengthening the regulatory environment, with a focus on import regulation, industry standards and licensing processes
Financial Institutions: Capacity building related to financial services aimed at solar industry, credit risk assessment etc.
Solar companies: Best practice transfer from international markets and support in setting up technology platforms for PAYG; incubation and acceleration of early-stage businesses
MNOs: Best practice transfer regarding platforms, interfaces, and market development from international markets
Solar technicians: Capacity building for nationwide installation and maintenance of solar equipment
Make the business environment more conducive and profitable
Strengthen the overall ecosystem surrounding the solar market
Ensure knowledge transfer from abroad for faster, more cost-efficient progress
We recommend initiating the overarching systemic interventions as timely as possible, as removal of the import duties will be key to further market growth. Consumer education programs will be required to stimulate the demand side, and significant technical assistance will be required to develop a more conducive ecosystem for private sector players operating in the solar industry.
The next step is to encourage investment on the supply side through the provision of market entry and expansion grants, and launching the inventory financing facility, and putting consumer financing schemes in place to reduce affordability-based limitations of demand. As the market grows, overall funding requirements for market interventions will increase; for an initial 2-year market development program, we estimate the funding needs as shown in Table 29.
80

Open Capital Advisors
Table 29: Estimated funding requirements for an initial 2-year market development program
Est. funding requirement
Market entry and expansion grants US $ 1.2 million
Inventory financing facility for household systems US $ 0.8 million
Inventory financing facility for solar pumping kits US $ 0.2 million
Credit guarantee program for inventory financing facilities US $ 3.6 million
Consumer loan financing facility for household systems US $ 1.2 million
Consumer loan financing facility for solar pumping kits US $ 0.5 millionCredit guarantee program for consumer loan financing facilities US $ 2.0 million
Total funding requirement77 US $ 9.5 million
In the remainder of this section we discuss these interventions in further detail, and provide, where appropriate, further details on the required size of each.
7.1 Overarching systemic interventions
Currently, regulatory factors and an underdeveloped ecosystem to support the solar industry create substantial challenges for solar companies operating in Niger. Consultations revealed that solar companies in Niger nearly exclusively focus on serving public and development sector contracts, and often have little to no experience in serving the needs of private households, especially outside of urban areas. In this section, we recommend interventions to strengthen the entire market landscape, including policy changes, consumer education, and technical assistance.
Tax exemptions on solar technology. Unanimously in all consultations, we heard that the high taxes and duties applied to solar products at importation have a disastrous effect on the market, driving up prices in a market which is anyway severely constrained by lacking purchasing power on the demand side. In addition, this direct cost increase makes it even harder for the formal sector to compete with the untaxed, low prices offered in the informal markets on illegal imports. If products are exempt of duties and VAT, the lower cost can be passed through to end consumers. Given current income levels in Niger, tax exemptions on all solar technologies appear key to making products affordable, and allowing companies to make sufficient margin to achieve sustainability. In the meantime, until tax exemptions have been enforced, APE Solaire members can import up to 1,260,000 77 The funding requirement shown is the gross funding requirement, i.e. it includes both the facilities and the guarantees to cover the facilities. Depending on how the interventions are structured, there will be no need to double the funding requirement by holding capital on escrow accounts to guarantee for funding already provided, and only the actual losses incurred require funding in the credit guarantee programs.
81

Open Capital Advisors
units of specified Lighting Africa-approved solar lanterns and solar home systems exempt of customs duties based on an agreement between the Ministry of Finance and SNV signed in March 2014.
Consumer education programs. As experienced in many African countries, illegal imports of sub-standard solar products have scarred the broad perception of solar products. This market spoilage was confirmed by consultations and our focus groups in Niamey, Maradi and Tahoua. While most consumers, even in rural areas, seem to know of solar lights, solar products are perceived as expensive, unreliable, and low quality; also, e.g. health benefits – as compared to kerosene lamps or candles - are not really understood. Purchase decisions are mainly driven by price, as no brand or certification standard has established itself as reliable in the minds of consumers. Therefore, widespread national multi-channel campaigns are needed to educate consumers on the benefits of solar, which brands to rely on, and help overcome negative perceptions.
Technical assistance. Currently, the market environment is very challenging for solar companies. The government enforces high import duties on solar products, and there is no market protection through industry standards and licensing processes. Financial institutions are essentially only willing to offer financing to long-standing, affluent customers, and only against high collateralization. Solar companies have limited access to quality advisory services, and often face language barriers when trying to learn from other countries’ experiences and innovations. Consultations frequently revealed, that solar technicians are sparse, and therefore solar businesses need to send out teams from Niamey for any installation and maintenance work. Uptake of asset financing schemes with mobile money integration is limited by the geographic reach of the mobile phone network, and especially mobile money adoption. To make the Nigerien solar market conducive, and more attractive to foreign investment, we recommend the provision of technical assistance to the government, financial institutions, MNOs, solar businesses, and solar technicians; further details are provided in Table 30.
Table 30: Recommended areas for provision of technical assistance
TA recipient
Purpose of TA Rationale (in short)
Government
Strengthen the regulatory environment, with a
Currently, the market is flooded with sub-standard products – solar lanterns, solar home systems, and solar pumps – that are damaging consumer perceptions of
82

Open Capital Advisors
TA recipient
Purpose of TA Rationale (in short)
focus on import regulation, industry standards and licensing processes
solar With price sensitive end-consumers, it becomes very
hard for formal players to compete with the low prices of effectively duty-free illegal imports sold in informal markets
Industry standards, such as IEC or the Lighting Africa minimum quality standard, need to be adopted in national law to protect consumers from sub-standard products
Processes and systems need to be put in place to enforce compliance with product standards and ensure businesses have the license to operate
Financial institutions
Financial services and credit risk assessment tailored to the needs of diverse solar market companies, from solar lantern distributors to mini-grid operators
Banks lack understanding of the solar market and the associated risk profile, and are hesitant to lend to businesses or consumers
Credit risk assessments are largely focused on asset securities, and thereby limit lending to startup businesses and consumers
Financial institutions lack awareness of the potential to integrate services with mobile money
Potential to expand Sharia compliant financial services
Solar companies
Best practice transfer from international markets and support in setting up technology platforms for PAYG; incubation and acceleration of early-stage businesses
Nigerien solar companies mainly focus on contract work, and have limited to no experience in serving the market for private households, especially outside urban areas
Limited availability of advisory support, incubation and acceleration for early-stage businesses in general, and especially solar businesses
Many lessons have been learnt across international markets and can, to some extent, be transferred to support rapid scaling of the market
No domestic experience in setting up and managing technology platforms for PAYG
International players may require assistance in navigating Nigerien market and regulatory landscape
MNOs Best practice transfer regarding platforms, interfaces, and market development from international markets
Significant opportunity to enhance the mobile money proposition for retailers and mobile money users to stimulate broader uptake
Opportunity to support MNOs in developing sales and distribution networks, especially to rural areas, and explore the potential for strategic partnerships
Limited access to quality advisory services results in lacking support to leverage technology and innovations already piloted and successfully rolled out in other SSA markets
Opportunity to develop platforms for low-cost direct interfaces to the financial sector and the networks of other MNOs
Technical training & maintenan
Capacity building for nationwide installation and
The lack of qualified technicians for installation, service and maintenance represents a key constraint to market growth
83

Open Capital Advisors
TA recipient
Purpose of TA Rationale (in short)
ce maintenance of solar equipment
Businesses face considerable costs of sending headquarters staff out nationwide, even for minor maintenance work
Lack of network of trained, certified solar technicians that solar businesses can leverage for nationwide services
Reputational damage to solar due to sub-standard installation and maintenance services
Need for increasing the base of expertise in installation and maintenance of solar systems by providing curriculum development and training
The lack of access to quality advisory services, and related affordability constraints, can be addressed through the provision of technical assistance, and/or the promotion of incubator and other support programs for early-stage entrepreneurs as well as more mature businesses. Figure 21 provides the road map to implementation of technical advisory services. In addition, example terms of reference (ToR) for technical assistance for (i) solar operators, (ii) MNOs, and (iii) solar technicians are provided in the appendices, showing further details of the type of support and skills required.
84

Open Capital Advisors
Especially for consumer education programs and technical assistance, close coordination with other efforts in the market is advisable to prevent suboptimal resource allocations.
7.2 Financial interventions for household-level solar solutions
Besides systemic interventions, we recommend financial interventions to achieve rapid stimulation of the solar market in Niger. Our consultations revealed that current bank lending to the solar sector, and especially to SMEs, is limited to contract-backed loans for the initial purchase of inputs; the same holds true for
85
Figure 21: Key implementation steps for technical advisory services for solar operators

Open Capital Advisors
grants, which are typically awarded to equip public institutions with solar technology, and are highly restrictive in usage. The largest local MFI, ASUSU, offers consumer asset financing, but uptake of microloans for solar products has been slow, mainly due to lacking coordination and integration between solar distributors and ASUSU. Further, setting up operations requires significant investment from solar businesses, especially to distribute through agent networks to reach rural areas.
To assess the need for financial interventions, we developed financial projections for a mock solar distribution company serving the market for private households in Niger.
The financial projections are based on revenue and cost assumptions derived directly from consultations with several international solar businesses, and have been tailored to the Nigerien context based on information received from local consultations and focus groups; the key inputs and assumptions underlying the financial projections are presented in Figure 22.
86
Financial projections for a solar business in NigerGeneral inputs
Products included have been selected to represent – from both functionality and pricing - a broad range of Lighting Africa-approved solar lanterns and solar home systems:
Product Watts (peak)
Price(US $)
Lifetimein years
Consumer loans (CL)
CL tender in months
Simple study light 2 5 2 Yr. 4 onwards
6
Standing light 3 10 2 Yr. 4 onwards
6
Light & mobile charger 4 40 2 Yes 12
Small multiroom lighting system 6 100 3 Yes 12
Basic solar home system 10-20 220 5 Yes 24
Medium solar home system 100 500 5 Yes 24
Large solar home system 200 1,000 5 Yes 36
The price points assume that products are exempt from import duties. Consumer loans only available for small solar lanterns from year 4 onwards, as without
PAYG payment platforms, consumer finance has limited operational viability Contribution margins vary from 30% for the smallest devices to 55% for the large solar
home system Distribution via a hub and spoke model leveraging third party store and agent networks;
the partner networks are complemented with self-managed sales hubs and technical after-sales support staff.
Stores and agents require in-depth training on business skills, products, and financing options, and then receive sales commissions, for sale (7.5%) and referral (5%) respectively.
Consumer loan default rate of 25%, based on consultations with international PAYG providers
Figure 22: Summary of inputs to the financial projections for a solar business in Niger

Open Capital Advisors
To estimate the funding requirements for each intervention, we assume a target of reaching 20% of off-grid households (around 630,000) over the 5-year period. This corresponds roughly to eight solar distributors growing exponentially over five years to sales of around 65,000 solar lanterns and solar home systems each per year by year 5. Based on our consultations these numbers appear ambitious but attainable given the right interventions. We further assume that products are replaced after the useful lifetime of the system, and that 50% of on-grid households would consider the purchase of a solar system as backup option. Based on these assumptions, sales units per year increase from 15,000 in year 1 to 520,000 in year 5; solar lanterns as % of total sales volume increases from around 45% to 70% in year 5, mainly driven by increasing off-grid uptake of solar in geographic areas with higher demand for cheaper solutions. This volume growth translates into a compound annual growth rate of revenues of 105%, from around US $2 million in year 1 to US $37 million in year 5. Driven mainly by the assumption that consumer financing for small solar lanterns only becomes available from year 4 onwards (see Figure 22), a significant share of sales volume (47% over the 5-year period) is generated through over-the-counter cash transactions.
Inventory financing facility with associated guarantee scheme
Without access to non-restricted working capital finance, companies are not able to import sufficiently large volumes of solar home systems or solar lanterns to profitably establish distribution operations to private households. Inventory finance is key to growth, and especially in Niger, where inventories are typically paid for prior to dispatch from the supplier abroad, and then held on balance sheet for between 60-150 days. In more developed markets, banks provide access to inventory financing facilities, but in Niger this financial need is not yet served.
We recommend introducing an inventory financing facility, structured as a credit line in local currency provided to financial institutions. Making liquidity available to financial institutions at concessionary rates, and additionally backed with a credit guarantee scheme, provides an incentive for the local financial institutions to increase their lending to solar businesses, and will de-risk lending to the solar sector until banks have established the proof case of a viable market.
Hereby, defining lending criteria together with the financial institutions will be of key importance to ensure fund usage is aligned with the goals of growing the solar industry. Further, the interest rate spread and TA support needs to be sufficient to incentivize financial institutions to engage in the market; international experiences have shown that too often credit lines and guarantee programs do not achieve the desired effect of infusing market liquidity.
Table 31 provides an overview of funding requirements for the inventory financing facility to reach 20% of off-grid households over a 5-year period.
87
Financial projections for a solar business in NigerGeneral inputs
Products included have been selected to represent – from both functionality and pricing - a broad range of Lighting Africa-approved solar lanterns and solar home systems:
Product Watts (peak)
Price(US $)
Lifetimein years
Consumer loans (CL)
CL tender in months
Simple study light 2 5 2 Yr. 4 onwards
6
Standing light 3 10 2 Yr. 4 onwards
6
Light & mobile charger 4 40 2 Yes 12
Small multiroom lighting system 6 100 3 Yes 12
Basic solar home system 10-20 220 5 Yes 24
Medium solar home system 100 500 5 Yes 24
Large solar home system 200 1,000 5 Yes 36
The price points assume that products are exempt from import duties. Consumer loans only available for small solar lanterns from year 4 onwards, as without
PAYG payment platforms, consumer finance has limited operational viability Contribution margins vary from 30% for the smallest devices to 55% for the large solar
home system Distribution via a hub and spoke model leveraging third party store and agent networks;
the partner networks are complemented with self-managed sales hubs and technical after-sales support staff.
Stores and agents require in-depth training on business skills, products, and financing options, and then receive sales commissions, for sale (7.5%) and referral (5%) respectively.
Consumer loan default rate of 25%, based on consultations with international PAYG providers
Open Capital Advisors
Table 31: Inventory financing facility capitalization requirementsYear 1 Year 2 Year 3 Year 4 Year 5
Inventory financing facility# of units in transit & in stock 5,378 12,939 31,964 78,460 210,445Inventory financing need in US$ 438,865 967,114 1,981,829 3,978,781 9,086,704Collateralization rate 120% 120% 100% 100% 100%Facility capitalization requirement in US$ 365,720 805,928 1,981,829 3,978,781 9,086,704 Avg. Capitalization in US$ per unit of stock 68.00 62.29 62.00 50.71 43.18
Over the years, inventories must be sourced in increasing volumes to support the strong sales growth; this immediately translates into larger stockholding and higher inventory financing needs. We assume a collateralization rate of 120% in the first two years, which then reduces to 100% from year 3 onwards. Due to the assumption of constant growth (i.e. no fluctuations in business performance), the inventory financing need shown in Table 31 represents the maximum level for any given year. Also, days-inventory-outstanding are assumed to be 120, and have been held constant, so potential improvements in supplier payment terms and improved sourcing efficiency over the years is ignored. Based on these assumptions, the facility capitalization requirement grows from around US $365,000 in year 1 to around US $9 million in year 5. The average capitalization requirement per unit of stock decreases over the years as the sales mix increasingly shifts down the price ladder due to a relative shift of market into rural off-grid areas with lower purchasing power.
Table 32 shows funding requirements for the credit guarantee scheme to cover irrecoverable amounts of lending by the financial institutions to solar businesses. In absence of empirical data to estimate what losses are likely to be incurred through irrecoverable debt, we focus on showing the maximum guarantee exposure at period-end for each year, as well as the maximum exposure across all inventories sourced. We assume a loss coverage of 100% in the first two years, 75% in year 3, 50% in year 4, and 25% in year 5.Table 32: Credit guarantee scheme for inventory financing facility exposure levels
Year 1 Year 2 Year 3 Year 4 Year 5Credit guarantee scheme for inventory financing facilityInventory credit line draw-down 365,720 805,928 1,981,829 3,978,781 9,086,704 Guarantee - losses covered in % 100% 100% 75% 50% 25%Period-end maximum exposure in US$ 365,720 805,928 1,486,372 1,989,390 2,271,676
Total cost of inventories sourced 1,415,408 3,036,792 6,235,141 12,732,098 25,282,131 Guaranteed maximum exposure in US$ 1,415,408 3,036,792 4,676,356 6,366,049 6,320,533
The period-end maximum exposure is based on the credit line draw-down at the last day of the year; while credit line draw-down increases from year to year, the reduction in loss coverage prevents rapidly increasing exposure. Year-end exposure levels increase from around US $365,000 in year 1 to around US $ 2.3 million in year 5. Similarly, the maximum exposure based on the total cost of inventories sourced increases from US $ 1.4 million in year 1 to US $ 6.3 million in year 5.
88

Open Capital Advisors
Consumer loan financing facility with associated guarantee facility
Simply making working capital finance available to solar businesses might not suffice to deeply stimulate uptake. Another key challenge, unanimously confirmed in all consultations, is lacking purchasing power of private households; widespread poverty and low income levels, especially in semi-rural and rural areas, mean that few Nigeriens can afford solar technology at current market prices. Therefore, consumer financing will be key to unlocking a substantial share of the demand for solar products.
An estimated 98% of the Nigerien population are Muslims78, so offering Sharia compliant financial services will be an important consideration in stimulating broad uptake of consumer financing schemes. In Islamic finance, money is not to be seen as commodity for which a price is charged, instead it serves as a medium of exchange, a store of value, or a unit of measurement.79 As a direct consequence, receiving interest on loans is not allowed under Sharia, and banks must earn their profits by other means, such as profit-sharing related to the assets financed, or fees for the services provided. Suitable approaches, compliant to Sharia banking, to provide consumer finance for solar products would include Murabaha and Ijara. With the Murabaha approach, the bank would buy the solar product and then sell it to the end customer collecting installment payments over time. The installment payments include a fixed, pre-defined profit mark-up. Ijara, in contrast, is a lease finance agreement, whereby the bank buys the solar product and leases it to the end customer for a specified period and lease payments. The ownership of the asset remains with the bank, but title to the property can be transferred when all payments have been made. 80
As none of the current solar distributors have PAYG technology platforms, the best option for provision of consumer financing schemes in the short term is through local MFIs, such as ASUSU. The success of such partnership programs between solar distributors and MFIs will largely depend on the commitment and investment from both sides, and a significant integration and alignment will be required for success. Key challenges typically faced in such partnerships are among other (i) lacking proximity of product sales points and MFI branches/agents; (ii) cumbersome credit assessment processes; (iii) onerous loan terms; (iv) lacking integration and communication between the partners; (v) undefined responsibilities, especially related to after-sales services; (vi) lacking strategic intent; and (vii) distrust and concerns about reputational risk. An example often stated is that if a customer sees the solar system in a shop, she will then need to travel to a (distant) MFI branch to apply for the loan, which might take weeks to process (potentially involving multiple 78 United States Department of State, Bureau of Democracy, Human Rights, and Labor, International Religious Freedom Report for 2015; available at: https://www.state.gov/documents/organization/256267.pdf79 Chartered Institute of Management Accountants (CIMA), An introduction to Islamic finance, 2014; available at: http://www.cimaglobal.com/Documents/Islamic%20finance/Rebrand%20Brochures/Islamic%20Introduction%20brochure_Mar2015.pdf80 ACCA, Exam resources, Introduction to Islamic finance, May 2016, available at: http://www.accaglobal.com/an/en/student/exam-support-resources/fundamentals-exams-study-resources/f9/technical-articles/introduction-to-islamic-finance.html
89

Open Capital Advisors
return travels to the MFI branch), only to then receive a loan approval subject to high collateral provision and payment of excessive interest rates. Therefore, we recommend significant time and resource allocation to TA provision to both parties involved in such partnerships to increase the probability of success. In addition, lending rates and terms need to be reflective of target customer needs, and be contractually agreed upfront.
To increase market liquidity for MFI lending to private households for purchases of solar technology, we recommend a consumer loan facility, i.e. a rolling credit line provided to the MFI at concessionary terms. Table 33 shows the capitalization requirements for the facility, again based on the target of reaching 20% of off-grid households with solar solutions.81
Table 33: Consumer loan financing facility capitalization requirementsYear 1 Year 2 Year 3 Year 4 Year 5
Consumer finance loan facility# of units sold with consumer financing 9,414 18,607 42,031 96,366 280,305 # of active financing agreements 9,414 21,302 48,741 110,409 314,888 Net receivables (consumer loans) in US$ 621,466 1,363,294 3,065,102 7,186,523 21,117,335 Provision for bad debt in US$ 119,473 198,318 478,460 1,031,627 2,798,120 Gross receivables (consumer loans) in US$ 740,939 1,561,611 3,543,562 8,218,150 23,915,454 Advance rate 80% 80% 85% 90% 90%Fund capitalization requirement in US$ 592,751 1,249,289 3,012,027 7,396,335 21,523,909
The number of units sold with consumer financing increases from around 9,000 in year 1 to around 280,000 in year 5; active financing agreements increase from 9,000 to around 315,000. This translates into a significant increase in gross receivables (consumer loans) held on the balance sheet of the MFI, with gross receivables increasing from around US $740,000 in year 1 to nearly US $24 million in year 5. We assume an advance rate of 80% in years 1 and 2, which then increases to 85% and subsequently 90% in years 4 and 5. Based on these assumptions, the fund capitalization requirement increases from around US $600,000 in year 1 to US$ 22 million in year 5. Over the years, the fund capitalization requirement per active financing agreement ranges from US $63 to US $69.
We believe that the consumer loan facility will need to be coupled with a credit guarantee scheme; else MFIs are unlikely to be willing to make the significant changes to their credit assessment processes and appetite for risk required to ensure fast uptake and reach into segments previously unbanked.
Table 34 provides an overview of the risk exposure and an estimated total loss coverage for such a guarantee program.81 The analysis is based on the assumption that 80% of solar devices with a sales price of ≥ US $ 40 will be sold with consumer financing. Consumer financing for small solar devices will only be available from year 4 onwards; around 7.5% of small devices sold in year 4 will be financed, growing to 25% in year 5. We further assume that 25% of receivables are written off half a year after the initial sales transaction.
90

Open Capital Advisors
Table 34: Credit guarantee scheme for consumer finance loan facility exposure levelsYear 1 Year 2 Year 3 Year 4 Year 5
Credit guarantee scheme for consumer finance loan facilityGross receivables (consumer loans) in US$ 740,939 1,561,611 3,543,562 8,218,150 23,915,454 Guarantee - losses covered in % 75% 75% 50% 50% 25%Period-end maximum exposure in US$ 555,705 1,171,209 1,771,781 4,109,075 5,978,864
Total value of new receivables 1,030,689 2,037,092 4,601,655 10,550,294 30,688,249 Guaranteed maximum exposure in US$ 773,017 1,527,819 2,300,828 5,275,147 7,672,062
Irrecoverable receivables in US$ 119,473 336,517 789,415 1,703,581 4,404,066 Expected loss coverage per period in US$ 89,605 252,387 394,708 851,790 1,101,017 Total expected loss coverage in US$ 2,689,507
The period-end maximum exposure relates to the consumer financing agreements active as at year end, whereby the maximum exposure covers the total risk of all financing agreements entered. We believe the guarantee level would need to be set high in the first years to ensure full commitment of the MFI, while simultaneously the MFI needs to be exposed to some risk to ensure diligent, while efficient credit assessment processes are in place; we assume a loss coverage of 75% in years 1 and 2, 50% in years 3 and 4, and 25% in year 5, gradually phasing the guarantee scheme out.
Based on these assumptions, the period end maximum exposure increases from US $ 560,000 in year 1 to US $6 million in year 5. This is only marginally lower than the maximum exposure which increases from US $770,000 in year 1 to US $7.7 million in year 5. Based on insights gained from many consultations with international solar operators and MFIs, we assume a loan default rate of 25% applied half a year after recording the receivable. Based on the assumptions made, the expected actual loss coverage increases from US $90,000 in year 1 to US $1.1 million in year 5, with a cumulative intervention cost of US $2.7 million.
Grants to encourage market entry and scaling of operations
Given the very early development stage of the Nigerien market for household systems, and the fact that all current solar distributors in Niger lack distribution infrastructure outside of the main cities, market entry will require significant time and capital investment, and therefore represents high risk to the pioneers. Consequently, we believe further incentives will be required to stimulate committed investment into building broader distribution infrastructure.
In addition, one key observation from the financial modelling is that the working capital facilities discussed above do not provide sufficient liquidity for the early scaling phase; i.e. due to quick ramp up of the business, inventory and receivables increase rapidly, leaving a liquidity gap of over US $ 280,000 in year 2 of operations (see Table 35). Reason for not having a liquidity gap in year 1 is simply due to the assumption that the owners insert US $300,000 in equity into the company at outset.
91

Open Capital Advisors
Table 35: Revised cashflows after provision of working capital facilitiesYear 1 Year 2 Year 3 Year 4 Year 5
Revised cashflows after working capital interventions
Beginning Cash Balance 0 44,910 (278,926) (285,710) (167,727) Cashflow of the period (913,561) (1,420,581) (2,945,423) (6,263,277) (19,095,610) Inventory financing facility 365,720 440,208 1,175,901 1,996,952 5,107,923Consumer finance loan facility 592,751 656,538 1,762,738 4,384,308 14,127,574Cashflow after provision of loan facilities 44,910 (323,836) (6,784) 117,983 139,887Ending Cash Balance 44,910 (278,926) (285,710) (167,727) (27,840)
The presentation of the cashflows of the solar business in Table 35 is based on the simplified assumption that all liquidity provided to the financial services sector is passed through to the solar business.
To provide further incentives and cover the initial liquidity gap, we recommend providing additional grant funding in the initial stage of the market. International markets have frequently shown that a certain level of grant stimulation is beneficial to stimulate private sector interest, rapid market entry and growth. We recommend selecting few, committed companies based on a tender process, selecting those with the most compelling and credible plan to scale operations in the solar lantern and solar home system market. Upfront grants to cover the initial network and working capital investment should then be made available at program outset, and should be based on the financial projections submitted and discussed throughout the tender process.
After some initial set-up grant funding, we recommend making any additional grant funding conditional to meeting predefined growth targets in the form of results-based-financing (RBF). Ideally, RBF should be structured to incentivize growth of the MFI-solar business partnership, by providing both parties with aligned incentives. To achieve this, we recommend providing direct product subsidies linked to growth performance, i.e. the number of solar products sold with consumer financing through the MFI. Table 36 provides an overview of the costs of such an intervention, based on unit volumes to achieve a reach of 10% of off-grid households; note that not all households want/require financing, and are therefore excluded from the volume of sales with consumer finance shown in the table. We have assumed that the direct product subsidies would cover 75% of the inventory cost in year 1, 50% in years 2 and 3, and then gradually phase out with 25% in year 4, and 10% in year 5. Based on these assumptions the funding requirement for this intervention would increase from around US $460,000 in year 1, to US $1.2 million in year 3, US $1.1 million in year 4, and then decrease again to US $690,000 in year 5. Overall, this intervention would result in a total cost of around US $4 million over the 5-year horizon.
92

Open Capital Advisors
Table 36: Facility capitalization requirements for RBF direct product subsidiesYear 1 Year 2 Year 3 Year 4 Year 5
RBF: Direct product subsidies linked to growth performance# of units sold with consumer financing 9,414 18,607 42,031 96,366 280,305 Threshold volume for RBF (# of units subsidised) 8,000 17,000 37,500 85,000 155,000 Cost of units subsidized in US$ 612,366 1,287,584 2,363,884 4,498,462 6,901,919 % of inventory cost covered 75% 50% 50% 25% 10%Product subsidies per period in US$ 459,274 643,792 1,181,942 1,124,616 690,192 Facility capitalization requirement in US$ 4,099,816
We believe that, ideally these direct product subsidies would be shared, with partial imbursements to MFI and solar businesses. Alternatively, RBF based product subsidies could also be purely targeted towards the solar business with additional incentives targeting MFIs.
A further direct subsidy that would benefit consumers, MFIs, and solar companies alike, would be applied to interest rates for consumer lending. Capped interest rates reduce the ‘financed market price’ of solar products to the end consumers, while MFIs receive the difference between subsidized rate and market rate through grant funding. The solar business also benefits, as improved financing terms have the potential to stimulate product purchases.
Table 37 gives an overview of the funding requirements to cap the interest rate at 12% p.a. (versus an assumed market rate of 20% p.a.), again with sales volumes to reach 20% of off-grid households over the 5-year period.Table 37: Facility capitalization requirements for subsidized interest rates
Year 1 Year 2 Year 3 Year 4 Year 5Subsidized interest rates for consumer loans (can be RBF-linked, but not necessarily)Consumer loans interest income at market rates 71,446 188,442 433,652 976,380 2,634,838 Annual interest rate cap (delta subsidized) 12% 12% 12% 12% 12%Interest income at capped rate 42,868 113,065 260,191 585,828 1,580,903 Interest rate subsidies per period in US$ 28,578 75,377 173,461 390,552 1,053,935 Facility capitalization requirement in US$ 1,721,903
The total cost of such an intervention is estimated to be around US $1.7 million over the projected 5-year period.
After exploring various options of structuring the grant, we recommend a combination of the following three components to incentivize the combined effort of solar companies and financial service providers towards rapid scaling of the market:
Table 38: Recommended grant structure to incentivize market entry and expansion
Grant recipient
Type of grant Rationale (in short)
Solar companies
Direct setup grant Paid in advance of expansion to fund necessary infrastructure
93

Open Capital Advisors
Grant recipient
Type of grant Rationale (in short)
Businesses consulted prefer this option as it allows them to make initial investments in sales & distribution channels, and allocate inventory for new sales regions
Either in the form of a lump-sum or in installments
Solar companies
Results based financing awarded based on meeting sales targets
Paid after expansion to different areas of Niger that are outside the immediate grid expansion plans, linking concessionary funding explicitly to sales already achieved and demonstrated
Operators are required to periodically report sales that have met a pre-agreed target (such as serving rural areas)
Sales can be verified by an administrating body either by contacting a sample of consumers or directly through GIS tracking technology embedded in solar units
By focusing only on end sales, RBF incentivizes businesses to achieve solar sales in the most cost-effective manner without imposing additional reporting requirements
However, businesses need to invest in sales and distribution infrastructure using their own capital before RBF is awarded
Payment is a % of COGS of the relevant sales
Financial service providers
Results based financing awarded based on meeting lending and portfolio health targets
Paid after achieving pre-defined lending growth targets; ideally linked to the RBF program offered to solar companies to ensure incentive alignment across the partnership
Pre-defined portfolio health targets required to avoid depreciation of credit assessment standards (especially required if a loan guarantee facility is available to cover first losses)
Periodic reporting of lending statistics and evidence of lending
Incentivizes FSP to grow their lending portfolio and, depending on targets agreed, expand financial inclusion to previously unbanked areas
Payment is either a fixed lumpsum per loan a % of a pre-defined average loan administration cost
Figure 23 provides a brief, simplified overview of the roadmap to implementation of a grant funding program; example Terms of Reference for the market entry and expansion grants program are included in the appendices.
94
Open Capital Advisors
Figure 23: Key implementation steps for the grant funding program
7.3 Financial interventions for the irrigation market
Insights from consultations and our own modelling suggest that there is a farm-level business case for the adoption of irrigation technologies across different farm sizes ranging from smallholder farms to large commercial farms. To provide the water needed for agricultural irrigation, farms require pumps. Historically, pumps have been either grid-, generator-, or hand-powered, but increasingly solar pumps are entering African markets.
Large, commercial farms can access bank financing for solar pumping systems, even if substantial collateral is required. Providing TA to the banks to ensure they fully understand the needs and the risks of this market should suffice as
95

Open Capital Advisors
intervention. In contrast, smallholder farmers, who represent a significant share of the market, are very hard to access and service.
Unlocking the market for irrigation technologies for smallholder farmers requires overcoming many challenges; these include among other:
the lack of access to water infrastructure; limited benefit awareness of solar and even irrigation systems; low purchasing power contrasting with high technology costs; limited access to financial services; and few formal distribution channels to reach into rural farming areas.
In addition, purely providing solar pumping systems will not ensure the business case holds true; smallholder farmers need holistic support, among other (i) input and output market linkages, (ii) access to better inputs, (iii) finance, and (iv) training on good agriculture practices. Overall, unlocking this market will only be achievable in the short term if consumer financing options are made available to smallholder farmers to purchase solar pumping kits.
However, most smallholder farmers in Niger are unbanked, and operate predominantly in unstructured, informal supply chains. Therefore, the provision of financial services will be very challenging; and most likely significant market intervention will be required to stimulate demand by building benefit awareness and increasing the risk appetite of lenders.
We recommend focusing any interventions on demonstrating impact at the smallholder farmer level through interventions in structured value chains. Smallholder farmers in structured, formal supply chains typically have the required input and output market linkages, so that financial service providers are more willing to engage with them. Supply chain financing models can be a successful way to structure such lending, so that the asset financing repayments are collected by the buyer of the crops, and in some cases the buyer will even bare the risk of the lending. First tapping into structured supply chains will allow spill-over of demand into informal farming markets, as positive word-of-mouth and the demonstration effect increase benefit awareness.
As the market sizing analysis in chapter 4.3 has shown, the limited land area with water accessibility combined with affordability challenges, limits the market size. As for the market for household solar systems, we built a financial model for a water pumps distributor to simulate the funding requirements within this sector; see Figure 24 for further details.
96

Open Capital Advisors
We estimate the total number of smallholder farmers with productive agricultural operations on irrigated land at around 500,000. The modeling presented throughout this chapter, and the funding requirements for interventions, are all based on the target to reach 20% of these smallholder farmers, so around 100,000 in total, over the 5-year projection period, under consideration of the annualized sales volume potential as determined in the demand-side analysis.
Based on our projections, a private sector distributor would require over 4 years to break even with sales units growing from around 1,700 in year 1 to nearly 50,000 in year 5. This translates into revenues growing from US $770,000 to US $23 million over the same period; see Table 39 .
97
Figure 24: Summary of inputs to the financial projections for a solar water pump business in Niger
Financial projections for a solar water pump business in NigerGeneral inputs
Due to the low-income levels in Niger, we only included 2 relatively low cost products into the analysis, one solar pumping kit priced at US $650 and a micro solar pumping kit priced at US $400. While we are not aware of any quality, durable solar pumping kits currently available in the market at a price of US $400, we do know that multiple players are currently developing such a kit.Product Price
(US $)Lifetimein years
Consumer loans (CL)
CL tender in months
Micro solar pumping kit (in dev’t) 400 6 Yes 24
Small solar pumping kit 650 6 Yes 24
The price points assume that products are exempt from import duties. Distribution via a hub and spoke model leveraging third party store and agent networks;
the partner networks are complemented with technical after-sales support staff. Stores and agents require in-depth training on business skills, products, and financing
options, and then receive sales commissions, for sale (7.5%) and referral (5%) respectively.
Niger-specific inputs Relative to countries with easier access to international markets (e.g. non-landlocked),
contribution margins are around 5-10 % lower reflecting higher inbound transportation costs.
Inventory holding time assumed to be 120 days driven by long delivery times for sourcing from abroad and transfer of ownership (and full payment) prior to shipment.

Open Capital Advisors
Table 39: Financial and impact performance projections for solar water pump distributorYear 1 Year 2 Year 3 Year 4 Year 5 CAGR Y1-5
Financial and impact performance indicators
Sales units 1,676 3,031 8,513 23,909 49,401 133.0%Revenues in US$ 772,730 1,397,561 3,925,190 11,024,294 22,777,984 133.0%Gross profit in US$ 202,253 392,716 1,075,414 3,021,056 5,525,359 128.6%Net profit in US$ (162,074) (177,172) (204,695) (25,907) (83,439) (15.3%)Cash flow from operations in US$ (701,412) (948,122) (2,556,125) (6,666,030) (8,888,737) 88.7%GP % 26.2% 28.1% 27.4% 27.4% 24.3%Net Profit % (21.0%) (12.7%) (5.2%) (0.2%) (0.4%) (63.6%)Cumulative # of off-grid households reached 1,676 4,707 13,220 37,129 104,281 180.9%
The projections show that any private sector operations in this sector will, similarly to the household system distributor, require access to considerable amounts of working capital finance, to cover inventory holding periods, and consumer loans (here shown on-balance sheet and therefore include in the cash flow from operations; but more realistically consumer loans would be provided through a MFI-partnership).
As accessing this market will be highly challenging, even with market interventions, we recommend aligning interventions for this market with the interventions made in the household systems market, and servicing them from the same funds.
An inventory financing facility will be required, so that banks can access a concessionary credit line for finance to provide solar water pump kits distributors with loans. As shown in Table 40, the funding requirement to reach around 100,000 farmers over 5 years increases from US $109,000 in year 1 to US $4.7 million in year 5. If banks also receive a guarantee to cover losses from lending operations, the guaranteed maximum exposure increases from around US $510,000 in year 1 to around US $3.6 million in year 5; all these figures are based on collateralization rates reducing from 120% to 100%, and loss coverage levels gradually decreasing from 100% in year 1 to 25% in year 5 (as shown in Table 40).Table 40: Solar pumping kits - Inventory financing facility and guarantee funding requirements
Year 1 Year 2 Year 3 Year 4 Year 5Inventory financing facility# of units in transit & in stock 444 1,248 3,506 9,846 15,982Inventory financing need in US$ 130,692 367,061 1,030,929 2,895,469 4,699,782Collateralization rate 120% 120% 100% 100% 100%Facility capitalization requirement in US$ 108,910 305,885 1,030,929 2,895,469 4,699,782 Avg. Capitalization in US$ per unit of stock 245.06 245.06 294.07 294.07 294.07
Credit guarantee scheme for inventory financing facilityInventory credit line draw-down 108,910 305,885 1,030,929 2,895,469 4,699,782 Guarantee - losses covered in % 100% 100% 75% 50% 25%Period-end maximum exposure in US$ 108,910 305,885 773,197 1,447,734 1,174,946
Total cost of inventories sourced 512,348 1,192,563 3,349,433 9,407,222 14,411,287 Guaranteed maximum exposure in US$ 512,348 1,192,563 2,512,075 4,703,611 3,602,822
98

Open Capital Advisors
Additionally, local banks or MFIs will need to provide financing to the farmers to purchase solar pumping kits. Table 41 shows that funding requirements for the credit line, based on the advance rates assumed, increase from US $410,000 in year 1 to around US $15.4 million in year 5.Table 41: Solar pumping kits – Consumer finance loan facility and guarantee funding requirements
Year 1 Year 2 Year 3 Year 4 Year 5Consumer finance loan facility# of units sold with consumer financing 1,676 3,031 8,513 23,909 49,401 # of active financing agreements 1,676 4,288 10,617 29,819 66,000 Net receivables (consumer loans) in US$ 414,004 954,565 2,650,495 7,444,184 14,462,165 Provision for bad debt in US$ 103,745 117,513 330,047 926,969 2,603,487 Gross receivables (consumer loans) in US$ 517,749 1,072,078 2,980,542 8,371,153 17,065,652 Advance rate 80% 80% 85% 90% 90%Fund capitalization requirement in US$ 414,199 857,663 2,533,461 7,534,038 15,359,087
Credit guarantee scheme for consumer finance loan facilityGross receivables (consumer loans) in US$ 517,749 1,072,078 2,980,542 8,371,153 17,065,652 Guarantee - losses covered in % 75% 75% 50% 50% 25%Period-end maximum exposure in US$ 388,311 804,059 1,490,271 4,185,576 4,266,413
Total value of new receivables 695,457 1,257,805 3,532,671 9,921,864 20,500,186 Guaranteed maximum exposure in US$ 521,593 943,354 1,766,336 4,960,932 5,125,046
Irrecoverable receivables in US$ 103,745 187,633 526,985 1,480,091 4,156,984 Expected loss coverage per period in US$ 77,808 140,724 263,492 740,045 1,039,246 Total expected loss coverage in US$ 2,261,317
The maximum exposure of the credit guarantee scheme increases from US $ 390,000 in year 1 to US $4.3 million in year 5; assuming 25% of the loans become irrecoverable, the total expected loss coverage over the 5-year period amounts to approximately US $2.3 million.
Besides providing working capital financing to companies, and consumer loans to smallholder farmers, we believe upfront grant financing will be required to incentivize private sector investment in this highly challenging, and not very large market.
99

Open Capital Advisors
Appendices
App. A: Assessment of the opportunity for grid extension and mini-grids
Our focus throughout the report has been on assessing the market opportunity for stand-alone solar microsystems, that provide for the energy needs of for example one household, one clinic, or one farm. In this appendix, we want to discuss in further detail the opportunity of reaching locations with high demand density through grid extension or construction of mini-grids.82
A.1 Assessment of the opportunity to extend the grid
Extending the grid is typically considered the best, and maybe only feasible, long-term solution to providing universal, nationwide electricity access. But grid extension – together with the required electricity production to serve the increasing number of grid connections – is very costly, and often slow to implement. Low rural income levels often translate into lacking viability of grid extension, as low willingness-to-pay for grid connections results in excessively long amortization periods. Therefore, grid extension efforts should prioritize reaching areas of high energy demand first, and then gradually expand to lower demand areas.
Table 42 gives an overview of the distribution of the Nigerien population, and shows the percentage of the population living in different locality (sub-divisions of Communes) sizes. We see that around 27% of the Nigerien population live in localities with a population of less than 500 people, and around 42% in localities with a population size ranging from 501 to 2,000 people. In contrast, only 8.4% of the population live in localities with a population size greater 10,000. While localities are quite diverse in land surface area, this provides an indication of the opportunity for grid extension and mini-grids. While the more dense areas are typically best served by the grid, a large share of the population lives in localities with relatively low population sizes.Table 42: Nigerien localities by population size83
≤ 500 501 - 2,000 2,001 - 5,000 5,001 - 10,000 > 10,000% of localites 72.8% 23.9% 2.5% 0.6% 0.2%% of Nigerien population 27.3% 41.9% 14.7% 7.8% 8.4%
Population size by Location
82 We define mini-grids as an off-grid power generation and distribution facility that uses a central generating asset to provide electricity to many, often diverse end-users; mini-grids are typically managed by distributed energy services companies, who are responsible for maintaining the facilities and managing the sales of energy services.83 Based on the RENALOC (Répertoire national des localités de Niger) dataset provided by INS (Institut national de la statistique); the dataset is estimated to cover around 86% of the current population and provides Locality-level population count data.
100

Open Capital Advisors
Next, we attempt to estimate i) which villages (or localities) are within close proximity to the grid or are already grid connected; ii) the population size in those villages close to the grid; and iii) the theoretical cost of extending the grid to these populations.
As precise geographic data on national grid location was unavailable at this time of writing, we instead use the following methodology:
Our analysis is based on the list of NIGELEC’s sales by region to identify the areas that are already served by the grid and/or the centres isolés; the list contains a mix of locality- and commune-level data. We use this list to identify ‘points of electricity delivery’.
For localities, as available, we use GIS data (the latitude and longitude of the locality). For communes, on the other hand, we calculate the population-weighted average geographic centre (average latitude and average longitude); this implicit assumption that the grid is most likely passing through the highest populated areas within the Commune is used in absence of precise and complete, locality-level sales data.
Then we determine which localities are within a certain radius of these ‘points of electricity delivery’ (say 5km), and calculate the average distance from the points to each locality
For these localities, we calculate the amount and resultant cost of 33 kV transmission cabling and 20 kV distribution cabling required to connect to the grid, as well as the connection cost for each household.84
Figure 25 below summarizes the distribution of households by distance to the grid arrived at in this manner, and Figure 26 presents the same results displayed geographically on a map of Niger.85
84 From IRENA report: USD 17,000 / km for 20kV; USD 29,000 /km for 33kV (interpolated); USD 102-145 per household connection85 As the RENALOC dataset, i.e. the only available Locality-level dataset on household distribution, only includes around 2.3 million households, the results have been extrapolated to represent the estimated current number of households (3.2 million).
101

Open Capital Advisors
Figure 25: Grid reach and expansion potential in number of households86
We estimate that in addition to the 11% of households currently already on-grid, an additional 33% live within 5km of the grid, and might therefore be well suited for relatively inexpensive grid extension initiatives in line with NIGELEC’s broad objective to electrify communities within 5km of the current grid. An additional 39% of households are within 5-20km of the grid and may still be accessible, but at increasing costs. Finally, 17% of households are situated over 20km from the grid, and are unlikely to be grid-connected in the near term in the absence of more substantial investment in infrastructure.
Given the assumptions above, we estimate total costs of approximately US $1.1 billion to extend grid access to the one million off-grid households within 5km of the grid, or around US $1,100 on average per household. An estimated 460,000 households are situated 5-10km of the grid, and to reach these would require an estimated investment of approximately US $ 1.3 billion (around US $ 2,900 per household). Finally, around 785,000 households are estimated to be between 10-20km of the grid. To reach these would require an estimated investment of US $ 4.7 billion dollars, or around US $ 6,000 per household. These costs only reflect the immediate costs of grid line extension and household connections, but exclude the cost of producing more energy.
86 OCA Analysis
102

Open Capital Advisors
Figure 26: Map of Niger presenting off-grid energy demand by grid proximity87
87 OCA Analysis; this map serves to give an indicative picture only; the accuracy of geographic locations is limited by the quality of available GIS-data.
103

Open Capital Advisors
A.2 Assessment of the opportunity for investment in mini-grids
Many geographic areas in Niger are unlikely to be reached by the grid in the short- to medium-term, and therefore represent an opportunity to be served with off-grid solutions. While individual microsystems have the potential to positively change the current electricity landscape in Niger, they are unsuited for many commercial applications, are often difficult and costly to distribute, and the upfront investment requirements often limit the affordable energy consumption profile. An additional alternative to individual microsystems are mini-grids; they typically operate on a community scale, and are managed by an independent provider selling energy as a utility service.
In many countries in Sub-Saharan Africa, regulatory barriers and uncertainty in the regulatory landscape have restrained private sector investment in mini-grids. The two most commonly stated deterrents to private sector investment are (i) that many African countries impose a uniform national electricity tariff lower than the unit per kWh costs of operating a mini-grid, so that in absence of cost-reflective tariffs, mini-grid operations are often not viable; and (ii) the risk to mini-grid operators of national grid expansion. Often very limited information is available on grid expansion plans, and there is uncertainty on how mini-grids would be integrated, or their owners compensated in such an event.
This often drives mini-grid providers to the most remote areas, as far from the grid as possible. While this reduces the risk of grid reach, these target areas often have lower population densities and less economic activity and are therefore characterized by lower demand levels, and often lacking purchase power. Besides all these external challenges, private sector investment is further curbed by the lack of a proven sustainable business model for mini-grids to serve remote rural populations in developing countries, especially in countries with low population densities.88
Investment requirements in a mini-grid are significant, and amortization periods often long, so a conducive regulatory framework for mini-grid operations is required as basic condition to investing in mini-grids.
In this section, we (i) explore critical success factors for investment in mini-grids, (ii) the regulatory framework for mini-grids in Niger, (iii) different structures for PPPs for mini-grids, and (iv) perform a location analysis for potential mini-grid sites to best serve a population that is not likely to be reached by the grid in the short to medium term.
88 SE4All Africa Hub/African Development Bank: Green Mini-Grids Market Development Program, Doc. Series #1, December 2016
104

Open Capital Advisors
A.2.1 Critical decision factors for investment in mini-grids
Besides pricing at cost-reflective tariffs, and grid expansion plans and their implications, there are many other critical factors that require consideration in assessing the opportunity for mini-grids, including the following: 89
Market potential and business viability. Mini-grid operators must identify sites with sufficient revenue generation potential, considering the differing needs of commercial and residential customers, and assess required base loads and investment needs accordingly.
Time to break even. Mini-grid operators must assess site break even potential and related profitability requirements; this will allow them to price tariffs effectively, and will significantly impact the willingness of 3rd parties to invest in the mini-grids.
Finance models and guaranteed off-take with Power Purchase Agreements (PPAs). Different types of finance, e.g. public subsidies or grant funding, can significantly de-risk the investment; PPAs confirm demand and ensure future cash flows. Grid operators need to understand their key risks, and manage them, to be able to attract investment.90
Other key factors that influence the levels of investment in mini-grids surround the regulatory environment and consistency in policy. According to the Africa-EU Renewable Energy Cooperation Programme’s (RECP) mini-grids toolkit, these regulations should be: 91
Transparent and predictable, clear and comprehensive. Investors look for clear and complete regulatory frameworks with full clarity of applicable licenses, permits, requirements, import duties, VAT, company taxes, and other possible incentives and subsidies and a standardized process for regulatory decisions across all transactions. Ambiguity increases uncertainty and often stands in the way of investment.
Accessible. Policy and regulatory frameworks should be accessible, as should the officials or agencies that formulate and support and enforce them.
Implemented through effective and efficient procedures. Procedures in granting licenses and permits, or responding to queries by developers should be fast and transparent. All regulatory decisions should be transparent, fair, independent of power suppliers, technology neutral, and allow a level playing
89 IFC, Operational and Financial Performance of Mini-Grid DESCOS, 201790 Ibid91 Mini-grid toolkit: Policy and Business Frameworks for Successful mini-grid rollouts, available at http://www.euei-pdf.org/sites/default/files/field_publication_file/RECP_MiniGrid_Policy_Toolkit_1pageview_%28pdf%2C_17.6MB%2C_EN_0.pdf
105

Open Capital Advisors
field for developers, while preventing government interference in day-to-day operations.
A.2.2 The regulatory environment for mini-grids in Niger
Investment requirements in a mini-grid are significant, and amortization periods often long, so a conducive regulatory framework for mini-grid operations is required to make investments attractive. Under consideration of the critical decision factors for mini-grid investments explored in the previous chapter, this chapter explores the regulatory environment for mini-grids in Niger. We assess the regulatory framework in Niger with reference to the World Bank Group’s Regulatory Indicators for Sustainable Energy (RISE). RISE is “a set of indicators to help compare national policy and regulatory frameworks for sustainable energy. It assesses countries’ policy and regulatory support for each of the three pillars of sustainable energy access to modern energy, energy efficiency, and renewable energy”.92
A new electricity code was adopted by the Nigerien National Assembly in May 2016, and one key objective of the amendments is to accelerate the electrification of the country, also by opening up the electricity sector to more private sector investment, both local and foreign. It remains to be seen whether the new code brings sufficient investor confidence to see greater inflows of capital into the market. The regulatory framework for PPP was brought into force by decree of 9 November 2011 based on the ordinance of 16 September 2011, and covers the high-level structures and terms for entering into PPP agreements.93
Despite the new electricity code, the regulatory framework in Niger is still developing and remains ambiguous; for example, there is no framework that specifically covers the regulation of mini-grids. However, under the Nigerien government’s priorities to “increase rural electrification, and increase share of power generated through renewable energy”94 private developers can seek government involvement and diverse support for investments to build, own and operate power generation facilities, including mini-grids.
Though mini-grids are allowed to operate in Niger, and can be owned and operated by private operators, regulations do not specify what happens should the national grid reach the mini-grid’s site of operation; it is unclear whether and how
(i) the grids will be integrated, and how much influence the operator would have in the decision-making process,
(ii) the operator will be allowed to continue providing electricity to its clients,(iii) the operator will be permitted to sell electricity to the national grid, and
92 http://rise.esmap.org/about-us93 Tractebel engie: Projet d’expansion de l’accès a l’électricité (NELACEP), Rapport de la tache 1; Niamey, Février 201794 https://www.afdb.org/en/news-and-events/sefa-grants-us-1-million-to-promote-green-mini-grids-in-niger-15990/
106

Open Capital Advisors
(iv) the operator would be compensated for lost business, and/or the takeover of assets.
In line with best practice, mini-grid operators in Niger are permitted to charge cost-reflective tariffs differing from the national tariff. There is no retail electricity tariff schedule for mini-grids, nor any binding indication of how much higher the tariff may be relative to the national grid tariff. There is no requirement for tariffs to be approved, and tariffs charged are not monitored.
In absence of a framework for mini-grids, there are no financial incentives, such as subsidies or tax exemptions, for mini-grid operators. However, certain tax advantages are provided for models that promote renewable energies, and to incentivize PPP. Also, the government has a dedicated budget for electrification with funding provided through ANPER (Rural Electrification Agency). This funding does not include funding for capital subsidies paid to the utilities to provide distribution systems to rural areas. Overall, there is limited transparency into which financial incentives may be available to mini-grid operators and/or PPPs.
Also, there are no quality standards set out for mini-grids including technical standards detailing the requirements for mini-grids to connect the grid.
While a legal framework for renewable energy development exists, private sector ownership of renewable energy generation has not specifically been legally authorized. Given that private sector players are allowed to own and operate mini-grids, this lack of regulation specific to renewables-powered mini-grids would imply that they are not specifically excluded, however, this ambiguity would likely necessitate further investigation by any private sector player to ascertain the legal position on a case by case basis.
Despite the somewhat ambiguous regulatory environment, Niger has successfully attracted modest initial investment in mini-grids. As an example, in July 2016 Niger received a US $994,270 grant from the African Development Bank’s Sustainable Energy Fund for Africa (SEFA)95 aiming to promote green mini-grids and increase private investments in the green mini grid sector96. A key feature of the project is that it is expected to provide support to green mini-grid developers through a business plan competition and feasibility studies; analyze and validate green mini-grid operational models and business cases; and work to remove any fiscal, institutional, technical or quality constraints (AFDB 2016). The program is also expected to contribute to at least $10 million in funding raised for renewable energy
95 About SEFA: Sustainable Energy Fund for Africa (SEFA) “Launched in 2012, SEFA is a US $95-million multi-donor facility funded by the governments of Denmark, the United Kingdom, the United States and Italy. It supports the sustainable energy agenda in Africa through grants to facilitate the preparation of medium-scale renewable energy generation and energy efficiency projects; equity investments to bridge the financing gap for small- and medium-scale renewable energy generation projects; and support to the public sector to improve the enabling environment for private investments in sustainable energy. SEFA is hosted by the Energy, Environment and Climate Change Department of the AfDB.” AFDB https://www.afdb.org/en/news-and-events/sefa-grants-us-1-million-to-promote-green-mini-grids-in-niger-15990/96 AFDB (2016) SEFA grants US $1 million to promote green mini-grids in Niger https://www.afdb.org/en/news-and-events/sefa-grants-us-1-million-to-promote-green-mini-grids-in-niger-15990/
107

Open Capital Advisors
(RE) projects by 2018 (AFDB 2016).97 It is also hoped that growing investment could act as an impetus for the government to develop a more rigorous policy environment.
A.2.3 Different PPP structures for mini-grid investments
The initial assessment of the regulatory environment, as well as the early development stages of the whole ecosystem for solar in Niger, suggest that government and development sector interventions will be required to attract investment into this sector. One strategy to encourage private sector investment in such challenging market environments is the promotion of public-private partnerships (PPP). There are several accepted definitions of PPPs; for this study, we take the PPP Knowledge Lab’s98 definition of a PPP as “a long-term contract between a private party and a government entity, for providing a public asset or service, in which the private party bears significant risk and management responsibility, and remuneration is linked to performance.”
There are many different PPP structures for mini-grids with different levels of involvement of the public sector. Generally, the higher the level of public support, e.g. through subsidies and grants, the lower the tariffs, and consequently the broader the reach, especially in low income population areas. In contrast, higher level of public support often results in grant dependencies and lacking opportunities to scale a sustainable model.
Figure 27 provides an overview of four different structures of PPP for mini-grids; moving from the left side to the right side the involvement of the private sector increases. Model A mini-grids are procured, owned and installed by the public partner, both generation assets and distribution assets. The private partner operates and maintains the assets, and is responsible for the commercialization, typically based on a long-term operation and maintenance agreement. In model B, the public sector is responsible for setting up, operating and maintaining the distribution assets, as well as the commercialization. The private partner sets up, operates and maintains the generation assets, and, based on a power purchase agreement, sells the generated power to the public grid. In model C, the public partner again procures and owns all the assets, and typically installs the distribution assets, while all remaining activities are performed by the private partner. The private partner installs the generation assets, and operates and maintains the whole system, including the commercialization, based on a concession agreement. In model D, the public sector procures, owns and installs the distribution assets. Power generation, operating and maintaining the distribution assets, and
97 Ibid98 https://pppknowledgelab.org/
108

Open Capital Advisors
commercialization are performed by the private partner; an example of model D are the mini-grids being implemented under the Nigeria Energy Support Program.99 Figure 27: Example PPP models for mini-grids100
The models shown above are a few examples of how to structure PPPs in mini-grids. The exact structure of the model needs to be tailored to respective market conditions, and the interests of the public and private partners. In Niger, regardless of PPP structure, additional subsidies, grant funding, first loss coverage agreements, and/or asset insurances are likely to be required to encourage rapid growth in private sector involvement in the mini-grid market.
A.2.4 Identifying high potential locations for mini-grids
Mini-grids are only a viable option in areas of relatively dense energy demand, so that sales of electricity allow for the amortization of the high upfront capital costs within a reasonable time.
Based on the data available, the demand side analysis was performed on a Commune level. As Communes vary largely in geographic land area, and are frequently very large, analysis at the Commune-level is not well suited to identify potential mini-grid sites. As a result, we base the identification of potential mini-grid
99 SE4All Africa Hub/African Development Bank: Green Mini-Grids Market Development Program, Doc. Series #1, December 2016100 OCA analysis and market research
109

Open Capital Advisors
sites on the number of households per locality, and the distance of the locality from the grid. The precision of our analysis was limited by the lacking granularity of grid access data, and the absence of precise location data for grid extension plans, so we recommend further discussions with NIGELEC to validate the suitability of these site locations.
We focus our analysis predominantly on localities situated more than 20 kilometres of the grid, and consequently unlikely to be reached by the grid anytime in the near term. Aligned with the findings that a large share of the Nigerien population lives in small villages (i.e. 69% of the population live in localities with less than 2,000 inhabitants), we find that locality sizes more than 20 kilometres of the grid range from only a few households to at most around 680. Not surprisingly, we also see a tendency of decreasing locality size with increasing distance from the grid. In this range beyond 20 kilometres from the grid, we identify three localities, potentially suited for mini-grid pilot projects; further details on these 3 localities are presented in Table 43. Table 43: The largest localities more than 20 kilometers of the grid101
Locality Commune, Department, Region
# of HH in locality102
# of HH in Commun
e101
Locality: Est.
distance from grid in
km
Commune: Est.
annual electricity demand103
Baban Katami
Babankatami, Bouza, Tahoua 680 8,968 ~ 23 km 15-20 GWh
Baboul Wame, Damagaram Takaya, Zinder 542 6,924 ~ 22 km 10-15 GWh
Guidan Djibo Tabotaki, Bouza, Tahoua 599 7,305 ~ 27 km 10-15 GWh
These three localities are relatively small, with the number of households ranging from 542 to 680 based on the RENALOC data, and would, if at all, only be suited for relatively small, community-level mini-grids. Assuming that the average per household energy consumption at commune level – public institutions, irrigation, water provision included – is representative of energy demand in these localities, we estimate the annual demand at around 1,300 MWh in Baban Katami, and around 1,000 MWh in both Baboul and Guidan Djibo. Further analysis will be required to assess the economic viability of mini-grids at these sites.
Also, as our analysis is purely based on the number of households and the estimated energy demand within localities, further research needs to be performed
101 These findings are based on the information that was made available to us; in many cases there were significant limitations in the accuracy of the data received. 102 Based on the RENALOC dataset. 103 OCA Analysis
110

Open Capital Advisors
around the following criteria to assess which site is best suited for construction of mini-grids:104
Density of demand. As surface area data is not available below Department-level, we have no indication of the density of demand at each locality. Potentially, these localities are highly dense villages (i.e. all houses and other buildings are very close), but alternatively a locality could also stretch over many hectares of widely spread out farms.
Poverty and income levels. Economic feasibility and sustainability is determined not only by the existence of demand, but also by the client’s ability to pay for the electricity services demanded. Poverty and income levels will directly affect pricing; the lower the prices per kWh, the longer the amortization period for upfront capital investment in the mini-grid.
Economic activities. An on-site visit will be required to fully assess the economic activities conducted in the locality. This information will be required to estimate electricity demand more precisely and is therefore key to determine the ideal capacity for the mini-grid.
Infrastructure and accessibility. If the infrastructure connecting the locality to main roads is limited, and consequently the locality is hard to access, this can have significant cost impacts, both on initial investment cost and ongoing operating cost.
Security situation. If the geographic area is not considered safe, it will be very hard to attract private sector interest in investing, and managing, a mini-grid in the locality.
Availability of land and land ownership rights. Constructing a mini-grid requires available land in a convenient site with easy access to the key energy demand centres. Further, constructing a mini-grid represents a significant investment, which is only considered safe to be made if land ownership rights are clearly defined and acceptable.
Grid extension plans. While we have high-level information on which major towns the planned grid extensions will cover, the exact ‘path of the grid’ is often not yet determined and/or unknown to us. Localities that will be close to the grid in the short- to medium-term future are not necessarily the ideal sites for mini-grid construction.
104 This additional research requires in person visits of the individual locations and is outside the scope of this research engagement.
111

Open Capital Advisors
App. B: Methodology & assumptions used for market sizing
B.1 Households
We determine the potential market for household solar products in Niger as follows:
1. Extrapolate the number of households by commune from RENALOC data using the 2015 total population size for Niger from the World Bank Development Indicators database and the national average household size from LSMS data
2. Determine current expenditure on energy-related items from LSMS data at strata level (i.e. Niamey, autre urban, agricole, pastorale, agropastorale)
3. Determine each Commune’s strata4. Multiply number of households in a Commune with the average household
energy expenditure for the relevant strata to determine total household energy expenditure for the Commune
5. Use Region-level household poverty data to estimate household energy expenditure of households living in poverty for each Commune, and subtract this from total Commune household energy expenditure
6. Use strata-level household expenditure distribution (divided into deciles) to estimate energy consumption distribution of households above the poverty line in each Commune
7. Based on this energy consumption distribution, derive market opportunity for a range of solar lanterns and solar home systems, as well as pricing guidelines for mini-grids; this includes both financed (i.e. PAYG) and non-financed (i.e. over-the-counter) markets
8. Perform geographic mapping of population and household energy demand9. Contrast current expenditure on lighting-related products and phone charging
with the cost of solar products to determine lifetime and annualized consumer benefits of investment in solar products, as well as payback periods
For the purpose of this analysis, we make the following assumptions:
Average monthly household expenditure for traditional energy-related products equates to willingness-to-pay for solar products
Households are able to spend up to three times their current monthly energy expenditure on one-off cash purchases or on upfront payments required for
112

Open Capital Advisors
consumer financing; households’ willingness to save for a purchase was confirmed in the focus groups
Each household purchases the most expensive home solar product it can afford from three months of savings, and each household only owns one unit at any given time
50% of on-grid households who can afford solar home devices as backup options for power outages would purchase one
The interest rate for consumer finance is estimated to be 18% p.a. based on insights from consultations with ASUSU and commercial banks in Niger
B.2 Public institutions
Our analysis for the different types of public institutions follows a similar methodology in all three cases. We model out typical appliance usage and subsequent energy demand for a range of different institutions, and for a number of different institution sub-types (e.g. primary schools, secondary schools, tertiary schools, and nurseries within educational institutions). For each institution sub-type, we then evaluate the business case for switching to solar, and finally derive the market size at the Commune, Region, and National level based on institutions with a positive solar business case. Specifically, the analysis involves the following steps:
2. We develop typical use cases for different institutions and sub-types of each institution. For instance, we divide educational institutions into primary, secondary, etc., and model out different clinic “tiers” as defined by the Ministry of Health. Based on our consultations and market research we build a representative list of appliances used, and are therefore able to estimate typical energy demand. For instance, we assume that universities have air conditioning systems whereas primary and secondary schools predominantly only use ceiling fans or no system at all.
3. Based on estimated energy consumption, we calculate the business case for switching to solar technology. This business case is calculated by comparing the lifetime costs of the solar device105 against the cost of each of i) consuming energy from the grid; ii) diesel generators; and iii) traditional lighting solutions (kerosene, candles, etc.). In each case we assume that institutions would choose a solar device that allows them to maintain their current levels of energy consumption (for instance, a nursery currently using candles and kerosene would switch to a basic Lighting Africa solar home system). Table 44 below shows our assumptions for per kW CAPEX cost for various solar systems (including batteries and inverters), reflecting declining
105 The lifetime of solar systems, including all components, is based on knowledge gained from secondary research and consultations. For larger PV installations, it is assumed that solar panels have a lifetime of 20 years, with the need to replace batteries every 5 years, and inverters every 10 years. Lighting Africa-approved products have lifetimes from 2 years for the solar lanterns to 5 years for the solar home systems without the need for component replacements.
113

Open Capital Advisors
per kW costs as overall capacity increases. Importantly, we also assume that power needs below 200W are met by Lighting Africa-type solar home systems and solar lanterns, whereas power needs above 200W require larger PV installations. Table 44: Range of solar systems included in analysis for public institutions
4. We then estimate total market size at commune, regional and national level using data on the geographic distribution of the different types of institutions and the results of the business case analysis. The total market is the CAPEX per institution multiplied by the number of institutions for which there is a business case. We also assume that the on-grid/off-grid split for institutions is the same as for households (since grid connection data is available for households but not explicitly for institutions). Among off-grid institutions, we also assume that larger more formal institutions are more likely to have generators (so that an off-grid secondary school or Departement centre d’administration is more likely to have a generator than a primary school or Case de Santé, which may only have access to traditional lighting methods). Further, as confirmed by consultations, only the largest public buildings (universities and department administrative centers) and health centers that need ongoing refrigeration (CSI 1 and 2) require grid backup systems.
Finally, we map demand based on institution longitude and latitude data. Where this data does not exist, we assume that geographic distribution of institutions correlates with geographic distribution of population.
114
CategorySystem size
in WattsTotal cost
in US $Cost
per KwLifetime in
years*> 10,000 1,500 20
10,000 17,770 1,777 205,000 8,840 1,767 204,000 7,420 1,855 203,000 6,070 2,022 202,000 4,630 2,315 201,500 3,890 2,591 201,000 2,900 2,900 20
500 1,450 2,900 20Large solar home system 200 1,000 5,000 5Medium solar home system 100 500 5,000 5Basic solar home system 20 220 11,000 5Small multiroom lighting system 6 100 16,667 3Light & mobile charger 4 40 10,000 2Standing light 3 10 3,333 2Simple study light 2 5 2,500 2
Phot
ovol
taic
Inst
alla
tions
Ligh
ting
Afric
a
* Note: While the solar panels have an estimated lifetime of 20 years, the batteries need replacing every 5 years, and the inverters (if applicable) every 10 years.

Open Capital Advisors
B.2.1 Educational institutions
For each type of educational institution, we assume a number of appliances in the common areas, and in each class room. Table 45 summarizes these assumptions. Table 45: Electronic appliances by school type
Appliance Watts Nursery Primary Secondary Tertiarya) Common rooms Lightbulbs 15 6 6 10 18
Fridge 200 - - 1 1 Air conditioning 2,500 - - - 1 Ceiling fan 50 1 1 2 2 Computers 200 - - 2 4 Printers/Copiers 120 - - 1 2 Radio 20 1 1 1 1 Phone charger 5 1 1 1 1 - - - - - -
Average # classrooms - 1 2 3 18 b) per classroom Lightbulbs 15 2 2 5 16
Air conditioning 1,500 - - - 1 Ceiling fan 50 1 1 1 1 Overhead projector 80 - - - 1
Avg. daily electricity consumption kWh 1.3 1.9 8.2 163.4 Avg. capacity needs (kW) - 0.2 0.3 1.3 23.8 Avg. solar system size (kW) 0.2 0.3 1.3 26.7 Source: OCA Consultations & Analysis
# of units by school type
To size the market, we assume that (i) every institution for which there is a positive business case would opt to switch to solar if they had the necessary funding or financing, (ii) the on-grid/off-grid split for institutions is the same as for households, with exception of tertiary universities which are all on-grid, and (iii) off-grid institutions currently use either diesel generators or traditional sources of lighting (candles, kerosene, etc.). Table 46 shows these assumptions in detail. Table 46: Assumptions on current electricity sources for schools
Institutionsub-type % on grid
Off-grid% with diesel
generator% with
traditional sources of
lightingSchools Nursery 19% 0% 81%
Primary 12% 0% 88%Secondary 10% 17% 73%
Tertiary 100% 0% 0%
B.2.2 Health facilities
For each type of health facility, we assume different quantities of basic electric appliances as well as more sophisticated medical devices, based on consultations with the Ministry of Health. These are summarized in Table 47 below.
115

Open Capital Advisors
Table 47: Electronic appliances by type of health facility
Appliance W Cases de Santé CSI 1 CSI 2Lightbulbs 15 4 8 10 Fridge 200 - 1 1 Ceiling fan 50 1 3 5 Standing lamp 40 - 1 2 Computers 200 - - 1 Printers/Copiers 120 - - 1 Radio 20 1 1 1 Phone charger 5 1 1 1 Electric microscope 15 - - 1 Electric centrifuge 80 - - 1 Respirator 80 - - 1 Avg. daily electricity consumption kWh 0.8 6.8 10.0 Avg. capacity needs (kW) 0.1 0.5 1.2 Avg. solar system size (kW) 0.1 1.1 1.6 Source: OCA Consultations & Analysis
# of units by facility type
We estimate the total market size based on the assumptions that the on-grid/off-grid split for health institutions is the same as for households, and that larger institutions are less likely to depend on traditional lighting technologies (summarized in the table below).Table 48: Assumptions on current electricity sources for health facilities
Institutionsub-type % on grid
Off-grid% with diesel
generator% with
traditional sources of
lightingHospitals & clinics
Case de santé 12% 0% 88%CSI 1 14% 86% 0%CSI 2 19% 81% 0%
116

Open Capital Advisors
B.2.3 Public buildings
Based on consultations, we assume the following appliance and energy consumption profile for the different types of public building: Table 49: Electronic appliances by public building type
Appliance W Comm' admin Depm't admin Police & courts Prisonsa) Common rooms Lightbulbs 15 2 4 3 2
Fridge 200 1 1 1 1 Air conditioning 2,500 - 1 - - Ceiling fan 50 1 1 1 1 Computers 200 1 1 1 1 Printers/Copiers 120 1 1 1 1 Radio 20 1 1 1 1 Phone charger 5 1 1 1 1
Average # of rooms - 1 4 2 6 b) per room/office Lightbulbs 15 1 2 1 1
Air conditioning 1,500 - 0 - - Ceiling fan 50 1 1 1 0 Phone charger 5 1 1 1 0
Avg. daily electricity consumption kWh 7.7 43.5 8.1 8.0 Avg. capacity needs (kW) 0.7 5.3 0.8 0.8 Avg. solar system size (kW) 1.3 7.1 1.3 1.3 - - - - - Source: OCA Consultations & Analysis
# of units by building type
We assume again that the on-grid/off-grid split for public buildings is the same as for households, along with the following specific assumptions based on insights gained from consultations: Table 50: Assumptions on current electricity sources for other public buildings
Institutionsub-type % on grid
Off-grid% with diesel
generator% with
traditional sources of
lightingPublic buildings
Commune admin. 2% 0% 98%Department admin. 1% 99% 0%
Police stations & courts
8% 29% 63%
Prisons 5% 2% 93%
The low ratio of police stations, court houses and prisons equipped with generators is based on insights from consultations that court houses are, for security reasons, commonly closed before sunset and there is a general tendency to minimize investment in police stations and prisons.
117

Open Capital Advisors
B.3 Agricultural irrigation
The analysis for agricultural irrigation is broken down into ‘large irrigation schemes’ and ‘small scale, individual irrigation schemes’, and the methodology for each is presented below.
B.3.1 Large irrigation schemes
We estimate power requirements for irrigating AHA based on (i) water volumes required (driven mainly by plot size and crop cultivated), (ii) the water source (e.g. wells require water to be pumped to the surface), and (iii) pumping distances (determined by the land area covered).
We then estimate solar system size requirements for water pumping as follows:
1. We determine the water needs for Niger’s irrigated land area based on data received from ONAHA on estimated historical water usage. We validate the data by combining domestic crop cultivation data with West-African irrigation water footprint data and field efficiency (% of water supplied that is absorbed by the crops)106 to derive per hectare water requirements for rice and polyculture farming in Niger.
2. Next, we adjust total water needs for rainfall by Region; see Table 51.3. As many of the AHA are very large and require multiple water pumping
stations to channel the necessary irrigation water – either from rivers, dams or wells – we assume that each water station serves a maximum of 25 hectares of surface area. This figure is based on insights gained during consultations and has been applied in absence of actual data on how many pumping stations are used to serve each AHA. We include further analysis to present how the surface area per pumping station affects business case and market size.
106 Field water efficiency is defined as the share of water channeled through an irrigation system which is effectively absorbed by the plants.
118
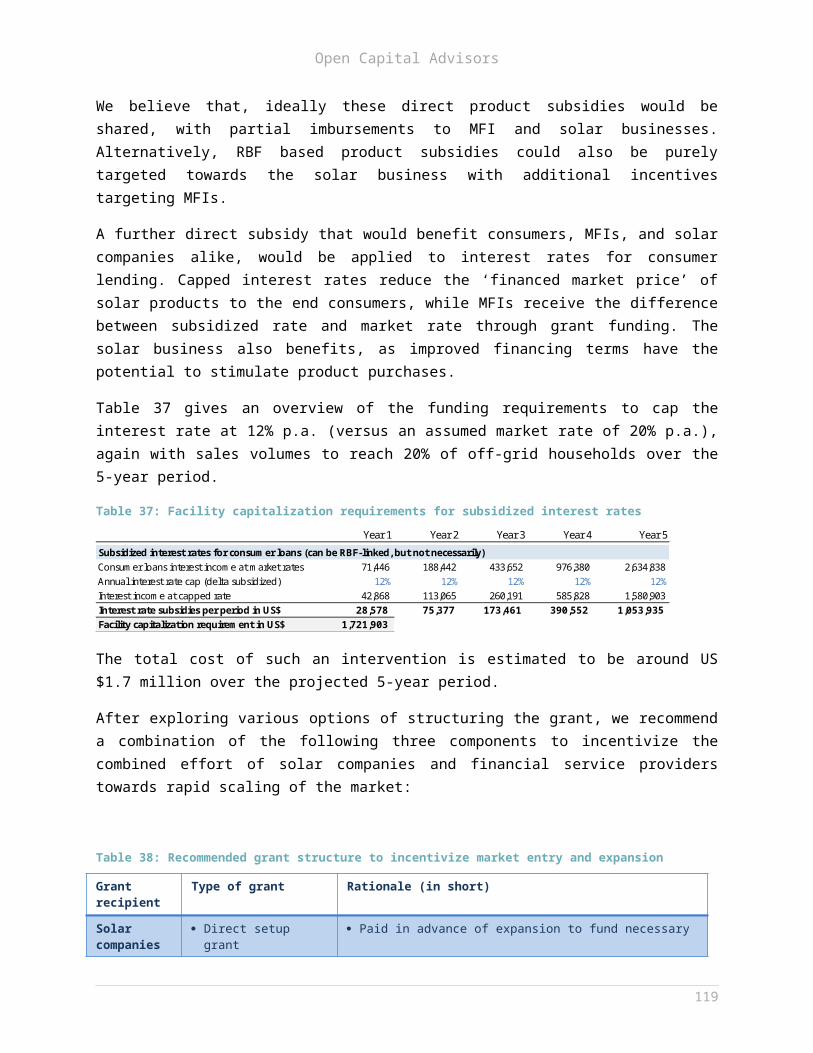
Open Capital Advisors
Table 51: Irrigation water needs and average flow capacities of pumping stations
Rice PolycultureAGADEZ 1,210 27,540 19,490 0.0 0 0DIFFA 3,060 25,690 17,640 9,428.2 17 249DOSSO 5,620 23,130 15,080 17,442.8 34 230MARADI 4,921 23,829 15,779 18,019.6 47 172NIAMEY 5,030 23,720 15,670 16,515.1 30 247TAHOUA 3,643 25,107 17,057 65,004.2 156 187TILLABERI 3,955 24,795 16,745 240,553.9 401 269ZINDER 3,800 24,950 16,900 2,535.0 6 190
369,499 691
Annual rainfall m3/ha
Irrigation water needsm3 per ha p.a.
AHA irr. water needs in m3 thousand p.a.
Assumed # of pumping
stations (PS)*
Avg. PS flow capacity in m3/hour
* Based on the assumption that each water pumping station covers an average land area of 25 hectares; consultations revealed that there is a significant variance in land area covered by pumping stations, so 25 hectares was chosen as reasonable average for presentation purposes.
4. Next, we estimate the surface pumping distance assuming that furrows are laid out across one diagonal of the surface area served by a pumping station; using this methodology the pumping distance to serve 10 hectares would be approximately 450 meters107. Further pumping power is required to lift the water out of wells, if applicable. Only five AHA (around 1,200 hectares) are served by wells, of which four are located in Maradi, and one in Zinder. Based on consultations, we have assumed that the wells in Maradi are on average 65 meters deep, and the well in Zinder 90 meters.
5. Based on data received from ONAHA on surface area, crop type, and water source by AHA, and the analysis of water needs as well as surface and lifting pumping requirements, we then develop the pumping capacity requirement for each pumping station and each AHA.
6. Using data on irrigation capacity and costs of various solar-, and generator-powered pumping systems, we then develop the business case for solar water pumping. Based on this, we estimate the market size.
Table 52 provides an overview of the electricity and investment needs per pumping station – with a maximum surface area coverage of 25 hectares – for a selection of AHA chosen to display how crop and water source impact power requirements. Further, the total lifetime CAPEX for the AHA is displayed. The lifetime is determined by the estimated life of solar panels of 20 years. Lifetime CAPEX includes component replacements, such as batteries and inverters108, as well as other maintenance cost over that period. Rice farming requires higher water volumes per hectare than polyculture farming, which reflects in the higher flow capacities as displayed in m3 per hour. Further, lifting water out of wells consumes significantly more energy, which reflects in the considerably higher lifetime CAPEX values per pumping station for Djirataoua and Kakibaré as compared to the river/dam stations.107 10 hectares is equal to 100,000 m2, which would be covered by a square plot of around 300x300 meters. The diagonal of such a plot has length of around 450m. 108 We have included batteries and inverters in the costing as consultations unanimously revealed this as a requirement to make solar pumping a viable alternative to generator-powered pumping. The for this is that water is pumped for around 10-12 hours a day for the ONAHA schemes, which is not possible with solar without power storage.
119

Open Capital Advisors
Table 52: Overview of solar system needs for selective AHA
Flow capacity in m3/hour
Electricity cons. p.a. in kWh
Solar system size in kW
Lifetime CAPEX (US $)*
AHA de Saga Rice River 390 16 260 23,161 18.7 105,500 1,688AHA de Gabou 3 Rice River 1,200 48 278 24,992 20.1 120,500 5,784AHA de Moulléla Poly Dam 65 3 166 14,306 11.5 70,700 212AHA de Djirataoua Poly Well 512 21 173 100,489 81.0 527,300 11,073AHA de Kakibaré Poly Well 50 2 190 146,425 118.0 678,000 1,356
AHA lifetime CAPEX
(US $ '000s)
Electricity and investment needs per pumping stationCrop type
* Lifetime CAPEX includes upfront investment for solar system and pump, and replacement parts over an assumed lifetime of 20 years.
Water source
# of pumping stations
Surface area in ha
B.3.2 Small scale, individual irrigation schemes
We analyze the irrigation water requirements in Niger as the basis for power requirements at the farm level; for the purpose of this analysis, community-level boreholes and livestock-related water needs are considered separately later in the market sizing for water providers.
For modelling purposes, the following approach was taken to estimate water pumping requirements for smallholder farmers, and commercial farms:
1. In the absence of representative farm size statistics and data on the breakdown of irrigated land area by farm type, we take the Nigerien farm size range (0.2 hectares to 8 hectares)109, and assume that agricultural land in Niger can be broken down into a representative group of farms typical of many African countries in early stages of development, representing the socio-economic conditions in Niger. We then assume, based on insights from consultations, that farms irrigate on average 70% of their farm land. The portfolio of farms used throughout our analysis is presented in Table 53.Table 53: Breakdown of irrigated land by farm type (small scale, individual irrigation schemes)
Farm count in % Hectares in %Micro smallholder farms ("Micro SHF") 0.14 400,055 75% 56,008 47%Smallholder farms ("SHF") 0.35 121,350 23% 42,473 36%Small commercial farms ("Small CF") 1.40 10,668 2% 14,935 13%Medium commercial farms ("Medium CF") 3.50 1,067 0% 3,735 3%Large commercial farms ("Large CF") 5.60 267 0% 1,495 1%
533,407 118,645
Irrigated area in ha per farm
Breakdown of# of farms
Breakdown of irrigatedland area
2. We allocate the farms to Regions based on the Region-level breakdown of irrigated land area (excluding ONAHA; see Table 54); and then allocate farms to commune level based on the number of farming households per commune.
109 Data received from the Ministry of Agriculture
120

Open Capital Advisors
3. We assume that smallholder and commercial farms have daily irrigation needs of around 80 m3 of water per hectare per day during productive seasons110; the total number of productive days, adjusted for rainfall days, is estimated at on average 194 per year.111 Effective pumping hours per day for irrigation purposes is estimated at seven hours.112
The breakdown into five farm sizes allows us to identify the suitable water pumping solution for each farm type. We further differentiate each of the five farm sizes by the source of water, namely: (i) rivers and dams, (ii) shallow boreholes at a depth of 5 to 7 meters, and (iii) deep boreholes at a depth of fifteen-meters.113 Specifically, we estimate the following regional breakdown of irrigated land area by water source:114
Table 54: Irrigated land area by Region and breakdown of irrigated area by water source
Rivers & dams Shallow boreholes Deep boreholesAgadez 6,134 50% 0% 50%Diffa 5,541 50% 45% 5%Dosso 15,370 50% 45% 5%Maradi 32,943 50% 45% 5%Niamey 6,465 50% 45% 5%Tahoua 29,665 50% 25% 25%Tillaberi 4,525 50% 35% 15%Zinder 18,001 50% 25% 25%
118,645 50% 34% 16%
RegionIrrigated area in ha
(excl. ONAHA)Area breakdown by water source for irrigation
4. Using data on irrigation capacity and costs of various solar-, and generator-powered products, we then develop the business case for solar water pumping. Next, we estimate the market size, taking affordability considerations from household-level analysis into account for smallholder farmers as necessary.
Table 55 provides an overview of the pumping solutions included in the analysis. We have included two solar pumping kits115 as options for small-scale farming and component solutions offering a combination of conventional water pumps for agriculture and solar systems. The solar systems include solar panels, battery, inverter and the required cables.
110 Data received from the Ministry of Agriculture111 This varies depending on the number of harvests per year and average season duration for the crops cultivated.112 Data received from the Ministry of Agriculture113 We did not include boreholes deeper than 15 meters as this market is expected to be very limited; note also that nationwide boreholes and wells for communal water provision are covered in the section on water providers.114 In absence of data on the breakdown, an assumptions-driven approach, guided by insights from consultations was required.115 The small pumping kits are sold as ‘complete solution packages’, which include a pump and the solar system to power the pump (integrated sets). In contrast, component solutions are sales of individual components, such as solar panels, pumps, batteries, inverters etc., which are combined for larger solar pumping systems.
121

Open Capital Advisors
Table 55: Overview of pumping solutions for irrigation Liters per hour
(max) Power (flow-rate)
kW Pump
CAPEX (US $) Solar system CAPEX (US $)
Medium component system (5.2 KW) 70,000 5.2 1,300 12,050 Medium component system (4.8 KW) 65,000 4.8 1,210 11,550 Medium component system (4.5 KW) 60,000 4.5 1,120 11,000 Medium component system (4.1 KW) 55,000 4.1 1,030 10,390 Medium component system (3.7 KW) 50,000 3.7 930 9,720 Medium component system (3.4 KW) 45,000 3.4 840 9,000 Medium component system (3.0 KW) 40,000 3.0 750 8,220 Medium component system (2.6 KW) 35,000 2.6 650 7,390 Medium component system (2.2 KW) 30,000 2.2 560 6,500 Medium component system (1.9 KW) 25,000 1.9 470 5,550 Medium component system (1.5 KW) 20,000 1.5 370 4,550 Medium component system (1.1 KW) 15,000 1.1 280 3,500 Medium component system (0.7 KW) 10,000 0.7 200 2,390 Small component system (0.6 KW) 7,500 0.6 200 1,830 Small component system (0.4 KW) 5,000 0.4 200 1,250 Small component system (0.2 KW) 2,500 0.2 200 620 Integrated Sets - Small solar pumping kit 1,600 0.1 650 Integrated Sets - Micropump kit 500 0.04 400
Further analysis was performed to assess how affordability would impact the market size for smallholder farmers; this analysis followed the same approach as the analysis for private households in section 4.1, based on the following assumptions:
Three products are supplied to the smallholder market: (i) a solar micropump kit at US $400; (ii) a solar pumping kit at US $650; and (iii) a small component system with 0.2kW at US $820. All three products are offered with the option of payment over 24 months.116
Households are able to spend up to three times their current monthly water-pumping related energy expenditure on one-off cash purchases or the upfront payment required for financing schemes.
Each farming household purchases the most expensive solar pumping system it can afford from its monthly income, and each household only owns one unit at any given time.
Farming households are willing to allocate 15% of monthly household expenditure to water pumping; this value is an approximation based on residual income after elementary expenditure.117
116 Consultations with Microfinance institutions as well as solar and pump distributors indicated that longer tenors for these loan sizes would not be economically viable, especially under consideration of opportunity costs.117 Valid data to confirm this expenditure level was not available, and participants of the focus groups could not value this activity as irrigation is performed manually by members of the household.
122
Open Capital Advisors
B.4 Crop processing
We evaluate the business case for solar power for milling and estimate the market size as follows:
1. We take 2014 annual production volumes in tons for the major crops in Niger. We then assume that 85% of crops are processed118 to estimate the tons of crop milled per year. To mitigate the limitations of lacking data on crop processing levels, we include the market size for different crop processing levels in the market sizing section.
2. We use empirical data from secondary research on international average power requirements to mill a ton of each crop to estimate total power needs for crop processing in Niger; see Table 56.Table 56: Overview of key crops, and estimation of energy consumption for milling
Millet Rice Sorghum Maize Sugar cane TotalTotal tons of production 2014 (key crops) 3,321,753 13,989 1,425,982 8,635 197,800 Estimated % of crops that is processedTons of crop milled 2,823,490 11,891 1,212,085 7,340 168,130
kWh to mill 1 ton of crop 18 15 18 18 51 Estimated total consumption in MWh 51,969 178 22,309 135 8,591 83,183 Sources:FAO Agricultural StatisticsANNUAIRE STATISTIQUE DU NIGER 2010 - 2014 AGRICULTURE, ELEVAGE, PECHE ET FORETS Ministère du Développement agricoleNational Center for Biotechnology Information, https://www.ncbi.nlm.nih.gov/The Sugar Engineers, www.sugartech.comOCA Analysis & consultations
85%
3. In absence of data on milling unit capacities in Niger, we determine three different mill sizes based on our experience working in the agricultural sector across many African countries and consultations performed in Niger. For each mill size we estimate the power needs of the milling machine, daily energy consumption, and solar system size requirements. This is shown in Table 57, together with the daily milling volumes that would be processed in mills of these sizes.119
Table 57: Overview of different mill sizes and milling capacities (theoretical construct)
118 The milling ratio of 85% is an assumption; no data available from the Ministry of Agriculture or other sources 119 We group millet, sorghum and maize as they have very similar energy requirements for milling. For further analysis, we focus on the aggregate of these three crops, and sugar cane. Rice is excluded due to its immaterial impact on overall market size.
123

Open Capital Advisors
4. We then calculate the lifetime and annualized costs of running these mills with solar-, grid- and generator-power to develop the business case for using solar energy for milling. Lifetime costs are based on the typical productive life of solar panels of 20 years; replacement parts, and ongoing running costs (e.g. diesel for generators) for this period of time are included for all options to provide a comparable annualized cost.
5. Next, we determine that market size for solar technology for the crop processing sector. In absence of market breakdown data, we present two scenarios:
a. Scenario I assumes that 100% of milling for the main crops is performed by small village-level mills.
b. Scenario II assumes a breakdown characteristic of many African countries; 60% of total crop milling volume is processed in small village-level mills, 35% by medium-sized mills, and 5% by large mills.120
In the absence of regional crop processing data we cannot allocate the market size to communes. Countries with less developed infrastructure are often characterized by small processing mills operated at community level, as challenges in transportation make it hard for large centralized mills to transport produce to where it will be consumed. Hence, we expect that the geographical distribution of demand for milling power is likely to closely mirror the demand for agricultural irrigation. Further, to estimate the market size, we assume that 85% of key crop production volumes reported by the Ministry of Agriculture and FAO121 will be processed. We present the market size for two scenarios, as described above in the methodology section.122 We further present the impact of changing the crop processing levels on the market size.
120 These market breakdown assumptions were required as no empirical data is available.121 Ministère du Développement agricole, Annuaire Statistique Du Niger 2010 - 2014 Agriculture, Elevage, Peche et Foret; FAO Agricultural data factbase // FAO Data, available at http://www.fao.org/3/a-bl036e.pdf122 Newspaper articles have revealed that the construction of a large-scale sugar mill is planned. This mill is projected to process sugar in amounts larger than the current national consumption. It is unclear whether this will lead to production increases to provide necessary supplies, also potentially for exporting, or whether this will lead to a strong geographic centralization of sugar processing (and increasing the power requirement for that location); see: Une entreprise chinoise envisage d’ouvrir une raffinerie de sucre au Niger 31 mars 2012: http://agritrade.cta.int/fr/Agriculture/Produits-de-base/Sucre/Une-entreprise-chinoise-envisage-d-ouvrir-une-raffinerie-de-sucre-au-Niger
124
Small (village-level) Medium Large
Size of milling machine in kW 5.0 20.0 85.0 Daily energy consumption in kWh* 40.0 160.0 680.0 Solar system size in kW 6.5 26.1 110.9
Daily milling capacities in tonsMillet, sorghum and maize 2.2 8.7 36.9 Sugar cane 0.8 3.1 13.3 * Assumption of 8 operating hours per day.
Mill sizeSmall
(village-level) Medium LargeSize of milling machine in kW 5.0 20.0 85.0 Daily energy consumption in kWh* 40.0 160.0 680.0 Solar system size in kW 6.5 26.1 110.9
Daily milling capacities in tonsMillet, sorghum and maize 2.2 8.7 36.9 Sugar cane 0.8 3.1 13.3 * Assumption of 8 operating hours per day.
Mill size

Open Capital Advisors
B.5 Water provision
For each type of water station, we modelled the energy required to pump underground water to the surface factoring in regional differences in borehole depth (i.e. groundwater levels are much deeper in the drier Northern Niger than in the south), and the energy required to pump the water to the relevant place of extraction. More precisely, the following approach was taken:
1. The number of water points at regional level (see Table 58) are distributed to commune level based on the commune’s strata (e.g. urban, agricole, pastorale), Department-level livestock distribution, and Locality-level population distribution. Table 58: Number of different water stations by region123
Region PC FPM H Mini- AEP PEA SPP AEP TotalAgadez 645 120 258 17 80 5 1,125 Diffa 1,196 138 290 31 11 2 1,668 Dosso 3,053 1,829 1,992 130 16 6 7,026 Maradi 4,166 1,467 2,526 48 54 17 8,278 Niamey 36 48 1 3 - 38 126 Tahoua 2,621 517 2,372 100 90 20 5,720 Tillaberi 2,665 2,767 1,097 182 13 3 6,727 Zinder 1,854 3,186 1,515 62 18 15 6,650 Total # of water stations 16,236 10,072 10,051 573 282 106 37,320
2. Next, we estimate water needs for each type of water station based on the expected number and type of users, extrapolating where water usage statistics were not available with the goal of matching the water drawn from the various water providers to the overall water abstraction rate for Niger as measured by the World Bank.124 This exercise relied partly on information from the Niger Ministry of Hydraulics and Sanitation125 on the number of rural water access points for the different regions as well as INS regional and department level statistics126 on water provision to the various users: Households, industries, public institutions and communal water points in urban areas.Table 59: Water volume assessment by water point
PC FPM H PEA SPP Mini-AEP AEPAnnual water need in m3 6,231 15,454 455,157 680,469 18,224 1,070,746 Flow capacity m3/h 0.9 2.4 69.3 103.6 2.8 163.0
3. We then modelled the energy requirements to lift and distribute the water based on distance to the consumers - for the communal water points, the distance from the well head (or borehole) to the water station where consumers can access the water, typically close to the well, and for the larger
123 Ministère de l’Hydraulique et de l’Assainissement, Rapport Annuel d’Activités du Ministère de l’Hydraulique et de l’Assainissement, 2015124 World Bank: Country Development Indicators Database125 Annual report (Rapport Annuel d’Activités du Ministère de l’Hydraulique et de l’Assainissement, Anee 2015)126 Annuaire des Statistiques Regionales 2010-2014, INS Niger 2015 across regions
125

Open Capital Advisors
water suppliers (Mini-AEPs and AEPs), we modelled the distance water would need to be piped to cover a target area based on Region-level population density, factoring in differences in densities between urban and rural populations (based on our analysis sampling representative urban and rural areas).127
Table 60: Average borehole depth & surface pumping distance by region and water station
PC FPM H PEA SPP Mini-AEP AEPAgadez 300 0.075 0.075 0.15 0.15 113 32 Diffa 60 0.075 0.075 0.15 0.15 113 32 Dosso 60 0.075 0.075 0.15 0.15 23 32 Maradi 60 0.075 0.075 0.15 0.15 14 32 Niamey 60 0.075 0.075 0.15 0.15 4 19 Tahoua 150 0.075 0.075 0.15 0.15 19 27 Tillaberi 80 0.075 0.075 0.15 0.15 56 32 Zinder 150 0.075 0.075 0.15 0.15 14 24
Borehole depth (meters)Region
Average surface pumping distance (km)
In absence of a comprehensive dataset on borehole depth, and given the diverse variation in borehole depth even within Regions, we have assessed the business case and market size using an estimated Regional average borehole depth. Further, no information was available on AEPs potentially extracting river water rather than sourcing the water from boreholes, so this has been excluded from our analysis.128
4. Finally, we identify solar solution requirements to meet the power needs calculated above, and establish the business case of solar solutions by contrasting CAPEX and OPEX requirements for solar technology against alternative sources of energy such as grid and generators. We then modelled the market size at commune level factoring in the number and type of water stations required for each commune based on the population of the commune, as well as the location of the commune (whether urban or rural) and the main economic activity of the commune (e.g. industry, livestock, etc.).129
Table 61 provides an overview, at a Region-level, of the pumping capacities required by type of pumping station.
127 In absence of data on how many water pumps are used per water station, we assume that full demand of each water station is served with one pump; the quantity of pumps generally has relatively low impact on electricity needs, and due to the variable calculation methodology, the impact on market size is also immaterial. 128 The process of cleaning and treating river water also involves high energy consumption levels, so that the overall effect on energy demand from excluding river pumping is unlikely to be material. Further research, outside the scope of this report, would be required to develop a more accurate market size considering all the different water sources, variations in borehole depth etc.129 The analysis assumes there is no overlap between urban and rural water provision, and that the whole the population of Niger sources water from one of the 6 water provider types described in the analysis, and not from alternative sources such as stored rainwater, reservoirs, water-pans and rivers, and that all the water points enumerated by the Ministry of Hydraulics and Sanitation and the National Institute of Statistics (data sets which the analysis relies on) are functional.
126

Open Capital Advisors
Table 61: Pumping station size requirements in kW by type and Region
Region
PC FPM H PEA SPP Mini-AEP AEPAgadez 1.0 2.4 76.6 109.1 8.5 564 Diffa 0.2 0.5 20.0 24.6 6.2 431 Dosso 0.21 0.5 20.0 24.6 1.7 431 Maradi 0.21 0.5 20.0 24.6 1.3 431 Niamey 0.21 0.5 20.0 24.6 0.8 267 Tahoua 0.50 1.2 41.3 56.3 2.4 415 Tillaberi 0.3 0.7 24.8 31.6 3.6 442 Zinder 0.5 1.2 41.3 56.3 2.2 382
Total kW required to pump water out of the ground and distribute it
Based on the pumping capacity requirements, we further assess the nationwide average size requirements for water pumps and solar systems, as well as daily electricity consumption by type of pumping station, as shown in Table 62; note that there are significant size variances across each type of pumping station.
Table 62: Average pump size, electricity consumption, and solar system size by pumping station
PC FPM H PEA SPP Mini-AEP AEPPump size requirement in kW 0.3 0.9 29.2 61.0 2.4 368.8 Daily electricity consumption in kWh 6.0 15.4 526.0 1,098.5 42.3 6,638.5 Solar system size requirement in kW 1.0 2.5 85.8 179.2 6.9 1,083.0
Nationwide averages
127