understanding the origins of defects and ... the origins of defects and variability in composites...
TRANSCRIPT

UNDERSTANDING THE ORIGINS OF DEFECTS AND
VARIABILITY IN COMPOSITES MANUFACTURE
K.D. Potter
University of Bristol
Queen’s Building, University Walk, Bristol, BS8 1TR, UK
SUMMARY
This paper reviews the sources of variability inherent in the manufacture of composite
parts and examines how uncontrolled variability can lead to the generation of defects. A
taxonomic approach is taken to categorise the large number of sources of variability
(>60) and defect types (>130) identified, as a step towards eliminating defects.
Keywords: Manufacture, defects, quality, dimensional variability
INTRODUCTION
As the volume of advanced composites components for aircraft applications continues
to rise and primary structures are increasingly made from advanced composites it is
necessary to review the quality of the materials, processes and design practices that are
used to generate those composite structures. As production rates are expected to expand
very markedly the quality target must be zero defects, zero rework and repair (with the
associated concessions), and zero scrap. This paper reviews the sources of variability
and defects in aircraft composite parts, and attempts to identify approaches that can be
taken to generate more robust design and manufacturing processes. More than 130
defect types and more than 60 sources of variability and unreliability can be identified
for the autoclave and resin transfer moulding processes. Many of these sources of
variability have their roots in the reinforcements used and in the ways that those
reinforcements map to the geometry of components. Almost all of our mechanical
property data is generated from flat laminates, but almost all useful components are of
more complex geometry. Understanding the underlying variability of reinforcements
and their deformation and consolidation characteristics is one key to the understanding
of variability in product performance.
VARIABILITY IN THE REINFORCEMENT/PREPREG AS RECEIVED
A wide variety of reinforcement types are now commonplace, but all of these are
subject to variability in a range of properties. For example, unidirectional prepreg is
supplied against a set of specifications agreed with the manufacturer and delivered to
meet these specifications. In principle it is not possible to improve on the variability in
the prepreg in terms of either mass/unit area properties or fibre straightness, so the
variability in the incoming materials sets the minimum variability [1]. Fig 1 shows the
measured variability in mass/unit area of a set of 127 batches of prepreg (381 individual
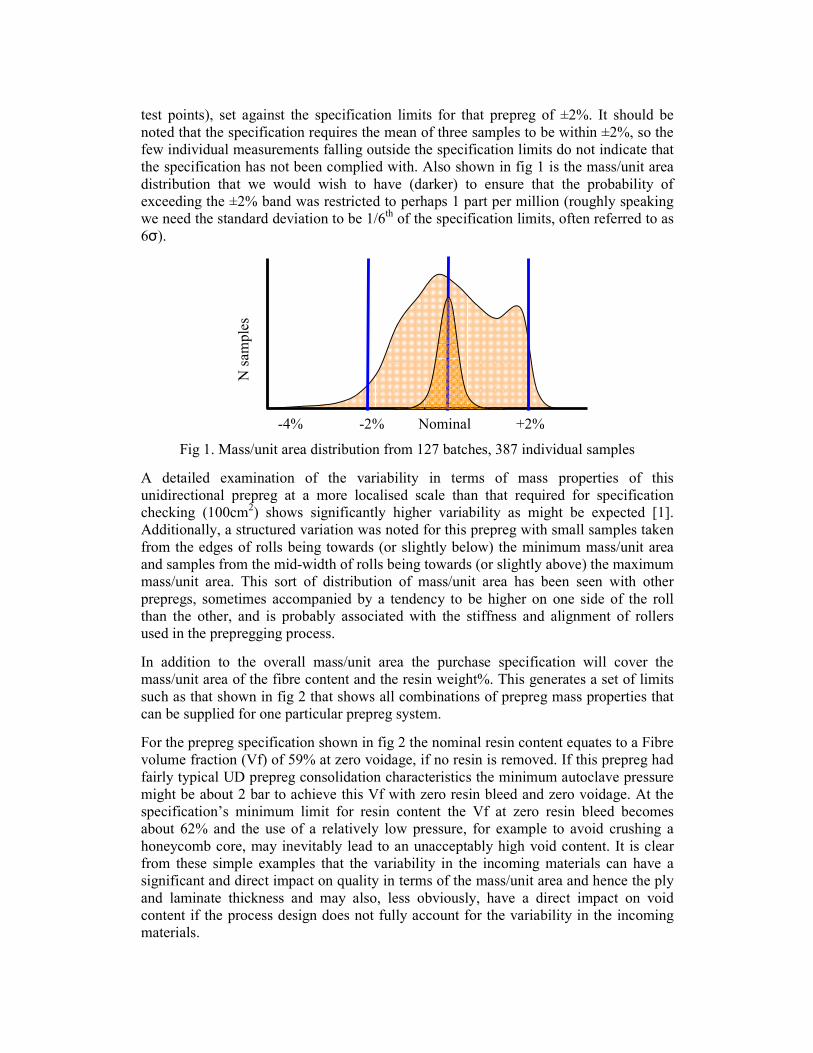
test points), set against the specification limits for that prepreg of ±2%. It should be
noted that the specification requires the mean of three samples to be within ±2%, so the
few individual measurements falling outside the specification limits do not indicate that
the specification has not been complied with. Also shown in fig 1 is the mass/unit area
distribution that we would wish to have (darker) to ensure that the probability of
exceeding the ±2% band was restricted to perhaps 1 part per million (roughly speaking
we need the standard deviation to be 1/6th of the specification limits, often referred to as
6σ).
Fig 1. Mass/unit area distribution from 127 batches, 387 individual samples
A detailed examination of the variability in terms of mass properties of this
unidirectional prepreg at a more localised scale than that required for specification
checking (100cm2) shows significantly higher variability as might be expected [1].
Additionally, a structured variation was noted for this prepreg with small samples taken
from the edges of rolls being towards (or slightly below) the minimum mass/unit area
and samples from the mid-width of rolls being towards (or slightly above) the maximum
mass/unit area. This sort of distribution of mass/unit area has been seen with other
prepregs, sometimes accompanied by a tendency to be higher on one side of the roll
than the other, and is probably associated with the stiffness and alignment of rollers
used in the prepregging process.
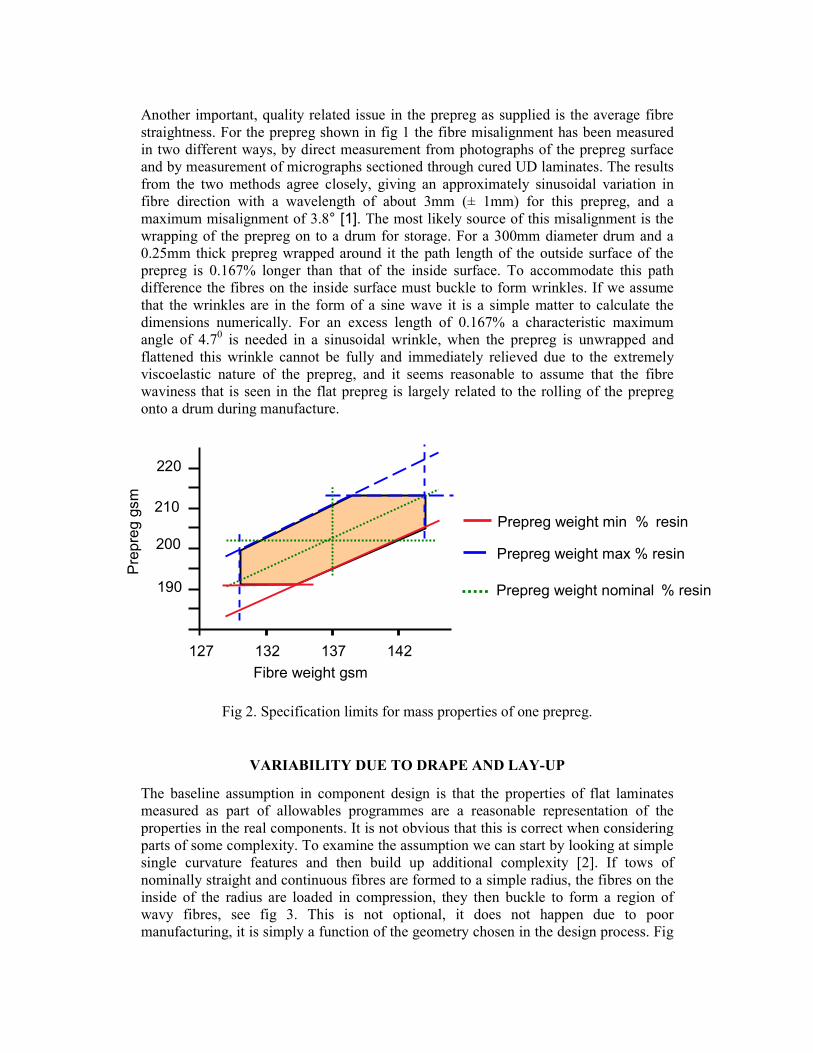
In addition to the overall mass/unit area the purchase specification will cover the
mass/unit area of the fibre content and the resin weight%. This generates a set of limits
such as that shown in fig 2 that shows all combinations of prepreg mass properties that
can be supplied for one particular prepreg system.
For the prepreg specification shown in fig 2 the nominal resin content equates to a Fibre
volume fraction (Vf) of 59% at zero voidage, if no resin is removed. If this prepreg had
fairly typical UD prepreg consolidation characteristics the minimum autoclave pressure
might be about 2 bar to achieve this Vf with zero resin bleed and zero voidage. At the
specification’s minimum limit for resin content the Vf at zero resin bleed becomes
about 62% and the use of a relatively low pressure, for example to avoid crushing a
honeycomb core, may inevitably lead to an unacceptably high void content. It is clear
from these simple examples that the variability in the incoming materials can have a
significant and direct impact on quality in terms of the mass/unit area and hence the ply
and laminate thickness and may also, less obviously, have a direct impact on void
content if the process design does not fully account for the variability in the incoming
materials.
-4% -2% Nominal +2%
N samples
Another important, quality related issue in the prepreg as supplied is the average fibre
straightness. For the prepreg shown in fig 1 the fibre misalignment has been measured
in two different ways, by direct measurement from photographs of the prepreg surface
and by measurement of micrographs sectioned through cured UD laminates. The results
from the two methods agree closely, giving an approximately sinusoidal variation in
fibre direction with a wavelength of about 3mm (± 1mm) for this prepreg, and a
maximum misalignment of 3.8° [1]. The most likely source of this misalignment is the wrapping of the prepreg on to a drum for storage. For a 300mm diameter drum and a
0.25mm thick prepreg wrapped around it the path length of the outside surface of the
prepreg is 0.167% longer than that of the inside surface. To accommodate this path
difference the fibres on the inside surface must buckle to form wrinkles. If we assume
that the wrinkles are in the form of a sine wave it is a simple matter to calculate the
dimensions numerically. For an excess length of 0.167% a characteristic maximum
angle of 4.70 is needed in a sinusoidal wrinkle, when the prepreg is unwrapped and
flattened this wrinkle cannot be fully and immediately relieved due to the extremely
viscoelastic nature of the prepreg, and it seems reasonable to assume that the fibre
waviness that is seen in the flat prepreg is largely related to the rolling of the prepreg
onto a drum during manufacture.
Fig 2. Specification limits for mass properties of one prepreg.
VARIABILITY DUE TO DRAPE AND LAY-UP
The baseline assumption in component design is that the properties of flat laminates
measured as part of allowables programmes are a reasonable representation of the
properties in the real components. It is not obvious that this is correct when considering
parts of some complexity. To examine the assumption we can start by looking at simple
single curvature features and then build up additional complexity [2]. If tows of
nominally straight and continuous fibres are formed to a simple radius, the fibres on the
inside of the radius are loaded in compression, they then buckle to form a region of
wavy fibres, see fig 3. This is not optional, it does not happen due to poor
manufacturing, it is simply a function of the geometry chosen in the design process. Fig
Pre
pre
g g
sm
Prepreg weight min % resin
Prepreg weight nominal % resin
Prepreg weight max % resin 200
190
210
220
127 132 137 142
Fibre weight gsm
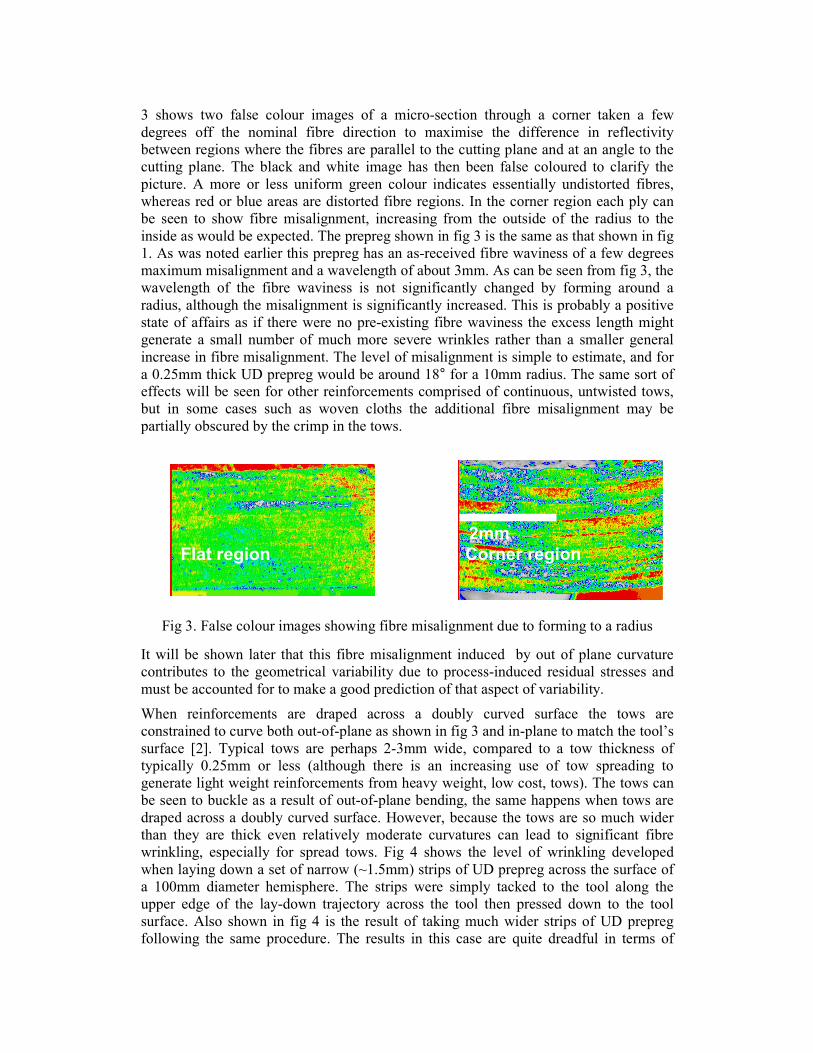
3 shows two false colour images of a micro-section through a corner taken a few
degrees off the nominal fibre direction to maximise the difference in reflectivity
between regions where the fibres are parallel to the cutting plane and at an angle to the
cutting plane. The black and white image has then been false coloured to clarify the
picture. A more or less uniform green colour indicates essentially undistorted fibres,
whereas red or blue areas are distorted fibre regions. In the corner region each ply can
be seen to show fibre misalignment, increasing from the outside of the radius to the
inside as would be expected. The prepreg shown in fig 3 is the same as that shown in fig
1. As was noted earlier this prepreg has an as-received fibre waviness of a few degrees
maximum misalignment and a wavelength of about 3mm. As can be seen from fig 3, the
wavelength of the fibre waviness is not significantly changed by forming around a
radius, although the misalignment is significantly increased. This is probably a positive
state of affairs as if there were no pre-existing fibre waviness the excess length might
generate a small number of much more severe wrinkles rather than a smaller general
increase in fibre misalignment. The level of misalignment is simple to estimate, and for
a 0.25mm thick UD prepreg would be around 18° for a 10mm radius. The same sort of effects will be seen for other reinforcements comprised of continuous, untwisted tows,
but in some cases such as woven cloths the additional fibre misalignment may be
partially obscured by the crimp in the tows.
Fig 3. False colour images showing fibre misalignment due to forming to a radius
It will be shown later that this fibre misalignment induced by out of plane curvature
contributes to the geometrical variability due to process-induced residual stresses and
must be accounted for to make a good prediction of that aspect of variability.
When reinforcements are draped across a doubly curved surface the tows are
constrained to curve both out-of-plane as shown in fig 3 and in-plane to match the tool’s
surface [2]. Typical tows are perhaps 2-3mm wide, compared to a tow thickness of
typically 0.25mm or less (although there is an increasing use of tow spreading to
generate light weight reinforcements from heavy weight, low cost, tows). The tows can
be seen to buckle as a result of out-of-plane bending, the same happens when tows are
draped across a doubly curved surface. However, because the tows are so much wider
than they are thick even relatively moderate curvatures can lead to significant fibre
wrinkling, especially for spread tows. Fig 4 shows the level of wrinkling developed
when laying down a set of narrow (~1.5mm) strips of UD prepreg across the surface of
a 100mm diameter hemisphere. The strips were simply tacked to the tool along the
upper edge of the lay-down trajectory across the tool then pressed down to the tool
surface. Also shown in fig 4 is the result of taking much wider strips of UD prepreg
following the same procedure. The results in this case are quite dreadful in terms of
2mm
Flat region Corner region

localised folds and misalignments. Taking extreme care to achieve the lay-up does give
a somewhat better, although still very poor, result at a huge cost in terms of additional
time. UD prepreg would, of course, not be the reinforcement of choice to drape over
such a small diameter hemisphere, but even for a prepregged woven cloth with narrow
tows the sort of misalignments shown in fig 4 will be present, albeit disguised by the
crimp and less localised as the pre-existing crimp tends to act as a regular set of
initiations points for the wrinkling.
Fig 4. Level of fibre misalignment generated by draping narrow and wide UD prepreg
strips across a 100mm diameter hemisphere.
The inset shows the position of the tows across the surface of the hemisphere
It should be noted that, as before, this wrinkling and fibre misalignment should not be
seen as a defect per se, but as an inevitable result of mapping a continuous and
untwisted tow of non-zero width across a curved surface. The selection of a particular
tow width as part of the design process will have a significant impact on the level of
wrinkling seen, so there will be a direct interaction between the design decisions and
part quality, but this does not necessarily equate to a defect state. There are, of course
many ways to increase the level of wrinkling and misalignment during the lay-up
process which must be considered as defects [2]. It is, however, necessary to distinguish
between misalignment features due to successful drape and misalignment defects due to
a failure to drape effectively. The two misalignments could well be identical in effect,
but as one is essentially a design issue and the other a manufacturing issue they need to
be distinguished from each other.
One last issue with regard to drape of woven reinforcements over a 3D geometry is that
there are essentially an infinite number of ways of draping a woven cloth over any
particular geometry [3]. The output in terms of fibre directions across the tool will
depend on the starting point for drape and the way in which the drape is developed and
controlled across the surface of the tool. To obtain reliable manufacture it is necessary
to stipulate as part of the design process the detailed steps in the procedure which is to
be followed to achieve and control the drape process to avoid the part being
manufactured in a way that does not conform to the design intent. It should also be
noted that most drape software indicates only the final set of fibre orientations and not
the route to achieve those orientations. Fig 5 shows four different drape patterns for a
relatively simple corner geometry. In each case the fibre directions are significantly
different giving different mechanical responses and different sets of geometrical

distortions due to residual stresses. In addition each of the drape patterns shown in fig 5
has a different flat pattern associated with it. These different drape patterns would be
expected to nest differently leading to differences in the amount of waste prepreg being
generated by the kitting process, showing that in composites manufacture all the details
are important [4].
Fig 5. Four different drape patterns for one simple geometry.
VARIABILITY DUE TO CONSOLIDATION & RESIN FLOW
As delivered the reinforcement will be significantly thicker than the cured ply. For
example a UD prepreg that will mould to 65Vf% at 7 bar autoclave pressure might have
a volume fraction as delivered of 50%, so that the ply as delivered could be up to 30%
thicker than the cured ply. It is usual to apply some consolidation pressure during lay-up
which will greatly reduce this bulk factor, but it is by no means uncommon for the lay-
up as a whole to be 10% or more thicker than the cured laminate. If the plys can’t slip
over each other as they consolidate inside radii then bridging will occur and the
laminate will get thicker in the corner. Only a few % of unrelieved consolidation is
needed for the local thickness and fibre volume fraction to go out of tolerance, see fig 6
Fig 6. Impact of bulk factor on cured thickness due to unrelieved bridging
1.4
1.0
0.6
0.2
1 1.05 1.1 1.15 1.2 Bulk Factor
Thickness relative to nominal
Fibre volume fraction. Nominal 60%
+/- 5% thickness tolerance band
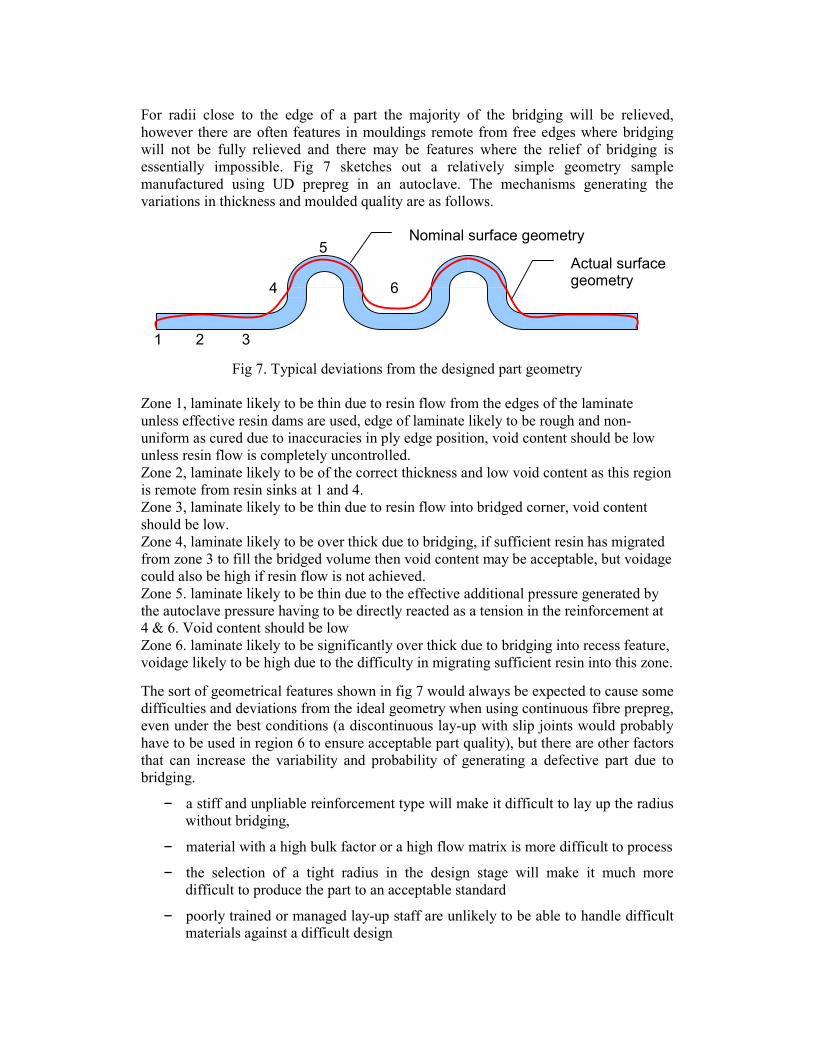
For radii close to the edge of a part the majority of the bridging will be relieved,
however there are often features in mouldings remote from free edges where bridging
will not be fully relieved and there may be features where the relief of bridging is
essentially impossible. Fig 7 sketches out a relatively simple geometry sample
manufactured using UD prepreg in an autoclave. The mechanisms generating the
variations in thickness and moulded quality are as follows.
Fig 7. Typical deviations from the designed part geometry
Zone 1, laminate likely to be thin due to resin flow from the edges of the laminate
unless effective resin dams are used, edge of laminate likely to be rough and non-
uniform as cured due to inaccuracies in ply edge position, void content should be low
unless resin flow is completely uncontrolled.
Zone 2, laminate likely to be of the correct thickness and low void content as this region
is remote from resin sinks at 1 and 4.
Zone 3, laminate likely to be thin due to resin flow into bridged corner, void content
should be low.
Zone 4, laminate likely to be over thick due to bridging, if sufficient resin has migrated
from zone 3 to fill the bridged volume then void content may be acceptable, but voidage
could also be high if resin flow is not achieved.
Zone 5. laminate likely to be thin due to the effective additional pressure generated by
the autoclave pressure having to be directly reacted as a tension in the reinforcement at
4 & 6. Void content should be low
Zone 6. laminate likely to be significantly over thick due to bridging into recess feature,
voidage likely to be high due to the difficulty in migrating sufficient resin into this zone.
The sort of geometrical features shown in fig 7 would always be expected to cause some
difficulties and deviations from the ideal geometry when using continuous fibre prepreg,
even under the best conditions (a discontinuous lay-up with slip joints would probably
have to be used in region 6 to ensure acceptable part quality), but there are other factors
that can increase the variability and probability of generating a defective part due to
bridging.
– a stiff and unpliable reinforcement type will make it difficult to lay up the radius without bridging,
– material with a high bulk factor or a high flow matrix is more difficult to process
– the selection of a tight radius in the design stage will make it much more difficult to produce the part to an acceptable standard
– poorly trained or managed lay-up staff are unlikely to be able to handle difficult materials against a difficult design
5
4 6 1 2 3
Actual surface geometry
Nominal surface geometry

– even the coefficient of friction between the tool and the reinforcement can have a significant effect on quality outcomes. Fig 8 shows a region of very significant
fibre misalignment in the outside corner region of a laminate made from a cloth
reinforcement woven from commingled glass/polyester yarns. The red colour is
from a dye penetrant used to enhance the contrast and the green line follows the
trajectory of a single tow to clarify the level of misalignment. This defect was
generated as a direct result of a low coefficient of friction, resulting in
movement between tool and reinforcement during consolidation.
Fig 8. Misalignment defects generated during consolidation.
As before, the majority of the factors noted above are linked to materials and geometry
selection during the design process rather than being under the direct control of the
manufacturing activity.
For parts to be made by fully tooled processes such as RTM the situation is rather
different in that the tooling will control the dimensions and bridging is therefore
eliminated. However, this does not indicate that potential problems associated with
consolidation are completely eliminated. When the preform is clamped into the tool,
movements of the preform can lead to the generation of localised resin rich zones at the
tool surface, fig 9 shows such a resin rich zone (highlighted in blue) on the surface of a
production component. Samples were cut from a component showing this defect and
from another component without any resin richness and tested in flexure. The samples
with the resin rich zones exhibited a drop of more than 25% in flexural strength, lab
manufactured samples with artificially induced resin rich zones show similar strength
reductions [5]. It should be noted that it is not the resin richness as such that leads to the
strength reduction but the out of plane misalignment associated with the resin rich
zones.
Fig 9. Resin rich zones and out of plane misalignment in an RTM component.
VARIABILITY DUE TO RESIDUAL STRESSES / THERMAL DISTORTION
All composite components have internal residual stresses on a number of scales due to
thermal excursions and stresses associated with the cure processes. At the finest level
the fibres and matrix have different thermal properties and there will be a balanced set
of stresses in the fibre and the matrix. These stresses are at too fine a scale for them to
lead to significant distortions. At the lamina scale the differences in expansion
coefficient parallel and perpendicular to the fibre will lead to stresses between different
plies with different alignments. At the laminate scale there may be differences in
stresses through the thickness. At the component scale there may be additional stresses
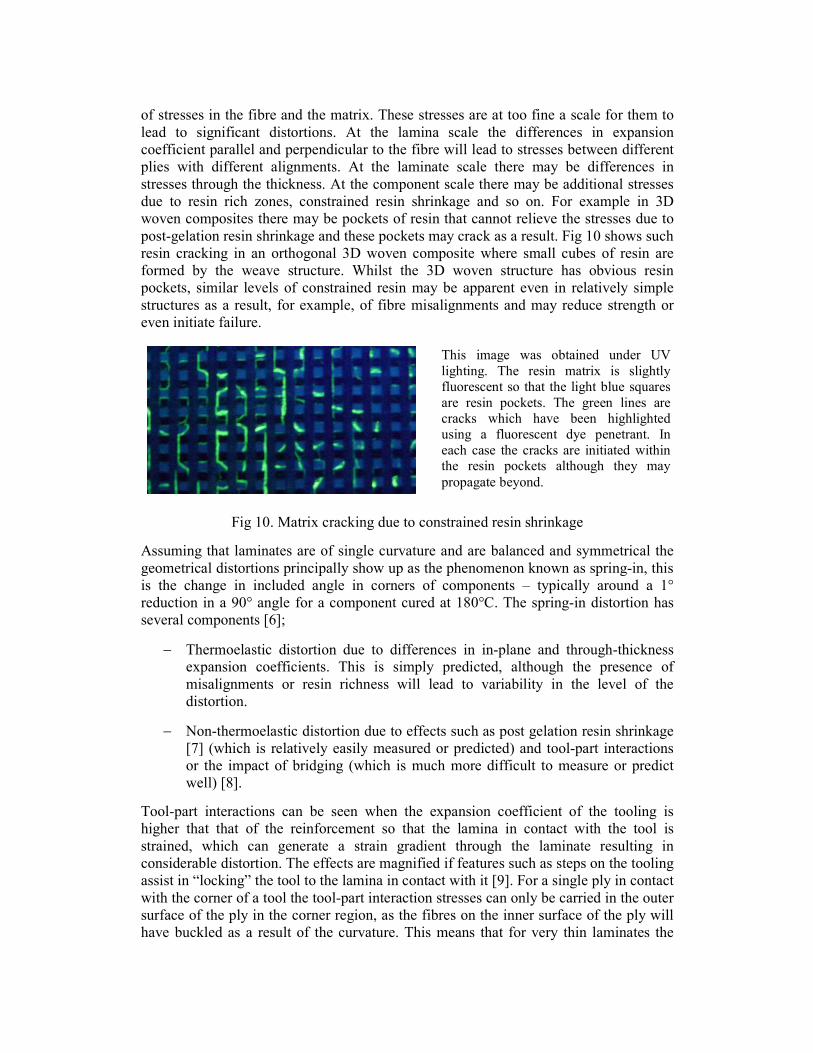
due to resin rich zones, constrained resin shrinkage and so on. For example in 3D
woven composites there may be pockets of resin that cannot relieve the stresses due to
post-gelation resin shrinkage and these pockets may crack as a result. Fig 10 shows such
resin cracking in an orthogonal 3D woven composite where small cubes of resin are
formed by the weave structure. Whilst the 3D woven structure has obvious resin
pockets, similar levels of constrained resin may be apparent even in relatively simple
structures as a result, for example, of fibre misalignments and may reduce strength or
even initiate failure.
Fig 10. Matrix cracking due to constrained resin shrinkage
Assuming that laminates are of single curvature and are balanced and symmetrical the
geometrical distortions principally show up as the phenomenon known as spring-in, this
is the change in included angle in corners of components – typically around a 1°
reduction in a 90° angle for a component cured at 180°C. The spring-in distortion has
several components [6];
− Thermoelastic distortion due to differences in in-plane and through-thickness
expansion coefficients. This is simply predicted, although the presence of
misalignments or resin richness will lead to variability in the level of the
distortion.
− Non-thermoelastic distortion due to effects such as post gelation resin shrinkage
[7] (which is relatively easily measured or predicted) and tool-part interactions
or the impact of bridging (which is much more difficult to measure or predict
well) [8].
Tool-part interactions can be seen when the expansion coefficient of the tooling is
higher that that of the reinforcement so that the lamina in contact with the tool is
strained, which can generate a strain gradient through the laminate resulting in
considerable distortion. The effects are magnified if features such as steps on the tooling
assist in “locking” the tool to the lamina in contact with it [9]. For a single ply in contact
with the corner of a tool the tool-part interaction stresses can only be carried in the outer
surface of the ply in the corner region, as the fibres on the inner surface of the ply will
have buckled as a result of the curvature. This means that for very thin laminates the
This image was obtained under UV
lighting. The resin matrix is slightly
fluorescent so that the light blue squares
are resin pockets. The green lines are
cracks which have been highlighted
using a fluorescent dye penetrant. In
each case the cracks are initiated within the resin pockets although they may
propagate beyond.
principal distortion may be driven by the stress gradient within the ply, resulting in
significant spring-out rather than a small spring-in. This effect “washes out” quite
quickly as laminates get thicker, but does contribute to the overall variability
experienced in dimensional fidelity. For the sort of simple unidirectional geometry
shown in fig 7 it might be expected that the spring-in distortion in each corner would
cancel out, leaving the part essentially flat, albeit with each corner at a slightly smaller
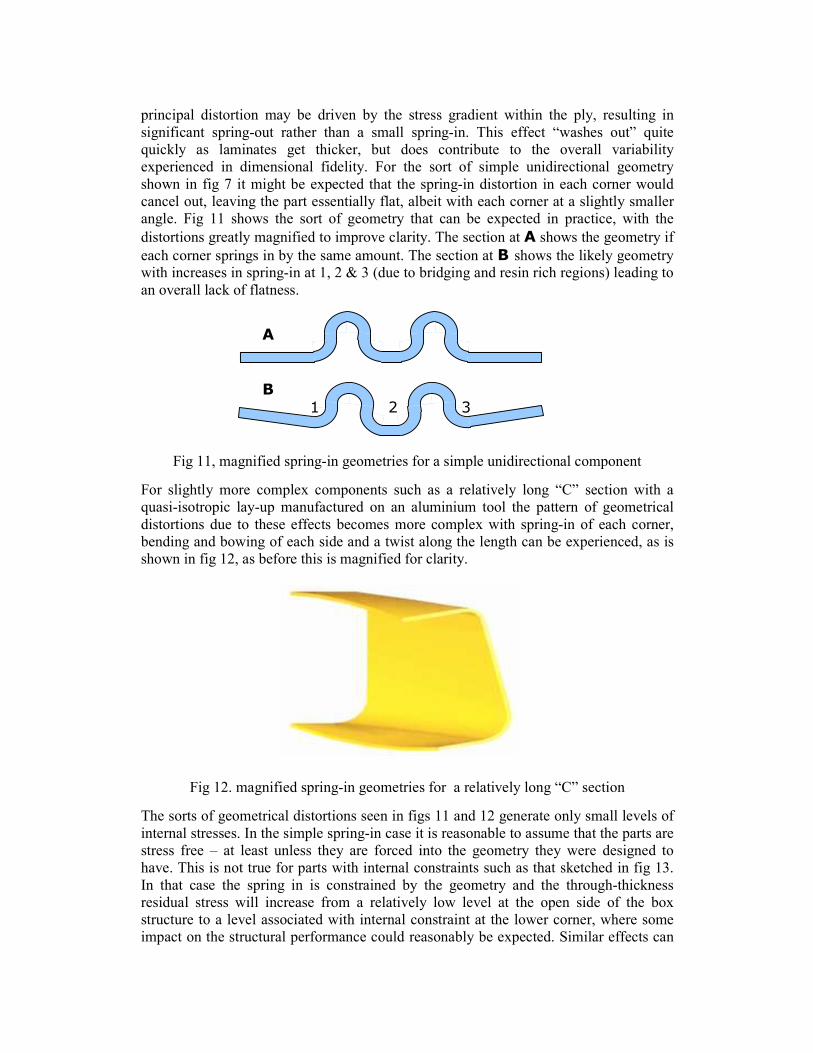
angle. Fig 11 shows the sort of geometry that can be expected in practice, with the
distortions greatly magnified to improve clarity. The section at A shows the geometry if
each corner springs in by the same amount. The section at B shows the likely geometry with increases in spring-in at 1, 2 & 3 (due to bridging and resin rich regions) leading to
an overall lack of flatness.
Fig 11, magnified spring-in geometries for a simple unidirectional component
For slightly more complex components such as a relatively long “C” section with a
quasi-isotropic lay-up manufactured on an aluminium tool the pattern of geometrical
distortions due to these effects becomes more complex with spring-in of each corner,
bending and bowing of each side and a twist along the length can be experienced, as is
shown in fig 12, as before this is magnified for clarity.
Fig 12. magnified spring-in geometries for a relatively long “C” section
The sorts of geometrical distortions seen in figs 11 and 12 generate only small levels of
internal stresses. In the simple spring-in case it is reasonable to assume that the parts are
stress free – at least unless they are forced into the geometry they were designed to
have. This is not true for parts with internal constraints such as that sketched in fig 13.
In that case the spring in is constrained by the geometry and the through-thickness
residual stress will increase from a relatively low level at the open side of the box
structure to a level associated with internal constraint at the lower corner, where some
impact on the structural performance could reasonably be expected. Similar effects can
A
B 1 2 3
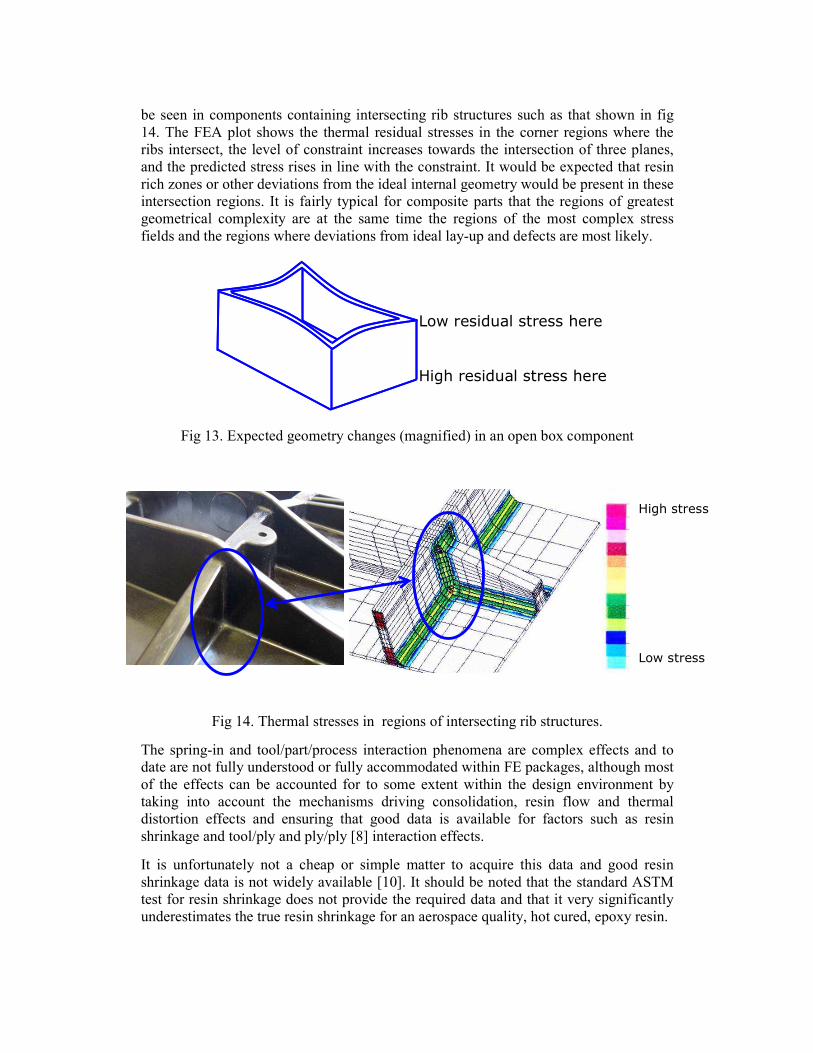
be seen in components containing intersecting rib structures such as that shown in fig
14. The FEA plot shows the thermal residual stresses in the corner regions where the
ribs intersect, the level of constraint increases towards the intersection of three planes,
and the predicted stress rises in line with the constraint. It would be expected that resin
rich zones or other deviations from the ideal internal geometry would be present in these
intersection regions. It is fairly typical for composite parts that the regions of greatest
geometrical complexity are at the same time the regions of the most complex stress
fields and the regions where deviations from ideal lay-up and defects are most likely.
Fig 13. Expected geometry changes (magnified) in an open box component
Fig 14. Thermal stresses in regions of intersecting rib structures.
The spring-in and tool/part/process interaction phenomena are complex effects and to
date are not fully understood or fully accommodated within FE packages, although most
of the effects can be accounted for to some extent within the design environment by
taking into account the mechanisms driving consolidation, resin flow and thermal
distortion effects and ensuring that good data is available for factors such as resin
shrinkage and tool/ply and ply/ply [8] interaction effects.
It is unfortunately not a cheap or simple matter to acquire this data and good resin
shrinkage data is not widely available [10]. It should be noted that the standard ASTM
test for resin shrinkage does not provide the required data and that it very significantly
underestimates the true resin shrinkage for an aerospace quality, hot cured, epoxy resin.
Low residual stress here
High residual stress here
High stress
Low stress

COLLECTED SOURCES OF VARIABILITY
Some of the major factors relating to variability have been noted above, these are not
the only sources of variability and a much larger number of potential sources of
variability can be identified. An attempt has been made below to list many of the more
important factors and a list of more than 60 such factors is given below for autoclave
moulding and RTM processes. It is by no means obvious that all the potential sources or
variability have been captured here, especially for other processes, where the
identification of sources of variability has not been attempted here. The sources of
variability have been broken down into materials, processing and post-moulding
processes
Variability in materials - includes
o Mass/unit area reinforcement – global and local o Degree of consolidation in as-purchased reinforcement o Consolidation response to applied pressure o Trapped air in prepreg o Surface porosity prepreg o Surface smoothness prepreg o Level of tack in prepreg o Binder concentration for RI processes – global and local o Permeability of reinforcement o Wettability of reinforcement o Quality of fibre alignment – global and local o Response to forming loads o Locking angle for cloth drape o Shear limit for UD and NCF drape o Ease of wrinkle formation both in-plane and out of plane o Resin content o Resin viscosity and temperature/cure effects on viscosity o Variability of resin composition o Variability in cure kinetics o Degree of cure in resin o Shelf life of resin and storage history o Honeycomb thickness o Honeycomb condition & cleanliness o Honeycomb resistance to crushing o Foam, resistance to crushing o Foam, level of open porosity
Variability in moulding processes - includes:
o Order of lay-up o Operator and supervision skills o Lay-up aids and tools provided o Tooling preparation quality o Mould release issues

o Changes in tooling type o Temperature variations using hot air blowers or hot drape formers for prepreg or
bound reinforcement for RI processes
o Type of bagging materials o Bagging methodologies used o Vacuum level in bag o Mould closure issues in RTM processes o Resin injection pressure in RI processes o Resin injection temperature in RI processes o Resin injection vacuum level in RI processes o Cure cycle variations in temperature and pressure o Temperature variations across part o Bulk resin flows o Local resin flows o Interactions between tooling and reinforcement due to CTE differences o Action of applied pressure on bridged layup o Temperature at demould o Demoulding procedures and forces
Variability in post-moulding processes - includes:
o De-flashing process o Operator, inspector and supervision skills o Uncertainty of datum o Edge trimming processes o Transport/carriage methods o Jigging for CMM and other post-moulding processes o Machining and hole drilling processes o Difficulties in interpreting NDT results o Surface prep for bonding o Adhesive mixing and application for bonding o Cure cycling for bonding o Preparation for painting/finishing o Application of paint/finishing coats o Mechanical assembly processes
DEFECT TAXONOMY
It is really very difficult to state exactly at what point a feature of a moulding or a
variability due to one of the many factors noted above becomes a defect. The simple
answer is when it results in a part being out of geometrical tolerance, having a reduced
structural performance or in some other way failing to meet the design specifications
and acceptance criteria. The difficulty here is principally in that if the design has been
carried out without an understanding of variability and similar issues it may simply not
be possible to produce a part that meets the design intent – put simply the biggest source
of variability and one not considered here at all may actually be the design practices
used to arrive at the design.
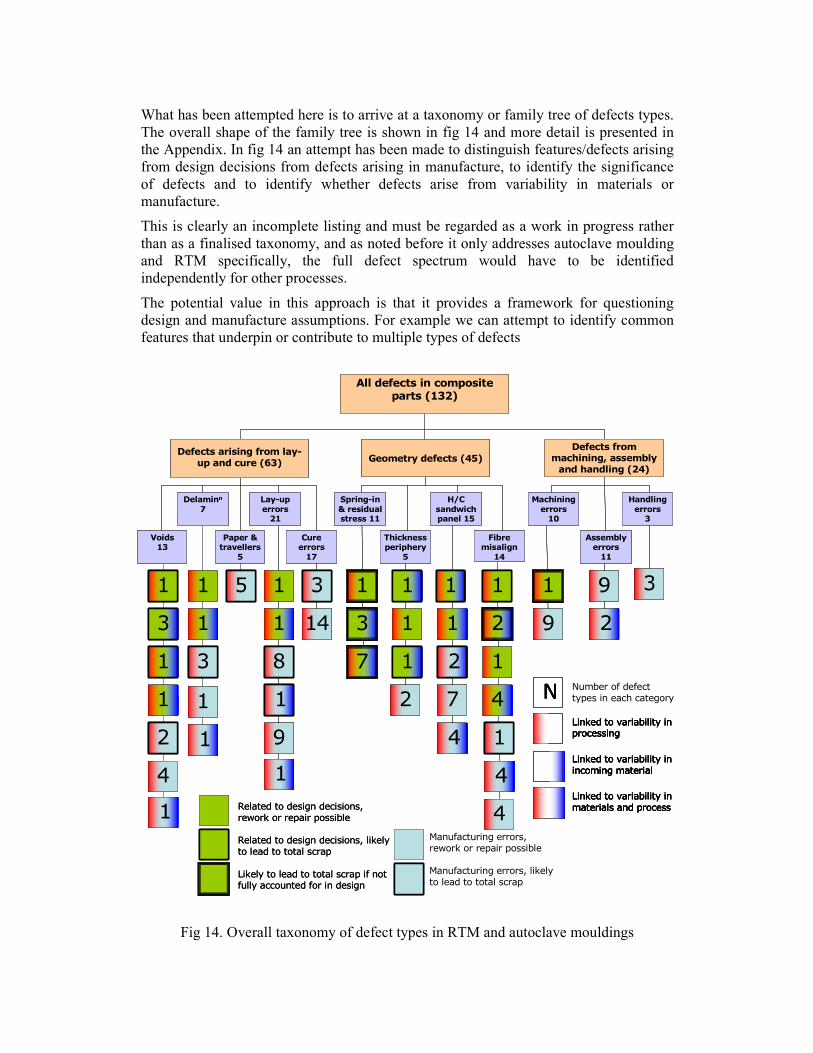
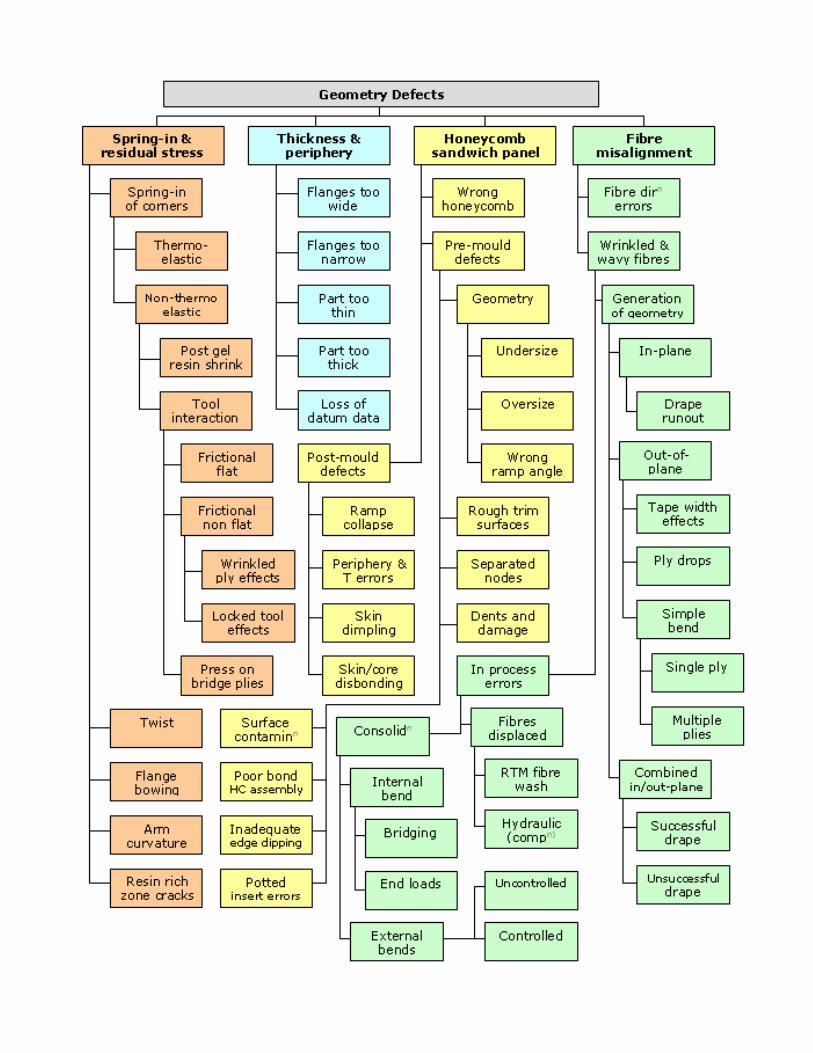
What has been attempted here is to arrive at a taxonomy or family tree of defects types.
The overall shape of the family tree is shown in fig 14 and more detail is presented in
the Appendix. In fig 14 an attempt has been made to distinguish features/defects arising
from design decisions from defects arising in manufacture, to identify the significance
of defects and to identify whether defects arise from variability in materials or
manufacture.
This is clearly an incomplete listing and must be regarded as a work in progress rather
than as a finalised taxonomy, and as noted before it only addresses autoclave moulding
and RTM specifically, the full defect spectrum would have to be identified
independently for other processes.
The potential value in this approach is that it provides a framework for questioning
design and manufacture assumptions. For example we can attempt to identify common
features that underpin or contribute to multiple types of defects
Fig 14. Overall taxonomy of defect types in RTM and autoclave mouldings
Manufacturing errors, rework or repair possible
Manufacturing errors, likely to lead to total scrap
Related to design decisions, rework or repair possible
Related to design decisions, likely to lead to total scrap
Likely to lead to total scrap if not fully accounted for in design
All defects in composite parts (132)
Geometry defects (45)
Defects from machining, assembly and handling (24)
Defects arising from lay-up and cure (63)
Machining errors10
Assembly errors
11
Handling errors
3
Lay-up errors
21
Paper & travellers
5
Delaminn
7
Voids13
Cure errors17
Spring-in & residual stress 11
Thickness periphery
5
H/C sandwich panel 15
Fibre misalign
14
1 1
1
4
1
11
3 3
2
1
1
1
1
7
1
1
1
1
1
2
1
4
1
3
1
1
5
8
1
9
1
3
14
2 7
4
39
9
1
2
4
4
2
Number of defect types in each category
Linked to variability in processing
Linked to variability in incoming material
Linked to variability in materials and process
N
Manufacturing errors, rework or repair possible
Manufacturing errors, likely to lead to total scrap
Related to design decisions, rework or repair possible
Related to design decisions, likely to lead to total scrap
Likely to lead to total scrap if not fully accounted for in design
All defects in composite parts (132)
Geometry defects (45)
Defects from machining, assembly and handling (24)
Defects arising from lay-up and cure (63)
Machining errors10
Assembly errors
11
Handling errors
3
Lay-up errors
21
Paper & travellers
5
Delaminn
7
Voids13
Cure errors17
Spring-in & residual stress 11
Thickness periphery
5
H/C sandwich panel 15
Fibre misalign
14
11 11
11
44
11
1111
33 33
22
11
11
11
11
77
11
11
11
11
11
22
11
44
11
33
11
11
55
88
11
99
11
33
1414
22 77
44
3399
99
11
22
44
44
22
Number of defect types in each category
Linked to variability in processing
Linked to variability in incoming material
Linked to variability in materials and process
N Number of defect types in each category
Linked to variability in processing
Linked to variability in incoming material
Linked to variability in materials and process
N Number of defect types in each category
Linked to variability in processing
Linked to variability in incoming material
Linked to variability in materials and process
N
The greatest concentration of complex defect types is in the area of geometry defects of
three principal types
o Spring in, dimensional variability and residual stresses - due in part to tool/part interaction
o Thickness defects such as corner bridging o Fibre wrinkling and misalignment due to bend radii and mapping to a doubly
curved surface
For each of the principal types of geometry defect the fundamental cause of the defects
can be seen to be the response of continuous reinforcements to applied loads
o Tool expansion puts tensile stresses into the ply in contact with the tool o A bridged, or simply consolidating, ply in a radius picks up tensile stresses from
the consolidation pressure
o A tow being taken across a doubly curved surface has a compressive stress imposed on parts of it and wrinkles to relieve the stress
The use of an extensible reinforcement that could accommodate strains without any
significant stress would contribute greatly to the elimination of these defect types.
o <0.5% extensibility could eliminate tool expansion stresses o a few % extensibility might allow bridging effects to be eliminated o >10% extensibility might be needed to completely eliminate fibre wrinkling on
doubly curved surfaces
The requirement to use continuous fibres to maximise performance has been an
accepted requirement of advanced composites since the introduction of continuous
carbon fibre – indeed it is generally used as part of the definition of advanced
composites. However, the conditions under which real, complex geometry parts are
made and used are very different from those relating to flat laminates. Some difficult to
eliminate defect generation processes are clearly and directly related to the use of
continuous and inextensible reinforcements. It should perhaps also be noted that both
RTM and Autoclave moulding processes were initially developed in the 1950s to mould
more or less complex parts from mats of short asbestos fibres using a phenolic resin
matrix. There is therefore no fundamental reason to expect them to be ideally placed to
mould defect-free parts from the continuous fibre reinforcements that were first
developed a decade or more later.
CONCLUSIONS
It is very easy to assume that any unwanted features or defects in mouldings must be the
result of manufacturing processes that are poorly controlled, and with the very common
use of largely manual processes this assumption does appear at first glance to be very
reasonable. However, an attempt to generate a more rigorous approach to the
identification of sources of variability and the defects that can arise from them shows
that the real situation is much more complex with a great deal of interaction between
part design and process design decisions and the variabilities in materials and processes.
Unless these variabilities are understood and properly accommodated in design and
development the probability of generating poor quality and costly parts is unacceptably
high. The use of a taxonomic approach offers a framework within which this
understanding can be developed and through which common features underlying
multiple defect types can be identified, so that rational decisions may be taken about
potential routes to develop zero defect design, materials and manufacturing processes.
REFERENCES
1. Potter, KD, Langer, CM, Hodgkiss, B & Lamb, S. 'Sources of variability in uncured
aerospace grade unidirectional carbon fibre epoxy preimpregnate', Composites; Part A,
38(3), (pp. 905-916), 2007.
2. Potter, KD, Khan, B, Wisnom, MR, Bell, T & Stevens, J. 'Variability, fibre waviness
and misalignment in the determination of the properties of composite materials and
structures', Composites: Part A, 39 (9), (pp. 1343-1354), 2008.
3. Hancock, SG & Potter, KD. 'The use of kinematic drape modelling to inform the
hand lay-up of complex composite components using woven reinforcements',
Composites Part A: Applied Science and Manufacturing, 37 (3), (pp. 413-422), 2006
4. Ward, C. Potter, K. Understanding composites design and manufacturing for
minimization of scrap generation: the first steps to efficient material use. SAMPE
SEICO 08, Paris. April 2008.
5. Khan, B, Potter, KD & Wisnom, MR. 'Simulation of process induced defects in resin
transfer moulded woven carbon fibre laminates and their effect on mechanical
behaviour', 8th International Conference on Flow Processes in Composite Materials,
Douai, France, (pp. -), 2006.
6. Wisnom, MR, Gigliotti, M, Ersoy, NB, Campbell, MA & Potter, KD. 'Mechanisms
generating residual stresses and distortion during manufacture of polymer-matrix
composite structures', Composites Part A: Applied Science and Manufacturing, 37 (4),
(pp. 522-529), 2006
7. Garstka, T. Ersoy, N. Potter, K.D. Wisnom, M.R.. In situ measurements of through-
the-thickness strains during processing of AS4/8552 composite. Composites Part A:
Applied Science and Manufacturing, Volume 38, Issue 12, December 2007, Pages
2517-2526
8. Ersoy, NB, Potter, KD, Wisnom, MR & Clegg, MJ. 'An experimental method to
study the frictional processes during composites manufacturing', Composites Part A:
Applied Science and Manufacturing, 36, (pp. 1536-1544), 2005
9. Potter, KD, Campbell, MA, Langer, CM & Wisnom, MR. 'The generation of
geometrical deformations due to tool/part interaction in the manufacture of composite
components', Composites Part A: Applied Science and Manufacturing, 36 (2), (pp. 301-
308), 2005
10. Li, CL, Potter, KD, Wisnom, MR & Stringer, G. 'In-situ measurement of chemical
shrinkage of MY750 epoxy resin by a novel gravimetric method', Composites Science
and Technology, 64 (1), (pp. 55-64), 2004

APPENDIX, MORE DETAILED DEFECT TAXONOMY