understanding variation in partition coefficient, … · i understanding the variation in partition...
TRANSCRIPT
United States Office of Air and Radiation EPA 402-R-04-002CEnvironmental Protection Agency July 2004
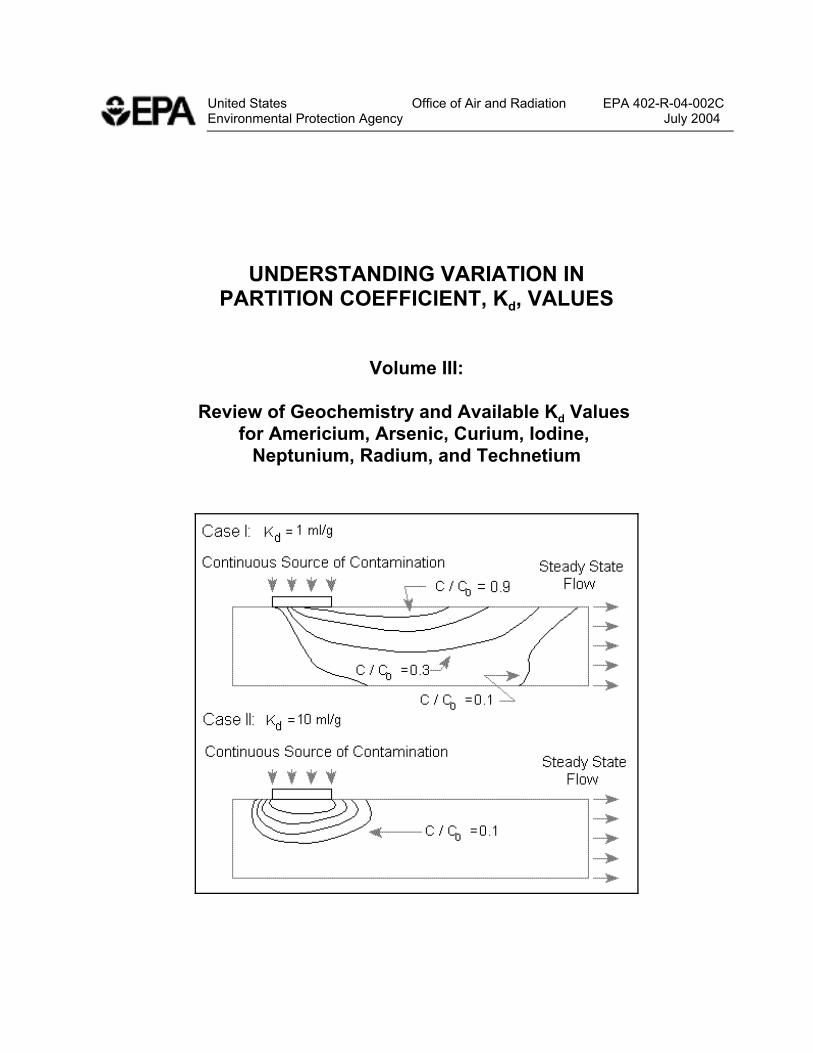
UNDERSTANDING VARIATION INPARTITION COEFFICIENT, Kd, VALUES
Volume III:
Review of Geochemistry and Available Kd Values for Americium, Arsenic, Curium, Iodine,
Neptunium, Radium, and Technetium
i
UNDERSTANDING THE VARIATION INPARTITION COEFFICIENT, Kd, VALUES
Volume III:
Review of Geochemistry and Available Kd Values for Americium, Arsenic, Curium, Iodine,
Neptunium, Radium, and Technetium
July 2004
Interagency Agreement No. DW89937220-01-7
Project OfficerRonald G. Wilhelm
Office of Radiation and Indoor AirU.S. Environmental Protection Agency
Washington, D.C. 20460

ii
NOTICE
The following report is intended solely as guidance to EPA and other environmental professionals.This document does not constitute rulemaking by the Agency, and cannot be relied on to create asubstantive or procedural right enforceable by any party in litigation with the United States. EPA maytake action that is at variance with the information, policies, and procedures in this document and maychange them at any time without public notice.
Reference herein to any specific commercial products, process, or service by trade name, trademark,manufacturer, or otherwise, does not necessarily constitute or imply its endorsement, recommendation,or favoring by the United States Government.

iii
FOREWORD
Understanding the long-term behavior of contaminants in the subsurface is becoming increasinglyimportant as the nation addresses groundwater contamination. Groundwater contamination is anational concern as about 50 percent of the United States population receives its drinking water fromgroundwater. It is the goal of the Environmental Protection Agency (EPA) to prevent adverse effectsto human health and the environment and to protect the environmental integrity of the nation’sgroundwater.
Once groundwater is contaminated, it is important to understand how the contaminant moves inthe subsurface environment. Proper understanding of the contaminant fate and transport is necessaryin order to characterize the risks associated with the contamination and to develop, when necessary,emergency or remedial action plans. The parameter known as the partition (or distribution) coefficient(Kd) is one of the most important parameters used in estimating the migration potential ofcontaminants present in aqueous solutions in contact with surface, subsurface and suspended solids.
This is the third volume in the series that describes: (1) the conceptualization, measurement, anduse of the partition coefficient parameter; and (2) the geochemical aqueous solution and sorbentproperties that are most important in controlling adsorption/retardation behavior of selectedcontaminants. Volumes I and II were published in 1999. Volume I of this document focuses onproviding EPA and other environmental remediation professionals with a reasoned and documenteddiscussion of the major issues related to the selection and measurement of the partition coefficient for aselect group of contaminants. The selected contaminants investigated in Volume II of this documentinclude: chromium, cadmium, cesium, lead, plutonium, radon, strontium, thorium, tritium (3H), anduranium. The contaminants discussed in Volume III include: americium, arsenic, curium, iodine,neptunium, radium, and technetium. This three-volume report also addresses a void that has existed onthis subject in both this Agency and in the user community.
It is important to note that soil scientists and geochemists knowledgeable of sorption processes innatural environments have long known that generic or default partition coefficient values found in theliterature can result in significant errors when used to predict the impacts of contaminant migration orsite-remediation options. Accordingly, one of the major recommendations of this report is that forsite-specific calculations, partition coefficient values measured at site-specific conditions are absolutelyessential.
For those cases when the partition coefficient parameter is not or cannot be measured, Volumes IIand III of this document: (1) provide a “thumb-nail sketch” of the key geochemical processes affectingthe sorption of the selected contaminants; (2) provide references to related key experimental and reviewarticles for further reading; (3) identify the important aqueous- and solid-phase parameters controllingthe sorption of these contaminants in the subsurface environment under oxidizing conditions; and (4)identify, when possible, minimum and maximum conservative partition coefficient values for eachcontaminant as a function of the key geochemical processes affecting their sorption.
iv
In addition, this publication is produced as part of ORIA’s long-term strategic plan to assist in theremediation of contaminated sites. It is published and made available to assist all environmentalremediation professionals in the cleanup of groundwater sources all over the United States.
Elizabeth A. Cotsworth, DirectorOffice of Radiation and Indoor Air
v
ACKNOWLEDGMENTS
Ronald G. Wilhelm from ORIA’s Center for Radiation Site Cleanup was the project lead and EPAProject Officer for this three-volume report. Project support was provided by EPA’s Office ofSuperfund Remediation and Technology Innovation (OSRTI).
EPA/ORIA wishes to thank the following people for their assistance and technical reviewcomments on various drafts of this report:
Paul M. Bertsch, Savannah River Ecology LaboratoryPatrick V. Brady, U.S. DOE, Sandia National LaboratoriesDaniel I. Kaplan, Westinghouse Savannah River CompanyDavid M. Kargbo, Temple UniversityIrma McKnight, U.S. EPA, Office of Radiation and Indoor AirAndrew Sowder, Savannah River Ecology Laboratory
In addition, a special thanks goes to Lindsey Bender from ORIA’s Radiation Protection Division,for her contributions in the production of this document.
Principal authorship of this guide was provided by the Department of Energy’s Pacific NorthwestNational Laboratory (PNNL) under the Interagency Agreement Number DW89937220-01-07. Lynnette Downing served as the Department of Energy’s Project Officer for this InteragencyAgreement. PNNL authors involved in preparation of Volume III include:
Kenneth M. KrupkaR. Jeffrey Serne
vi
TO COMMENT ON THIS GUIDE OR PROVIDE INFORMATION FOR FUTURE UPDATES
Send all comments/updates to:
U.S. Environmental Protection AgencyOffice of Radiation and Indoor AirAttention: Understanding Variation in Partition (Kd ) Values1200 Pennsylvania Avenue, N.W. (6608J)Washington, D.C. 20460-2001
or
1 Both volumes (EPA, 1999b,1999c) can be downloaded and printed over the Internet at: http://www.epa.gov/radiation/cleanup/partition.htm This is found in the EPA Radiation, Information,Radiation Publications, Topical Publications, Protecting People and the Environment, Fate & Transportsections of the web site.
vii
ABSTRACT
This three-volume report describes the conceptualization, measurement, and use of the partition(or distribution) coefficient, Kd, parameter, and the geochemical aqueous solution and sorbentproperties that are most important in controlling adsorption/retardation behavior of selectedcontaminants. The report is provided for technical staff from EPA and other organizations who areresponsible for prioritizing site remediation and waste management decisions. Volumes I and II werepublished by the EPA in 1999.1 Volume I focuses on the Kd concept and methods for measurement ofKd values. Particular attention is directed at providing an understanding of: (1) the use of Kd values informulating retardation factor (Rf ), (2) the difference between the original thermodynamic Kdparameter derived from ion-exchange literature and its “empiricized” use in contaminant transportcodes, and (3) the explicit and implicit assumptions underlying the use of the Kd parameter incontaminant transport codes. A conceptual overview of chemical reaction models and their use inaddressing technical defensibility issues associated with data from Kd studies is also presented. Volumes II and III provide “thumb-nail sketches” of the important aqueous speciation,coprecipitation/dissolution, and adsorption processes affecting the sorption of selected inorganiccontaminants under oxidizing conditions. The Kd values listed in the literature for these contaminantsare also summarized. The contaminants discussed in Volume II include chromium, cadmium, cesium,lead, plutonium, radon, strontium, thorium, tritium (3H), and uranium. Volume III, which is anextension of Volume II, includes reviews of the sorption of americium, arsenic, curium, iodine,neptunium, radium, and technetium. However, due to the limited number of Kd adsorption studies forthese contaminates and the large uncertainty, conservative minimum and maximums were not included. References to related key experimental and review articles are included for possible further reading.

CONTENTS
Page
NOTICE . . . . . . . . . . . . . . . . . . . . . . . . . . . . . . . . . . . . . . . . . . . . . . . . . . . . . . . . . . . . . . iiFOREWORD . . . . . . . . . . . . . . . . . . . . . . . . . . . . . . . . . . . . . . . . . . . . . . . . . . . . . . . . . . iiiACKNOWLEDGMENTS . . . . . . . . . . . . . . . . . . . . . . . . . . . . . . . . . . . . . . . . . . . . . . . . . . vFUTURE UPDATES . . . . . . . . . . . . . . . . . . . . . . . . . . . . . . . . . . . . . . . . . . . . . . . . . . . . . viABSTRACT . . . . . . . . . . . . . . . . . . . . . . . . . . . . . . . . . . . . . . . . . . . . . . . . . . . . . . . . . . . viiLIST OF FIGURES . . . . . . . . . . . . . . . . . . . . . . . . . . . . . . . . . . . . . . . . . . . . . . . . . . . . . xiiLIST OF TABLES . . . . . . . . . . . . . . . . . . . . . . . . . . . . . . . . . . . . . . . . . . . . . . . . . . . . . . xiii
1.0 Introduction . . . . . . . . . . . . . . . . . . . . . . . . . . . . . . . . . . . . . . . . . . . . . . . . . . . . . . . 1.1
2.0 The Kd Model . . . . . . . . . . . . . . . . . . . . . . . . . . . . . . . . . . . . . . . . . . . . . . . . . . . . . . 2.1
3.0 Methods, Issues, and Criteria for Measuring Kd Values . . . . . . . . . . . . . . . . . . . . . . 3.1
3.1 Laboratory Batch Methods . . . . . . . . . . . . . . . . . . . . . . . . . . . . . . . . . . . . . . . . . 3.13.2 Laboratory Flow-Through Method . . . . . . . . . . . . . . . . . . . . . . . . . . . . . . . . . . . 3.23.3 Other Methods . . . . . . . . . . . . . . . . . . . . . . . . . . . . . . . . . . . . . . . . . . . . . . . . . . 3.23.4 Issues . . . . . . . . . . . . . . . . . . . . . . . . . . . . . . . . . . . . . . . . . . . . . . . . . . . . . . . . . 3.3
4.0 Application of Chemical Reaction Models . . . . . . . . . . . . . . . . . . . . . . . . . . . . . . . . 4.1
5.0 Contaminant Geochemistry and Kd Values . . . . . . . . . . . . . . . . . . . . . . . . . . . . . . . 5.1
5.1 General . . . . . . . . . . . . . . . . . . . . . . . . . . . . . . . . . . . . . . . . . . . . . . . . . . . . . . . 5.1
5.2 Americium Geochemistry and Kd Values . . . . . . . . . . . . . . . . . . . . . . . . . . . . . . 5.35.2.1 Overview: Important Aqueous- and Solid-Phase Parameters
Controlling Retardation . . . . . . . . . . . . . . . . . . . . . . . . . . . . . . . . . . . . . . . . . . . 5.35.2.2 General Geochemistry . . . . . . . . . . . . . . . . . . . . . . . . . . . . . . . . . . . . . . . . 5.45.2.3 Aqueous Speciation . . . . . . . . . . . . . . . . . . . . . . . . . . . . . . . . . . . . . . . . . . 5.45.2.4 Dissolution/Precipitation/Coprecipitation . . . . . . . . . . . . . . . . . . . . . . . . . . 5.55.2.5 Adsorption/Desorption . . . . . . . . . . . . . . . . . . . . . . . . . . . . . . . . . . . . . . . . . 5.5
5.2.5.1 Guidance for Screening Calculations of Adsorption . . . . . . . . . . . . . . . 5.55.2.5.2 General Adsorption Studies . . . . . . . . . . . . . . . . . . . . . . . . . . . . . . . . . 5.75.2.5.3 Kd Studies for Americium on Soil Materials . . . . . . . . . . . . . . . . . . . . . 5.85.2.5.4 Published Compilations Containing Kd Values for Americium . . . . . . 5.105.2.5.5 Kd Studies of Americium on Pure Mineral, Oxide, and
Crushed Rock Materials . . . . . . . . . . . . . . . . . . . . . . . . . . . . . . . . . . . . . . . 5.14
5.3 Arsenic Geochemistry and Kd Values . . . . . . . . . . . . . . . . . . . . . . . . . . . . . . . . 5.145.3.1 Overview: Important Aqueous- and Solid-Phase Parameters
Controlling Retardation . . . . . . . . . . . . . . . . . . . . . . . . . . . . . . . . . . . . . . . . . . 5.145.3.2 General Geochemistry . . . . . . . . . . . . . . . . . . . . . . . . . . . . . . . . . . . . . . . 5.14
ix
5.3.3 Aqueous Speciation . . . . . . . . . . . . . . . . . . . . . . . . . . . . . . . . . . . . . . . . . 5.175.3.4 Dissolution/Precipitation/Coprecipitation . . . . . . . . . . . . . . . . . . . . . . . . . 5.185.3.5 Adsorption/Desorption . . . . . . . . . . . . . . . . . . . . . . . . . . . . . . . . . . . . . . . . 5.18
5.3.5.1 Guidance for Screening Calculations of Adsorption . . . . . . . . . . . . . . 5.185.3.5.2 General Adsorption Studies . . . . . . . . . . . . . . . . . . . . . . . . . . . . . . . . 5.195.3.5.3 Kd Studies for Arsenic on Soil Materials . . . . . . . . . . . . . . . . . . . . . . . 5.215.3.5.4 Published Compilations Containing Kd Values for Arsenic . . . . . . . . . 5.225.3.5.5 Kd Studies of Arsenic on Pure Mineral, Oxide, and
Crushed Rock Materials . . . . . . . . . . . . . . . . . . . . . . . . . . . . . . . . . . . . . . . 5.23
5.4 Curium Geochemistry and Kd Values . . . . . . . . . . . . . . . . . . . . . . . . . . . . . . . . 5.245.4.1 Overview: Important Aqueous- and Solid-Phase Parameters
Controlling Retardation . . . . . . . . . . . . . . . . . . . . . . . . . . . . . . . . . . . . . . . . . . 5.245.4.2 General Geochemistry . . . . . . . . . . . . . . . . . . . . . . . . . . . . . . . . . . . . . . . 5.245.4.3 Aqueous Speciation . . . . . . . . . . . . . . . . . . . . . . . . . . . . . . . . . . . . . . . . . 5.245.4.4 Dissolution/Precipitation/Coprecipitation . . . . . . . . . . . . . . . . . . . . . . . . . 5.255.4.5 Adsorption/Desorption . . . . . . . . . . . . . . . . . . . . . . . . . . . . . . . . . . . . . . . . 5.26
5.4.5.1 Guidance for Screening Calculations of Adsorption . . . . . . . . . . . . . . 5.265.4.5.2 General Adsorption Studies . . . . . . . . . . . . . . . . . . . . . . . . . . . . . . . . 5.275.4.5.3 Kd Studies for Curium on Soil Materials . . . . . . . . . . . . . . . . . . . . . . . 5.275.4.5.4 Published Compilations Containing Kd Values for Curium . . . . . . . . . 5.285.4.5.5 Kd Studies of Curium on Pure Mineral, Oxide, and
Crushed Rock Materials . . . . . . . . . . . . . . . . . . . . . . . . . . . . . . . . . . . . . . . 5.30
5.5 Iodine Geochemistry and Kd Values . . . . . . . . . . . . . . . . . . . . . . . . . . . . . . . . . 5.305.5.1 Overview: Important Aqueous- and Solid-Phase Parameters
Controlling Retardation . . . . . . . . . . . . . . . . . . . . . . . . . . . . . . . . . . . . . . . . . . 5.305.5.2 General Geochemistry . . . . . . . . . . . . . . . . . . . . . . . . . . . . . . . . . . . . . . . 5.305.5.3 Aqueous Speciation . . . . . . . . . . . . . . . . . . . . . . . . . . . . . . . . . . . . . . . . . 5.315.5.4 Dissolution/Precipitation/Coprecipitation . . . . . . . . . . . . . . . . . . . . . . . . . 5.325.5.5 Sorption/Desorption . . . . . . . . . . . . . . . . . . . . . . . . . . . . . . . . . . . . . . . . . 5.33
5.5.5.1 Guidance for Screening Calculations of Adsorption . . . . . . . . . . . . . . 5.335.5.5.2 General Adsorption Studies . . . . . . . . . . . . . . . . . . . . . . . . . . . . . . . . 5.345.5.5.3 Kd Studies of Iodine on Soil Materials . . . . . . . . . . . . . . . . . . . . . . . . . 5.365.5.5.4 Published Compilations Containing Kd Values for Iodine . . . . . . . . . . 5.435.5.5.5 Kd Studies of Iodine on Pure Mineral, Oxide, and
Crushed Rock Materials . . . . . . . . . . . . . . . . . . . . . . . . . . . . . . . . . . . . . . . 5.44
5.6 Neptunium Geochemistry and Kd Values . . . . . . . . . . . . . . . . . . . . . . . . . . . . . 5.455.6.1 Overview: Important Aqueous- and Solid-Phase Parameters
Controlling Retardation . . . . . . . . . . . . . . . . . . . . . . . . . . . . . . . . . . . . . . . . . . 5.455.6.2 General Geochemistry . . . . . . . . . . . . . . . . . . . . . . . . . . . . . . . . . . . . . . . 5.465.6.3 Aqueous Speciation . . . . . . . . . . . . . . . . . . . . . . . . . . . . . . . . . . . . . . . . . 5.475.6.4 Dissolution/Precipitation/Coprecipitation . . . . . . . . . . . . . . . . . . . . . . . . . 5.505.6.5 Adsorption/Desorption . . . . . . . . . . . . . . . . . . . . . . . . . . . . . . . . . . . . . . . . 5.51
5.6.5.1 Guidance for Screening Calculations of Adsorption . . . . . . . . . . . . . . 5.51
x
5.6.5.2 General Adsorption Studies . . . . . . . . . . . . . . . . . . . . . . . . . . . . . . . . 5.515.6.5.3 Kd Studies for Neptunium on Soil Materials . . . . . . . . . . . . . . . . . . . . 5.525.6.5.4 Published Compilations Containing Kd Values for Neptunium . . . . . . 5.555.6.5.5 Kd Studies of Neptunium on Pure Mineral, Oxide, and
Crushed Rock Materials . . . . . . . . . . . . . . . . . . . . . . . . . . . . . . . . . . . . . . . 5.58
5.7 Radium Geochemistry and Kd Values . . . . . . . . . . . . . . . . . . . . . . . . . . . . . . . 5.585.7.1 Overview: Important Aqueous- and Solid-Phase Parameters
Controlling Retardation . . . . . . . . . . . . . . . . . . . . . . . . . . . . . . . . . . . . . . . . . . 5.585.7.2 General Geochemistry . . . . . . . . . . . . . . . . . . . . . . . . . . . . . . . . . . . . . . . 5.585.7.3 Aqueous Speciation . . . . . . . . . . . . . . . . . . . . . . . . . . . . . . . . . . . . . . . . . 5.605.7.4 Dissolution/Precipitation/Coprecipitation . . . . . . . . . . . . . . . . . . . . . . . . . 5.605.7.5 Adsorption/Desorption . . . . . . . . . . . . . . . . . . . . . . . . . . . . . . . . . . . . . . . . 5.61
5.7.5.1 Guidance for Screening Calculations of Adsorption . . . . . . . . . . . . . . 5.615.7.5.2 General Adsorption Studies . . . . . . . . . . . . . . . . . . . . . . . . . . . . . . . . 5.625.7.5.3 Kd Studies for Radium on Soil Materials . . . . . . . . . . . . . . . . . . . . . . . 5.635.7.5.4 Published Compilations Containing Kd Values for Radium . . . . . . . . . 5.645.7.5.5 Kd Studies of Radium on Pure Mineral, Oxide, and
Crushed Rock Materials . . . . . . . . . . . . . . . . . . . . . . . . . . . . . . . . . . . . . . . 5.66
5.8 Technetium Geochemistry and Kd Values . . . . . . . . . . . . . . . . . . . . . . . . . . . . 5.665.8.1 Overview: Important Aqueous- and Solid-Phase Parameters
Controlling Retardation . . . . . . . . . . . . . . . . . . . . . . . . . . . . . . . . . . . . . . . . . . 5.665.8.2 General Geochemistry . . . . . . . . . . . . . . . . . . . . . . . . . . . . . . . . . . . . . . . 5.675.8.3 Aqueous Speciation . . . . . . . . . . . . . . . . . . . . . . . . . . . . . . . . . . . . . . . . . 5.675.8.4 Dissolution/Precipitation/Coprecipitation . . . . . . . . . . . . . . . . . . . . . . . . . 5.675.8.5 Adsorption/Desorption . . . . . . . . . . . . . . . . . . . . . . . . . . . . . . . . . . . . . . . . 5.70
5.8.5.1 Guidance for Screening Calculations of Adsorption . . . . . . . . . . . . . . 5.705.8.5.2 General Adsorption Studies . . . . . . . . . . . . . . . . . . . . . . . . . . . . . . . . 5.705.8.5.3 Kd Studies for Technetium on Soil Materials . . . . . . . . . . . . . . . . . . . . 5.715.8.5.4 Published Compilations Containing Kd Values for Technetium . . . . . . 5.765.8.5.5 Kd Studies of Technetium on Pure Mineral, Oxide, and
Crushed Rock Materials . . . . . . . . . . . . . . . . . . . . . . . . . . . . . . . . . . . . . . . 5.79
5.9 Conclusions . . . . . . . . . . . . . . . . . . . . . . . . . . . . . . . . . . . . . . . . . . . . . . . . . . . 5.79
6.0 References . . . . . . . . . . . . . . . . . . . . . . . . . . . . . . . . . . . . . . . . . . . . . . . . . . . . . . . 6.1
xi
Appendix A - Acronyms, Abbreviations, Symbols, and Notation . . . . . . . . . . . . . . . . . . A.1A.1 Acronyms and Abbreviations . . . . . . . . . . . . . . . . . . . . . . . . . . . . . . . . . . . . A.2A.2 List of Symbols for Elements and Corresponding Names . . . . . . . . . . . . . . . A.4A.3 List of Symbols and Notation . . . . . . . . . . . . . . . . . . . . . . . . . . . . . . . . . . . . A.5
Appendix B - Definitions . . . . . . . . . . . . . . . . . . . . . . . . . . . . . . . . . . . . . . . . . . . . . . . . B.1
Appendix C - Americium Adsorption Studies . . . . . . . . . . . . . . . . . . . . . . . . . . . . . . . . .C.1C.1 Adsorption Studies of Americium on Single Mineral Phases . . . . . . . . . . . . C.2C.2 Kd Studies of Americium on Crushed Rock Materials . . . . . . . . . . . . . . . . . . C.5
Appendix D - Arsenic Adsorption Studies . . . . . . . . . . . . . . . . . . . . . . . . . . . . . . . . . . . D.1D.1 Arsenic Adsorption Studies . . . . . . . . . . . . . . . . . . . . . . . . . . . . . . . . . . . . . D.2
Appendix E - Curium Adsorption Studies . . . . . . . . . . . . . . . . . . . . . . . . . . . . . . . . . . . E.1E.1 Adsorption Studies of Curium on Single Mineral Phases . . . . . . . . . . . . . . . E.2E.2 Kd Studies of Curium on Crushed Rock Materials . . . . . . . . . . . . . . . . . . . . . E.3
Appendix F - Iodine Adsorption Studies . . . . . . . . . . . . . . . . . . . . . . . . . . . . . . . . . . . . . F.1F.1 Adsorption Studies of Iodine on Single Mineral Phases . . . . . . . . . . . . . . . . . F.2F.2 Kd Studies of Iodine on Crushed Rock Materials . . . . . . . . . . . . . . . . . . . . . . . F.6
Appendix G - Neptunium Adsorption Studies . . . . . . . . . . . . . . . . . . . . . . . . . . . . . . . . G.1G.1 Adsorption Studies of Neptunium on Single Mineral Phases . . . . . . . . . . . . G.2G.2 Kd Studies of Neptunium on Crushed Rock Materials . . . . . . . . . . . . . . . . . . G.7
Appendix H - Radium Adsorption Studies . . . . . . . . . . . . . . . . . . . . . . . . . . . . . . . . . . . H.1H.1 Adsorption Studies of Radium on Single Mineral Phases . . . . . . . . . . . . . . H.2H.2 Kd Studies of Radium on Crushed Rock Materials . . . . . . . . . . . . . . . . . . . . H.4
Appendix I - Technetium Adsorption Studies . . . . . . . . . . . . . . . . . . . . . . . . . . . . . . . . . I.1I.1 Adsorption Studies of Technetium on Single Mineral Phases . . . . . . . . . . . . I.2I.2 Kd Studies of Technetium on Crushed Rock Materials . . . . . . . . . . . . . . . . . . I.2
xii
LIST OF FIGURES
Page
Figure 5.1. Calculated aqueous speciation for Am(III) as a function of pH. . . . . . . . . . . 5.5
Figure 5.2. Kd values (ml/g) for Am(III) adsorption on soil reportedby Routson et al. (1975, 1977) (solid squares) and Sanchez et al. (1982) (solid triangles). . . . . . . . . . . . . . . . . . . . . . . . . . . . . . . . . . . . . . . . . . . . . . . . 5.6
Figure 5.3. Eh-pH stability diagram for dominant arsenic aqueous species at 25"C . . . . . . . . . . . . . . . . . . . . . . . . . . . . . . . . . . . . . . . . . . . . . . . . . . . . 5.15
Figure 5.4. Calculated aqueous speciation for As(V) as a function of pH. . . . . . . . . . . 5.16
Figure 5.5. Calculated aqueous speciation for Cm(III) as a function of pH. . . . . . . . . . 5.25
Figure 5.6. Eh-pH stability diagram for dominant iodine aqueous species at 25"C. . . . . . . . . . . . . . . . . . . . . . . . . . . . . . . . . . . . . . . . . . . . . . . . . . . . 5.32
Figure 5.7. Eh-pH stability diagram for dominant neptunium aqueous species at 25"C. . . . . . . . . . . . . . . . . . . . . . . . . . . . . . . . . . . . . . . . . . . . . . . . . . . . 5.48
Figure 5.8. Calculated aqueous speciation for Np(V) as a function of pH. . . . . . . . . . . 5.49
Figure 5.9. Eh-pH stability diagram for the dominant technetium aqueous species at 25"C. . . . . . . . . . . . . . . . . . . . . . . . . . . . . . . . . . . . . . . . . . . . . . . . . . . . 5.68

xiii
LIST OF TABLES
Page
Table 5.1 Estimated mean composition of river water of the world from Hem (1985) . . . . . . . . . . . . . . . . . . . . . . . . . . . . . . . . . . . . . . . . . . . . . . . . . . . . 5.3
Table 5.2. Americium(III) aqueous species . . . . . . . . . . . . . . . . . . . . . . . . . . . . . . . . . . . 5.4
Table 5.3. Measured Kd values (ml/g) for americium as a function of pH for Hudson River estuary environment [Sanchez et al. (1982)] . . . . . . . . . . . . . . . . . 5.8
Table 5.4. Measured americium Kd values (ml/l) and soil properties for soils studied by Nishita et al. (1981) . . . . . . . . . . . . . . . . . . . . . . . . . . . . . . . . . . . . . 5.9
Table 5.5. Properties of soils used in Kd measurements by Routson et al. (1975, 1977) . . . . . . . . . . . . . . . . . . . . . . . . . . . . . . . . . . . . . . . . . . . 5.10
Table 5.6. Americium Kd values (ml/g) listed by Thibault et al. (1990, Tables 4 to 8) . . . . . . . . . . . . . . . . . . . . . . . . . . . . . . . . . . . . . . . . . . . . . . . . 5.11
Table 5.7. Americium Kd values (ml/g) listed by McKinley and Scholtis (1993, Tables 1, 2, and 4) from sorption databases usedby different international organizations for performance assessments of repositories for radioactive wastes. . . . . . . . . . . . . . . . . . . . . . . . . . . . . . . . . . . . 5.13
Table 5.8. Measured arsenic Kd values (ml/g) based on analyses of an arsenic-contaminated aquifer at a Superfund Site (Mariner et al., 1996) . . . . . . . . 5.22
Table 5.9. Measured curium Kd values (ml/l) and soil properties for soils studied by Nishita et al. (1981) . . . . . . . . . . . . . . . . . . . . . . . . . . . . . . . . . . . . . . . . 5.28
Table 5.10. Curium Kd values (ml/g) listed by Thibault et al. (1990, Tables 4 to 8) . . . . . . . . . . . . . . . . . . . . . . . . . . . . . . . . . . . . . . . . . . . . . . . . 5.29
Table 5.11. Kd values (ml/g) for the adsorption of iodine to sediments from the Hanford Site in southeastern Washington state (Kaplan et al., 1998a,1998b) . . . . . . . . . . . . . . . . . . . . . . . . . . . . . . . . . . . . . . . . . . 5.38
Table 5.12. Median Kd values (ml/g) for iodide and iodate measured in deionized water [Yoshida et al. (1998)] . . . . . . . . . . . . . . . . . . . . . . . . . . . . . . . . . . 5.40
Table 5.13. Geometric mean Kd values (ml/g) for iodine measured in untreated river water under oxic conditions (Bird and Schwartz, 1996) . . . . . . . . . . 5.41
xiv
Table 5.14. Values of Kd (ml/g) measured by Muramatsu et al. (1990) for the sorption of I- and IO3
- on soil and selected soil components of an andosol . . . . . . . 5.43
Table 5.15. Iodine Kd values (ml/g) listed by Thibault et al. (1990, Tables 4 to 8) . . . . . . . . . . . . . . . . . . . . . . . . . . . . . . . . . . . . . . . . . . . . . . . . 5.44
Table 5.16. Iodine Kd values (ml/g) listed by McKinley and Scholtis (1993, Tables 1, 2, and 4) from sorption databases used by different international organizations for performance assessmentsof repositories for radioactive wastes . . . . . . . . . . . . . . . . . . . . . . . . . . . . . . . . . . . 5.45
Table 5.17. Np(V) aqueous species . . . . . . . . . . . . . . . . . . . . . . . . . . . . . . . . . . . . . . . 5.49
Table 5.18. Neptunium(V) Kd values (ml/g) measured for three sediments by Kaplan et al. (1996) . . . . . . . . . . . . . . . . . . . . . . . . . . . . . . . . . . . . . . . . . . . . . . 5.52
Table 5.19. Measured Np(V) Kd values (ml/l) and soil properties for soils studied by Nishita et al. (1981) . . . . . . . . . . . . . . . . . . . . . . . . . . . . . . . . . . . . . . . . 5.53
Table 5.20. Properties of soils used in Kd measurements by Routson et al. (1975, 1977) . . . . . . . . . . . . . . . . . . . . . . . . . . . . . . . . . . . . . . . . . . . 5.54
Table 5.21. Neptunium Kd values (ml/g) measured for Washington and South Carolina soil samples in Ca(NO3)2 and NaNO3 solutions by Routson et al. (1975, 1977) . . . . . . . . . . . . . . . . . . . . . . . . . . . . . . . . . . . . . . . . 5.54
Table 5.22. Neptunium Kd values (ml/g) listed by Thibault et al. (1990, Tables 4 to 8) . . . . . . . . . . . . . . . . . . . . . . . . . . . . . . . . . . . . . . . . . . . . . . . . 5.56
Table 5.23. Neptunium Kd values (ml/g) listed by McKinley and Scholtis (1993, Tables 1, 2, and 4) from sorption databases used by different international organizations for performance assessmentsof repositories for radioactive wastes . . . . . . . . . . . . . . . . . . . . . . . . . . . . . . . . . . . 5.57
Table 5.24. Ionic radii (Å) for alkaline earth elements (Molinari and Snodgrass, 1990) . . . . . . . . . . . . . . . . . . . . . . . . . . . . . . . . . . . . . . . . . . . . . . . 5.59
Table 5.25. Radium Kd values (ml/g) as function of calcium concentration [Nathwani and Phillips, 1979b)] . . . . . . . . . . . . . . . . . . . . . . . . . . . . . 5.64
Table 5.26. Properties of soil samples for which Kd values are given in Nathwani and Phillips (1979b) . . . . . . . . . . . . . . . . . . . . . . . . . . . . . . . . . . . . . . . . . 5.65
Table 5.27. Radium Kd values (ml/g) measured by Serne (1974) for sandy, arid soil samples from Utah . . . . . . . . . . . . . . . . . . . . . . . . . . . . . . . . . . . . . . . . . . . 5.65

xv
Table 5.28. Radium Kd values (ml/g) listed by Thibault et al. (1990, Tables 4 to 8) . . . . . . . . . . . . . . . . . . . . . . . . . . . . . . . . . . . . . . . . . . . . . . . . 5.66
Table 5.29. Technetium Kd values (ml/g) measured for Hanford sediments under oxidizing conditions (Kaplan et al. (1998a, 1998b) . . . . . . . . . . . . . . . . . . . . 5.73
Table 5.30. Average technetium Kd values (ml/g) (based on three replicates) for technetium on Hanford sediments after 21.5 days from Gee and Campbell (1980) . . . . . . . . . . . . . . . . . . . . . . . . . . . . . . . . . . . . . . . . 5.75
Table 5.31. Technetium Kd values (ml/g) listed by Thibault et al.(1990, Tables 4 to 8) . . . . . . . . . . . . . . . . . . . . . . . . . . . . . . . . . . . . . . . . . . . . . . . . 5.77
Table 5.32. Technetium Kd values (ml/g) listed by McKinley and Scholtis (1993, Tables 1, 2, and 4) from sorption databases used by different international organizations for performance assessments of repositories for radioactive wastes . . . . . . . . . . . . . . . . . . . . . . . . . . . . . . . . . . . 5.78
Table 5.33. Selected chemical and transport properties of the contaminants . . . . . . . 5.80
Table 5.34. Distribution of dominant contaminant species at 3 pH values for an oxidizing water described in Tables 5.1 . . . . . . . . . . . . . . . . . . . . . . . . . . . . . 5.81
Table 5.35. Some of the more important aqueous- and solid-phase parameters affecting contaminant sorption . . . . . . . . . . . . . . . . . . . . . . . . . . . . . . . 5.82
Table C.1 Americium adsorption studies on pure mineral and oxide phases . . . . . . . C.3
Table C.2 Americium adsorption studies on crushed rock and related materials . . . . C.5
Table D.1 Arsenic adsorption studies on pure mineral and oxide phases . . . . . . . . . . D.2
Table E.1 Curium adsorption studies on pure mineral and oxide phases . . . . . . . . . . E.2
Table E.2 Curium adsorption studies on crushed rock and related materials . . . . . . . E.3
Table F.1 Iodine adsorption studies on pure minerals and oxide phases . . . . . . . . . . . F.3
Table F.2 Iodine adsorption studies on crushed rock and related materials . . . . . . . . . F.7
Table G.1 Neptunium adsorption studies on pure mineral and oxide phases . . . . . . . G.2
Table G.2 Measured Np(V) Kd values (ml/l) for fracture-coating minerals as a function of total dissolved solids (TDS) and normal versus low oxygen conditions . . . . . . . . . . . . . . . . . . . . . . . . . . . . . . . . . . . . . . . . . . . . . . . . . . G.4

xvi
Table G.3 Neptunium adsorption studies on crushed rock and related materials . . . . . . . . . . . . . . . . . . . . . . . . . . . . . . . . . . . . . . . . . . . . . . . . . . . G.7
Table H.1 Radium adsorption studies on pure mineral and oxide phases . . . . . . . . . . H.3
Table H.2 Radium adsorption studies on crushed rock and related materials . . . . . . . H.5
Table I.1 Technetium adsorption studies on pure mineral and oxide phases . . . . . . . . I.3
Table I.2 Technetium adsorption studies on crushed rock and related materials . . . . . I.5

1 Throughout this report, the term “partition coefficient” will be used to refer to the Kd “linear isotherm” sorptionmodel. It should be noted, however, that the terms “partition coefficient” and “distribution coefficient” are usedinterchangeably in the literature for the Kd model.
2 A list of acronyms, abbreviations, symbols, and notation is given in Appendix A. A list of definitions is given inAppendix B.
3 The terms “sediment” and “soil” have particular meanings depending on one’s technical discipline. For example,the term “sediment” is often reserved for transported and deposited particles derived from soil, rocks, or biologicalmaterial. “Soil” is sometimes limited to referring to the top layer of the earth’s surface, suitable for plant life. In thisreport, the term “soil” was selected with concurrence of the EPA Project Officer as a general term to refer to allunconsolidated geologic materials.
1.0 Introduction
The objective of the report is to provide a reasoned and documented discussion on the technical issuesassociated with the measurement and selection of partition (or distribution) coefficient, Kd,1,2 valuesand their use in formulating the retardation factor, Rf. The contaminant retardation factor (Rf) is theparameter commonly used in transport models to describe the chemical interaction between thecontaminant and geological materials (i.e., soil, sediments, rocks, and geological formations, henceforthsimply referred to as soils3). It includes processes such as surface adsorption, absorption into the soilstructure, precipitation, and physical filtration of colloids. Specifically, it describes the rate ofcontaminant transport relative to that of groundwater. This report is provided for technical staff fromEPA and other organizations who are responsible for prioritizing site remediation and wastemanagement decisions. The three-volume report describes the conceptualization, measurement, anduse of the Kd parameter; and geochemical aqueous solution and sorbent properties that are mostimportant in controlling the adsorption/retardation behavior of a selected set of contaminants.
This review is not meant to assess or judge the adequacy of the Kd approach used in modeling tools forestimating adsorption and transport of contaminants and radionuclides. Other approaches, such assurface complexation models, certainly provide more robust mechanistic approaches for predictingcontaminant adsorption. However, as one reviewer noted, “Kd’s are the coin of the realm in thisbusiness.” For better or worse, the Kd model is an integral part of current methodologies for modelingcontaminant and radionuclide transport and risk analysis.
The Kd concept, its use in fate and transport computer codes, and the methods for the measurement ofKd values are discussed in detail in Volume I and briefly introduced in Chapters 2 and 3 in Volumes II(EPA, 1999c) and III. Particular attention is directed at providing an understanding of: (1) the use ofKd values in formulating Rf, (2) the difference between the original thermodynamic Kd parameterderived from the ion-exchange literature and its “empiricized” use in contaminant transport codes, and(3) the explicit and implicit assumptions underlying the use of the Kd parameter in contaminanttransport codes.
As typically used in fate and contaminant transport calculations, the Kd is defined as the ratio of thecontaminant concentration associated with the solid to the contaminant concentration in thesurrounding aqueous solution when the system is at equilibrium. Soil chemists and geochemistsknowledgeable of sorption processes in natural environments have long known that generic or defaultKd values can result in significant error when used to predict the impacts of contaminant migration orsite-remediation options. To address some of this concern, modelers often incorporate a degree of
1.2
conservatism into their calculations by selecting limiting or bounding conservative Kd values. Forexample, the most conservative Kd value from the perspective of off-site risks due to contaminantmigration through subsurface natural soil and groundwater systems is to assume that the soil has littleor no ability to slow (retard) contaminant movement (i.e., a minimum bounding Kd value). Conse-quently, the contaminant would travel in the direction and at the rate of water. Such an assumptionmay in fact be appropriate for certain contaminants such as tritium, but may be too conservative forother contaminants, such as thorium or plutonium, which react strongly with soils and may migrate 102
to 106 times more slowly than the water.
On the other hand, when estimating the risks and costs associated with on-site remediation options, amaximum bounding Kd value provides an estimate of the maximum concentration of a contaminant orradionuclide sorbed to the soil. Conservatism for remediation calculations would tend to err on theside of underestimating the extent of contaminant desorption that would occur in the aquifer oncepump-and-treat or soil flushing treatments commenced. Such an estimate would provide an upperlimit to time, money, and work required to extract a contaminant from a soil. This would beaccomplished by selecting a Kd from the upper range of literature values.
In some instances because of long groundwater flow paths, extremely arid site characteristics, orpresence of impermeable soils, the final results of risk and transport calculations for somecontaminants may be insensitive to the Kd value even when selected within the range of technically-defensible, limiting minimum and maximum Kd values. However, for most situations that are sensitiveto the selected Kd value, site-specific Kd values are essential for obtaining defensible risk and transportpredictions.
The Kd is usually a measured parameter that is obtained from laboratory experiments. The 5 generalmethods used to measure Kd values are reviewed in Volume I (EPA, 1999b). These methods includethe batch laboratory method, the column laboratory method, field-batch method, field modelingmethod, and soil organic carbon/water partition coefficient ( Koc ) method. Volume I (EPA, 1999b)identifies what ancillary information is needed regarding the adsorbent (soil), solution (contaminatedground-water or process waste water), contaminant (concentration, valence state, speciationdistribution), and laboratory details (spike addition methodology, phase separation techniques, contacttimes). The advantages, disadvantages, and, perhaps more importantly, the underlying assumptions ofeach method are also presented.
A conceptual overview of geochemical modeling calculations and computer codes as they pertain toevaluating Kd values and modeling of adsorption processes is discussed in detail in Volume I (EPA,1999b) and briefly described in Chapter 4 of Volumes II (EPA, 1999c) and III. The use ofgeochemical codes in evaluating aqueous speciation, solubility, and adsorption processes associatedwith contaminant fate studies is reviewed. This approach is compared to the traditional calculationsthat rely on the constant Kd construct. The use of geochemical modeling to address quality assuranceand technical defensibility issues concerning available Kd data and the measurement of Kd values arealso discussed. The geochemical modeling review includes a brief description of the EPA’sMINTEQA2 geochemical code and a summary of the types of conceptual models it contains toquantify adsorption reactions. The status of radionuclide thermodynamic and contaminant adsorptionmodel databases for the MINTEQA2 code is also reviewed.
1.3
The main focus of Volumes II (EPA, 1999c) and III is to: (1) provide a “thumb-nail sketch” of the keygeochemical processes affecting the sorption of a selected set of contaminants; (2) provide referencesto related key experimental and review articles for further reading; (3) identify the important aqueous-and solid-phase parameters controlling the sorption of these contaminants in the subsurfaceenvironment; and (4) identify, when possible, minimum and maximum conservative Kd values for eachcontaminant (as a function key geochemical processes affecting their sorption). The contaminantschosen for the first phase of this project, Volume II (EPA, 1999c), included reviews on cadmium,cesium, chromium, lead, plutonium, radon, strontium, thorium, tritium (3H), and uranium. Thisdocument (Volume III) represents the second phase of this project, and is an extension of Volume II. Volume III provides “thumb-nail sketches” of the key geochemical processes affecting the sorption ofamericium, arsenic(V) (as arsenate), curium, iodine [-I (as iodide) and +5 (iodate)], neptunium, radium,and technetium(VII) (as pertechnetate) to soils.
The selection of these contaminants by EPA and Pacific Northwest National Laboratory (PNNL)project staff was based on two criteria. First, the contaminant had to be of high priority to siteremediation or risk assessment activities of EPA, DOE, and/or NRC. Second, because the availablefunding precluded a review of all contaminants that met the first criteria, a subset was selected torepresent categories of contaminants based on their chemical behavior. The six nonexclusivecategories are:
C Cations - americium, cadmium, cesium, curium, neptunium, plutonium, radium, strontium,thorium, and uranium.
C Anions - arsenic(V) (as arsenate), chromium(VI) (as chromate), iodine [-I (as iodide) and +5(iodate)], technetium(VII) (as pertechnetate) and uranium(VI) complexes (e.g., uranyl carbonatecomplexes).
C Radionuclides - americium, cesium, curium, iodine, neptunium, plutonium, radium, radon,strontium, technetium, thorium, tritium (3H), and uranium.
C Conservatively transported contaminants - tritium (3H) and radon.C Nonconservatively transported contaminants - other than tritium (3H) and radon.C Redox sensitive elements - arsenic, chromium, iodine, neptunium, plutonium, technetium, and
uranium.
The general geochemical behaviors discussed in this report can be used by analogy to estimate thegeochemical interactions of similar elements for which data are not available. For example,contaminants present primarily in anionic form, such as Cr(VI), tend to adsorb to a limited extent tosoils. Thus, one might generalize that other anions, such as nitrate, chloride, and U(VI)-anioniccomplexes, would also adsorb to a limited extent. Literature on the adsorption of these three solutesshow no or very little adsorption.
The concentration of contaminants in groundwater is controlled primarily by the amount of contam-inant present at the source; rate of release from the source; hydrologic factors such as dispersion,advection, and dilution; and a number of geochemical processes including aqueous geochemicalprocesses, adsorption/desorption, precipitation, and diffusion. To accurately predict contaminanttransport through the subsurface, it is essential that the important geochemical processes affectingcontaminant transport be identified and, perhaps more importantly, accurately described in amathematically and scientifically defensible manner. Dissolution/precipitation andadsorption/desorption are usually the most important processes affecting contaminant interaction with

1.4
soils. Dissolution/precipitation is more likely to be the key process where chemical nonequilibriumexists, such as at a point source, an area where high contaminant concentrations exist, or where steeppH or oxidation-reduction (redox) gradients exist. Adsorption/desorption will likely be the key processcontrolling contaminant migration in areas where chemical steady state exist, such as in areas far fromthe point source. Diffusion flux spreads solute via a concentration gradient (i.e., Fick’s law). Diffusionis a dominant transport mechanism when advection is insignificant, and is usually a negligible transportmechanism when water is being advected in response to various forces.

2.1
(2.1)
(2.2)
(2.3)
2.0 The Kd Model
The simplest and most common method of estimating contaminant retardation is based on thepartition (or distribution) coefficient, Kd. The Kd parameter is a factor related to the partitioning of acontaminant between the solid and aqueous phases. It is an empirical unit of measurement thatattempts to account for various chemical and physical retardation mechanisms that are influenced by amyriad of variables. The Kd metric is the most common measure used in transport codes to describethe extent to which contaminants are sorbed to soils. It is the simplest, yet least robust model available. A primary advantage of the Kd model is that it is easily inserted into hydrologic transport codes toquantify reduction in the rate of transport of the contaminant relative to groundwater, either byadvection or diffusion. Technical issues, complexities, and shortcomings of the Kd approach todescribing contaminant sorption to soils are summarized in detail in Chapter 2 of Volume I (EPA,1999b). Particular attention is directed at issues relevant to the selection of Kd values from theliterature for use in transport codes.
The partition coefficient, Kd, is defined as the ratio of the quantity of the adsorbate adsorbed per massof solid to the amount of the adsorbate remaining in solution at equilibrium. For the reaction
the mass action expression for Kd is
where A = free or unoccupied surface adsorption sites Ci = total dissolved adsorbate remaining in solution at equilibrium Ai = amount of adsorbate on the solid at equilibrium.
The Kd is typically given in units of ml/g. Describing the Kd in terms of this simple reaction assumesthat A is in great excess with respect to Ci and that the activity of Ai is equal to 1.
Chemical retardation, Rf, is defined as,
where vp = velocity of the water through a control volumevc = velocity of contaminant through a control volume.
The chemical retardation term does not equal unity when the solute interacts with the soil; almostalways the retardation term is greater than 1 due to solute sorption to soils. In rare cases, theretardation factor is actually less than 1, and such circumstances are thought to be caused by anionexclusion (See Volume I, Section 2.7). Knowledge of the Kd and of media bulk density and porosityfor porous flow, or of media fracture surface area, fracture opening width, and matrix diffusionattributes for fracture flow, allows calculation of the retardation factor. For porous flow with saturated
2.2
(2.4)
moisture conditions, the Rf is defined as
where Db = porous media bulk density (mass/length3)ne = effective porosity of the media at saturation.
The Kd parameter is valid only for a particular adsorbent and applies only to those aqueous chemicalconditions (e.g., adsorbate concentration, solution/electrolyte matrix) in which it was measured. Site-specific Kd values should be used for site-specific contaminant and risk assessment calculations. Ideally, site-specific Kd values should be measured for the range of aqueous and geological conditionsin the system to be modeled. However, literature-derived Kd values are commonly used for screeningcalculations. Suitable selection and use of literature-derived Kd values for screening calculations ofcontaminant transport is not a trivial matter. Among the assumptions implicit with the Kd constructis: (1) only trace amounts of contaminants exist in the aqueous and solid phases, (2) the relationshipbetween the amount of contaminant in the solid and liquid phases is linear, (3) equilibrium conditionsexist, (4) equally rapid adsorption and desorption kinetics exists, (5) it describes contaminantpartitioning between one sorbate (contaminant) and one sorbent (soil), and (6) all adsorption sites areaccessible and have equal adsorption binding energies. Many of these assumptions are not met forgroundwater/soil environments. Thus, literature-derived Kd values should be used only to predicttransport in systems similar to those used in the laboratory and field to measure the Kd. Variation ineither the soil or aqueous chemistry of a system can result in extremely large differences in Kd values.
A more robust approach than using a single Kd to describe the partitioning of contaminants betweenthe aqueous and solid phases is the parametric-Kd model. This model varies the Kd value according tothe chemistry and mineralogy of the system at the node being modeled. The parametric-Kd value,unlike the constant-Kd value, is not limited to a single set of environmental conditions. Instead, itdescribes the sorption of a contaminant in the range of environmental conditions used to create theparametric-Kd equations. These types of statistical relationships are devoid of causality and thereforeprovide no information on the mechanism by which the radionuclide partitioned to the solid phase,whether it be by adsorption, absorption, or precipitation. Understanding these mechanisms isextremely important relative to estimating the mobility of a contaminant.
When the parametric-Kd model is used in the transport equation, the code must also keep track of thecurrent value of the independent variables at each point in space and time to continually update theconcentration of the independent variables affecting the Kd value. Thus, the code must track manymore parameters and some numerical solving techniques (such as closed-form analytical solutions). Itcan no longer be used to perform the integration necessary to solve for the Kd value and/or retardationfactor, Rf. Generally, computer codes that can accommodate the parametric-Kd model use a chemicalsubroutine to update the Kd value used to determine the RF, when called for by the main transportcode. The added complexity in solving the transport equation with the parametric-Kd sorption modeland its empirical nature may be the reasons this approach has been used sparingly.
Mechanistic models explicitly accommodate for the dependency of Kd values on contaminant concen-tration, charge, competing ion concentration, variable surface charge on the soil, and solution speciesdistribution. Incorporating mechanistic adsorption concepts into transport models is desirable because

2.3
the models become more robust and, perhaps more importantly from the standpoint of regulators andthe public, scientifically defensible. However, truly mechanistic adsorption models are rarely, if ever,applied to complex natural soils. The primary reason for this is because natural mineral surfaces arevery irregular and difficult to characterize. These surfaces consist of many different microcrystallinestructures that exhibit quite different chemical properties when exposed to solutions. Thus,examination of the surface by virtually any experimental method yields only averaged characteristics ofthe surface and the interface.
Less attention will be directed to mechanistic models because they are not extensively incorporated intothe majority of EPA, DOE, and NRC modeling methodologies. The complexity of installing thesemechanistic adsorption models into existing transport codes is formidable. Additionally, these modelsalso require a more extensive database collection effort than will likely be available to the majority ofEPA, DOE, and NRC contaminant transport modelers. A brief description of the state of the scienceof mechanistic adsorption modeling is presented in Volume I (EPA, 1999b) primarily to provide aparadigm for sorption processes. Readers should note, that since the completion of Volumes I and II(EPA, 1999b, 1999c), Brown et al. (1999) published an extensive review of the interactions of metaloxide surfaces with aqueous solutions and microbial organisms. This review includes a detaileddiscussion of the theory and thermodynamic models for describing the adsorption of chemical speciesto oxide surfaces.

3.1
3.0 Methods, Issues, and Criteria for Measuring Kd Values
There are five general methods used to measure Kd values: the batch laboratory method, laboratoryflow-through (or column) method, field-batch method, field modeling method, and Koc method. TheKoc method is specific to adsorption of organics. These methods and the associated technical issues aredescribed in detail in Chapter 3 of Volume I (EPA, 1999b). Each method has advantages anddisadvantages, and perhaps more importantly, each method has its own set of assumptions forcalculating Kd values from experimental data. Consequently, it is not only common, but expected thatKd values measured by different methods will produce different values.
3.1 Laboratory Batch Method
Batch tests are commonly used to measure Kd values. A batch test is conducted by spiking a solutionwith the element of interest, mixing the spiked solution with a solid for a specified period of time,separating the solution from the solid, and measuring the concentration of the spiked elementremaining in solution. The concentration of contaminant associated with the solid is determined by thedifference between initial and final contaminant concentration in solution. The primary advantage ofthe batch method is that such experiments can be completed quickly for a wide variety of elements andchemical environments. The primary disadvantage of the batch technique for measuring Kd is that itdoes not necessarily reproduce the chemical reaction conditions that take place in the real environment. For instance, in a soil column, water passes through at a finite rate and both reaction time and degreeof mixing between water and soil can be much less than those occurring in a laboratory batch test. Consequently, Kd values from batch experiments can be high relative to the extent of sorptionoccurring in a real system, and thus result in an estimate of contaminant retardation that is too large. Another disadvantage of batch experiments is that they do not accurately simulate desorption of theradionuclides or contaminants from a contaminated soil or solid waste source. The Kd values arefrequently used with the assumption that adsorption and desorption reactions are reversible. Thisassumption is contrary to most experimental observations that show that the desorption process isappreciably slower than the adsorption process, a phenomenon referred to as hysteresis. The rate ofdesorption may even go to zero, yet a significant mass of the contaminant remains sorbed on the soil. Thus, use of Kd values determined from batch adsorption tests in contaminant transport models isgenerally considered to provide estimates of contaminant remobilization (release) from soil that are toolarge (i.e., estimates of contaminant retention that are too low).
Inherent in the Kd “linear isotherm” adsorption model is the assumption that adsorption of thecontaminant of interest is independent of its concentration in the aqueous phase. Partitioning of acontaminant on soil can often be described using the Kd model, but typically only for low contaminantconcentrations as would exist some distance away (far field) from the source of contamination. It iscommon knowledge that contaminant adsorption on soils can deviate from the linear relationshiprequired by the Kd construct. This is possible for conditions as might exist in leachates or groundwaternear waste sources where contaminant concentrations are large enough to affect the saturation ofsurface adsorption sites. In these latter situations, non-linear isotherm models [see Section 2.3.3 inVolume I (EPA, 1999b)] are used to describe the case where sorption relationships deviate fromlinearity.

3.2
3.2 Laboratory Flow-Through Method
Flow-through column experiments are intended to provide a more realistic simulation of dynamic fieldconditions and to quantify the movement of contaminants relative to groundwater flow. It is thesecond most common method of determining Kd values. The basic experiment is completed bypassing a liquid spiked with the contaminant of interest through a soil column. The column experi-ment combines the chemical effects of sorption and the hydrologic effects of groundwater flowthrough a porous medium to provide an estimate of retarded movement of the contaminant of interest. The retardation factor (a ratio of the velocity of the contaminant to that of water) is measured directlyfrom the experimental data. A Kd value can be calculated from the retardation factor. It is frequentlyuseful to compare the back-calculated Kd value from these experiments with those derived directlyfrom the batch experiments to evaluate the influence of limited interaction between solid and solutionimposed by the flow-through system.
One potential advantage of the flow-through column studies is that the retardation factor can beinserted directly into the transport code. However, if the study site contains different hydrologicalconditions (e.g., porosity and bulk density) than the column experiment, then a Kd value needs to becalculated from the retardation factor. Another advantage is that the column experiment provides amuch closer approximation of the physical conditions and chemical processes occurring in the field sitethan a batch sorption experiment. Column experiments permit the investigation of the influence oflimited spatial and temporal (nonequilibrium) contact between solute and solid have on contaminantretardation. Additionally, the influence of mobile colloid facilitated transport and partial saturation canbe investigated. A third advantage is that both adsorption or desorption reactions can be studied. Thepredominance of one mechanism of adsorption or desorption over another cannot be predicted a prioriand therefore generalizing the results from one set of laboratory experimental conditions to fieldconditions is never without some uncertainty. Ideally, flow-through column experiments would beused exclusively for determining Kd values, but equipment cost, time constraints, experimentalcomplexity, and data reduction uncertainties discourage more extensive use. Another important issuefor column studies is that a flow model (e.g., piston flow or a mobile/immobile flow system) must beassumed to calculate a Kd value. A different result may be obtained depending on which flow model ischosen. The Kd values derived from column studies are also conditional on the flow rate; generally, thefaster the flow rate, lower the calculated Kd.
3.3 Other Methods
Less commonly used methods include the Koc method, in-situ batch method, and the field modelingmethod. The Koc method is a very effective indirect method of calculating Kd values, however, it isonly applicable to hydrophobic organic compounds. The Koc method becomes increasingly inaccurateas the organic contaminant is increasingly hydrophilic, because hydrophilic organic compounds can alsoadsorb to mineral surfaces, in addition to partitioning to organic matter. The in-situ batch methodrequires that paired soil and groundwater samples be collected directly from the aquifer system beingmodeled and then measuring directly the amount of contaminant on the solid and liquid phases. Theadvantage of this approach is that the precise solution chemistry and solid phase mineralogy existing inthe study site is used to measure the Kd value. However, this method is not used often because of theanalytical problems associated with measuring the exchangeable fraction of contaminant on the solidphase. Finally, the field modeling method of calculating Kd values uses groundwater monitoring data

3.3
and source term data to calculate a Kd value. The accuracy of the field modeling method in highlydependent on the accuracy of the other input parameters used in the calculation. For instance, if thedispersion value or the hydraulic conductivity is incorrect, it is very unlikely that the true Kd value willbe calculated. One key drawback to this technique is that it is very model dependent. Because thecalculated Kd values are model dependent and highly site specific, the derived Kd values should not beused for contaminant transport calculations at other sites.
3.4 Issues
A number of issues exist concerning the measurement of Kd values and the selection of Kd values fromthe literature. These issues are discussed with supporting references in Volume I (EPA, 1999b), and arebriefly summarized below. These issues include: using simple versus complex systems to measure Kdvalues, field variability, the “gravel issue,” the “colloid issue,” and contaminant solubility limits. Soilsare a complex mixture containing solid, gaseous, and liquid phases. Each phase contains severaldifferent constituents. The use of simplified systems containing single mineral phases and aqueousphases with one or two dissolved species has provided valuable paradigms for understanding sorptionprocesses in more complex, natural systems. However, the Kd values generated from these simplesystems are generally of little value for importing directly into transport models. Values for transportmodels should be generated from geologic materials from or similar to the study site.
The “gravel issue” is the problem that transport modelers face when converting laboratory-derived Kdvalues based on experiments conducted with the <2-mm fraction into values that can be used insystems containing particles >2 mm in size (Kaplan et al., 2000c). No standard methods exist toaddress this issue. There are many subsurface soils dominated by cobbles, gravel, or boulders. To basethe Kd values on the <2-mm fraction, which may constitute only a low percent of the soil volume but isthe most chemically reactive fraction, may grossly overestimate the actual Kd of the aquifer. Twogeneral approaches have been proposed to address this issue. The first is to assume that all particles>2-mm have a Kd = 0 ml/g. Although this assumption is incorrect; i.e., we know that cobbles, gravel,and boulders do in fact sorb contaminants, the extent to which sorption occurs on these larger particlesmay be small. The second approach is to normalize laboratory-derived Kd values by soil surface area. Theoretically, this latter approach is more satisfying because it permits some sorption to occur on the>2-mm fraction and the extent of the sorption is proportional to the surface area. The underlyingassumptions in this approach are that the mineralogy is similar in the less than 2- and greater than2-mm fractions and that the sorption processes occurring on the smaller particles are similar to thosethat occur on the larger particles.
Spatial variability provides additional complexity to understanding and modeling contaminant retentionto subsurface soils. The extent to which contaminants partition to soils changes as field mineralogyand chemistry change. Thus, a single Kd value is almost never sufficient for an entire study site andshould change as chemically important environmental conditions change. Three approaches used tovary Kd values in transport codes are the Kd look-up table approach, the parametric-Kd approach, andthe mechanistic Kd approach. The extent to which these approaches are presently used and the ease ofincorporating them into a flow model varies greatly. Parametric-Kd values typically have limitedenvironmental ranges of application. Mechanistic Kd values are limited to uniform solid and aqueoussystems with little application to heterogeneous soils existing in nature. The easiest and the mostcommon variable-Kd model interfaced with transport codes is the look-up table. In Kd look-up tables,separate Kd values are assigned to a matrix of discrete categories defined by chemically important

1 A colloid is any fine-grained material, sometimes limited to the particle-size range of <0.00024 mm (i.e., smaller thanclay size), that can be easily suspended (Bates and Jackson, 1980). In its original sense, the definition of a colloidincluded any fine-grained material that does not occur in crystalline form. The geochemistry of colloid systems isdiscussed in detail in sources such as Yariv and Cross (1979) and the references therein.
3.4
ancillary parameters. No single set of ancillary parameters, such as pH and soil texture, is universallyappropriate for defining categories in Kd look-up tables. Instead, the ancillary parameters must vary inaccordance to the geochemistry of the contaminant. It is essential to understand fully the criteria andprocess used for selecting the values incorporated in such a table. Differences in the criteria andprocess used to select Kd values can result in appreciably different Kd values. Examples are presentedin this volume.
Contaminant transport models generally treat the subsurface environment as a two-phase system inwhich contaminants are distributed between a mobile aqueous phase and an immobile solid phase (e.g.,soil). An increasing body of evidence indicates that under some subsurface conditions, components ofthe solid phase may exist as mobile colloids1 that may be transported with the flowing water. Subsurface mobile colloids originate from (1) the dispersion of surface or subsurface soils,(2) decementation of secondary mineral phases, and (3) homogeneous precipitation of groundwaterconstituents. Association of contaminants with this additional mobile phase may enhance not only theamount of contaminant that is transported, but also the rate of contaminant transport. Most currentapproaches to predicting contaminant transport ignore this mechanism not because it is obscure orbecause the mathematical algorithms have not been developed, but because little information isavailable on the occurrence, the mineralogical properties, the physicochemical properties, or theconditions conducive to the generation of mobile colloids. There are two primary problems associatedwith studying colloid-facilitated transport of contaminants under natural conditions. First, it is difficultto collect colloids from the subsurface in a manner which minimizes or eliminates sampling artifacts. Second, it is difficult to unambiguously delineate between the contaminants in the mobile-aqueous andmobile-solid phases.
Some contaminants, such as americium, curium, and others, are very insoluble under certaingroundwater conditions. Therefore, care must be taken not to exceed their solubilities when measuringtheir Kd values using laboratory batch and flow-through column techniques. Values of Kd determinedunder such conditions will overestimate the retardation due to the adsorption of the contaminant. Investigators must carefully analyze their results to insure that the Kd values were not measured atoversaturated conditions. If batch Kd measurements are completed for a range of initial contaminantconcentrations for a fixed set of geochemical conditions (e.g., pH), the final dissolved concentrations ofthe contaminant may eventually reach a constant value for those solution concentrations exceeding thesolubility of the contaminant. The resulting sorption isotherm will be a vertical line at the solubilitylimit when plotting the final concentrations of sorbed contaminant (y-axis) as a function of finalconcentrations of dissolved contaminant (x-axis) [see “Isotherm Adsorption Models” in Section 2.3.3in Volume I (EPA, 1999b)]. For Kd values measured using the flow-through column technique withconstant step input [see Section 3.2.3 in Volume I (EPA, 1999b)], the ratio of the contaminantconcentration in the effluent (Ceff) to that in the input at time 0 (zero) (Co) for the effluent (or break-through) curve will never achieve a value of 1.0 when contaminant precipitation has occurred in the soilcolumn. For flow-through measurements with a pulse input, the total mass of contaminant that isdetermined in the collected effluent after Ceff returns to zero will not equal the total mass injected into
3.5
the column due to irreversible precipitation. Moreover, the shape of effluent break-through curve(Ceff/Co) will not be very Gaussian in form and will have a protracted tail.
When planning Kd studies and analyzing the results, investigators can use chemical reaction computermodels, like EPA’s MINTEQA2 geochemical code, to estimate from thermodynamic principlessolubility limits for a contaminant as a function of pH, redox, concentrations of complexing ligands,and temperature [see Section 5 in Volume I (EPA, 1999b)]. The results of these modeling calculationscan be used to set limits for the maximum initial contaminant concentrations to be used in the Kdmeasurements and/or to alert investigators that solubility limits may have been exceeded during thecourse of study. An example of this type of application is described in Section 5.2.4.2 in Volume I(EPA, 1999b).
It is incumbent upon the transport modeler to understand the strengths and weaknesses of thedifferent Kd methods, and perhaps more importantly, the underlying assumption of the methods inorder to properly select Kd values from the literature. The Kd values reported in the literature for anygiven contaminant may vary by as much as six orders of magnitude. An understanding of theimportant geochemical processes and knowledge of the important ancillary parameters affecting thesorption chemistry of the contaminant of interest is necessary for selecting appropriate Kd value(s) forcontaminant transport modeling.

1 Since the publication of Volumes I and II, the EPA has released a new version, Version 4.0, of the MINTEQsoftware package (EPA, 1999a). The software package and documentation are available free on the EPA Internet site: http://www.epa.gov/ceampubl/softwdos.htm
4.1
4.0 Application of Chemical Reaction Models
Computerized chemical reaction models based on thermodynamic principles may be used to calculateprocesses such as aqueous complexation, oxidation/reduction, adsorption/desorption, and mineralprecipitation/dissolution for contaminants in soil-water systems. The capabilities of a chemicalreaction model depend on the models incorporated into its computer code and the availability ofthermodynamic and/or adsorption data for aqueous and mineral constituents of interest. Chemicalreaction models, their utility to understanding the solution chemistry of contaminants, and theMINTEQA2 model in particular are described in detail in Chapter 5 of Volume I (EPA, 1999b).
Chemical reaction models can be used to support evaluations of Kd values and related contaminantmigration and risk assessment modeling predictions. Most models include options for calculating(1) the distribution of complexed and uncomplexed aqueous species for a specified water composition,(2) the dissolved concentration of an element based on the solubility of solids containing that element,and in some instances, (3) the mass of an element adsorbed by ion exchange or surface complexationonto a single, pure mineral phase. Results from aqueous complexation calculations indicate the ionicstate and composition of the dominant aqueous species for a dissolved contaminant present in a soil-water system. This information may in turn be used to substantiate the conceptual model being usedfor calculating the adsorption of a particular contaminant. Solubility calculations provide a means ofpredicting technically defensible maximum concentration limits for contaminants as a function of keycomposition parameters (e.g., pH) for any specific soil-water system. These values may provide morerealistic bounding values for the maximum concentration attainable in a soil-water system when doingrisk assessment calculations. Modeling computations can also be used to examine initial and finalgeochemical conditions associated with laboratory Kd measurements to determine if the measurementswere affected by processes such as mineral precipitation, which might have compromised the derivedKd values.
Although Kd values cannot be predicted a priori with chemical reaction models, modeling results canprovide aqueous speciation and solubility information that is exceedingly valuable in the evaluation ofKd values selected from the literature and/or measured in the laboratory. Moreover, some modelsinclude electrostatic adsorption submodels that may be used to estimate the changes in the compositionof the aqueous phase due to adsorption onto a selected mineral phase such as hematite or amorphousiron oxyhydroxide. These results in turn can be used to back calculate a Kd value. The MINTEQA21 computer code is an equilibrium chemical reaction model. It was developed withEPA funding by originally combining the mathematical structure of the MINEQL code with thethermodynamic database and geochemical attributes of the WATEQ3 code. The MINTEQA2 codeincludes submodels to calculate aqueous speciation/complexation, oxidation-reduction, gas-phaseequilibria, solubility and saturation state (i.e., saturation index), precipitation/dissolution of solid phases,and adsorption. The most current version of MINTEQA2 available from EPA is compiled to executeon a personal computer (PC) using the MS-DOS computer operating system. The MINTEQA2software package includes PRODEFA2, a computer code used to create and modify input files forMINTEQA2.
1 The Nuclear Energy Agency (NEA) is a specialized agency within the Organization for Economic Co-operation andDevelopment (OECD), which is an intergovernmental organization of industrialized countries, based in Paris, France. Funding for the OECD/NEA Thermodynamic Database Project was provided from 17 organizations in 12 countries,including the U.S. Department of Energy (DOE). More information regarding the OECD/NEA ThermodynamicDatabase Project is available on the Internet at: http://www.nea.fr/html/dbtdb/cgi-bin/tdbdocproc.cgi
2 The reviews of thermodynamic data by Rard et al. (1999) and Lemire et al. (2001) were published in hard cover andon companion compact disks (CDs).
4.2
The MINTEQA2 code contains an extensive thermodynamic database for modeling the speciation andsolubility of contaminants and geologically significant constituents in low-temperature, soil-watersystems. Of the contaminants selected for consideration in this project [americium, arsenic, cadmium,cesium, chromium, curium, iodine, lead, neptunium, plutonium, radon, radium, strontium, technetium,thorium, tritium (3H), and uranium], the MINTEQA2 thermodynamic database contains speciation andsolubility reactions for arsenic, including the valence states As(III) and As(V); chromium, including thevalence states Cr(II), Cr(III), and Cr(VI); cadmium; iodide, lead; strontium; and uranium, including thevalence states U(III), U(IV), U(V), and U(VI).
Individual users can supplement and/or update the MINTEQA2 database using thermodynamicconstants listed in published sources. Particularly noteworthy are several extensive, critical reviews ofthermodynamic data for radionuclides completed since 1992 by the Nuclear Energy Agency (NEA)Thermodynamic Database Project of the Organisation for Economic Co-operation and Development(OECD).1 These reviews were conducted by international teams of experts, peer reviewed prior topublication, and commercially published in hard cover. These excellent sources include the reviews ofthermodynamic data for americium (Silva et al., 1995), neptunium (Lemire et al., 2001), plutonium(Lemire et al., 2001), technetium (Rard et al., 1999) and uranium (Grenthe et al., 1992).2 Thethermodynamic data in Grenthe et al. (1992) supersede the uranium thermodynamic database currentlyavailable with MINTEQA2.
The MINTEQA2 code includes seven adsorption model options. The non-electrostatic adsorptionmodels include the activity Kd
act, activity Langmuir, activity Freundlich, and ion exchange models. Theelectrostatic adsorption models include the diffuse layer, constant capacitance, and triple layer models. The MINTEQA2 code does not include an integrated database of adsorption constants and reactionsfor any of the seven models. These data must be supplied by the user as part of the input fileinformation.
Chemical reaction models, such as the MINTEQA2 code, cannot be used a priori to predict a partitioncoefficient, Kd, value. The MINTEQA2 code may be used to calculate the chemical changes that resultin the aqueous phase from adsorption using the more data intensive, electrostatic adsorption models. The results of such calculations in turn can be used to back calculate a Kd value. However, the usermust make assumptions concerning the composition and mass of the dominant sorptive substrate, andsupply the adsorption parameters for surface-complexation constants for the contaminants of interestand the assumed sorptive phase. The EPA (EPA, 1992, 1996) has used the MINTEQA2 model andthis approach to estimate Kd values for several metals under a variety of geochemical conditions andmetal concentrations to support various waste disposal issues. The EPA in its “Soil ScreeningGuidance” determined MINTEQA2-estimated Kd values for barium, beryllium, cadmium, Cr(III),
4.3
Hg(II), nickel, silver, and zinc as a function of pH assuming adsorption on a fixed mass of iron oxide(EPA, 1996; RTI, 1994). The calculations assumed equilibrium conditions, and did not consider redoxpotential or metal competition for the adsorption sites. In addition to these constraints, EPA (1996)noted that this approach was limited by the potential sorbent surfaces that could be considered andavailability of thermodynamic data. Their calculations were limited to metal adsorption on iron oxide,although sorption of these metals to other minerals, such as clays and carbonates, is well known.
Typically, the data required to derive the values of adsorption parameters that are needed as input foradsorption submodels in chemical reaction codes are more extensive than information reported in atypical laboratory batch Kd study. If the appropriate data are reported, it is likely that a user could handcalculate a composition-based Kd value from the data reported in the adsorption study without theneed of a chemical reaction model.
1 When a contaminant is associated with a solid phase, it is commonly not known if the contaminant is adsorbedonto the surface of the solid, absorbed into the structure of the solid, precipitated as a three-dimensional molecularcoating on the surface of the solid, or absorbed into organic matter. “Sorption” will be used in this report as a genericterm devoid of mechanism to describe the partitioning of aqueous phase constituents to a solid phase. Sorption isfrequently quantified by the partition (or distribution) coefficient, Kd.
5.1
5.0 Contaminant Geochemistry and Kd Values
The important geochemical factors affecting the sorption1 of americium (Am), arsenic (As), curium(Cm), iodine (I), neptunium (Np), radium (Ra), and technetium (Tc) are discussed in this chapter. Theobjectives of this chapter are to: (1) provide a “thumb-nail sketch” of the key geochemical processesaffecting sorption of these contaminants, (2) provide references to key experimental and review articlesfor further reading, (3) identify the important aqueous- and solid-phase parameters controllingcontaminant sorption in the subsurface environment, and (4) discuss the availability of sorption dataand Kd values for each contaminant. Unlike the contaminants reviewed in Volume II (EPA, 1999c),the availability of Kd values and/or our understanding of the adsorptive behavior as a function of keygeochemical factors is more restricted for each contaminant reviewed in Volume III. These limitationsprecluded selection of minimum and maximum conservative Kd values as a function of keygeochemical factors as was done for the contaminants in Volume II.
5.1 General
Important chemical speciation, (co)precipitation/dissolution, and adsorption/desorption processes foreach contaminant are discussed. Emphasis of these discussions is directed at describing the generalgeochemistry that occurs in oxic environments containing low concentrations of organic carbonlocated far from a point source (i.e., in the far field). These environmental conditions comprise a largeportion of the contaminated sites of concern to the EPA, DOE, and/or NRC. We found it necessaryto focus on the far-field, as opposed to near-field, geochemical processes for two main reasons. First,the near field frequently contains very high concentrations of salts, acids, bases, and/or contaminantswhich often require unusual chemical or geochemical considerations that are quite different from thosein the far field. Secondly, the differences in chemistry among various near-field environments variesgreatly, further compromising the value of a generalized discussion. Some qualitative discussion of theeffect of high salt conditions and anoxic conditions are presented for contaminants whose sorptionbehavior is profoundly affected by these conditions.
The distribution of aqueous species for each contaminant was calculated for an oxidizing environmentcontaining the water composition listed in Table 5.1 and the chemical equilibria code MINTEQA2(Version 3.10, Allison et al., 1991). The water composition in Table 5.1 is based on a “meancomposition of river water of the world” estimated by Hem (1985). We use this chemical compositionsimply as a proxy for the composition of a shallow groundwater. Obviously, there are significantdifferences between surface waters and groundwater, and considerable variability in the concentrationsof various constituents in surface and groundwater. For example, the concentrations of dissolved gasesand complexing ligands, such as carbonate, may be less in a groundwater as a result of infiltration ofsurface water through the soil column. Additionally, the redox potential of groundwater, especiallydeep groundwater, will likely be more reducing than surface water. As explained later in this chapter,the adsorption and solubility of certain contaminants and radionuclides may be significantly differentunder reducing groundwater conditions compared to oxidizing conditions. However, as explained in
1 “Humic and fulvic acids are breakdown products of cellulose from vascular plants. Humic acids are defined as thealkaline-soluble portion of the organic material (humus) which precipitates from solution at low pH and are generally ofhigh molecular weight. Fulvic acids are the alkaline-soluble portion which remains in solution at low pH and is of lowermolecular weight” (Gascoyne, 1982).
2 Retarded or attenuated (i.e., nonconservative) transport means that the contaminant moves slower than waterthrough geologic material. Nonretarded or nonattenuated (i.e., conservative) transport means that the contaminantmoves at the same rate as water.
5.2
the Foreword, it was necessary to limit the scope of this review to oxidizing conditions. Use of thewater composition in Table 5.1 does not invalidate the aqueous speciation calculations discussed laterin this chapter relative to the behavior of the selected contaminants in oxidizing and transitionalgroundwater systems. The calculations demonstrate what complexes might exist for a givencontaminant in any oxidizing water as a function of pH and the specified concentrations of eachinorganic ligand. If the concentration of a complexing ligand, such as phosphate, is less for a site-specific groundwater compared to that used for our calculations, then aqueous complexes containingthat contaminant and ligand may be less important for that water. Importantly, the water compositionin Table 5.1 has a low ionic strength and contains no natural (e.g., humic or fulvic acids1) oranthropogenic (e.g., EDTA) organic ligands.
Throughout this chapter, particular attention will be directed at identifying the important aqueous- andsolid-phase parameters controlling retardation2 of contaminants by sorption in soil. This informationwas used to guide the review and discussion of published Kd values according to the importantchemical, physical, and mineralogical characteristics or variables. Perhaps more importantly, we choseparameters that are readily available. For instance, particle size and pH data are often available, whereassuch parameters as abundance of iron oxide or surface area are not as frequently available.

5.3
Table 5.1. Estimated mean composition of river water of the world from Hem (1985).
Dissolved ConstituentTotal Concentration1
mg/l mol/l
Silica, as H4SiO4 20.8 2.16 x 10⁻⁴
Ca 15 3.7 x 10⁻⁴
Mg 4.1 1.7 x 10⁻⁴
Na 6.3 2.7 x 10⁻⁴
K 2.3 5.9 x 10⁻⁵
Inorganic Carbon, as CO3 57 9.5 x 10⁻⁴
SO4 11 1.1 x 10⁻⁴
Cl 7.8 2.2 x 10⁻⁴
F 1 5 x 10⁻⁵
NO3 1 2 x 10⁻⁵
PO4 0.0767 8.08 x 10⁻⁷
1 Most values from this table were taken from Hem (1985: Table 3,column 3). Mean concentrations of total dissolved fluoride andphosphate are not listed in Hem (1985, Table 3). The concentrationof dissolved fluoride was taken from Hem (1985, p. 120) who statesthat the concentration of total dissolved fluoride is generally less than1.0 mg/l for most natural waters. Hem (1985, p. 128) lists 25 µg/lfor average concentration of total dissolved phosphorous in riverwater estimated by Meybeck (1982). This concentration of totalphosphorus was converted to total phosphate (PO4) listed above.
5.2 Americium Geochemistry and Kd Values
5.2.1 Overview: Important Aqueous- and Solid-Phase Parameters Controlling Retardation
Americium is a transuranic (actinide) element, and can exist in the +3 oxidation state in natural waters. Over the pH range of most natural waters, dissolved americium III (Am(III)) is present primarily as theuncomplexed cation Am3+ in moderately to highly acidic conditions, and aqueous americium carbonatecomplexes in near neutral to alkaline pH conditions. Americium readily sorbs to soil, mineral, andcrushed rock materials, and exhibits high Kd values. Americium is therefore considered to be immobilein soil environments. However, the tendency of americium to strongly adsorb to soil particles indicatesthat there is potential for colloid-facilitated transport of americium. Concentrations of dissolvedamericium may be controlled by precipitation of hydroxide or carbonate solids in some systems.
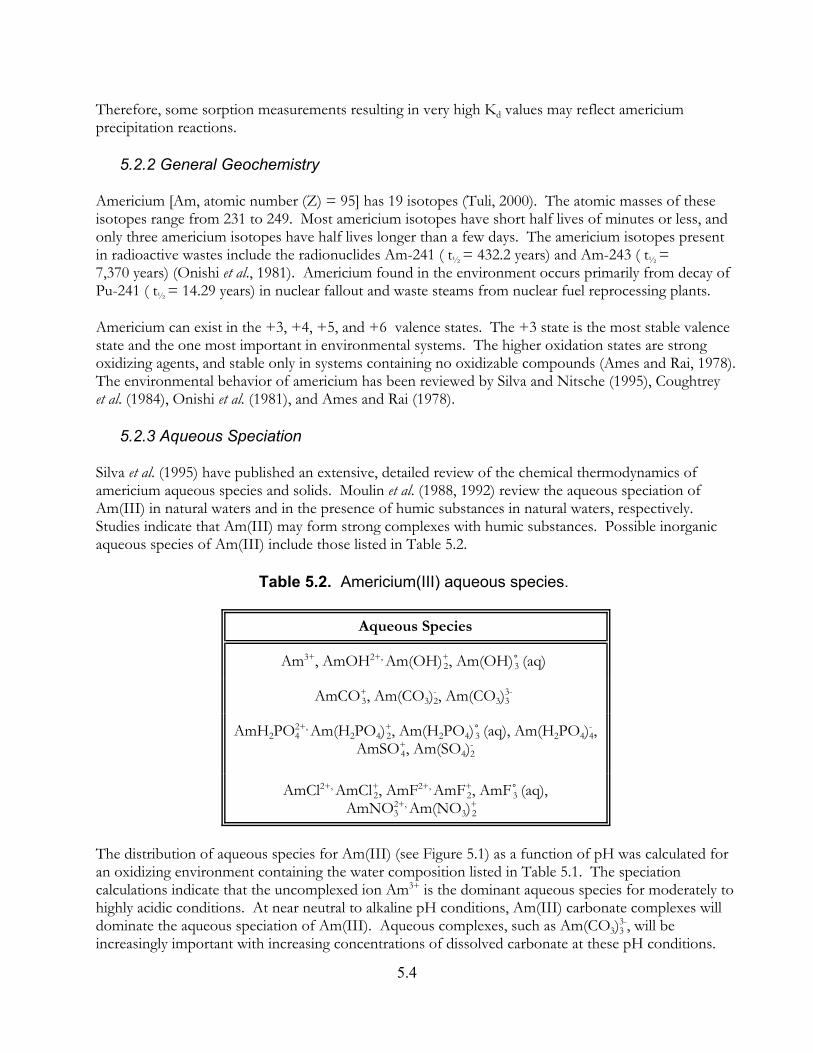
5.4
Therefore, some sorption measurements resulting in very high Kd values may reflect americiumprecipitation reactions.
5.2.2 General Geochemistry
Americium [Am, atomic number (Z) = 95] has 19 isotopes (Tuli, 2000). The atomic masses of theseisotopes range from 231 to 249. Most americium isotopes have short half lives of minutes or less, andonly three americium isotopes have half lives longer than a few days. The americium isotopes presentin radioactive wastes include the radionuclides Am-241 ( t½ = 432.2 years) and Am-243 ( t½ =7,370 years) (Onishi et al., 1981). Americium found in the environment occurs primarily from decay ofPu-241 ( t½ = 14.29 years) in nuclear fallout and waste steams from nuclear fuel reprocessing plants.
Americium can exist in the +3, +4, +5, and +6 valence states. The +3 state is the most stable valencestate and the one most important in environmental systems. The higher oxidation states are strongoxidizing agents, and stable only in systems containing no oxidizable compounds (Ames and Rai, 1978). The environmental behavior of americium has been reviewed by Silva and Nitsche (1995), Coughtreyet al. (1984), Onishi et al. (1981), and Ames and Rai (1978).
5.2.3 Aqueous Speciation
Silva et al. (1995) have published an extensive, detailed review of the chemical thermodynamics ofamericium aqueous species and solids. Moulin et al. (1988, 1992) review the aqueous speciation ofAm(III) in natural waters and in the presence of humic substances in natural waters, respectively. Studies indicate that Am(III) may form strong complexes with humic substances. Possible inorganicaqueous species of Am(III) include those listed in Table 5.2.
Table 5.2. Americium(III) aqueous species.
Aqueous Species
Am3+, AmOH2+, Am(OH)2+, Am(OH)3/ (aq)
AmCO3+, Am(CO3)2
- , Am(CO3)33-
AmH2PO42+, Am(H2PO4)2
+, Am(H2PO4)3/ (aq), Am(H2PO4)4- ,
AmSO4+, Am(SO4)2
-
AmCl2+, AmCl2+, AmF2+, AmF2
+, AmF3/ (aq),AmNO3
2+, Am(NO3)2+
The distribution of aqueous species for Am(III) (see Figure 5.1) as a function of pH was calculated foran oxidizing environment containing the water composition listed in Table 5.1. The speciationcalculations indicate that the uncomplexed ion Am3+ is the dominant aqueous species for moderately tohighly acidic conditions. At near neutral to alkaline pH conditions, Am(III) carbonate complexes willdominate the aqueous speciation of Am(III). Aqueous complexes, such as Am(CO3)3
3-, will beincreasingly important with increasing concentrations of dissolved carbonate at these pH conditions.
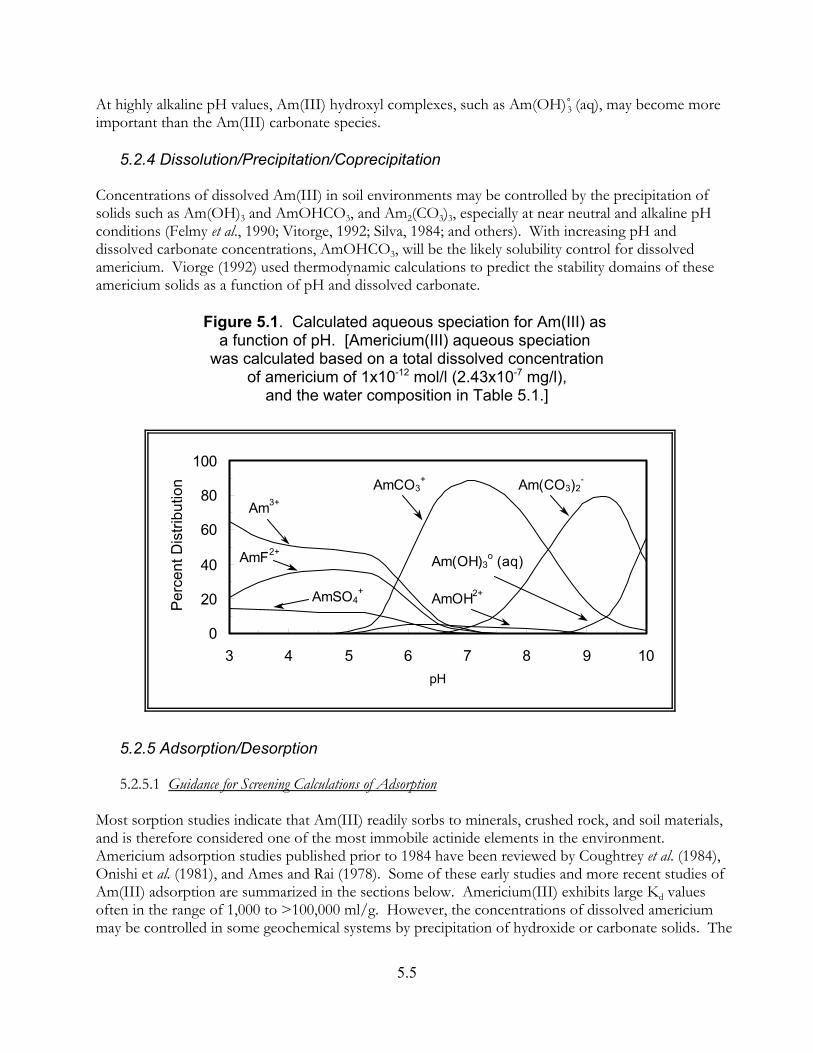
5.5
0
20
40
60
80
100
3 4 5 6 7 8 9 10pH
Per
cent
Dis
tribu
tion
Am3+
AmF2+
AmSO4+
AmCO3+ Am(CO3)2
-
Am(OH)3o (aq)
AmOH2+
At highly alkaline pH values, Am(III) hydroxyl complexes, such as Am(OH)3/ (aq), may become moreimportant than the Am(III) carbonate species.
5.2.4 Dissolution/Precipitation/Coprecipitation
Concentrations of dissolved Am(III) in soil environments may be controlled by the precipitation ofsolids such as Am(OH)3 and AmOHCO3, and Am2(CO3)3, especially at near neutral and alkaline pHconditions (Felmy et al., 1990; Vitorge, 1992; Silva, 1984; and others). With increasing pH anddissolved carbonate concentrations, AmOHCO3, will be the likely solubility control for dissolvedamericium. Viorge (1992) used thermodynamic calculations to predict the stability domains of theseamericium solids as a function of pH and dissolved carbonate.
Figure 5.1. Calculated aqueous speciation for Am(III) as a function of pH. [Americium(III) aqueous speciation
was calculated based on a total dissolved concentration of americium of 1x10-12 mol/l (2.43x10⁻⁷ mg/l),
and the water composition in Table 5.1.]
5.2.5 Adsorption/Desorption
5.2.5.1 Guidance for Screening Calculations of Adsorption
Most sorption studies indicate that Am(III) readily sorbs to minerals, crushed rock, and soil materials,and is therefore considered one of the most immobile actinide elements in the environment. Americium adsorption studies published prior to 1984 have been reviewed by Coughtrey et al. (1984),Onishi et al. (1981), and Ames and Rai (1978). Some of these early studies and more recent studies ofAm(III) adsorption are summarized in the sections below. Americium(III) exhibits large Kd valuesoften in the range of 1,000 to >100,000 ml/g. However, the concentrations of dissolved americiummay be controlled in some geochemical systems by precipitation of hydroxide or carbonate solids. The
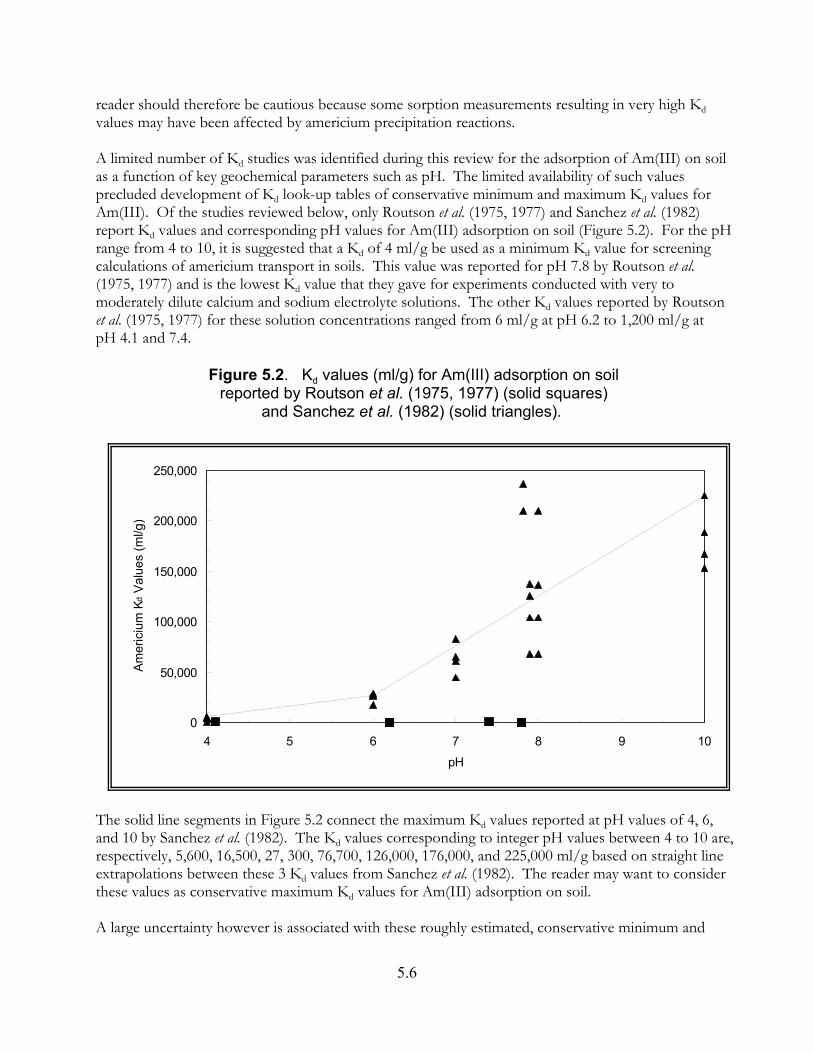
5.6
0
50,000
100,000
150,000
200,000
250,000
4 5 6 7 8 9 10
pH
Am
eric
ium
Kd
Val
ues
(ml/g
)
reader should therefore be cautious because some sorption measurements resulting in very high Kdvalues may have been affected by americium precipitation reactions.
A limited number of Kd studies was identified during this review for the adsorption of Am(III) on soilas a function of key geochemical parameters such as pH. The limited availability of such valuesprecluded development of Kd look-up tables of conservative minimum and maximum Kd values forAm(III). Of the studies reviewed below, only Routson et al. (1975, 1977) and Sanchez et al. (1982)report Kd values and corresponding pH values for Am(III) adsorption on soil (Figure 5.2). For the pHrange from 4 to 10, it is suggested that a Kd of 4 ml/g be used as a minimum Kd value for screeningcalculations of americium transport in soils. This value was reported for pH 7.8 by Routson et al.(1975, 1977) and is the lowest Kd value that they gave for experiments conducted with very tomoderately dilute calcium and sodium electrolyte solutions. The other Kd values reported by Routsonet al. (1975, 1977) for these solution concentrations ranged from 6 ml/g at pH 6.2 to 1,200 ml/g atpH 4.1 and 7.4.
Figure 5.2. Kd values (ml/g) for Am(III) adsorption on soil reported by Routson et al. (1975, 1977) (solid squares)
and Sanchez et al. (1982) (solid triangles).
The solid line segments in Figure 5.2 connect the maximum Kd values reported at pH values of 4, 6,and 10 by Sanchez et al. (1982). The Kd values corresponding to integer pH values between 4 to 10 are,respectively, 5,600, 16,500, 27, 300, 76,700, 126,000, 176,000, and 225,000 ml/g based on straight lineextrapolations between these 3 Kd values from Sanchez et al. (1982). The reader may want to considerthese values as conservative maximum Kd values for Am(III) adsorption on soil.
A large uncertainty however is associated with these roughly estimated, conservative minimum and
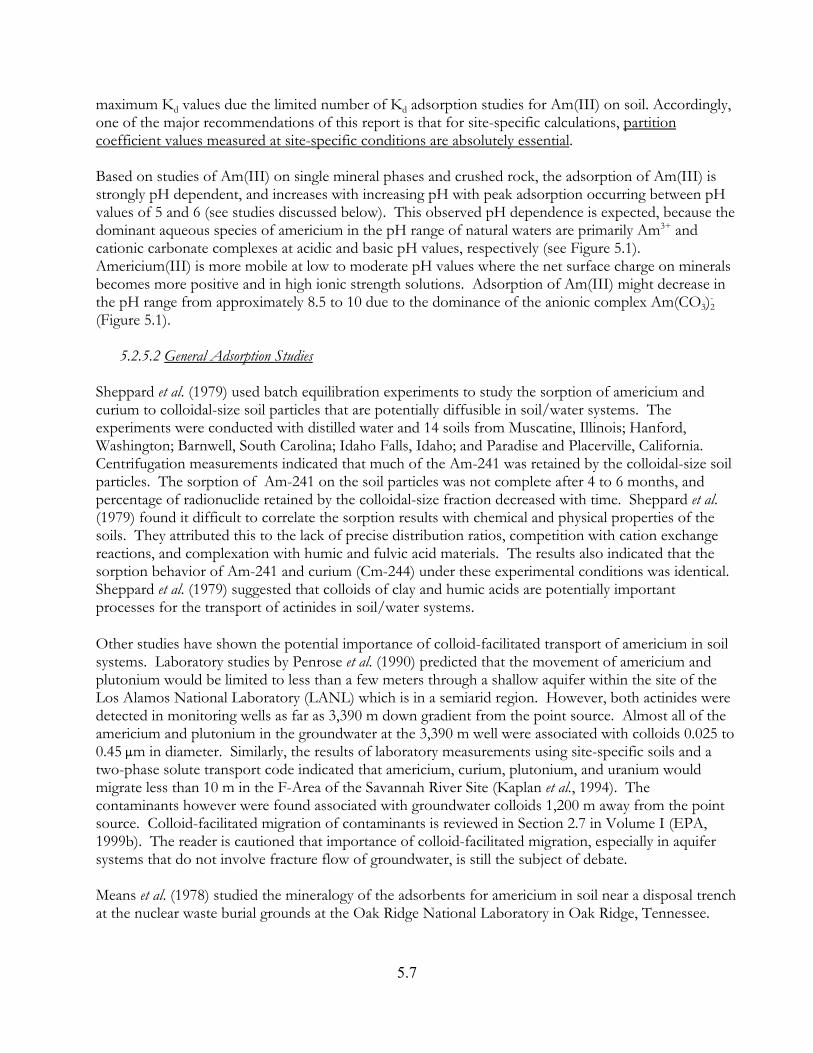
5.7
maximum Kd values due the limited number of Kd adsorption studies for Am(III) on soil. Accordingly,one of the major recommendations of this report is that for site-specific calculations, partitioncoefficient values measured at site-specific conditions are absolutely essential.
Based on studies of Am(III) on single mineral phases and crushed rock, the adsorption of Am(III) isstrongly pH dependent, and increases with increasing pH with peak adsorption occurring between pHvalues of 5 and 6 (see studies discussed below). This observed pH dependence is expected, because thedominant aqueous species of americium in the pH range of natural waters are primarily Am3+ andcationic carbonate complexes at acidic and basic pH values, respectively (see Figure 5.1). Americium(III) is more mobile at low to moderate pH values where the net surface charge on mineralsbecomes more positive and in high ionic strength solutions. Adsorption of Am(III) might decrease inthe pH range from approximately 8.5 to 10 due to the dominance of the anionic complex Am(CO3)2
-
(Figure 5.1).
5.2.5.2 General Adsorption Studies
Sheppard et al. (1979) used batch equilibration experiments to study the sorption of americium andcurium to colloidal-size soil particles that are potentially diffusible in soil/water systems. Theexperiments were conducted with distilled water and 14 soils from Muscatine, Illinois; Hanford,Washington; Barnwell, South Carolina; Idaho Falls, Idaho; and Paradise and Placerville, California. Centrifugation measurements indicated that much of the Am-241 was retained by the colloidal-size soilparticles. The sorption of Am-241 on the soil particles was not complete after 4 to 6 months, andpercentage of radionuclide retained by the colloidal-size fraction decreased with time. Sheppard et al.(1979) found it difficult to correlate the sorption results with chemical and physical properties of thesoils. They attributed this to the lack of precise distribution ratios, competition with cation exchangereactions, and complexation with humic and fulvic acid materials. The results also indicated that thesorption behavior of Am-241 and curium (Cm-244) under these experimental conditions was identical. Sheppard et al. (1979) suggested that colloids of clay and humic acids are potentially importantprocesses for the transport of actinides in soil/water systems.
Other studies have shown the potential importance of colloid-facilitated transport of americium in soilsystems. Laboratory studies by Penrose et al. (1990) predicted that the movement of americium andplutonium would be limited to less than a few meters through a shallow aquifer within the site of theLos Alamos National Laboratory (LANL) which is in a semiarid region. However, both actinides weredetected in monitoring wells as far as 3,390 m down gradient from the point source. Almost all of theamericium and plutonium in the groundwater at the 3,390 m well were associated with colloids 0.025 to0.45 :m in diameter. Similarly, the results of laboratory measurements using site-specific soils and atwo-phase solute transport code indicated that americium, curium, plutonium, and uranium wouldmigrate less than 10 m in the F-Area of the Savannah River Site (Kaplan et al., 1994). Thecontaminants however were found associated with groundwater colloids 1,200 m away from the pointsource. Colloid-facilitated migration of contaminants is reviewed in Section 2.7 in Volume I (EPA,1999b). The reader is cautioned that importance of colloid-facilitated migration, especially in aquifersystems that do not involve fracture flow of groundwater, is still the subject of debate.
Means et al. (1978) studied the mineralogy of the adsorbents for americium in soil near a disposal trenchat the nuclear waste burial grounds at the Oak Ridge National Laboratory in Oak Ridge, Tennessee.

5.8
Their analyses indicated that americium concentrations were highly correlated to the concentrations ofmanganese oxides, even though the concentrations of iron oxyhydroxides and organic carbon weresignificantly greater than those of manganese oxides. Means et al. (1978) expected americium to beadsorbed by iron oxyhydroxides, but their correlation coefficients for americium sorption versus totaliron oxyhydroxides and organic carbon matter were low.
5.2.5.3 Kd Studies for Americium on Soil Materials
Carroll et al. (1999) investigated the sorption of radionuclides in waters and sediments from the ArcticSea. Field and laboratory Kd batch measurements were made for the sorption of americium usingfreshly collected sediment and water samples from stations in the Novaya Zemlya Trough and on thecontinental shelf of the Ob/Yenisey Rivers. The Kd values measured for americium ranged from 7x10³
to 1.1x10⁶ ml/g.
Nakayama and Nelson (1988) measured the pH dependency of Kd values for the sorption of 243Am andCM-244 onto sediment. They found that changes in pH had a significant effect on the adsorption ofthese 2 radionuclides. However, the relative adsorption behaviors of these two radionuclides to eachother were not significantly different as a function of pH.
Table 5.3. Measured Kd values (ml/g) for americium as a function of pH for Hudson River
estuary environment [Sanchez et al. (1982)].
pH
Station Location at Hudson River Estuary for Sediment Samples
MP 0.1 MP 18.6 MP 43.3 MP 59.8
4.0 0.43x10⁴ 0.11x10⁴ 0.43x10⁴ 0.56x10⁴
6.0 2.91x10⁴ 1.77x10⁴ 2.67x10⁴ 2.73x10⁴
7.0 8.24x10⁴ 4.5x10⁴ 6.12x10⁴ 6.5x10⁴
8.0 13.7x10⁴ 21.0x10⁴ 10.43x10⁴ 6.8x10⁴
10.0 18.9x10⁴ 22.5x10⁴ 16.7x10⁴ 15.3x10⁴
Burton et al. (1986) studied the sorption of americium on intertidal sediment from the RavenglassEstuary in seawater from the North Sea. The Kd values were of the magnitude 103-104 ml/g. Resultsfrom desorption experiments conducted with seawater diluted with river water indicated that the Kdvalues were essentially constant at salinities from 34 to 2-5%, and decreased by 2 orders of magnitudeat salinities less than 2-5%. Burton et al. (1986) attributed this decrease in Kd in part to a decrease inpH.
Sanchez et al. (1982) used the batch method to measure Kd values for americium for a variety offreshwater, estuarine, and marine environments. The adsorption Kd values ranged from 6.76x10⁴ to2.27x106 ml/g for all environments studied. Experiments conducted as a function of pH (Table 5.3.)
5.9
indicated that the Kd values increased with increasing pH. The americium Kd values increased by afactor of 5 over the pH range 4 to 6, and continued to increase at high pH values. Sanchez et al. (1982)found no apparent effect of salinity on the americium Kd values.
Table 5.4. Measured americium Kd values (ml/l) and soil properties for soils studied by Nishita et al. (1981).
SoilType
pH1OM2
Fraction(%)
CEC3
(meq/100g)
Free FeOxides
(%)
Mn4
Fraction(%)
ExtractpH
Kd
(ml/g)
Silt Clay LoamSharpsburg 5.9 2.8 20 1.29 0.06 5.41
6.5629,80017,280
Sandy LoamMalbis 5.3 2.4 15 1.65 0.05 4.39
5.719,6358,063
Sandy LoamLyman 5.0 5.7 15 1.52 0.04 4.58
6.171,549
182
Silty ClayHoltsville 7.8 0.6 30 1.20 0.04 7.12
8.0435,63047,230
LoamAiken 6.0 8.4 15 5.29 0.10 5.71
6.7221,87010,660
Silt LoamYolo 6.7 2.5 25 2.41 0.08 6.12
6.9823,87020,210
MuckEgbert 7.2 40.8 60 1.57 0.10 7.14
7.547,2665,529
1 Saturated paste. 4 In 4 M HNO3 extract.2 Organic matter.3 Cation Exchange Capacity
Nishita et al. (1981) studied the extractability of Am-241 from several types of soils as a function of pH. The extractability of americium was considered to parallel the solubilization of aluminum, iron, and/ormanganese hydrous oxides, which are important adsorbents for dissolved contaminants in soil systems(Nishita et al., 1981). The americium Kd values and soil characteristics determined for these soils byNishita et al. (1981) are listed in Table 5.4. At pH values more acidic than those studied, Nishita et al.(1981) suggested that americium would be present in ionic form and highly mobile. At higher pHvalues, americium formed hydroxyl complexes that were readily sorbed by the soils.
Routson et al. (1975, 1977) used batch equilibration experiments to measure Kd values for Am-241 on2 soils as a function of the concentrations of dissolved calcium and sodium. The soil samples wereselected to represent a range of weathering intensities. For arid conditions in the western United States,a sandy (coarse-textured), low-exchange capacity soil was selected from a low rainfall area in easternWashington. For humid conditions in southeastern United States, a moderate-exchange capacity soil

5.10
was selected from South Carolina. Properties of the soils used for these measurements are listed inTable 5.5.
Table 5.5. Properties of soils used in Kd measurements by Routson et al. (1975, 1977).
SoilCaCO3
(mg/g)Silt(%)
Clay(%)
CEC(meq/100 g)
pH
Washington 0.8 10.1 0.5 4.9 7.0
South Carolina <0.2 3.6 37.2 2.5 5.1
The Kd values were measured in 0.002, 0.02, 0.05, 0.10, and 0.20 M Ca(NO3)2 solutions, and 0.015,0.030, 0.30, 0.75, and 3.0 M NaNO3 solutions. The pH values for selected samples of the Am-241solutions in the calcium and sodium systems were 6.9 and 4.1 for the Washington soil, and 7.1 and 6.1for the South Carolina soil. The Kd values decreased with increasing concentrations of dissolvedcalcium and sodium. For the solution concentrations used in these experiments, the Kd values for Am-241 on the South Carolina soil ranged from 67 to 1.0 ml/g as a function of dissolved calcium, and 280to 1.6 ml/g as a function of dissolved sodium. For the Washington soil, the Kd values were>1,200 ml/g, and were independent of the concentrations of dissolved calcium and sodium. Theircalculated Kd values ranged from 1,200 to 8,700 ml/g. The sorption of Am-241 on the Washingtonsoil was greater than that expected by investigators.
5.2.5.4 Published Compilations Containing Kd Values for Americium
Because the references in this section are often cited or used for comparison in other publications, thefollowing summaries are provided for completeness. It is recommended that the reader review theoriginal reference and the references cited therein to understand the procedures and sources of the Kdvalues used for each compilation. The compilations do not typically consider important factors thatcontribute to variability in sorption, such as pH. Moreover, in cases where very large Kd values arelisted, there is a risk that the original Kd measurement may have included precipitated components.
Baes and Sharp (1983) present a simple model developed for order-of-magnitude estimates for leachingconstants for solutes in agricultural soils. As part of this model development, they reviewed anddetermined generic default values for input parameters, such as Kd. A literature review was completedto evaluate appropriate distributions for Kd values for various solutes, including americium. BecauseBaes and Sharp (1983) are cited frequently as a source of Kd values in other published Kd reviews (e.g.,Looney et al., 1987, Sheppard and Thibault, 1990), the americium Kd values listed by Baes and Sharp arereported here for completeness. Based on the distribution that Baes and Sharp determined for the Kdvalues for cesium and strontium, they assumed a lognormal distribution for the Kd values for all otherelements in their compilation. Baes and Sharp listed an estimated default Kd of 810 ml/g foramericium based on 46 Kd values that ranged from 1.0 to 47,230 ml/g for agricultural soils and clays

5.11
over the pH range 4.5 to 9.0. Their compiled Kd values represent a diversity of soils, pure clays (otherKd values for pure minerals were excluded), extracting solutions, measurement techniques, andexperimental error.
Looney et al. (1987) tabulated estimates for geochemical parameters needed for environmentalassessments of waste sites at DOE’s Savannah River Plant in South Carolina. Looney et al. list Kdvalues for several metal and radionuclide contaminants based on values that they found in one to fivepublished sources. For americium, Looney et al. list a “recommended” Kd of 100 ml/g, and a rangefrom 1 to 100,000 ml/g. Looney et al. note that their recommended values are specific to the SavannahRiver Plant site, and they must be carefully reviewed and evaluated prior to use in assessments at othersites.
Table 5.6. Americium Kd values (ml/g) listed by Thibault et al. (1990, Tables 4 to 8).
Soil Type
Kd Values (ml/g)
GeometricMean
Number ofObservations
Range
Sand 1,900 29 8.2 - 300,000
Silt 9,600 20 400 - 48,309
Clay 8,400 11 25 - 400,000
Organic 112,000 5 6,398 - 450,000
Thibault et al. (1990) (also see Sheppard and Thibault, 1990) present a compilation of soil Kd valuesprepared to support radionuclide migration assessments for a Canadian geologic repository for spentnuclear fuel in Precambrian Shield plutonic rock. Thibault et al. collected Kd values from othercompilations, journal articles, and government laboratory reports for important elements, such asamericium, that would be present in the nuclear fuel waste inventory. The americium Kd values listedin Thibault et al. (1990) are included in Table 5.6. Thibault et al. (1990) describe the statistical methodsused for analysis of the compiled Kd values. The range for the Kd values used to calculate the“geometric mean” cover several orders of magnitude. Readers are cautioned against using “geometricmean” values or any other form of averaged Kd values as “default” Kd values, as such values are usuallycalculated from data compiled from different investigators for different soil systems. These mean oraverage values do not represent any particular environmental system and geochemical conditions. Asdiscussed in Volume I (EPA, 1999b), the variation observed in the literature for Kd values for acontaminant is due to differences in sorption mechanisms, geochemical conditions, soil materials, andmethods used for the measurements.
McKinley and Scholtis (1993) compare radionuclide Kd sorption databases used by differentinternational organizations for performance assessments of repositories for radioactive wastes. Theamericium Kd values listed in McKinley and Scholtis (1993, Tables 1, 2, and 4) are listed in Table 5.7.
5.12
The reader should refer to sources cited in McKinley and Scholtis (1993) for details regarding theirsource, derivation, and measurement. Radionuclide Kd values listed for cementitious environments inMcKinley and Scholtis (1993, Table 3) are not included in Table 5.7. The organizations listed in thetables include: AECL (Atomic Energy of Canada Limited); GSF (Gesellschaft für Strahlen- undUmweltforschung m.b.H., Germany); IAEA (International Atomic Energy Agency, Austria); KBS(Swedish Nuclear Safety Board); NAGRA [Nationale Genossenschaft für die Lagerung radioaktiverAbfälle (Swiss National Cooperation for Storage of Radioactive Waste), Switzerland]; NIREX (UnitedKingdom Nirex Ltd.); NRC (U.S. Nuclear Regulatory Commission); NRPB (National RadiologicalProtection Board, United Kingdom); PAGIS [Performance Assessment of Geological IsolationSystems, Commission of the European Communities (CEC), Belgium; as well as PAGIS SAFIR(Safety Assessment and Feasibility Interim Report]; PSE (Projekt Sicherheitsstudien Entsorgung,Germany); RIVM [Rijksinstituut voor Volksgezondheid en Milieuhygience (National Institute of PublicHealth and Environment Protection), Netherlands]; SKI [Statens Kärnkraftinspektion (SwedishNuclear Power Inspectorate)]; TVO [Teollisuuden Voima Oy (Industrial Power Company), Finland];and UK DoE (United Kingdom Department of the Environment).
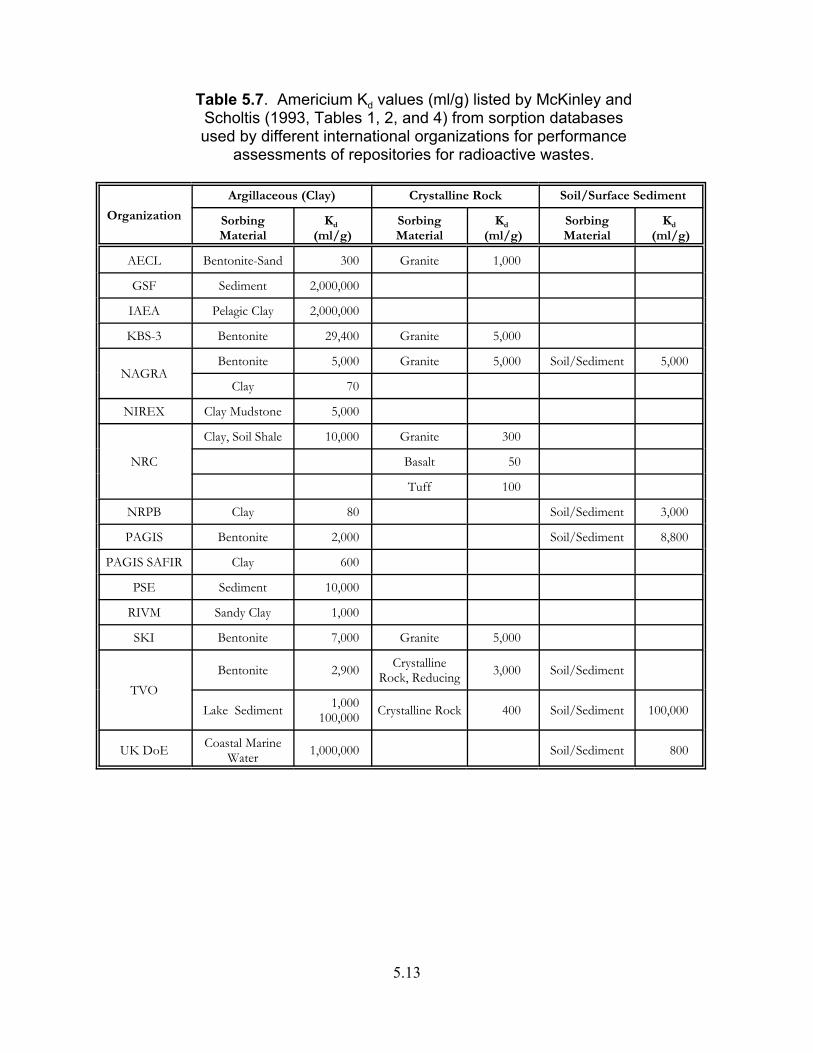
5.13
Table 5.7. Americium Kd values (ml/g) listed by McKinley and Scholtis (1993, Tables 1, 2, and 4) from sorption databases used by different international organizations for performance
assessments of repositories for radioactive wastes.
Organization
Argillaceous (Clay) Crystalline Rock Soil/Surface Sediment
SorbingMaterial
Kd (ml/g)
SorbingMaterial
Kd (ml/g)
SorbingMaterial
Kd (ml/g)
AECL Bentonite-Sand 300 Granite 1,000
GSF Sediment 2,000,000
IAEA Pelagic Clay 2,000,000
KBS-3 Bentonite 29,400 Granite 5,000
NAGRABentonite 5,000 Granite 5,000 Soil/Sediment 5,000
Clay 70
NIREX Clay Mudstone 5,000
NRC
Clay, Soil Shale 10,000 Granite 300
Basalt 50
Tuff 100
NRPB Clay 80 Soil/Sediment 3,000
PAGIS Bentonite 2,000 Soil/Sediment 8,800
PAGIS SAFIR Clay 600
PSE Sediment 10,000
RIVM Sandy Clay 1,000
SKI Bentonite 7,000 Granite 5,000
TVOBentonite 2,900 Crystalline
Rock, Reducing 3,000 Soil/Sediment
Lake Sediment 1,000100,000 Crystalline Rock 400 Soil/Sediment 100,000
UK DoE Coastal MarineWater 1,000,000 Soil/Sediment 800
5.14
5.2.5.5 Kd Studies of Americium on Pure Mineral, Oxide, and Crushed Rock Materials
Numerous adsorption studies have been conducted of americium on pure minerals, oxide phases, andother geologic-related materials. The Kd values listed in these studies are not necessarily relevant tothe mobility and sorption of americium in soils. However, they are listed in Appendix C forcompleteness. The references cited in Appendix C are listed in the main reference list in Chapter 6. The potential value of the references that they cite and the sorption processes that they discuss is leftto the reader. The studies of americium sorption on crushed rock were conducted typically as part ofnational research programs to investigate the feasibility of geological disposal of high-level radioactivewaste (HLW).
5.3 Arsenic Geochemistry and Kd Values
5.3.1 Overview: Important Aqueous- and Solid-Phase Parameters ControllingRetardation
Arsenic is a known carcinogen, and occurs in natural systems in the +5 (arsenate) and +3 (arsenite)valence states. Arsenic(III) (As(III)) is more mobile (adsorbs less) and is many times more toxic thanAs(V). The pH and redox conditions are the two most important geochemical factors affecting themobility of arsenic in the environment. Sorption studies indicate that the concentrations of dissolvedAs(V) and As(III) are controlled by adsorption on iron and aluminum oxides and clays. Theadsorption of As(V) is high and independent of pH at acidic pH values, and decreases with increasingpH in the range of 7 to 9. Arsenic(V) adsorption will be decreased in soils with high phosphateconcentrations because of anion competition. Iron-reducing bacteria may cause arsenic mobilizationfrom soils as a consequence of reductive dissolution of iron oxyhydroxide adsorbents. Sulfate-reducing bacteria, in addition, may promote arsenic reduction by producing hydrogen sulfide.
5.3.2 General Geochemistry
Arsenic [As, atomic number (Z) = 33] is a known carcinogen. Arsenic contamination of groundwatermay result from a variety of sources, such as weathering of rocks, mining activities, discharges ofindustrial waste, and application of arsenical herbicides and pesticides. Arsenic exhibits a complexgeochemical behavior. It can occur in the valence states -3, 0, +3, and +5 in natural systems. Arsenic(V) (arsenate) and As(III) (arsenite) are the main valence states of arsenic in natural watersunder oxidizing and reducing conditions, respectively. Elemental (metal) arsenic [As(0)] occurs rarely,and As(-III) exists only at extremely low redox potential (i.e., Eh values). Arsenic(III) is more mobile(adsorbs less) and many times more toxic than As(V). Although As(V) should be the dominantvalence state in oxidizing waters based on thermodynamic considerations, the results of some studiesindicate that As(III) concentrations exceed those of As(V) in some surface waters (Korte andFernando, 1991). Arsenic(III) may be more prevalent than generally believed in such environmentsdue to oxidation/reduction disequilibrium and biotic processes.
It should be noted that only three published studies containing Kd values for arsenic sorption on soilwere identified during the course of this review. This is an important finding given the increasingconcern over arsenic contamination in the environment and associated risks to plants, animal, andhuman health. We suspect that the limited availability of Kd values for arsenic may be related to theKd approach being used prior to the 1990's primarily in risk and site performance assessments
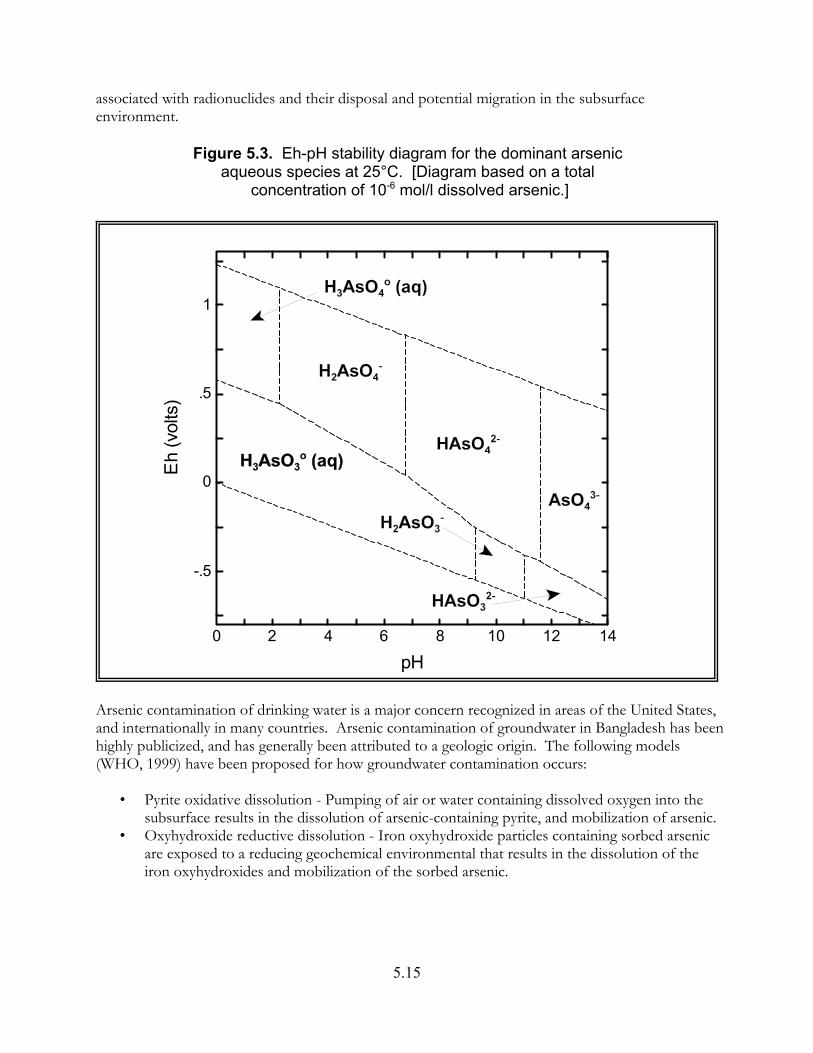
5.15
0 2 4 6 8 10 12 14
-.5
0
.5
1
pH
Eh
(vol
ts)
associated with radionuclides and their disposal and potential migration in the subsurfaceenvironment.
Figure 5.3. Eh-pH stability diagram for the dominant arsenic aqueous species at 25°C. [Diagram based on a total
concentration of 10-6 mol/l dissolved arsenic.]
Arsenic contamination of drinking water is a major concern recognized in areas of the United States,and internationally in many countries. Arsenic contamination of groundwater in Bangladesh has beenhighly publicized, and has generally been attributed to a geologic origin. The following models(WHO, 1999) have been proposed for how groundwater contamination occurs:
• Pyrite oxidative dissolution - Pumping of air or water containing dissolved oxygen into thesubsurface results in the dissolution of arsenic-containing pyrite, and mobilization of arsenic.
• Oxyhydroxide reductive dissolution - Iron oxyhydroxide particles containing sorbed arsenicare exposed to a reducing geochemical environmental that results in the dissolution of theiron oxyhydroxides and mobilization of the sorbed arsenic.
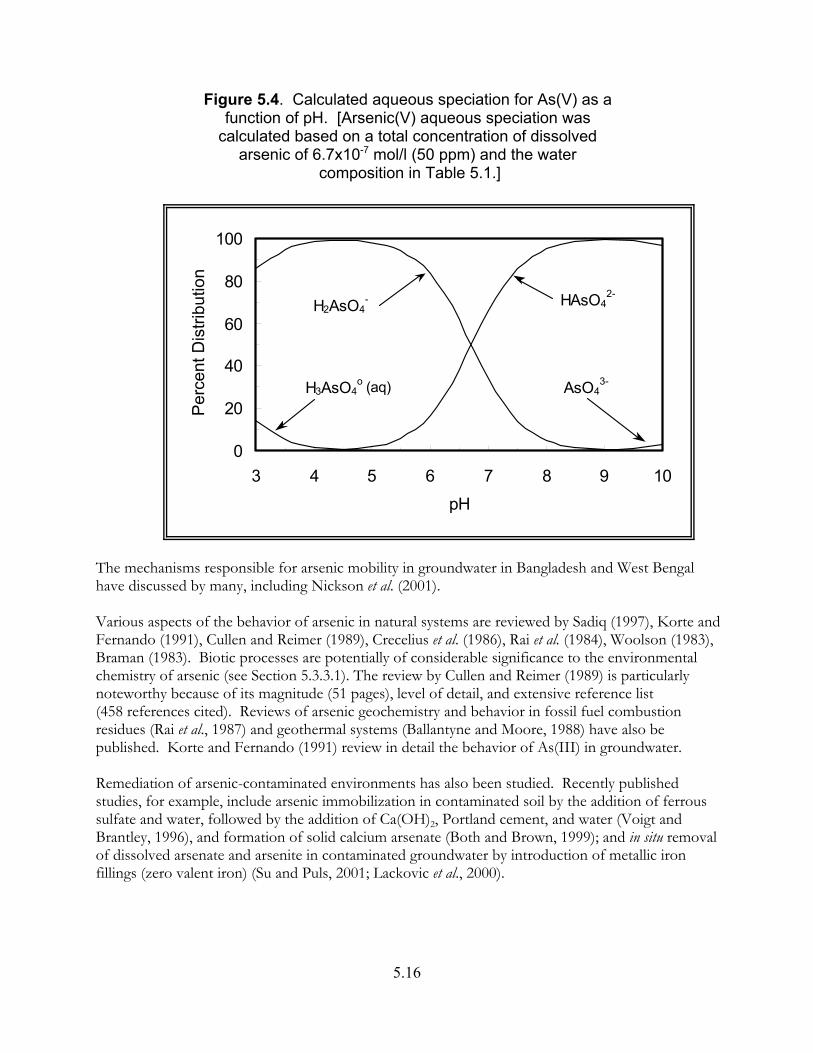
5.16
0
20
40
60
80
100
3 4 5 6 7 8 9 10pH
Per
cent
Dis
tribu
tion
H2AsO4- HAsO4
2-
AsO43- H3AsO4
o (aq)
Figure 5.4. Calculated aqueous speciation for As(V) as a function of pH. [Arsenic(V) aqueous speciation was
calculated based on a total concentration of dissolved arsenic of 6.7x10⁻⁷ mol/l (50 ppm) and the water
composition in Table 5.1.]
The mechanisms responsible for arsenic mobility in groundwater in Bangladesh and West Bengalhave discussed by many, including Nickson et al. (2001).
Various aspects of the behavior of arsenic in natural systems are reviewed by Sadiq (1997), Korte andFernando (1991), Cullen and Reimer (1989), Crecelius et al. (1986), Rai et al. (1984), Woolson (1983),Braman (1983). Biotic processes are potentially of considerable significance to the environmentalchemistry of arsenic (see Section 5.3.3.1). The review by Cullen and Reimer (1989) is particularlynoteworthy because of its magnitude (51 pages), level of detail, and extensive reference list(458 references cited). Reviews of arsenic geochemistry and behavior in fossil fuel combustionresidues (Rai et al., 1987) and geothermal systems (Ballantyne and Moore, 1988) have also bepublished. Korte and Fernando (1991) review in detail the behavior of As(III) in groundwater.
Remediation of arsenic-contaminated environments has also been studied. Recently publishedstudies, for example, include arsenic immobilization in contaminated soil by the addition of ferroussulfate and water, followed by the addition of Ca(OH)2, Portland cement, and water (Voigt andBrantley, 1996), and formation of solid calcium arsenate (Both and Brown, 1999); and in situ removalof dissolved arsenate and arsenite in contaminated groundwater by introduction of metallic ironfillings (zero valent iron) (Su and Puls, 2001; Lackovic et al., 2000).
5.17
5.3.3 Aqueous Speciation
Sadiq and Lindsay (1981) reviewed the thermodynamic data for arsenic aqueous and solids species. They concluded that the majority of thermodynamic constants for arsenic were not reliable. We havenot identified any compilation of arsenic thermodynamic constants more current than Sadiq andLindsay (1981).
The aqueous speciation of dissolved arsenic has been reviewed in detail by Sadiq (1997) and Cullenand Reimer (1989). The stable forms of dissolved arsenic in natural waters are primarily a series ofaqueous As(V) (arsenate, AsO4
3-) and As(III) (arsenite, AsO33-) oxyanion species under oxidizing and
reducing conditions, respectively. Figure 5.3 is an Eh-pH diagram that shows the dominant aqueousspecies of arsenic as a function of pH and Eh (redox potential) at 25°C with respect to thethermodynamic stability of water.
The known aqueous species of As(V) include AsO43-, HAsO4
2-, H2AsO4- , and H3AsO4° (aq) (Wagman
et al., 1982; Sadiq, 1997). The distribution of these As(V) aqueous species (Figure 5.4) as a functionof pH was calculated for an oxidizing environment containing the water composition listed inTable 5.1. The calculations indicate that the oxyanions H2AsO4
- and HAsO42- dominate the aqueous
speciation of As(V) at pH values less than and greater than approximately pH 7, respectively. Because As(V) will be present primarily as anions in oxidizing waters, As(V) is expected to adsorb togeologic materials under acidic conditions and not to adsorb to any significant extent at neutral andalkaline pH conditions. Similarly, the dominate As(III) aqueous species are H3AsO3° (aq) and H2AsO3
-
at pH values less than and greater than approximately pH 9, respectively.
Arsenic is not expected to form aqueous complexes with other inorganic complexing ligands, such asdissolved sulfate, because dissolved arsenic is present in anionic form. However, the results of Kim etal. (2000) indicate that carbonation reactions with arsenic sulfide minerals may be an importantprocess in leaching arsenic into groundwater under anaerobic conditions. Kim et al. (2000)investigated the role of bicarbonate in leaching arsenic from a sandstone into groundwater. Theydetermined that the release of arsenic from arsenic sulfides in the sandstone was strongly related tothe bicarbonate concentrations in the leachate. Kim et al. (2000) proposed that the released As(III)was converted to As(III) carbonate complexes with the presumed compositions As(CO3)2
- ,As(CO3)(OH)2
- , and/or AsCO3+. Kim et al. (2000) expected that once formed, the As(III) carbonate
complexes would be stable under anaerobic groundwater conditions at acidic to neutral pH. Nopublished stability constants are known to exist for such aqueous complexes.
Organoarsenic species, such as methyl arsonic acid (CH3AsO(OH)2) and dimethyl arsenic acid[(CH3)2AsOOH], can be formed by biologically-mediated methylation in the environment, and havebeen detected in soils and aquatic systems. Because their formation requires the involvement ofanaerobic bacteria, the literature refers to the origin of these organoarsenic compounds asbiomethylation. Methylated arsenic species typically comprise only a small fraction of the availablearsenic (Sanders, 1980). Thermodynamic data are not available for such compounds, and no stabilitydiagrams have been published regarding their range of stability (Cullen and Reimer, 1989). Thechemistry, formation, and behavior of these organoarsenic compounds are reviewed by Cullen andReimer (1989) and Sadiq (1997).
5.18
5.3.4 Dissolution/Precipitation/Coprecipitation
Although it can be argued, concentrations of dissolved As(V) in natural waters and soils are not likelycontrolled by formation of arsenic solids unless elevated concentrations of arsenic exist, such as inmining waste waters, industrial waste streams, or fossil fuel combustion residues. The formation ofarsenic solids that would limit the solubility of arsenic in waste waters, natural waters, and soils hasbeen the subject of considerable study and conjecture. For example, see Lumsdon et al. (2001), Davis(2000), Tempel et al. (2000), Rochette et al. (1998); Sadiq (1997), Fruchter et al. (1990), and Crecelius etal. (1986). Searches of mineralogy databases available on the Internet indicate that there are morethan 490 known minerals that contain arsenic as a primary component. These minerals includearsenic sulfides, arsenates, and arsenides, and are present in unique geologic settings such as oredeposits and geothermal settings. Many attempts at identifying possible solubility controls fordissolved As(V) and As(III) have relied on geochemical solubility calculations. Becausethermodynamic constants and kinetic data exist for a very limited number of arsenic solids (Sadiq,1997), and even these data are not well established, arsenic thermodynamic-based solubilitycalculations are problematic at best.
Several investigators have suggested Ba3(AsO4)2 as a solubility-limiting solid for As(V). However,Crecelius et al. (1986) noted that there is no physical evidence for the existence of such a solid ingeologic systems and thus its thermodynamic properties are in error or kinetic constraints inhibit itsprecipitation.
Under reducing conditions in the presence of dissolved sulfide, arsenic sulfide solids, such asorpiment may control the solubility of dissolved As(III). Moreover, pyrite (FeS2) has been found tocontain a significant mass of coprecipitated (i.e., absorbed) arsenic in its crystal structure [e.g., seeSchreiber et al. (2000)], and to be a source and/or solubility control for dissolved As(III).
5.3.5 Adsorption/Desorption
5.3.5.1 Guidance for Screening Calculations of Adsorption
Only three published studies containing Kd values for arsenic sorption on soil were identified duringthe course of our review. These studies are discussed in the sections below. The studies by Cornettet al. (1992) and Mok and Wai (1990) involve sampling environments affected by ore millingoperations and list extremely high Kd values (>1000's ml/g) for arsenic sorption on sediment. Thesehigh Kd values are surprising given the large mobility expected for As(V) and As(III) based on theresults of other published sorption studies at all but the very acidic pH values. The results fromCornett et al. (1992) and Mok and Wai (1990) are therefore suspect and were not considered furtherin this review.
The limited availability of Kd values for arsenic on soil (i.e., 1 study) precluded calculation of Kd look-up tables for arsenic as a function of important geochemical parameters such as pH. Becausedissolved As(V) will exist primarily as anionic aqueous species in the pH range of 4 to10, a Kd valueof 0 ml/g is suggested as a conservative minimum value for site screening calculations of themaximum extent of off-site migration of As(V) in soil. However, one of the major recommendationsof this report, as noted previously, is that for site-specific calculations, partition coefficient valuesmeasured at site-specific conditions are absolutely essential.
5.19
Given the limited availability of As(V) Kd values for soil, readers may want to consider usinggeochemical models [see Section 5 in Volume I (EPA, 1999b)] to estimate the mass of adsorbedAs(V). This approach was recently taken by Lumsdon et al. (2001). Characterization studies indicatedthat hydrous ferric oxide (HFO) was an important mineral in the soils at the site being studied. Assuming that HFO was the dominant adsorbent for As(V) in these soils, Lumsdon et al. (2001) usedthe generalized two-layer surface complexation model (GTLM) and As(III)-HFO surfacecomplexation parameters listed in Dzombak and Morel (1990) to estimate the mass of adsorbedAs(V). Based on the HFO content of the soils, Kd values could then be estimated from the modelingresults.
The results of sorption studies of arsenic on single mineral phases indicate that the concentrations ofdissolved As(V) and As(III) are controlled by adsorption on iron and aluminum oxides and clays. Adsorption of arsenic exhibits a marked pH dependency. While adsorption of As(V) is high andindependent of pH at acidic pH values, adsorption decreases with increasing pH in the range of 7 to9.
At a given pH, the adsorption of As(V) is typically greater than As(III). Arsenic(V) and dissolvedphosphate compete for adsorption sites, and the adsorption of arsenic will be reduced in soils withhigh phosphate concentrations. Microbial-mediated reactions may affect arsenic mobilization in soils. Studies have shown that iron-reducing bacteria may cause arsenic mobilization from soils as aconsequence of reductive dissolution of iron oxyhydroxide adsorbents. Microbial-mediated reactionscan cause the precipitation and dissolution of minerals, and thus affect the mobility of contaminantsin aqueous environments. The interactions between microbes and minerals are reviewed in detailelsewhere, such as Banfield and Nealson (1997). Additionally, sulfate-reducing bacteria may promotearsenic reduction by producing hydrogen sulfide.
5.3.5.2 General Adsorption Studies
Sorption studies conducted with soils indicate that arsenic sorption on soil is a function of the ironoxyhydroxide and clay contents (Manning and Goldberg, 1997b; Wauchope and McDowell, 1984; Livesey and Huang, 1981; Wauchope, 1975, Jacobs et al., 1970; and others). Manning and Goldberg(1997) measured the adsorption of As(V) and As(III) on three arid-zone soils from California as afunction of varying arsenic concentrations, pH, and ionic strength. The greatest extent of As(V) andAs(III) adsorption was measured for the soil having the highest citrate-dithionite extractable iron andpercent clay content. Manning and Goldberg (1997) noted that the arsenic adsorption behavior forthis soil was similar to the arsenic adsorption behavior that they measured for goethite. The sorptionmeasurements also indicated that As(V) adsorbed more strongly than As(III) under most conditions. Wauchope and McDowell (1984) measured the sorption of As(V) on 14 lake sediments collected inthe Delta Mississippi River flood plain. Wauchope and McDowell (1984) found that the extent ofarsenic adsorption was related to the hydrous oxide and clay contents of the sediments. Based ontheir results, Wauchope and McDowell (1984) proposed that the clay content of sediment was thebest predictor for arsenic adsorption in soils and dilute water-sediment mixtures. Wauchope (1975)used batch reaction experiments to study the sorption of As(V) on 16 soils from the Mississippi Riveralluvial flood plain. Wauchope (1975) determined that the sorption of As(V) was strongly correlatedwith the iron oxide and clay contents of the soils. Based on measurements of 24 soils representing arange of chemical and physical properties from throughout Wisconsin, Jacobs et al. (1970) showedthat the mass of sorbed arsenic increased with an increase of the free Fe2O3 content of soil.

5.20
Carrillo and Drever (1998) conducted a series of sorption experiments for As(V) and As(III) on soilstaken from an aquifer in the San Antonio-El Triunfo mining area in Baja California peninsula,Mexico. The aquifer material consisted of quartz, feldspar, calcite, chlorite, illite, andmagnetite/hematite. The experiments were conducted using background electrolyte solutions of 0.1and 0.01 M NaNO3 solutions, and pH ranges of 4 to 13 and 6 to 12 as adjusted with HCl and NaOHsolutions. The observed percent of sorbed total arsenic, As(V), and As(III) versus pH agreed withthat expected for the adsorption of arsenic on iron oxyhydroxides. Sorption of arsenic on the aquifermaterial was high at acidic pH values, and low at alkaline pH values. Arsenic sorption decreasedquickly in the pH range 6 to 9.
Sorption studies have also been conducted to determine the effect on arsenic sorption by thepresence of other anions, such as dissolve phosphate, sulfate, nitrate, and chloride (Reynolds et al.,1999; Livesey and Huang, 1981). The results of these studies indicate that dissolved phosphatecompetes with arsenic for adsorption sites, and thus suppressing arsenic adsorption and enhancingthe mobility of arsenic. Livesey and Huang (1981) found that dissolved sulfate, nitrate, and chloridepresent at concentrations present in saline soils had little effect on arsenic adsorption. As noted previously, As(III) is more mobile and toxic than As(V), and thus redox conditions affectthe relative sorption behavior of As(V) and As(III). Biotic processes affecting the reduction of As(V)to As(III) have recently been the subject of considerable study. Recently published studies confirmthat microbial processes can affect the mobilization of arsenic in environmental systems by a varietyof direct and indirect oxidation/reduction processes (e.g., Ahman et al., 1997; Cummings et al., 1999;Jones et al., 2000; Langner and Inskeep, 2000; Zobrist et al., 2000). Ahman et al. (1997) studied themobilization of solid-phase arsenic in sediment microcosms from the Aberjona Watershed. Sedimentsuspensions were incubated with iron arsenate, which was used as an analogue for sedimentaryarsenic, to investigate the potential for arsenic mobilization by microbial reactions in these sedimentsamples. The results indicated that arsenic could be mobilized by microbial-mediated reductivedissolution of the iron arsenate solids. Arsenic(V) released from the dissolution of the iron arsenatewas also reduced to As(III) under these reducing conditions.
Ahman et al. (1997) also determined that the microbial dissolution/reduction processes could beprevented by sterilization of the sediment suspensions, which helped to confirm that the processeswere microbially mediated.
Cummings et al. (1999) studied arsenic mobilization by dissimilatory iron-reducing bacteria (DIRB). Using the dissimilatory iron-reducing bacterium Shewanella alga strain BrY, their experiments showedthat arsenic could be mobilized from crystalline ferric arsenate (the mineral scorodite, FeAsO4@2H2O)and from As(V) sorbed to sediments from Lake Coeur d’Alene, Idaho. Arsenic mobilization was theresult of dissimilatory (i.e., respiratory) reduction of Fe(III), to Fe(II). Analyses of iron and arsenic inthe solid phases and aqueous solutions indicated that arsenic and iron were present as As(V) andFe(II) in both the solid and aqueous phases. Cummings et al. (1999) concluded that even in theabsence of reduction to As(III), As(V) could be mobilized from sediments by biotic reactions ofdissimilatory iron-reducing bacteria.
Jones et al. (2000) investigated the mechanisms controlling the rates of microbial-mediated reductionof dissolved and adsorbed arsenic. The experiments were conducted with microorganisms obtainedfrom fine loamy agricultural soil that contained naturally elevated concentrations of arsenic. Theresults of microbial-mediated mobilization experiments conducted in the presence of the iron oxides

5.21
goethite or ferrihydrite indicated that the extent of arsenic solubilization depended on the arsenicsurface coverage and on the surface area or crystallinity of the iron oxide phase. During microbial-mediated reduction, the rate of arsenic desorption from ferrihydrite was determined to be two ordersmagnitude greater than that from goethite at similar concentrations of dissolved arsenic. Jones et al.(2000) proposed that this difference in solubilization rates was due to differences in the rates ofreductive dissolution of the iron oxide phases.
Langner and Inskeep (2000) studied the effect of microbial reduction of dissolved As(V) on thedesorption of As(V) sorbed to ferrihydrite in the absence of reductive dissolution of the Fe(III)-oxidesolid phase. The reduction of As(V) was investigated using a glucose-fermenting Clostridium sp. strainCN8 enriched from an arsenic contaminated soil. Despite rapid reduction of dissolved As(V) toAs(III), the sorbed arsenic remained primarily as As(V), and desorption of As(V) was too slow tocause a significant increase in dissolved concentrations of arsenic over the 24-day experiment. Basedon their results, Langner and Inskeep (2000) proposed that the reduction of dissolved As(V) plays aminor role in the remobilization of As(V) sorbed to iron oxyhydroxide phases, and arsenic releasefrom contaminated soils may proceed faster via microbial-mediated reductive dissolution of the ironoxyhydroxides adsorbents.
Zobrist et al. (2000) studied the ability of the baterium Sulfurospirillum barnesii strain SES-3 to reduceAs(V) adsorbed on ferrihydrite and aluminum hydroxide. Their results indicated that cell suspensionof S. barnesii were able to reduce As(V) to As(III) when As(V) is present in solution or when adsorbedon ferrihydrite or aluminum hydroxide. The results from the experiments conducted with aluminumhydroxide show that reduction of adsorbed As(V) does not require microbial-remediated reductivedissolution of ferrihydrite because the aluminum hydroxide does not undergo reductive dissolution.
5.3.5.3 Kd Studies for Arsenic on Soil Materials
Only three published studies containing Kd values for arsenic sorption on soil were identified duringthe course of our review. Only one of the identified published studies listing Kd values for arsenicsorption on soil is reviewed below. In agreement with the other studies of arsenic on single mineralphases and soils (see above), the results of Mariner et al. (1996) indicate a limited extent of arsenicadsorption at alkaline pH values. The other two Kd studies (Cornett et al., 1992; Mok and Wai, 1990)were for environments affected by ore milling operations, and list extremely high Kd values(>1000's ml/g) for arsenic sorption on sediment. These high Kd values are surprising given themobility expected for As(V) and As(III) based on the results of other published sorption studies at allbut the very acidic pH values. Review of the studies by Cornett et al. (1992) and Mok and Wai (1990)indicate that the reported sorption values were desorption Kd studies, which are typically greater thanadsorption Kd values, and were possibly affected by the presence of arsenic in particulate form (i.e.,arsenic minerals) in the sediment as opposed to being adsorbed to iron oxyhydroxide mineralcoatings or clays.
Mariner et al. (1996) investigated the effects of high pH on arsenic mobility in a shallow sandy aquiferat the Commencement Bay Superfund Site in Tacoma, Washington. The groundwater plumecontaminated with arsenic derived from a chemical plant is characterized by high pH and high silicaconcentrations. Values of Kd (Table 5.8) calculated from arsenic analyses of core sediment and porewater samples (i.e., in situ Kd values) at this site decrease by at least an order of magnitude as the pHincreased from 8.5 to 11.

5.22
Table 5.8. Measured arsenic Kd values (ml/g) based on analyses of an arsenic-contaminated aquifer at a Superfund
Site (Mariner et al., 1996).
CoreDepth
(m)Pore
Water pHKd
(ml/g)Core
Depth(m)
PoreWater pH
Kd
(ml/g)
S 6.2 8.48 0.92 T 6.4 9.94 6.46
S 6.4 8.39 1.44 T 6.5 10.1 3.91
S 6.5 8.42 1.76 T 6.7 9.89 1.97
S 6.7 8.37 2.14 T 7.0 10.0 0.44
S 6.8 8.30 2.63 T 7.2 10.4 0.42
S 7.0 8.41 1.57 T 7.3 10.6 0.21
S 7.1 8.39 1.80 T 7.5 10.8 0.14
S 7.3 9.73 0.31 T 7.7 10.8 0.69
S 7.9 10.4 0.19 T 7.8 11.0 0.19
S 8.0 10.5 0.12 T 8.0 10.8 0.28
5.3.5.4 Published Compilations Containing Kd Values for Arsenic
Because the references in this section are often cited or used for comparison in other publications,the following summaries are provided for completeness. It is recommended that the reader reviewthe original reference and the references cited therein to understand the procedures and sources ofthe Kd values used for each compilation. The compilations do not distinguish between oxidationstates for those contaminants that are redox sensitive or consider other important factors thatcontribute to variability in sorption, such as pH. Moreover, in cases where very large Kd values arelisted, there is a risk that the original Kd measurement may have included precipitated components.
Baes and Sharp (1983) present a simple model developed for order-of-magnitude estimates forleaching constants for solutes in agricultural soils. As part of this model development, they reviewedand determined generic default values for input parameters, such as Kd. A literature review wascompleted to evaluate appropriate distributions for Kd values for various solutes, including arsenic. Because Baes and Sharp (1983) are cited frequently as a source of Kd values in other published Kdreviews (e.g., Looney et al., 1987), the arsenic Kd values listed by Baes and Sharp are reported here forcompleteness. Based on the distribution that Baes and Sharp determined for the Kd values forcesium and strontium, they assumed a lognormal distribution for the Kd values for all other elementsin their compilation. Baes and Sharp listed an estimated default Kd of 6.7 ml/g for As(V) based on37 arsenic Kd values from 1.9 to 18 ml/g for agricultural soils and clays in the pH range 4.5 to 9.0. Their compiled Kd values represent a diversity of soils, pure clays (other Kd values for pure mineralswere excluded), extracting solutions, measurement techniques, and experimental error.
5.23
Looney et al. (1987) tabulated estimates for geochemical parameters needed for environmentalassessments of waste sites at DOE’s Savannah River Plant in South Carolina. Looney et al. list Kdvalues for several metal and radionuclide contaminants based on values that they found in 1-5published sources. For arsenic, Looney et al. list a “recommended” Kd of 3.2 ml/g, and a range of 1to 10 ml/g. Looney et al. note that their recommended values are specific to the Savannah RiverPlant site, and must be carefully reviewed and evaluated prior to use in assessments at other sites.
5.3.5.5 Kd Studies of Arsenic on Pure Mineral, Oxide, and Crushed Rock Materials
Numerous adsorption studies have been conducted of arsenic on pure minerals and oxide phases. The Kd values listed in these studies are not necessarily relevant to the mobility and sorption ofarsenic in soils. However, they are listed in Appendix D for completeness. The references cited inAppendix D are listed in the main reference list in Chapter 6. The potential value of the referencesthat they cite and the sorption processes that they discuss is left to the reader. A significant number of arsenic adsorption studies (Appendix D) have been conducted on ironoxyhydroxides and clay minerals. The results of these studies demonstrate thatadsorption/desorption and coprecipitation reactions on these minerals can control the concentrationsof dissolved arsenic. The focus of most of these studies, especially those with iron oxyhydroxidessuch as ferrihydrite, was primarily on understanding the mechanisms for As(V) and As(III)adsorption. The adsorption of both As(V) and As(III) on iron oxyhydroxides and clay mineralsvaries with pH. As expected for the adsorptive behavior of anions, arsenic is strongly sorbed underacid conditions where the net surface charge of most minerals is positive. The extent of As(V)adsorption then decreases with increasing pH in the range of 7 to 9. At alkaline pH conditions,As(V) is expected to be highly mobile because of the negative net surface charge on most minerals. The laboratory studies also indicate that As(V) adsorbs more strongly than As(III) to iron andmanganese oxides. Dissolved As (V) and phosphate compete for adsorption sites, and the sorptionof arsenic will be reduced in soils with high phosphate concentrations. Concentrations of otheranions, such as dissolved chloride, nitrate, and sulfate, appear to have little effect on arsenicadsorption.
No sorption studies of arsenic on crushed rock materials were identified during our review. This wasexpected, because studies of contaminant (radionuclide) sorption on crushed rock materials were/aremotivated by performance and risk assessment studies conducted in support of national programs forthe geologic disposal of nuclear waste and long-lived arsenic radioisotopes are not found in nuclearwaste.

5.24
5.4 Curium Geochemistry and Kd Values
5.4.1 Overview: Important Aqueous- and Solid-Phase Parameters ControllingRetardation
Curium is a transuranic (actinide) element, and can exist in the +3 oxidation state in natural waters.Curium(IV) is not stable in solutions because of self-radiation reactions (Onishi et al., 1981). A verylimited number of laboratory and field studies of the aqueous speciation, solubility, and sorptionbehavior of Cm(III) exist. However, Cm(III) geochemistry is expected and widely accepted to bevery similar to that of Am(III) and trivalent lanthanide elements, such as europium (III), Eu(III). Compared to other actinides, Cm(III) and Am(III) are considered to be immobile in soilenvironments, and both exhibit high Kd values. However, the tendency of curium, like americium, tostrongly adsorb to soil particles indicates that there is potential for colloid-facilitated transport ofcurium. The concentrations of dissolved curium may be controlled by hydroxide or carbonate solidsin some systems. Therefore, some sorption measurements resulting in very high Kd values mayreflect curium precipitation reactions.
5.4.2 General Geochemistry
Curium [Cm, atomic number (Z) = 96] has 21 isotopes (Tuli, 2000). The atomic masses of theseisotopes range from 232 to 252. Most curium isotopes have relatively short half lives of minutes orless. Although both 242Cm ( t½ = 162.8 days) and CM-244 (t½ = 18.1 years) are released to theenvironment from nuclear facilities, CM-244 is probably more significant due to its longer half life(Coughtrey et al., 1984).
Balsley et al. (1997) Curium can exist in the +3 and +4 valence states, but the +3 state is the dominantvalence state in natural waters. Curium(IV) is not stable in solutions because of self-radiationreactions (Onishi et al., 1981). Because the electronic structures of the Cm(III), Am(III), and trivalentlanthanides [rare earth elements (REE)] are similar, the environmental behavior (i.e., aqueousspeciation, solubility, and sorption) of Cm(III) is expected to be very similar to those of Am(III) (seeSection 5.2) and trivalent lanthanide elements, such as Eu(III). This analogy is well established; forexample, see Choppin (1989). The environmental behavior of curium has been reviewed by Silva andNitsche (1995), Coughtrey et al. (1984), Onishi et al. (1981), and Ames and Rai (1978).
5.4.3 Aqueous Speciation
Curium(III) should form complexes with inorganic ligands present in natural waters. However, thethermodynamic data for curium aqueous species are limited and not well established. We did notidentify any published reviews of thermodynamic properties of curium aqueous species and solids. With respect to the hydrolysis of curium, Baes and Mesmer (1976) suggest that a good analogy is thehydrolysis of the lanthanide elements. Curium aqueous and solid compounds are not listed in thetechnically recognized compilation of thermodynamic data by Wagman et al. (1982) from the NationalBureau of Standards [NBS, currently NIST (National Institute of Standards and Technology]. Wimmer et al. (1992) determined the equilibrium constants for several Cm(III) hydrolytic andcarbonate aqueous complexes by time-resolved laser-induced fluorescence spectroscopy. Figure 5.5shows the aqueous speciation for Cm(III) based on the constants listed by Wimmer et al. (1992).

5.25
0
20
40
60
80
100
3 4 5 6 7 8 9 10pH
Per
cent
Dis
tribu
tion Cm3+ CmCO3
+
Cm(CO3)2-
Cm(OH)2+
CmOH2+
By analogy, the aqueous speciation of dissolved curium is likely to be similar to those of Am(III) andtrivalent lanthanide elements, such as Eu(III). As shown in Section 5.2, the aqueous speciation ofAm(III) is dominated by the uncomplexed ion Am3+ at acidic to near neutral pH conditions, Am(III)carbonate complexes at neutral to high pH conditions, and Am(III) hydroxyl complexes at very highpH conditions.
Figure 5.5. Calculated aqueous speciation for Cm(III) as a function of pH. [Curium(III) aqueous speciation was calculated
based on a total dissolved concentration of curium of 1x10-12 mol/l(2.43x10-7 mg/l), and the water composition in Table 5.1]
Recent aqueous speciation studies of Cm(III) include, for example, those on aqueouscomplexation by dissolved carbonate (Fanghänel et al., 1998); sulfate (Paviet et al., 1996);fluoride (Aas et al., 1999); chloride (Könnecke et al., 1997); and humic substances (Hummel etal., 1999; Panak et al., 1996; Shin et al., 1995; Kim et al., 1993).
5.4.4 Dissolution/Precipitation/Coprecipitation
No studies pertaining to solubility controls for dissolved curium in natural environments wereidentified during the course of this review. Given the widely accepted idea that the environmentalbehavior of curium is analogous to Am(III), and trivalent lanthanides, such as Eu(III), solubilitycontrols for curium may be similar to those for Am(III). As discussed in Section 5.2, concentrationsof dissolved Am(III) in soil environments may be controlled by the precipitation of solids such asAm(OH)3 and AmOHCO3.
5.26
5.4.5 Adsorption/Desorption
5.4.5.1 Guidance for Screening Calculations of Adsorption
Relative to the other contaminants reviewed in Volume II (EPA, 1999c) and this volume, there arevery few experimental and field studies of the sorption behavior and mobility of curium inenvironmental systems. The results of curium adsorption studies published prior to 1981 have beenreviewed by Ames and Rai (1978) and Onishi et al. (1981). More current studies are reviewed in thesections below. All of the available sorption studies indicate that Cm(III) readily sorbs to minerals,crushed rock, and soil materials, and is therefore considered one of the most immobile actinideelements in the environment.
The limited number of Kd adsorption studies for Cm(III) in soils prevents calculation of Kd look-uptables. However, the sorption behavior of Cm(III) is very similar to that of Am(III) (seeSection 5.2) and trivalent lanthanide elements, such as Eu(III). Guidance given above for Kd valuesfor Am(III) in Section 5.2 can be used for screening calculations of Cm(III) migration in soils. Given the absence of definitive maximum and minimum Kd values for Cm(III) as a function of thekey geochemical parameters, such as pH, EPA suggests that Kd values measured for Cm(III) at site-specific conditions are thus essential for site-specific contaminant transport calculations andconceptual models. One of the major recommendations of this report is that for site-specificcalculations, partition coefficient values measured at site-specific conditions are absolutely essential.
The geochemical behavior of Eu(III) has been determined to be similar to the trivalent actinides,such as Cm(III). Therefore, the following generalities made by Clark et al. (1998) regarding theadsorption of Eu(III) should also apply to Cm(III) and Am(III):
• European (III) adsorption increases with increasing pH.• European (III) adsorption is sensitive to the ionic strength at low concentrations of total
Eu(III) and to calcium at higher concentrations of total europium.• Ion exchange is an important sorption mechanisms for Eu(III), especially at pH values less
than 4.5.• Mobility of Eu(III) in the environment increases at low to moderate pH values and in high
ionic strength solutions.
Available curium sorption studies indicate that sorption of curium is strongly pH dependent andincreases with increasing pH with peak adsorption occurring between pH values of 5 and 6. Theobserved pH dependence is expected, because the dominant aqueous species of curium in the pHrange of natural waters are primarily cations such as Cm3+ and Cm(III) carbonate complexes atacidic and basic pH values, respectively.
Compared to other actinides, Cm(III) is considered to be immobile in soil environments, andexhibits high Kd values. Because the concentrations of dissolved curium may be controlled byhydroxide or carbonate solids in some systems, some sorption measurements resulting in very highKd values may have been affected by curium precipitation reactions.
Because Cm(III) strongly adsorbs to soil particles, there is potential for colloid-facilitated transportof curium. Laboratory measurements by Kaplan et al. (1994) using site-specific soils and a 2-phase

5.27
solute transport code indicated that americium, curium, plutonium, and uranium would migrate lessthan 10 meters (m) in the F-Area of the Savannah River Site. The contaminants however werefound associated with colloidal-size particles in groundwater 1,200 m away from the point source. Colloid-facilitated migration of contaminants is reviewed in Section 2.7 in Volume I (EPA, 1999b). The reader is cautioned that the importance of colloid-facilitated migration, especially in aquifersystems that do not involve fracture flow of groundwater, is still the subject of debate.
5.4.5.2 General Adsorption Studies
Sheppard et al. (1979) used batch equilibration experiments to study the sorption of curium tocolloidal-size soil particles that are potentially diffusible in soil/water systems. The experimentswere conducted with distilled water and 14 soils from Muscatine, Illinois; Hanford, Washington;Barnwell, South Carolina; Idaho Falls, Idaho; and Paradise and Placerville, California. Centrifugation measurements indicated that much of the CM-244 was retained by the colloidal-sizesoil particles. Sheppard et al. (1979) found it difficult to correlate the sorption results with chemicaland physical properties of the soils. They attributed this to the lack of precise distribution ratios,competition with cation exchange reactions, and complexation with humic and fulvic acid materials. The results also indicated that the sorption behavior of Am-241 and CM-244 under theseexperimental conditions was identical. Sheppard et al. (1979 ) suggest that colloids of clay and humicacids are potentially important processes for the transport of actinides in soil/water systems.
Means et al. (1978) studied the mineralogy of the adsorbents for Cm-244 in soil near a disposaltrench at nuclear waste burial grounds at the Oak Ridge National Laboratory in Oak Ridge,Tennessee. Their analyses indicated that curium concentrations were highly correlated to theconcentrations of manganese oxides, even though the concentrations of iron oxyhydroxides andorganic carbon were significantly greater than those of manganese oxides.
5.4.5.3 Kd Studies for Curium on Soil Materials
Nakayama and Nelson (1988) measured the pH dependency of Kd values for Am-243 and Cm-244sorption onto sediment. Changes in pH were found to have a significant effect on the adsorption ofthese two radionuclides. However, variation of pH did not cause a significant difference in theadsorption behaviors of these two radionuclides relative to each other. Sibly and Wurtz (1986)measured the Kd values for Cm-244 on freshwater and estuary sediments. They found that Kdvalues previously reported for americium were equivalent to their measured values for curium. Adsorption of curium was pH dependent and increased from pH 4 to pH 7. The measuredadsorption remained high in low organic, carbonate-buffered systems. It should be noted that themeasured adsorption of several lanthanide trivalent cations on amorphous Fe(OH)3, hematite, andmagnetite were also determined to be strongly dependent on pH (Music and Ristic, 1988).
Nishita et al. (1981) studied the extractability of Cm-244 from several types of soils as a function ofpH. The extractability of curium was considered to parallel the solubilization of aluminum, iron,and/or manganese hydrous oxides, which are important adsorbents for dissolved contaminants insoil systems (Nishita et al., 1981). The curium Kd values and soil characteristics determined for thesesoils by Nishita et al. (1981) are listed in Table 5.9. Under highly acidic conditions, Nishita et al.(1981) concluded that curium was present in ionic form and was mobile. At higher pH values,curium formed hydroxyl complexes that were readily sorbed by the soils.

5.28
Table 5.9. Measured curium Kd values (ml/l) and soil properties for soils studied by Nishita et al. (1981).
SoilType
pH1OM2
Fraction(%)
CEC3
(meq/100 g)
Free FeOxides
(%)
Mn4
Fraction(%)
ExtractpH
Kd
(ml/g)
Silt Clay LoamSharpsburg 5.9 2.8 20 1.29 0.06 5.41
6.5623,35013,860
Sandy LoamMalbis 5.3 2.4 15 1.65 0.05 4.39
5.718,5236,809
Sandy LoamLyman 5.0 5.7 15 1.52 0.04 4.58
6.171,374
186
Silty ClayHoltsville 7.8 0.6 30 1.20 0.04 7.12
8.0436,26051,900
LoamAiken 6.0 8.4 15 5.29 0.10 5.71
6.7230,92015,020
Silt LoamYolo 6.7 2.5 25 2.41 0.08 6.12
6.9821,78017,090
MuckEgbert 7.2 40.8 60 1.57 0.10 7.14
7.546,7725,056
1 Saturated paste. 4 In 4 M HNO3 extract.2 Organic matter.3 Cation exchange capacity.
5.4.5.4 Published Compilations Containing Kd Values for Curium
Because the references in this section are often cited or used for comparison in other publications,the following summaries are provided for completeness. It is recommended that the reader reviewthe original reference and the references cited therein to understand the procedures and sources ofthe Kd values used for each compilation. The compilations do not typically consider importantfactors that contribute to variability in sorption, such as pH. Moreover, in cases where very large Kdvalues are listed, there is a risk that the original Kd measurement may have included precipitatedcomponents.
Baes and Sharp (1983) present a simple model developed for order-of-magnitude estimates forleaching constants for solutes in agricultural soils. As part of this model development, they reviewedand determined generic default values for input parameters, such as Kd. A literature review wascompleted to evaluate appropriate distributions for Kd values for various solutes, including curium. Because Baes and Sharp (1983) are cited frequently as a source of Kd values in other published Kdreviews (e.g., Looney et al., 1987, Sheppard and Thibault, 1990), the curium Kd values listed by Baesand Sharp are reported here for completeness. Based on the distribution that Baes and Sharp

5.29
determined for the Kd values for cesium and strontium, they assumed a lognormal distribution forthe Kd values for all other elements in their compilation. Baes and Sharp listed an estimated defaultKd of 3,300 ml/g for curium based on 31 Kd values that ranged from 93.3 to 51,900 ml/g foragricultural soils and clays over the pH range 4.5 to 9.0. Their compiled Kd values represent adiversity of soils, pure clays (other Kd values for pure minerals were excluded), extracting solutions,measurement techniques, and experimental error.
Looney et al. (1987) tabulated the estimates for geochemical parameters needed for environmentalassessments of waste sites at DOE’s Savannah River Plant in South Carolina. Looney et al. list Kdvalues for several metal and radionuclide contaminants based on values that they found in 1-5published sources. For curium, Looney et al. list a “recommended” Kd of 3,160 (103.5) ml/g, and arange of 100 to 1,000,000 ml/g. Looney et al. note that their recommended values are specific to theSavannah River Plant site, and they must be carefully reviewed and evaluated prior to use inassessments at other sites.
Thibault et al. (1990) (also see Sheppard and Thibault, 1990) present a compilation of soil Kd valuesprepared to support radionuclide migration assessments for a Canadian geologic repository for spentnuclear fuel in Precambrian Shield plutonic rock. Thibault et al. collected Kd values from othercompilations, journal articles, and government laboratory reports for important elements, such ascurium, that would be present in the nuclear fuel waste inventory. The curium Kd values listed inThibault et al. (1990) are included in Table 5.10. Thibault et al. (1990) describe the statistical methodsused for analysis of the compiled Kd values. The range for the Kd values used to calculate the“geometric mean” cover several orders of magnitude. Readers are cautioned against using“geometric mean” values or any other form of averaged Kd values as “default” Kd values, as suchvalues are usually calculated from data compiled from different investigators for different soilsystems. These mean or average values do not represent any particular environmental system andgeochemical conditions. As discussed in Volume I (EPA, 1999b), the variation observed in theliterature for Kd values for a contaminant is due to differences in sorption mechanisms, geochemicalconditions, soil materials, and methods used for the measurements.
Table 5.10. Curium Kd values (ml/g) listed in Thibault et al. (1990, Tables 4 to 8).
Soil Type
Kd Values (ml/g)
GeometricMean
Number ofObservations
Range
Sand 4,000 2 780 - 22,970
Silt 18,000 4 7,666 - 44,260
Clay 6,000 1
Organic 6,000 1

5.30
5.4.5.5 Kd Studies of Curium on Pure Mineral, Oxide, and Crushed Rock Materials
Few adsorption studies have been conducted of curium on pure minerals, oxide phases, and othergeologic-related materials. The Kd values listed in these studies are not necessarily relevant to themobility and sorption of curium in soils. However, they are listed in Appendix E for completeness. The references cited in Appendix E are listed in the main reference list in Chapter 6. The potentialvalue of the references that they cite and the sorption processes that they discuss is left to the reader. The studies of curium sorption on crushed rock were conducted typically as part of national researchprograms to investigate the feasibility of geological disposal of high-level radioactive waste (HLW).
5.5 Iodine Geochemistry and Kd Values
5.5.1 Overview: Important Aqueous- and Solid-Phase Parameters ControllingRetardation
Although the environmental chemistry of iodine is normally assumed to be simple and well known,recent studies suggest that the fate and mobility of iodine in environmental systems may be morecomplex than expected. This complexity is caused by the multiple redox states of iodine that mayexist under oxidizing conditions. The -1, +5, and molecular I2 oxidation states are those mostrelevant for iodine in environmental systems. In most aqueous environments, iodine is present asthe iodide ion, I-. In marine and highly oxidizing environments such as surface waters and someoxygenated shallow ground waters, iodine may be present in the +5 oxidation state as the iodate ion,IO3
- . Under oxidizing, acidic conditions, molecular I°2 (aq) may form from the reduction of IO3- or
oxidation of I-. Some sorption studies suggest (Section 5.5.5) that these iodine oxidation/reductionreactions may affect the observed sorption behavior of iodine in soils and the reactions may beaffected by the organic content and/or microbial processes in soils and sediments. Although iodineis a primary component of several naturally occurring minerals, the formation of such mineralsrepresent unique geological conditions and is not likely to occur in soils due to the lowconcentrations of iodine typically present in the environment.
Sorption of iodine species appears to be controlled in part by soil organic matter and in part by ironand aluminum oxides, with adsorption of iodine becoming increasingly important under more acidconditions. Although the extent of sorption is typically low, especially in systems containing little orno organic matter, I- and IO3
- are sorbed to a measurable extent by soils and some oxide and sulfideminerals at near neutral and alkaline pH conditions. The adsorption behavior of IO3
- also appears tobe appreciably different from that of I-, in that IO3
- sorbs much more strongly than I- to soil andmineral surfaces. Mechanisms causing this sorption behavior of iodine at near neutral and alkalinepH conditions are not completely understood. Some have proposed that this observed adsorptionbehavior in soils may be a result of the oxidation of I-and/or reduction of IO3
- to the more reactivemolecular I°2 (aq) and/or its hydrolysis products.
5.5.2 General Geochemistry
Iodine [I, atomic number (Z) = 53] is a halide element, like fluorine, chlorine, and bromine. Iodineis known to occur in the -1, +1, +3, +5, and +7 oxidation states. There are 37 reported isotopes ofiodine (Tuli, 2000). Only 1 isotope, 127I is stable. Isotopes 131I and 129I are generated during theoperation of nuclear power plants, reprocessing of nuclear fuels, and testing of nuclear weapons.
5.31
Due to its long half life (t½ = 1.57x10⁷ y), 129I is the only iodine isotope of major environmentalconcern. Fission products 131I ((t½ = 8.02 days) and 125I (t½ = 59.4 days) are often short termdisposal hazards. Most of the remaining iodine isotopes have half lives of a few hours to fractionsof a second. The environmental behavior of iodine has been reviewed by others, such as Lieser andSteinkopff (1989), Whitehead (1984), Coughtrey et al. (1983), and Ames and Rai (1978).
5.5.3 Aqueous Speciation
Iodine is known to occur in several oxidations. Of these, the -1, +5, and molecular I2 oxidationstates are those most relevant to environmental systems. Figure 5.6 is an Eh-pH diagram that showsthe dominant aqueous species of iodine as a function of pH and Eh (redox potential) at 25°C withrespect to the thermodynamic stability of water.
In most aqueous environments, iodine is present in the -1 valence state as the iodide ion, I-. Thestability range of I- extends almost over the entire pH and Eh range for the thermodynamic stabilityof water. In marine and highly oxidizing environments such as surface waters and some oxygenatedshallow ground waters, iodine may be present in the +5 oxidation state as the iodate ion, IO3
-
(Figure 5.6). Under oxidizing, acidic conditions, the Eh-pH diagram indicates that molecular I°2 (aq)may form from the reduction of IO3
- or oxidation of I-. Some iodine sorption studies suggest(Section 5.5.5) that these iodine oxidation/reduction reactions may affect the observed sorptionbehavior of iodine in soils and the reactions may be affected by the organic contents and/ormicrobial processes in soils and sediments. For example, studies, such as Skogerboe and Wilson(1981), indicate that fulvic acid derived from soil is cable of reducing molecular I°2 (aq) and IO3
- to I-
under conditions generally characteristic of natural waters.
The volatilization of iodine from soil to the atmosphere may occur as a result of both chemical andmicrobiological processes (Whitehead, 1984). The chemical processes generally result in moleculariodine or hydrogen iodide, and the microbiological processes yield organic compounds, such asmethyl iodide. Methyl iodide is not strongly retained by soil components and is only slightly solublein water (Whitehead, 1984).
Vovk (1988) completed a review of the literature regarding the influence of radiolysis on themigration of iodine in the geosphere, including published studies of iodine liberation from uraniumore into groundwater and iodine in formation waters (i.e., brines in oilfields and gasfields) from deepstrata. A variety of other iodine species are known to form radiolytically, such as HOI° (aq) and OI-. Although these species are unstable, they may be important in some chemical reactions that affectiodine in the environment. Radiolytic reactions lead to conversion of non-volatile and relativelyunreactive species, such as I- and IO3
- , into volatile forms, such as molecular I2, which are fairlyreactive and react rapidly with organic compounds to form organic iodide species (Vovk, 1988).
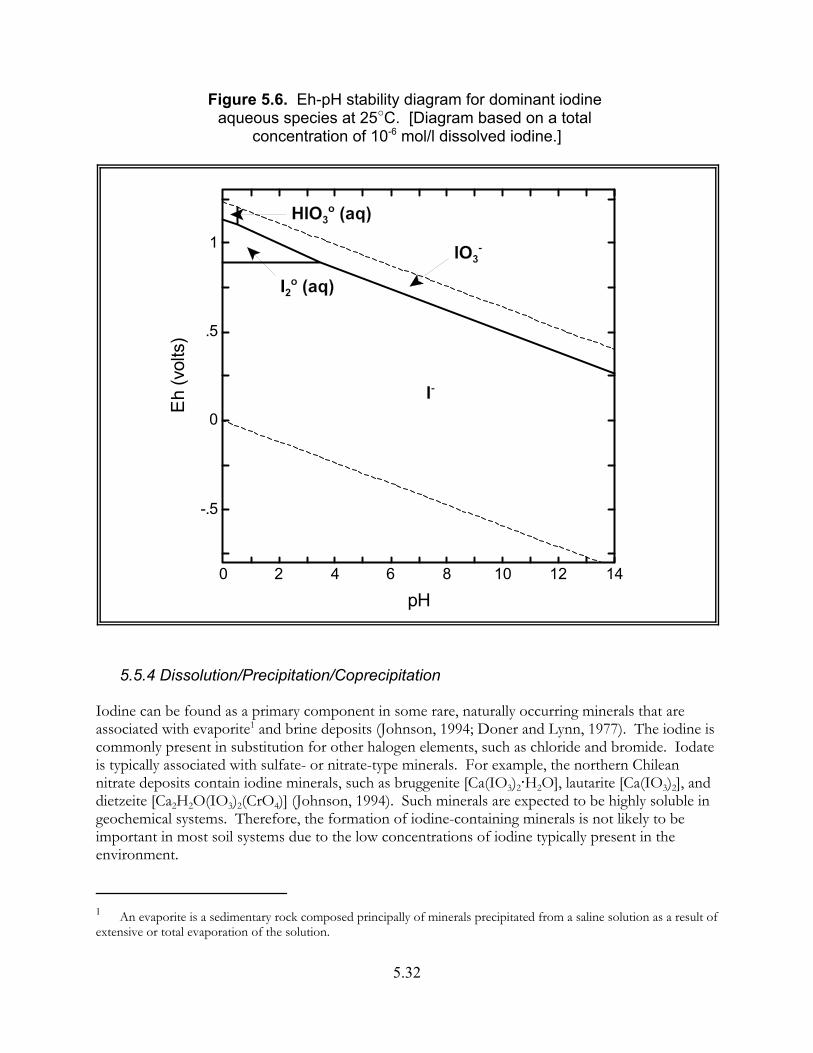
1 An evaporite is a sedimentary rock composed principally of minerals precipitated from a saline solution as a result ofextensive or total evaporation of the solution.
5.32
0 2 4 6 8 10 12 14
-.5
0
.5
1
pH
Eh
(vol
ts)
Figure 5.6. Eh-pH stability diagram for dominant iodine aqueous species at 25"C. [Diagram based on a total
concentration of 10-6 mol/l dissolved iodine.]
5.5.4 Dissolution/Precipitation/Coprecipitation
Iodine can be found as a primary component in some rare, naturally occurring minerals that areassociated with evaporite1 and brine deposits (Johnson, 1994; Doner and Lynn, 1977). The iodine iscommonly present in substitution for other halogen elements, such as chloride and bromide. Iodateis typically associated with sulfate- or nitrate-type minerals. For example, the northern Chileannitrate deposits contain iodine minerals, such as bruggenite [Ca(IO3)2@H2O], lautarite [Ca(IO3)2], anddietzeite [Ca2H2O(IO3)2(CrO4)] (Johnson, 1994). Such minerals are expected to be highly soluble ingeochemical systems. Therefore, the formation of iodine-containing minerals is not likely to beimportant in most soil systems due to the low concentrations of iodine typically present in theenvironment.

5.33
5.5.5 Adsorption/Desorption
5.5.5.1 Guidance for Screening Calculations of Adsorption Sorption of iodine species appears to be due in part to soil organic matter and in part to iron andaluminum oxides, with adsorption of iodine becoming increasingly important under acidicconditions. Because iodine is present as either the anions I- or IO3
- in most soils, conventionalwisdom suggests that their adsorption on soils and most individual mineral phases should benegligible at near neutral and alkaline pH conditions, and increase as pH values become more acidic. Sorption studies of iodine published prior to 1976 are reviewed by Onishi et al. (1981) and Ames andRai (1978). More recent studies are reviewed in the sections below. The majority of these studiespertain to the adsorption of iodide.
Numerous studies have been conducted in which Kd values for iodide adsorption on soil have beenreported along with associated pH values and/or soil organic carbon contents. These include the Kdmeasurements by Kaplan et al. (1996, 1998a, 1998b, 2000a, 2000b), Fukui et al. (1996), Bird andSchwartz (1996), Sheppard et al. (1995), Serne et al. (1993), Muramatsu et al. (1990), Sheppard andThibault (1988), and Gee and Campbell (1980) (see reviews below). However, these data are tooscattered or limited in scope to determine Kd look-up tables of conservative minimum andmaximum Kd values for iodide as a function of key geochemical parameters such as pH and organiccarbon content of soil. One of the key recommendations of this report is that for site-specificcalculations, partition coefficient values measured at site-specific conditions are absolutely essential.
Based on the studies by Kaplan and coworkers, it is suggested that Kd values of 0.6 and 0 ml/g beconsidered, respectively, as conservative minimum Kd values for the pH ranges from 4 to <6 and$6 to 10 for screening calculations of iodide migration in soils. These values represent primarily lowadsorptive, quartz-feldspar-rich soils with low contents of organic carbon matter. The available Kddata are too unevenly distributed and limited as a function of pH to estimate a conservativemaximum Kd values for iodide. Values of Kd for iodide have been reported in the range from 1 to10 ml/g for the pH range from 4 to 10. Most of the reported Kd values are however typically lessthan 3 ml/g.
Studies suggest that the adsorption of iodide increases with increasing soil organic matter. Unfortunately, the majority (>90%) of the reported Kd values for iodide adsorption on soil arelimited to mineral soils with organic matter contents of less than 0.2 wt%. Development of a look-up table for iodide Kd values as a function of organic matter contents is precluded by this limitedrange of data.
Sorption studies (see studies reviewed in sections below and references cited therein) indicate thatthe adsorption of iodine anions does increase with decreasing pH. However, although the extent ofsorption is typically low, especially in systems containing little or no organic matter, I- and IO3
- aresorbed to a measurable extent by soils and some oxide and sulfide minerals at near neutral andalkaline pH conditions. The adsorption behavior of IO3
- also appears to be appreciably differentthan that of I-, in that IO3
- sorbs much more strongly than I- to soil and mineral surfaces.
Mechanisms causing this sorption behavior of iodine at near neutral and alkaline pH conditions arenot completely understood. Some have proposed that this observed adsorption behavior in soils

5.34
may be a result of the oxidation of I- and/or reduction of IO3- to the more reactive molecular I°2 (aq)
and/or its hydrolysis products (Yu et al., 1996; Behrens, 1982; Whitehead, 1974). Such a reactionprocess would help explain why some adsorption measurements do not reach steady-stateconditions even after many weeks or months of contact time. Some investigators believe that thisiodine oxidation/reduction process may be affected by the organic matter and/or microbialprocesses in the soils. Some researchers have found positive correlations between the sorption ofiodine and organic matter in soils, and some studies indicate that the iodine sorption is decreasedwhen soils are treated with fungicide, bactericide, irradiation or heat. Others have proposed thatiodine sorption was primarily caused by physical processes associated with the surfaces andentrapment in the micropores and structural cavities in the organic matter.
5.5.5.2 General Adsorption Studies
Kaplan et al. (2000b) investigated the sorption of 125I- on calcite, chlorite, goethite, montmorillonite,quartz, vermiculite, and illite. These minerals were components of the sediments used for iodinesorption studies by Kaplan et al. (1996). Kaplan et al. (2000b) measured little or no sorption of I- oncalcite, chlorite, goethite, montmorillonite, quartz, and vermiculite. However, a significant amountof I- sorption (Kd = 15.14±2.84 ml/g) was measured for the illite sample, and was also determinedto be strongly dependent on pH. The Kd values for I- on illite decreased from 46 to 22 ml/g overthe pH range 3.6 to 9.4, respectively. Kaplan et al. (2000a) were able to desorb a significant fractionof the I- by treating the 125I–sorbed illite samples with dissolved fluoride (43 percent desorbed),dissolved chloride (45 percent desorbed), dissolved bromide (52 percent desorbed), and dissolvedstable I- (83 percent desorbed). Based on these results, Kaplan et al. (2000a) proposed that I- wassorbed to the illite by reversible physical adsorption to pH-dependent edge sites.
Rädlinger and Heumann (2000) studied the conversion of inorganic I- into humic substance/iodinespecies in aquatic systems, and whether microorganisms affected such reactions. For naturalsamples, I- was exclusively fixed by humic substance fractions where natural humic substance/iodinespecies have also been observed in the original samples. Their results indicated that thetransformation was strongly affected by microbiological activity of the sample and occurred by acomplicated transfer mechanism by the formation of different intermediate humic substance/iodinespecies.
Yu et al. (1996) completed a series of experiments to compare the reaction of I- with a series ofvolcanic-ash soils to those for noncrystalline materials that constitute much of the inorganic fractionof these soils. The measured uptake of I- by volcanic soils was different than the I- on thenoncrystalline phases that make up much of the clay-size fraction of some of these soils. Sorptionof I- onto imogolite and ferrihydrite was rapid (<30 min), but was not particularly great. Iodidesorption on imogolite was 3-to-4 times greater than that on ferrihydrite on a mass basis. In contrast,rates of I- retention by volcanic-ash soils were slow and did not attain a steady-state after 300 h. Yuet al. (1996) determined that this reaction was and its extent could be attenuated, but not besuppressed, by sterilization. The I- sorbed by the soils could only be completely desorbed by boilingthe soils in 2 molar (M) sodium hydroxide solution. The results indicated that the amount of I-
sorbed by soils was inversely correlated with pH. However, no relationship with organic matterconcentrations, surface area, or imogolite and ferrihydrite concentrations was found. Yu et al. (1996)determined that the reaction of I- with volcanic-ash soils was consistent with a rapid initial uptake bysoil mineral surfaces, followed by a slower reaction of soil organic matter with oxidized forms of I-.
1 Chernozem and podzol are great soil groups of the 1938 USDA classification system. It is a group of zonal soilswhose surface horizon is dark and highly organic, below which is a lighter-colored horizon and accumulation of lime. The soil group is developed under conditions of temperate to cool subhumid climate (USDA, 1938).
2 Podzol is a group of zonal soils having an organic mat and a very thin organic-mineral layer overlying gray, leachedA2 horizon and a dark brown, illuvial B horizon enriched in iron oxide, alumina, and organic matter. It develops underconiferous or mixed forests or under heath, in a cool to temperate moist climate (USDA, 1938).
5.35
They proposed that the sorption of I- to soils is primarily controlled by the slow oxidation of I- toI2° (aq) and that I2° (aq) or its hydrolysis product HOI° (aq) then reacts with soil organic matter.
Sheppard and Hawkins (1995) studied bog water and peat from an iodine-rich bog to investigate therole of microorganisms in the retention and accumulation of iodine in a temperate wetland. Theirresults indicated that sorption of iodine on fresh peat was slightly slower and more limited underanoxic conditions. Autoclaving the peat and the addition of sucrose to the peat both decreasediodine sorption. In addition, the reinoculation of the treated peat with a fresh microbial populationwas not effective in increasing iodine sorption. This suggested that microbes may only play a minorand indirect role in iodine sorption through the decomposition of organic matter.
Sheppard and Thibault (1992) investigated the behavior of iodine in organic and mineral soils. Theirresults showed that microbes played an indirect role in sorption of iodine on soils, and their effectwas very short term. Desorption experiments indicate that the released iodine was generally anionic,with some neutral or positively charge species also present. They found no firm evidence thatretention of iodine in soils was due to any specific chemical reaction. Sheppard and Thibault (1992)proposed that iodine sorption was primarily through physical processes associated with the surfaceand entrapment in the micropores and structural cavities of the organic matter.
Bors et al. (1991) conducted batch adsorption experiments of 125I on two types of soils, chernozem1
and podzol.2 Generally higher Kd values were observed for the chernozem soil, which ischaracterized by a higher amount of organic matter and soil biomass. Incubation of soil samplesunder varied conditions suggested that soil microflora participated in iodine immobilization. Bors etal. (1988) used batch experiments to study the relationship of iodine sorption to soil organic C-contents of different horizons of a podzolic soil profile. The measurements indicated that thesorption of iodine tended to increase with increasing organic C-content of different soil horizons. Analyses of the organic substances suggested that a considerable part of the radioiodine was fixed inhumic and fulvic acids.
Koch et al. (1989) investigated the role of microbial processes in the mobility of 129I for 12 samplesof nine organic soils, which varied widely in degree of humification and parent vegetation. The soilssamples were collected mainly on the Precambrian Shield of Ontario, Canada. Their experimentswere conducted using glucose, thymol, gamma irradiation (60Co) to stimulate or suppress microbialactivity in the soils. The presence of glucose generally increased I- removal from solution, whereasthymol depressed removal. Gamma irradiation of the soils decreased I- removal from solution in allsamples. The iodine content of soils was directly related to both biologically- and nonbiologically-mediated processes of I- removal from solution. Koch et al. (1989) concluded that microorganismsplay an important role in the processes of I- removal from solution in organic soils.

5.36
Behrens (1982) found that iodine in both surface and soil water was to a large extent chemicallyconverted to an inert form by microbial processes. He presented evidence of involvement ofmicroorganisms in that autoclaving of the soils greatly reduced iodine sorption by the soil. Behrens(1982) suggested that the reactions involve extracellular, enzymatic oxidation of I- to molecularI°2 (aq) which then reacts with organic matter.
Beneš et al. (1976) studied the interaction between humus and iodine in lake water usingcentrifugation, ultrafiltration, and filtration through ion exchange membranes. Iodine was retainedto a considerable degree by the ultrafilter. This observation suggested that iodine was present notonly as simple halide ion, which should not be retained by the filter or simple adsorption reactions. Beneš et al. (1976) suggested that some kind of reaction between the halides and humus might beresponsible for the observed uptake of iodine.
Whitehead (1973,1974,1978) conducted several studies on iodine adsorption on geologic materialsand organic matter. Whitehead (1973) determined the iodine contents of soils from sites in theUnited Kingdom. His results showed that soil organic matter and iron and aluminum oxides werelargely responsible for the retention of iodine in soils. The total concentrations of iodine in thesesoils were positively correlated with aluminum oxide extracted by Tamm’s reagent, with ferric oxideextracted by citrate-dithionite, and with soil organic matter. Whitehead (1974) studied the uptake ofI-, element iodine, and IO3
- , when added to sandy loam and to mixtures of the soil with organicmatter (composited grass roots), chalk, ferric oxide, and aluminum oxide (sesquioxides). Thebehavior of elemental iodine was similar to I- in response to the various soil treatments. Iodate,however, differed considerably from the other two forms of iodine. With soil alone and with thesoil/chalk mixture, the decrease in the concentrations of dissolved IO3
- with time was relatively slow,although after 160 days its solubility was similar to that of I- and elemental iodine. Theincorporation of composted grass roots cause a rapid reduction in IO3
- solubility, suggesting that theorganic matter accelerated the reduction of IO3
- to elemental iodine or I-. The results obtained whenthe soil was treated with composted grass roots suggest that, in the presence of readilydecomposable organic matter, IO3
- may be quickly reduced to elemental iodine or I-. Whitehead(1978) measured the iodine content in successive 10-cm horizons of 18 soil profiles from Englandand Wales. The iodine content was correlated with the contents of “free” aluminum and iron oxides(oxalate-soluble) and organic matter. In all 154 samples, the iodine content was closely correlatedwith oxalate-soluble aluminum, but not with oxalate-soluble iron or organic matter. In the 5 mostacidic soils with pH values less than 4.8, however, the iodine content was more closely correlatedwith iron than with aluminum.
5.5.5.3 Kd Studies of Iodine on Soil Materials
Kaplan and coworkers have conducted a series of laboratory studies on the adsorption of I- on soilsand mineral phases. Kaplan et al. (2000a) measured Kd values for I- as a function of pH on twosediments from the Savannah River Site at Aiken, South Carolina. The Kd values ranged from 3.96to 0.05 ml/g depending on sediment type and especially pH. The Kd values were consistentlygreater for a wetland versus an upland sediment. Kaplan et al. (2000a) attributed this result to thegreater organic matter content of the wetland sediment. Their measurements also indicated that theKd values increased with decreasing pH as would be expected for dissolved anionic contaminants. For the wetland sediment, the Kd values ranged from 3.96 to 1.17 ml/g. For the upland sediment,the Kd values ranged from 0.90 to 0.05 ml/g.

5.37
Kaplan et al. [2000b; also see Kaplan et al. (1996)] used the batch technique to measure the Kd valuesfor iodine, as I-, on three sediment samples from the Hanford Site in southeastern Washington. Themeasurements were conducted with a groundwater sample (pH 8.46) taken from a well located in anuncontaminated area of the Hanford Site. The sediment samples included a Touchet bed sand(sample TBS-1), a silty loam (sample Trench AE-3), and a very coarse sand (sample Trench-94). The average measured Kd values at 330 days were 9.83, 6.83, and 4.72 ml/g for the very coarse sand,Touchet bed sand, and the silty loam sediment samples, respectively. Kaplan et al. (2000b) alsonoted that the Kd values increased as a function of time. For example, the Kd values measured forthe very coarse sand increased from 0.19 to 9.83 over 330 days of contact time.Kaplan et al. (1998a) used the batch equilibration technique to measure the Kd values for I- underoxic conditions on 20 sediment samples taken from a borehole in the Hanford formation at theHanford Site in southeastern Washington. Each sediment sample was equilibrated withuncontaminated groundwater from the Hanford Site, which was subsequently spiked with 125I priorto the Kd measurements. The groundwater solution has a low ionic strength and a pH of 8.4 [seeTable 1 in Kaplan et al. (1998a)]. The mean Kd values of three replicates measured for I- on eachHanford sediment sample are listed in Table 5.11, and range from -0.03 to 0.23 ml/g. Themeasurements indicated essentially no sorption of I- on Hanford sediments under these conditions.
Kaplan et al. (1998b) studied the effects of high pH on the sorption of iodine under oxic conditionson sediments from the Hanford Site in Washington. Batch sorption experiments were completedusing the <2-mm size fraction of sediment collected from Trench AE-3 in the 200 Area of theHanford Site. The sediment was characterized as a silty loam with a cation exchange capacity (CEC) of 6.4 meq/100 g. The carbonate content of the sediment consisted of primarily of calcite. Basedon analyses reported by Kaplan et al. (1996) for a sediment from a nearby location, the sediment wasexpected to contain approximately 0.2-0.5 wt. percent amorphous Fe2O3 (Kaplan et al., 1998b). The<2-mm size fraction contained 41 percent sand, 50 percent silt, and 9 percent clay. The clay fractionof sediment contained primarily smectite (57 percent), illite (19 percent), and vermiculite(14 percent). The groundwater selected for the sorption studies was an uncontaminatedgroundwater from the Hanford Site with a low ionic strength and pH of 8.4 [see Table 2 in Kaplanet al. (1998b)]. Based on the experimental conditions and geochemical modeling calculations, thedissolved iodine was assumed to present as dissolved I-. The mean Kd values of three replicatesmeasured for iodine in the high pH experiments are listed in Table 5.11.
Yoshida et al. (1998) used the batch equilibration method and 125I to measure the Kd values for I- andIO3
- on 68 soils. The soils were collected from upland fields, paddies, forests and open areasthroughout Japan. The soils were characterized with respect to soil pH, cation exchange capacity(CEC), anion exchange capacity (AEC), active aluminum (extractable by oxalic acid and ammoniumoxalate), and total organic carbon (TOC). Two sets of experiments were conducted. One set ofexperiments consisted of equilibrating wet (fresh) samples of each soil with deionized water. In thesecond set of experiments, samples of each soil were autoclaved prior to equilibration withdeionized water. Table 5.12 lists the median Kd values for the 9 soil types. The measured Kd valuesrange widely for the wet soils from 1.1 to 10,200 ml/g for I-, and from 2.1 to 8,210 ml/g for IO3
- . These values were almost 2 orders of magnitude higher than Kd values previously reported for air-dried Japanese soils. The Kd values for the sandy soil samples were low. Yoshida et al. (1998) foundrelatively good correlations between Kd for wet soils and TOC and total nitrogen, indicating thecontribution of organic materials on the sorption of iodine. The Kd values decreased substantiallyafter autoclaving (Table 5.12). The effects of autoclaving on the sorption of I- were greater than
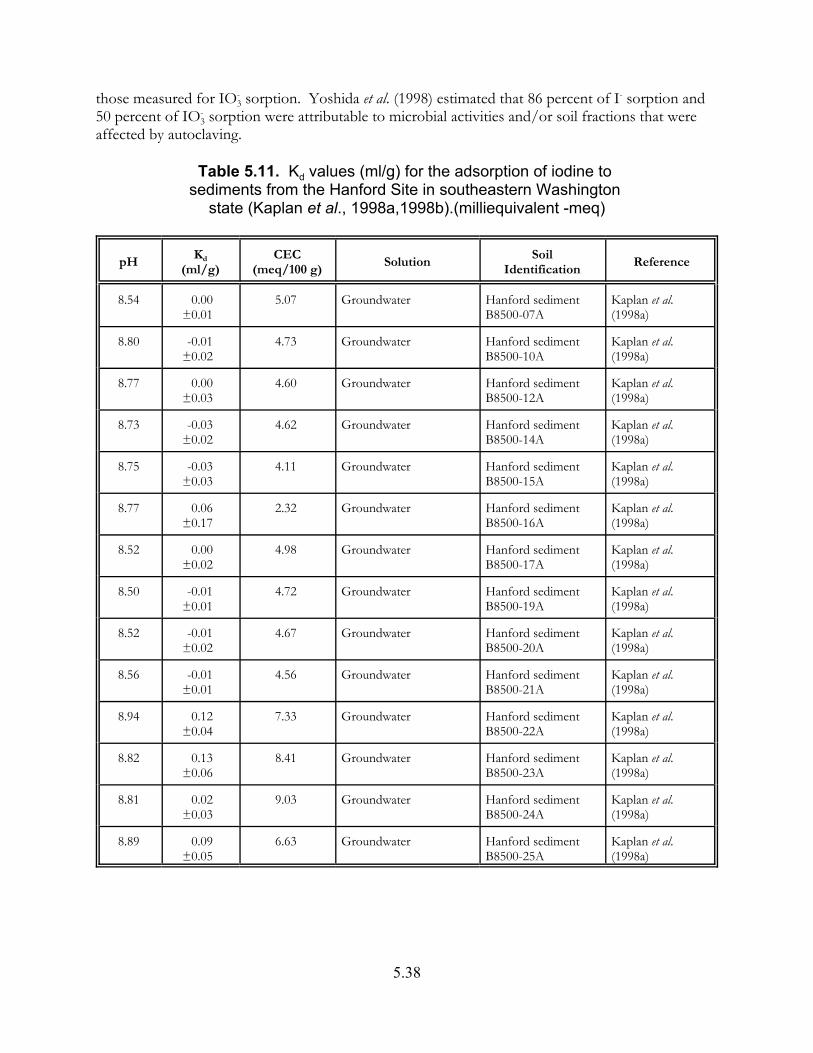
5.38
those measured for IO3- sorption. Yoshida et al. (1998) estimated that 86 percent of I- sorption and
50 percent of IO3- sorption were attributable to microbial activities and/or soil fractions that were
affected by autoclaving.
Table 5.11. Kd values (ml/g) for the adsorption of iodine to sediments from the Hanford Site in southeastern Washington
state (Kaplan et al., 1998a,1998b).(milliequivalent -meq)
pHKd
(ml/g)CEC
(meq/100 g)Solution
SoilIdentification
Reference
8.54 0.00±0.01
5.07 Groundwater Hanford sediment B8500-07A
Kaplan et al.(1998a)
8.80 -0.01±0.02
4.73 Groundwater Hanford sediment B8500-10A
Kaplan et al.(1998a)
8.77 0.00±0.03
4.60 Groundwater Hanford sediment B8500-12A
Kaplan et al.(1998a)
8.73 -0.03±0.02
4.62 Groundwater Hanford sediment B8500-14A
Kaplan et al.(1998a)
8.75 -0.03±0.03
4.11 Groundwater Hanford sediment B8500-15A
Kaplan et al.(1998a)
8.77 0.06±0.17
2.32 Groundwater Hanford sediment B8500-16A
Kaplan et al.(1998a)
8.52 0.00±0.02
4.98 Groundwater Hanford sediment B8500-17A
Kaplan et al.(1998a)
8.50 -0.01±0.01
4.72 Groundwater Hanford sediment B8500-19A
Kaplan et al.(1998a)
8.52 -0.01±0.02
4.67 Groundwater Hanford sediment B8500-20A
Kaplan et al.(1998a)
8.56 -0.01±0.01
4.56 Groundwater Hanford sediment B8500-21A
Kaplan et al.(1998a)
8.94 0.12±0.04
7.33 Groundwater Hanford sediment B8500-22A
Kaplan et al.(1998a)
8.82 0.13±0.06
8.41 Groundwater Hanford sediment B8500-23A
Kaplan et al.(1998a)
8.81 0.02±0.03
9.03 Groundwater Hanford sediment B8500-24A
Kaplan et al.(1998a)
8.89 0.09±0.05
6.63 Groundwater Hanford sediment B8500-25A
Kaplan et al.(1998a)

5.39
Continuation of Table 5.11
pH Kd
(ml/g)CEC
(meq/100 g)Solution Soil
IdentificationReference
8.88 0.06±0.05
8.36 Groundwater Hanford sediment B8500-27A
Kaplan et al.(1998a)
8.84 0.23±0.06
7.77 Groundwater Hanford sediment B8500-29A
Kaplan et al.(1998a)
8.56 0.04±0.07
10.98 Groundwater Hanford sediment B8500-31A
Kaplan et al.(1998a)
8.93 -0.01±0.01
8.39 Groundwater Hanford sediment B8500-32A
Kaplan et al.(1998a)
8.92 0.08±0.08
6.21 Groundwater Hanford sediment B8500-34A
Kaplan et al.(1998a)
8.89 0.01±0.02
6.65 Groundwater Hanford sediment B8500-35A
Kaplan et al.(1998a)
8.1 0.22±0.01
6.4 Groundwater and NaOH Hanford TrenchAE-3 Sediment
Kaplan et al.(1998b)
9.9 0.01±0.01
6.4 Groundwater and NaOH Hanford TrenchAE-3 Sediment
Kaplan et al.(1998b)
10.2 -0.02±0.02
6.4 Groundwater and NaOH Hanford TrenchAE-3 Sediment
Kaplan et al.(1998b)
11.0 -0.04±0.02
6.4 Groundwater and NaOH Hanford TrenchAE-3 Sediment
Kaplan et al.(1998b)
11.9 0.01±0.01
6.4 Groundwater and NaOH Hanford TrenchAE-3 Sediment
Kaplan et al.(1998b)
Bird and Schwartz (1996) studied effect of sediment-to-water ratios, oxic and anoxic conditions,alkalinity, microbial activity, and time on the partitioning of iodine, as 125I, on representative lakesediments from the Canadian Shield. The Kd values were determined using the shaking, batchequilibration technique with sediment-to-solution ratios of 1, 10, and 50 percent for organicsediment, peaty sediment, clayey silt/sand sediment, and sand sediment. Bird and Schwartz (1996)found that the alkalinity of water, which ranged from <1.0 to 250 mg/l as CaCO3, had only a minoreffect on Kd with values changing less than a factor of two. Treating organic soil with a fungicide,bactericide, irradiation or heat decreased Kd values by a factor of 1.1, 2.3, 7.5, and 22, respectively. These results suggested that microbial processes were important on the sorption of 125I to sediment,although chemical and/or physical changes, as results of radiation or heat treatment, may also beimportant. Under anoxic conditions, Kd values were low (generally less than 1 ml/g. Over a 48-dayperiod, Kd values increased from about 690 ml/g on day 6 to 3,840 ml/g on day 48 under oxicconditions, and from about 0.5 to 16 ml/g under anoxic conditions. Most of the iodine adsorbed tosediment under oxic conditions was released back into the water under anoxic conditions. Geometric mean Kd values for iodine measured in untreated river water under oxic conditions, aftershaking for 48 hours, are listed in the Table 5.13. Lower Kd values were observed for clayey
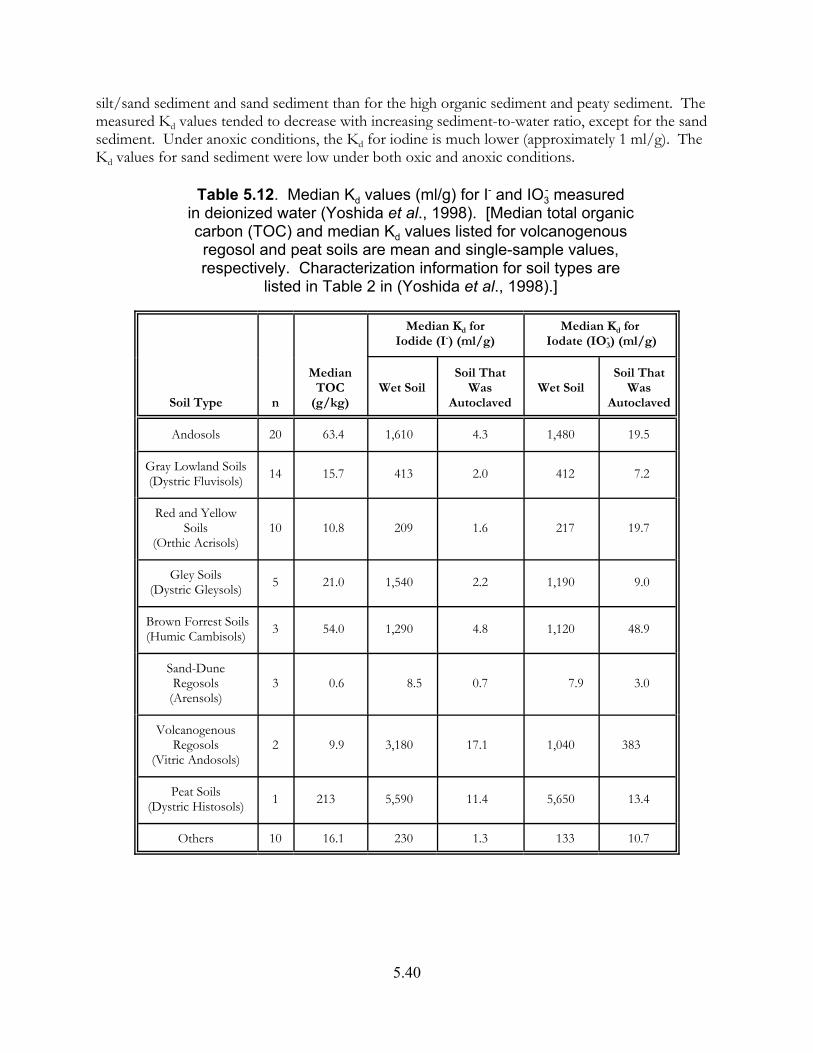
5.40
silt/sand sediment and sand sediment than for the high organic sediment and peaty sediment. Themeasured Kd values tended to decrease with increasing sediment-to-water ratio, except for the sandsediment. Under anoxic conditions, the Kd for iodine is much lower (approximately 1 ml/g). TheKd values for sand sediment were low under both oxic and anoxic conditions.
Table 5.12. Median Kd values (ml/g) for I- and IO3- measured
in deionized water (Yoshida et al., 1998). [Median total organic carbon (TOC) and median Kd values listed for volcanogenous regosol and peat soils are mean and single-sample values, respectively. Characterization information for soil types are
listed in Table 2 in (Yoshida et al., 1998).]
Soil Type n
MedianTOC
(g/kg)
Median Kd forIodide (I-) (ml/g)
Median Kd for Iodate (IO3
-) (ml/g)
Wet SoilSoil That
WasAutoclaved
Wet SoilSoil That
WasAutoclaved
Andosols 20 63.4 1,610 4.3 1,480 19.5
Gray Lowland Soils(Dystric Fluvisols) 14 15.7 413 2.0 412 7.2
Red and YellowSoils
(Orthic Acrisols)10 10.8 209 1.6 217 19.7
Gley Soils(Dystric Gleysols) 5 21.0 1,540 2.2 1,190 9.0
Brown Forrest Soils(Humic Cambisols) 3 54.0 1,290 4.8 1,120 48.9
Sand-DuneRegosols
(Arensols)3 0.6 8.5 0.7 7.9 3.0
VolcanogenousRegosols
(Vitric Andosols)2 9.9 3,180 17.1 1,040 383
Peat Soils(Dystric Histosols) 1 213 5,590 11.4 5,650 13.4
Others 10 16.1 230 1.3 133 10.7
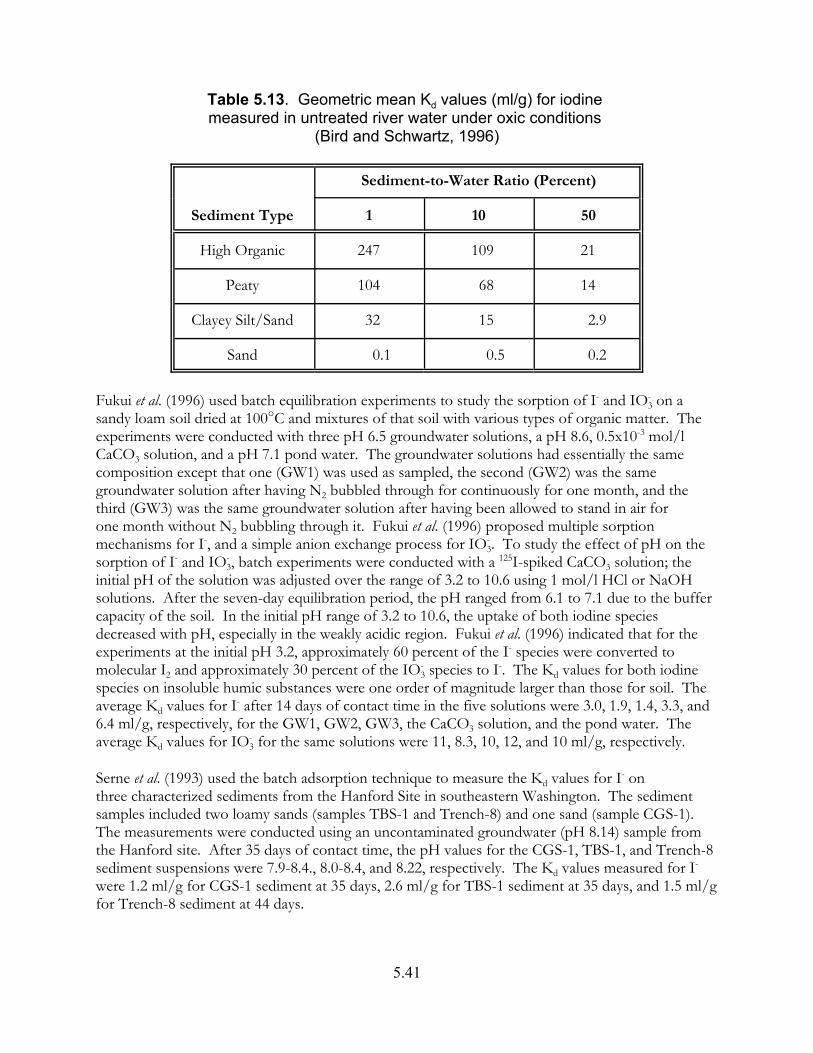
5.41
Table 5.13. Geometric mean Kd values (ml/g) for iodine measured in untreated river water under oxic conditions
(Bird and Schwartz, 1996)
Sediment Type
Sediment-to-Water Ratio (Percent)
1 10 50
High Organic 247 109 21
Peaty 104 68 14
Clayey Silt/Sand 32 15 2.9
Sand 0.1 0.5 0.2
Fukui et al. (1996) used batch equilibration experiments to study the sorption of I- and IO3- on a
sandy loam soil dried at 100"C and mixtures of that soil with various types of organic matter. Theexperiments were conducted with three pH 6.5 groundwater solutions, a pH 8.6, 0.5x10⁻³ mol/lCaCO3 solution, and a pH 7.1 pond water. The groundwater solutions had essentially the samecomposition except that one (GW1) was used as sampled, the second (GW2) was the samegroundwater solution after having N2 bubbled through for continuously for one month, and thethird (GW3) was the same groundwater solution after having been allowed to stand in air forone month without N2 bubbling through it. Fukui et al. (1996) proposed multiple sorptionmechanisms for I-, and a simple anion exchange process for IO3
- . To study the effect of pH on thesorption of I- and IO3
- , batch experiments were conducted with a 125I-spiked CaCO3 solution; theinitial pH of the solution was adjusted over the range of 3.2 to 10.6 using 1 mol/l HCl or NaOHsolutions. After the seven-day equilibration period, the pH ranged from 6.1 to 7.1 due to the buffercapacity of the soil. In the initial pH range of 3.2 to 10.6, the uptake of both iodine speciesdecreased with pH, especially in the weakly acidic region. Fukui et al. (1996) indicated that for theexperiments at the initial pH 3.2, approximately 60 percent of the I- species were converted tomolecular I2 and approximately 30 percent of the IO3
- species to I-. The Kd values for both iodinespecies on insoluble humic substances were one order of magnitude larger than those for soil. Theaverage Kd values for I- after 14 days of contact time in the five solutions were 3.0, 1.9, 1.4, 3.3, and6.4 ml/g, respectively, for the GW1, GW2, GW3, the CaCO3 solution, and the pond water. Theaverage Kd values for IO3
- for the same solutions were 11, 8.3, 10, 12, and 10 ml/g, respectively.
Serne et al. (1993) used the batch adsorption technique to measure the Kd values for I- onthree characterized sediments from the Hanford Site in southeastern Washington. The sedimentsamples included two loamy sands (samples TBS-1 and Trench-8) and one sand (sample CGS-1). The measurements were conducted using an uncontaminated groundwater (pH 8.14) sample fromthe Hanford site. After 35 days of contact time, the pH values for the CGS-1, TBS-1, and Trench-8sediment suspensions were 7.9-8.4., 8.0-8.4, and 8.22, respectively. The Kd values measured for I- were 1.2 ml/g for CGS-1 sediment at 35 days, 2.6 ml/g for TBS-1 sediment at 35 days, and 1.5 ml/gfor Trench-8 sediment at 44 days.
1 Andosol (or Andept) is defined as a black or dark brown soil that is formed from volcanic material. It ischaracterized as being high in organic material, low in exchangeable bases, and high in exchangeable aluminum (Batesand Jackson, 1980).
5.42
Muramatsu et al. (1990) used the batch equilibration method to study the effects of heating andgamma-irradiation of soil relative to the sorption of I- and IO3
- on soil and selected soil componentsin deionized water. The Kd values were measured for I- and IO3
- on soils identified as a field soil(andosol),1 rice paddy soil, and sandy soil, and on bentonite, kaolinite, quartz sand, Fe2O3, Al2O3,and humic acid. The organic carbon contents of the dry soils were 4.4, 2.4, and 1.4 percent for thefield, rice paddy, and sandy soils, respectively. The soil pH values were 5.4, 5.7, and 5.5, for thefield, rice paddy, and sandy soils, respectively. The sorption measurements were completed on theuntreated samples of each soil type as well as samples of each soil that were dried at severaltemperatures (in air at ambient conditions and at 100, 150, 200, and 300"C) and that were gamma-irradiated. Desorption experiments were also conducted at 25 and 95"C using the field soil andseveral leachates, such as deionized water, NaOH, K2SO3, HCl, and others. The Kd values measuredfor the untreated soils are listed in Table 5.14. The reader is referred to Table III in Muramatsu et al.(1990) for the Kd values for the soils with different drying treatments. They noted that the measuredKd values probably represented a mixture of the sorption of I- and IO3
- , because part of the initialconcentration of IO3
- probably reduced to I- during the course of the measurements. Sorption of I-
and IO3- on the untreated field soil was considerably greater than their sorption on the sandy soil.
These results indicated that the sorbed iodine was associated with the organic matter in the soilsamples (Muramatsu et al., 1990). The Kd values decreased with increasing temperature of the soildrying treatments. Iodine did not sorb significantly on quartz sand, bentonite, kaolinite, or Al2O3under these conditions. Significant sorption was measured for both I- and IO3
- on Fe2O3 and humicacid reagent used in these experiments.
Sheppard and Thibault (1988) studied the vertical migration of iodine in two types of mires typicalof the Precambrian Shield in Canada. Sheppard and Thibault (1988) derived in situ Kd values fromanalyses of the dried peat and pore water. The Kd values determined for iodine ranged from 0.2 to64 ml/g. The investigators proposed that the mobility of iodine was related to the aeration statusand botanical origin of the peat.
Gee and Campbell (1980) used batch equilibration methods to measure Kd values for 125I on a sandysediment from the Hanford Site in southeastern Washington. The iodine sorption experiments wereconducted with six synthetic groundwater solutions as well as with low and high nitrate saltsolutions. The 125I Kd values for the sand sediment with the groundwater solutions ranged from 4 to15 ml/g. The Kd values for the salt solutions were 18 and 4 ml/g for the high and low saltsolutions, respectively. The addition of ethylenediamine tetraacetic acid (EDTA) to the 125I-spikedsolution had the apparent effect of decreasing the Kd values for the measurements made with thehigh and low salt solutions.
Wildung et al. (1974) used the batch equilibration method to measure the Kd values for I- and methyliodide on 22 types of soils collected in Oregon, Washington, and Minnesota. The Kd values for I-
and methyl iodide range from 0.8 to 52.6 ml/g, and 0.1 to 3.1 ml/g, respectively. The sorption of I-
was determined to be correlated only to the content of silt-size particles in these soils. Wildung et al.
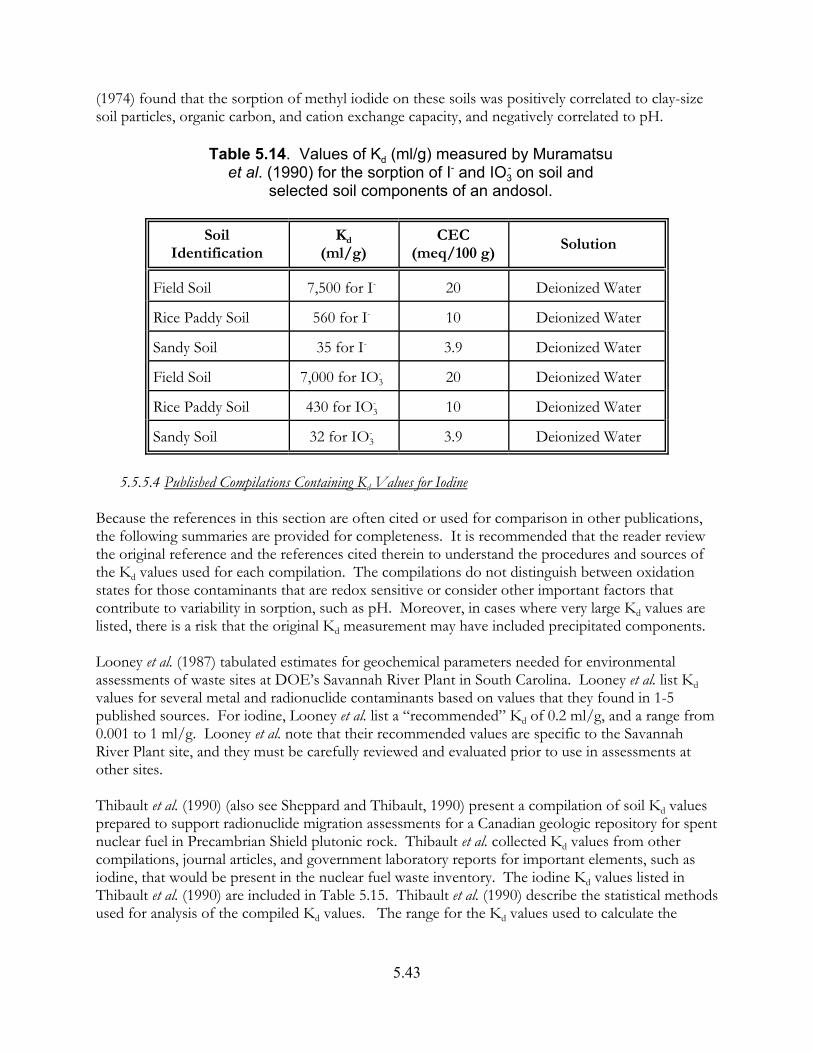
5.43
(1974) found that the sorption of methyl iodide on these soils was positively correlated to clay-sizesoil particles, organic carbon, and cation exchange capacity, and negatively correlated to pH.
Table 5.14. Values of Kd (ml/g) measured by Muramatsu et al. (1990) for the sorption of I- and IO3
- on soil and selected soil components of an andosol.
SoilIdentification
Kd
(ml/g)CEC
(meq/100 g)Solution
Field Soil 7,500 for I- 20 Deionized Water
Rice Paddy Soil 560 for I- 10 Deionized Water
Sandy Soil 35 for I- 3.9 Deionized Water
Field Soil 7,000 for IO3- 20 Deionized Water
Rice Paddy Soil 430 for IO3- 10 Deionized Water
Sandy Soil 32 for IO3- 3.9 Deionized Water
5.5.5.4 Published Compilations Containing Kd Values for Iodine
Because the references in this section are often cited or used for comparison in other publications,the following summaries are provided for completeness. It is recommended that the reader reviewthe original reference and the references cited therein to understand the procedures and sources ofthe Kd values used for each compilation. The compilations do not distinguish between oxidationstates for those contaminants that are redox sensitive or consider other important factors thatcontribute to variability in sorption, such as pH. Moreover, in cases where very large Kd values arelisted, there is a risk that the original Kd measurement may have included precipitated components.
Looney et al. (1987) tabulated estimates for geochemical parameters needed for environmentalassessments of waste sites at DOE’s Savannah River Plant in South Carolina. Looney et al. list Kdvalues for several metal and radionuclide contaminants based on values that they found in 1-5published sources. For iodine, Looney et al. list a “recommended” Kd of 0.2 ml/g, and a range from0.001 to 1 ml/g. Looney et al. note that their recommended values are specific to the SavannahRiver Plant site, and they must be carefully reviewed and evaluated prior to use in assessments atother sites.
Thibault et al. (1990) (also see Sheppard and Thibault, 1990) present a compilation of soil Kd valuesprepared to support radionuclide migration assessments for a Canadian geologic repository for spentnuclear fuel in Precambrian Shield plutonic rock. Thibault et al. collected Kd values from othercompilations, journal articles, and government laboratory reports for important elements, such asiodine, that would be present in the nuclear fuel waste inventory. The iodine Kd values listed inThibault et al. (1990) are included in Table 5.15. Thibault et al. (1990) describe the statistical methodsused for analysis of the compiled Kd values. The range for the Kd values used to calculate the

5.44
“geometric mean” cover several orders of magnitude. Readers are cautioned against using“geometric mean” values or any other form of averaged Kd values as “default” Kd values, as suchvalues are usually calculated from data compiled from different investigators for different soilsystems. These mean or average values do not represent any particular environmental system andgeochemical conditions. As discussed in Volume I (EPA, 1999b), the variation observed in theliterature for Kd values for a contaminant is due to differences in sorption mechanisms, geochemicalconditions, soil materials, and methods used for the measurements.
Table 5.15. Iodine Kd values (ml/g) listed in Thibault et al. (1990, Tables 4 to 8).
Soil Type
Kd Values (ml/g)
GeometricMean
Number ofObservations
Range
Sand 1 22 0.04 - 81
Silt 5 33 0.1 - 43
Clay 1 8 0.2 - 29
Organic 25 9 1.4 - 368
McKinley and Scholtis (1993) compare radionuclide Kd sorption databases used by differentinternational organizations for performance assessments of repositories for radioactive wastes. Theiodine Kd values listed in McKinley and Scholtis (1993, Tables 1, 2, and 4) are listed in Table 5.16. The reader should refer to sources cited in McKinley and Scholtis (1993) for details regarding theirsource, derivation, and measurement. Radionuclide Kd values listed for cementitious environmentsin McKinley and Scholtis (1993, Table 3) are not included in Table 5.16. The organizations listed inthe tables include: AECL, GSF, IAEA, KBS, NAGRA, NIREX, NRC, NRPB, PAGIS (CEC), PSE,RIVM, SKI, TVO, and UK DoE (acronyms defined in Section A.1.0 in Appendix A).
5.5.5.5 Kd Studies of Iodine on Pure Mineral, Oxide, and Crushed Rock Materials
Numerous adsorption studies have been conducted of iodine on pure minerals, oxide phases, andother geologic-related materials. The Kd values listed in these studies are not necessarily relevant tothe mobility and sorption of iodine in soils. However, they are listed in Appendix F forcompleteness. The references cited in Appendix F are listed in the main reference list in Chapter 6. The potential value of the references that they cite and the sorption processes that they discuss is leftto the reader. Many of these studies were conducted because of extensive research interest indeveloping getters (adsorbents) that could be added to waste streams and tailored barriers forremoval and/or immobilization of dissolved iodine. The studies of iodine sorption on crushed rockwere conducted typically as part of national research programs to investigate the feasibility ofgeological disposal of high-level radioactive waste (HLW).

5.45
Table 5.16. Iodine Kd values (ml/g) listed by McKinley and Scholtis (1993, Tables 1, 2, and 4) from sorption databases used by different international organizations for performance
assessments of repositories for radioactive wastes.
Organization
Argillaceous (Clay) Crystalline Rock Soil/Surface Sediment
SorbingMaterial
Kd (ml/g)
SorbingMaterial
Kd (ml/g)
SorbingMaterial
Kd (ml/g)
AECL Bentonite-Sand 0.0085 Granite 0 Soil/Sediment 10
GSF Sediment 0.5
IAEA Pelagic Clay 200
KBS-3 Bentonite 13 Granite 0
NAGRABentonite 5 Granite 1 Soil/Sediment 1
Clay 5 Soil/Sediment 10
NIREX Clay Mudstone 0
NRC
Clay, Soil Shale 0 Granite 0
Basalt 0
Tuff 0
NRPB Clay 0 Soil/Sediment 0
PAGIS Subseabed 100
PSE Sediment 0
RIVM Sandy Clay 1
SKI Bentonite 1 Granite 0
TVOBaltic SeaSediment 100 Crystalline
Rock, Reducing 0.5 Soil/Sediment 100
Lake Sediment 100 Crystalline Rock 0.8
UK DoEClay 10 Soil/Sediment 0.8
Coastal MarineWater 20
5.6 Neptunium Geochemistry and Kd Values
5.6.1 Overview: Important Aqueous- and Solid-Phase Parameters ControllingRetardation
Neptunium is a transuranic element that may exist in several valence states. Neptunium(V) (Np(V))and Np(IV) are the most important valence states in natural waters. Over the pH range of mostnatural waters, Np(V) is present primarily as the cation NpO2
+. Neptunium(V) is consideredrelatively mobile, and Np(V) solids are quite soluble. If the concentrations of dissolved Np(V) are
5.46
sufficiently high, the solubility of Np(V) may be controlled by solids such as NpO2OH,NaNpO2CO3, Na3NpO2(CO3)2, and KNpO2CO3. Neptunium (IV) exists in reducing (i.e., low Eh)groundwater systems, and is not considered very mobile, because it forms sparingly soluble oxideand hydroxide solids. Reduction of Np(V) to Np(IV) can occur by a variety of abiotic and bioticprocesses.
Neptunium(V) aqueous species sorb to some extent to iron oxides and clays, but do not sorb to amajor degree on most common minerals. Because NpO2
+ does not compete favorably withdissolved Ca2+ and other divalent ions for adsorption sites on soils, the Kd values for Np(V) arerelatively low. The adsorption of Np(V) has a strong dependence on pH. Typically, the sorption ofNp(V) on minerals is negligible at pH values less than 5, and increases rapidly at pH values between5 to 7. This pH-dependency is expected for ions present in solution primarily as cations. Incarbonate-containing solutions, the adsorption of Np(V) on iron oxides has been observed todecrease at pH values greater than 7 to 9 in response to the formation of aqueous Np(VI) carbonatecomplexes.
5.6.2 General Geochemistry
Neptunium [Np, atomic number (Z) = 93] has 19 isotopes (Tuli, 2000). The atomic masses of theseisotopes range from 225 to 244. Neptunium-237 (237Np) has a half live (t½) of 2.14x10⁶ years and isthe most important neptunium isotope from an environmental perspective Potential sources of237Np include fallout from nuclear weapons, effluent cooling water from fission reactors, industrialprocessing of 237Np produced in fission reactors, and 237Np present as a component of high-levelnuclear wastes (Thompson, 1982). Although spent nuclear fuel contains a relatively small initialconcentration of 237Np, its concentration increases with time from the radioactive decay of Am-241(t½ = 432.2 years). Because of its long half-life, 237Np will be a major contributor to the radiationinventory of nuclear waste stored in geologic repositories after approximately 100,000 years(Kaszuba and Runde, 1999).
Neptunium is a transuranic (actinide) element. Neptunium may exist in the +3, +4, +5, +6, and +7valence states, but only the +4, +5, and possibly +6 states are relevant to natural environments. Neptunium(VI) is stable only in highly oxidizing solutions and is therefore not important undermost environmental conditions. As noted in Volume II (EPA, 1999c), aqueous speciation andsolubility reactions, and sorption onto minerals and soils usually differ considerably for redox-sensitive elements contaminants in their different valence states. Neptunium(V) is consideredrelatively mobile, because Np(V) solids are quite soluble and Np(V) aqueous species do not readilysorb on common minerals. Over the pH range of most natural waters, Np(V) will be presentprimarily as the neptunyl ion, NpO2
+. Neptunium(IV) exists in reducing (i.e., low Eh) groundwatersystems, and like U(IV) and Pu(IV), may form sparingly soluble oxide and hydroxide solids that limitthe mobility of Np(IV) under reducing conditions. Redox-sensitive elements, such as neptunium,can be immobilized by surface-mediated, heterogeneous reduction/sorption reactions onFe(II)-containing oxide and silicate minerals. Many of these minerals exist as coatings on soilparticles and/or primary constituents of soils. The heterogeneous electrochemical reactions occurby electron transfer reactions by which the Fe(II) is oxidized to Fe(III), and the redox-sensitivecontaminant, is reduced to a lower valence state, such as reduction of Np(V) to Np(IV). Thesereactions have recently been the subject of considerable interest because they may have a significanteffect on the mobility of redox-sensitive elements in the vadose zone, aquatic sediments, and
1 Lemire et al. (2001) was published after the writing of this report had been completed. Therefore, the Np(V) speciesand associated thermodynamic constants from Lemire et al. (2001) were not included in the speciation calculations listedin this section.
5.47
groundwater. They are the basis for certain remediation technologies, such as permeable barrierscomposed of zero-valent iron particles (i.e., as metallic iron) or sodium-dithionite reduced soils,which are currently being tested for immobilization of groundwater contaminants.
Surface-mediated, heterogeneous reduction/sorption reactions are reviewed in detail by White(1990), and studied experimentally by White and Yee (1985), White et al. (1994), and many others. Experimental studies include investigations of Fe(II)-containing silicate minerals and/or rocks in thereduction of: Np(V) (Hakanen and Lindberg, 1991; Susak et al., 1983; Meyer et al., 1984); Fe(III)(White and Peterson, 1996; White and Yee, 1985); Cr(VI) (White and Peterson, 1996; Eary and Rai,1989, Ilton and Veblen, 1994); Cu(II) (White and Peterson, 1996); nitrate (Postma, 1990); and V(V)(White and Peterson, 1996). These surface-mediated, heterogeneous reduction/sorption reactionshave also been observed in sorption experiments conducted with crushed rock materials. Forexample, Bondietti and Francis (1979) showed that Np(V) could be reduced to less soluble Np(IV)by Fe(II) in minerals in igneous rocks.
The reduction of Np(V) to Np(IV) by biotic processes has also been demonstrated. Lloyd et al.(2000a) conducted a biochemical study of the reduction of Np(V). Their experiments demonstratedthat Shewanella putrefaciens reduced Np(V) to a lower valence state, possibly Np(IV). However, thisreduction process was not sufficient to remove neptunium from solution. Lloyd et al. (2000a) wereable to remove 237Np and its daughter product of protactinium-233 (233Pa) from solution bybioprecipitation using a combination of the two organisms S. putrefaciens and Citrobacter sp. Thebioprecipitation resulted from bioreduction to Np(IV) by S. putrefaciens in concert with phosphateliberation by the Citrobacter sp from the glycerol 2-phosphate solution.
The environmental chemistry and mobility of neptunium in surface water, groundwater, andgeologic environments has been reviewed extensively by others, such as Silva and Nitsche (1995),Tanaka et al. (1992), Lieser and Mühlenweg (1988); Coughtrey et al. (1984), Thompson (1982),Onishi et al. (1981), and Ames and Rai (1978). Although somewhat dated, the extensive review byCoughtrey et al. (1984) is particularly noteworthy.
5.6.3 Aqueous Speciation
Lemire et al. (2001) have published an extensive, detailed review of the chemical thermodynamics ofneptunium. The thermodynamic data for neptunium aqueous species and solids are limited and notwell known relative to other radionuclides. Figure 5.7 is an Eh-pH diagram that shows thedominant aqueous species of neptunium as a function of pH and Eh (redox potential) at 25°C withrespect to the thermodynamic stability of water.
Possible Np(V) aqueous species include those listed in Table 5.17.1 The distribution of aqueousspecies for Np(V) (see Figure 5.8) as a function of pH was calculated for an oxidizing environmentcontaining the water composition listed in Table 5.1. The speciation calculations indicate that theneptunyl ion, NpO2
+, is the dominant aqueous species for most environmentally-relevant pHconditions. The aqueous speciation of neptunium is dominated by NpO2
+ over a wide range of
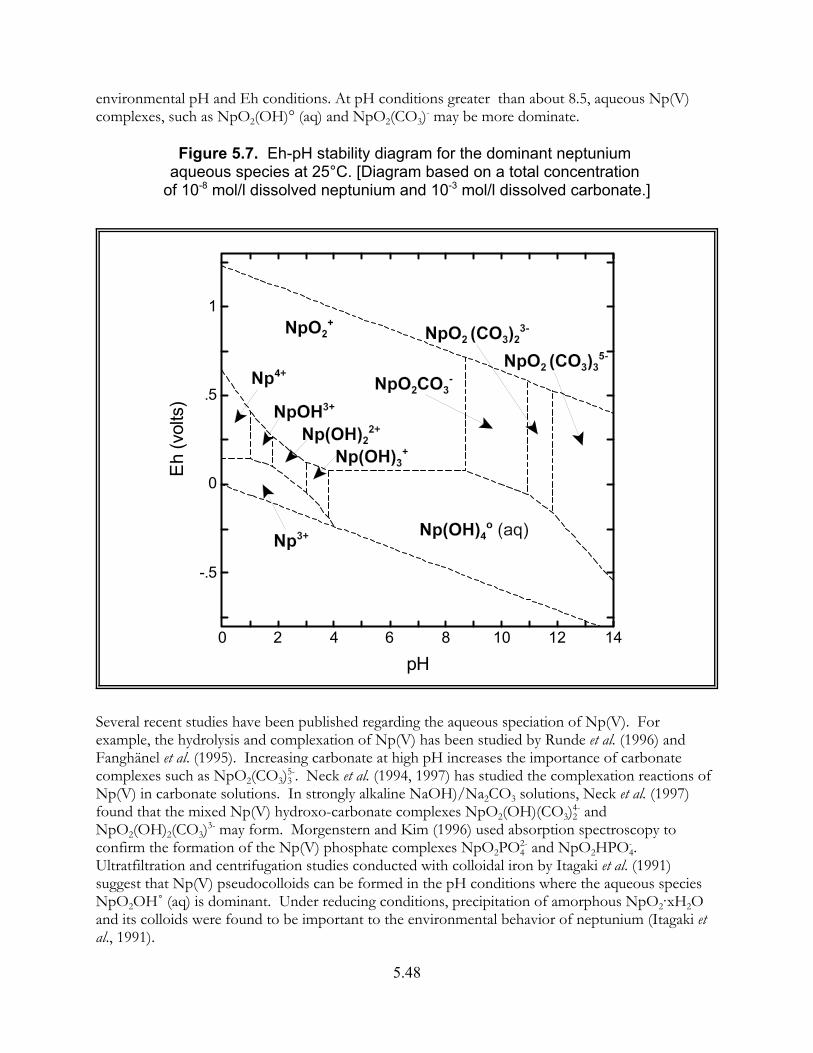
5.48
0 2 4 6 8 10 12 14
-.5
0
.5
1
pH
Eh
(vol
ts)
environmental pH and Eh conditions. At pH conditions greater than about 8.5, aqueous Np(V)complexes, such as NpO2(OH)° (aq) and NpO2(CO3)- may be more dominate.
Figure 5.7. Eh-pH stability diagram for the dominant neptunium aqueous species at 25°C. [Diagram based on a total concentration
of 10-8 mol/l dissolved neptunium and 10-3 mol/l dissolved carbonate.]
Several recent studies have been published regarding the aqueous speciation of Np(V). Forexample, the hydrolysis and complexation of Np(V) has been studied by Runde et al. (1996) andFanghänel et al. (1995). Increasing carbonate at high pH increases the importance of carbonatecomplexes such as NpO2(CO3)3
5-. Neck et al. (1994, 1997) has studied the complexation reactions ofNp(V) in carbonate solutions. In strongly alkaline NaOH)/Na2CO3 solutions, Neck et al. (1997)found that the mixed Np(V) hydroxo-carbonate complexes NpO2(OH)(CO3)2
4- andNpO2(OH)2(CO3)3- may form. Morgenstern and Kim (1996) used absorption spectroscopy toconfirm the formation of the Np(V) phosphate complexes NpO2PO4
2- and NpO2HPO4- .
Ultratfiltration and centrifugation studies conducted with colloidal iron by Itagaki et al. (1991)suggest that Np(V) pseudocolloids can be formed in the pH conditions where the aqueous speciesNpO2OH/ (aq) is dominant. Under reducing conditions, precipitation of amorphous NpO2AxH2Oand its colloids were found to be important to the environmental behavior of neptunium (Itagaki etal., 1991).
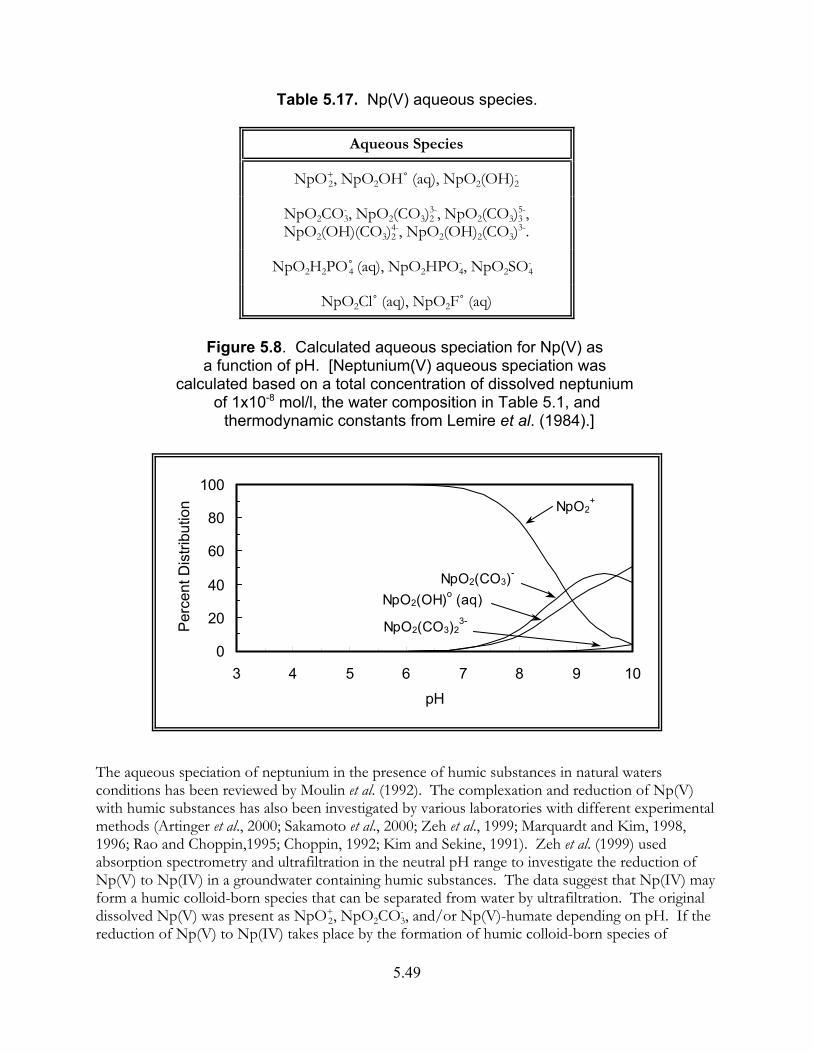
5.49
0
20
40
60
80
100
3 4 5 6 7 8 9 10
pH
Per
cent
Dis
tribu
tion NpO2
+
NpO2(CO3)-
NpO2(CO3)23-
NpO2(OH)o (aq)
Table 5.17. Np(V) aqueous species.
Aqueous Species
NpO2+, NpO2OH/ (aq), NpO2(OH)2
-
NpO2CO3- , NpO2(CO3)2
3-, NpO2(CO3)35-,
NpO2(OH)(CO3)24-, NpO2(OH)2(CO3)3-.
NpO2H2PO4/ (aq), NpO2HPO4- , NpO2SO4
-
NpO2Cl/ (aq), NpO2F/ (aq)
Figure 5.8. Calculated aqueous speciation for Np(V) as a function of pH. [Neptunium(V) aqueous speciation was
calculated based on a total concentration of dissolved neptunium of 1x10⁻⁸ mol/l, the water composition in Table 5.1, and thermodynamic constants from Lemire et al. (1984).]
The aqueous speciation of neptunium in the presence of humic substances in natural watersconditions has been reviewed by Moulin et al. (1992). The complexation and reduction of Np(V)with humic substances has also been investigated by various laboratories with different experimentalmethods (Artinger et al., 2000; Sakamoto et al., 2000; Zeh et al., 1999; Marquardt and Kim, 1998,1996; Rao and Choppin,1995; Choppin, 1992; Kim and Sekine, 1991). Zeh et al. (1999) usedabsorption spectrometry and ultrafiltration in the neutral pH range to investigate the reduction ofNp(V) to Np(IV) in a groundwater containing humic substances. The data suggest that Np(IV) mayform a humic colloid-born species that can be separated from water by ultrafiltration. The originaldissolved Np(V) was present as NpO2
+, NpO2CO3- , and/or Np(V)-humate depending on pH. If the
reduction of Np(V) to Np(IV) takes place by the formation of humic colloid-born species of
5.50
Np(IV), the colloids may remain stable in groundwater and mobile in porous aquifer systems (Zeh etal., 1999).
Marquardt and Kim (1998) investigated the humate complexation of NpO2+ over the pH range 7 to
9 with purified humic acid extracted from a groundwater from Gorleben in northern Germany. Their results indicated that the only reaction competitive with Np(V)-humate complexation was theformation of Np(V) complexes with dissolved carbonate. Their calculations suggested that humatecomplexation of Np(V) may play an important role in groundwater with relatively high humic acidconcentrations. However, Marquardt and Kim (1998) noted that the reduction of Np(V) to Np(IV)by interaction with humic acid was another important reaction to be considered with respect to theenvironmental behavior of neptunium. Marquardt et al. (1996) studied the influence of neptuniumand humic acid concentrations, pH value, ionic strength, temperature, and competing cations on thecomplexation of Np(V) with humic acids. The stability constant for the complex was found toincrease with increasing concentration of Np(V). No effect of ionic strength between 0.001 and 0.1M was observed, and neptunium-humate complexation decreased with increasing temperature. Calcium and magnesium competed with neptunium for the available humic ligands. Underanaerobic conditions and at very low metal concentrations, humic acid reduces Np(V) to Np(IV),and the rate of reduction was dependent on pH. Rao and Choppin (1995) used near-IR (infrared)absorption and two sources of humic acid to determine the binding constants for Np(V)-humatecomplexes in the pH range 4.5 to 7.5. Their results indicated that Np(V) forms a single type ofcomplex with humate, probably a 1:1 Np(V)-carboxylate complex.
5.6.4 Dissolution/Precipitation/Coprecipitation
The solubility of Np(V) has been studied extensively for the purpose of estimating the maximumsolubility concentrations of dissolved neptunium that might be released from a geologic repositoryfor high level waste (HLW) with subsequent migration in groundwater systems (e.g., Novak andRoberts, 1995; Neck et al., 1994; Lemire, 1984; and others). In carbonate-free aqueous solutionswith OH- as the only complexing ligand, the maximum concentration of dissolved Np(V) is likelydetermined by the solubility product of solids, such as Np2O5AxH2O (Efurd et al., 1998) or solidNpO2OH (Al Mahamid et al., 1998; Roberts et al., 1996). In carbonate-rich solutions, a variety ofsolids, such as hydrated NaNpO2CO3 (Neck et al., 1994; Lemire et al., 1993), Na3NpO2(CO3)2(Al Mahamid et al., 1998; Neck et al., 1994; Lemire et al., 1993), and KNpO2CO3 (Al Mahamid et al.,1998; Lemire et al., 1993), have been studied as possible solubility controls for the maximumconcentrations of dissolved Np(V) under oxidizing conditions. Neck et al. (1994) studied thesolid/liquid reactions of Np(V) in carbonate solutions at different ionic strength. At the conditionsof his experiments, he found that NaNpO2CO3 and Na3NpO2(CO3)2 formed at pH values less than8.5 and greater than 9, respectively.
Solids such as Np(IV) hydrous oxide (Nakayama et al., 1996; Rai and Ryan, 1985); amorphousNpO2AxH2O (Rai et al., 1987), and amorphous NpO2 (Rai et al., 1999) have been studied as possiblesolubility controls for Np(IV).

5.51
5.6.5 Adsorption/Desorption
5.6.5.1 Guidance for Screening Calculations of Adsorption
Neptunium(V) aqueous species sorb to some extent to iron oxides and clays, but do not sorb to amajor degree on most common minerals. Therefore, dissolved Np(V) is considered to be relativelymobile in soil systems. Because NpO2
+ does not compete favorably with dissolved Ca2+ and otherdivalent ions for adsorption sites on soils, the Kd values for Np(V) are relatively low (Kaplan andSerne, 2000). Coughtrey et al. (1984) review sorption studies published prior to 1984 for neptuniumto soils and crushed rock materials. Some of these studies and more recent neptunium adsorptionstudies are described in the sections below.
The limited number of Kd studies identified during this review for the adsorption of Np(V) on soilprecluded derivation of Kd look-up tables of conservative minimum and maximum Kd values forNp(V). Of the studies discussed below, only Routson et al. (1975, 1977), Serne et al. (1993), andKaplan et al. (1996) report Kd values and corresponding pH values for Np(V) adsorption on soil. The majority of their values are limited to the pH range from 6.2 to 8.5, and only Routson et al.(1975, 1977) reports Np(V) Kd values for pH values less than 8.5. For the pH range from 4 to 10, itis suggested that a Kd of 0.2 ml/g be used as a minimum Kd value for screening calculations ofamericium migration in soils. This value was reported for pH 7.8 by Routson et al. (1975, 1977) andis the lowest Kd value that they gave for experiments conducted with very to moderately dilutecalcium and sodium electrolyte solutions. The other Kd values reported by Routson et al. (1975,1977) for these solution concentrations ranged from 0.36 ml/g at pH 7.4 to 3.51 at pH 4.1. It islikely that the conservative minimum Kd for Np(V) in the pH range from 4 to 10 is greater than thislimiting value, but no additional Np(V) Kd studies substantiate this assumption. As notedpreviously, it is recommended that for site-specific calculations, partition coefficient values measuredat site-specific conditions are absolutely essential.
Given the limited availability of Kd studies for the adsorption of Np(V) on soil, readers may want toconsider using geochemical models [see Section 5 in Volume I (EPA, 1999b)] to estimate the massof adsorbed Np(V). Kohler et al. (1999) and Girvin et al. (1991) have determined the neptuniumsurface complexation reactions and associated intrinsic constants for modeling Np(V) adsorption onhematite and amorphous iron oxyhydroxide, respectively. If soil characterization studies indicatethat either of these iron oxides is an important constituent for soils at the site under study,geochemical models can be used to calculate the mass of Np(V) adsorbed on these oxides, andbased on the iron oxide concentration in the site soils, estimate a Kd for Np(V).
5.6.5.2 General Adsorption Studies
Experimental studies indicate that the adsorption of Np(V) has a strong dependence on pH,especially for iron oxides (Kohler et al., 1999; Girvin et al., 1991; Allard, 1984). Typically, thesorption of Np(V) on minerals is negligible at pH values less than 5, and increases rapidly when pHis between 5 to 7. This pH-dependency is expected for ions that are present in solution primarily ascations, such as NpO2
+ (EPA, 1999b). In carbonate-containing solutions, the adsorption of Np(V)on iron oxides has been observed to decrease at pH values greater than 7 to 9 in response to theformation of aqueous Np(VI) carbonate complexes (Kohler et al., 1999). This latter behavior is

5.52
analogous to that observed for the adsorption of U(VI) in carbonate-solutions at alkaline pH values[see Section 5.11 in Volume II (EPA, 1999c)].
Table 5.18. Neptunium(V) Kd values (ml/g) measured for three sediments by Kaplan et al. (1996).
Sediment Sample
Kd Values (ml/g)
7 days 77 days
Touchet Bed Sand (sample TBS-1) 2.17 3.62
Silty Loam (Sample Trench AE-3) 2.67 13.48
Very Coarse Sand (Sample Trench-94) 14.17 19.86
5.6.5.3 Kd Studies for Neptunium on Soil Materials
Serne et al. (1993) measured Kd values for Np(V) in groundwater contacting the <2-mm size fractionof Trench-8 sediment from the DOE’s Hanford Site in eastern Washington. The pH of theHanford groundwater was 8.3. The particle size distribution for the in situ Trench-8 sedimentcontained 9.7 percent gravel, 78.6 percent sand, 6.3 percent silt, and 5.4 percent clay. The <2-mmsize fraction of this sediment contained 87 percent sand, 7 percent silt, and 6 percent clay. The Kdvalues measured at 5 and 44 days were 13.5±3 and 29.1±3.6 ml/g, respectively.
Kaplan et al. (1996) used the batch technique to measure the Kd values for Np(V) on three sedimentsamples from the Hanford Site in southeastern Washington. The measurements were conductedwith a groundwater (pH 8.46) taken from a well located in an uncontaminated area of the HanfordSite. The sediment samples included a Touchet bed sand (sample TBS-1), a silty loam (sampleTrench AE-3), and a very coarse sand (sample Trench-94). Kaplan et al. (1996) observed that the Kdvalues increased as a function of time. The Kd values measured at 7 and 77 days for thethree sediments are listed in Table 5.18.
Sheppard and Thibault (1988) studied the vertical migration of neptunium in two types of mirestypical of the Precambrian Shield in Canada. Sheppard and Thibault (1988) derived in situ Kd valuesfrom analyses of the dried peat and pore water. The Kd values determined for neptunium rangedfrom 31 to 2,600 ml/g. Neptunium was quickly immobilized in the reducing environment of themire, which was the cause for the large in situ neptunium Kd values.
Nishita et al. (1981) studied the extractability of 237Np(V) several types of soils as a function of pH. The extractability of neptunium was considered to parallel the solubilization of insoluble aluminum,iron, and/or manganese hydrous oxides, which are important adsorbents for dissolved contaminantsin soil systems (Nishita et al., 1981). The Np(V) Kd values and soil characteristics determined forthese soils by Nishita et al. (1981) are listed in Table 5.19. Nishita et al. (1981) concluded that Np(V)will likely be more mobile than americium, curium, and plutonium in geologic systems.
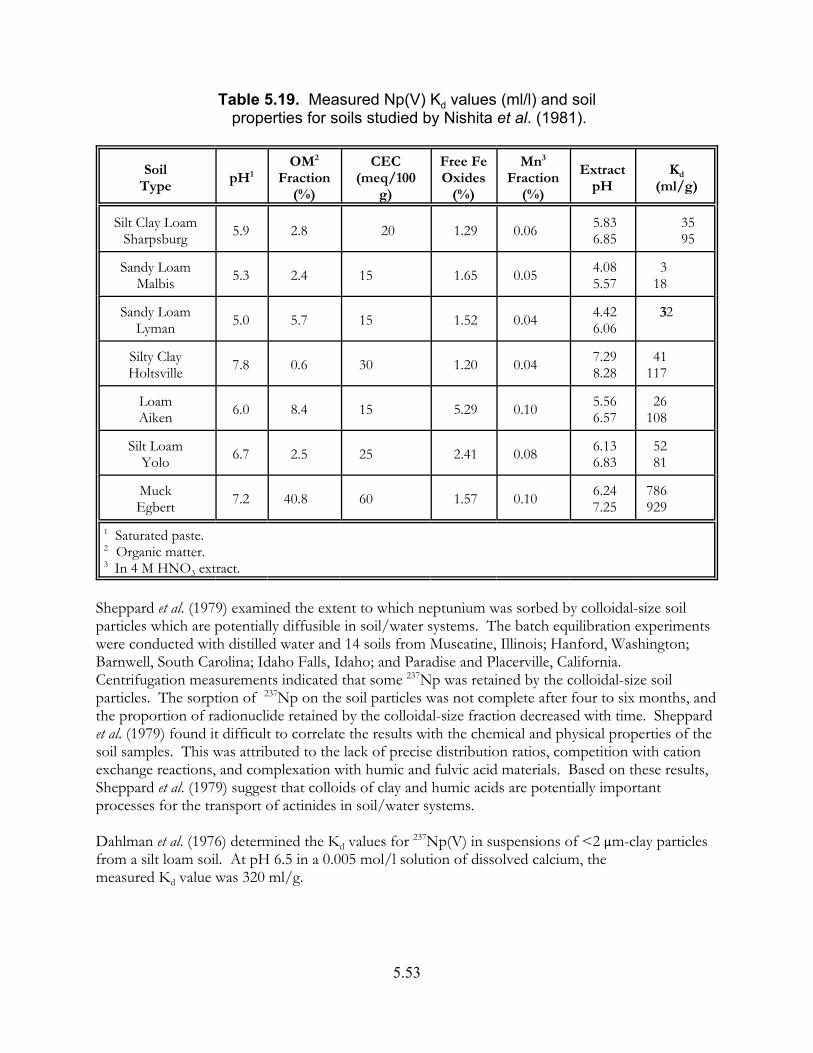
5.53
Table 5.19. Measured Np(V) Kd values (ml/l) and soil properties for soils studied by Nishita et al. (1981).
SoilType
pH1OM2
Fraction(%)
CEC(meq/100
g)
Free FeOxides
(%)
Mn3
Fraction(%)
ExtractpH
Kd
(ml/g)
Silt Clay LoamSharpsburg 5.9 2.8 20 1.29 0.06 5.83
6.853595
Sandy LoamMalbis 5.3 2.4 15 1.65 0.05 4.08
5.573
18
Sandy LoamLyman 5.0 5.7 15 1.52 0.04 4.42
6.06332
Silty ClayHoltsville 7.8 0.6 30 1.20 0.04 7.29
8.2841
117
LoamAiken 6.0 8.4 15 5.29 0.10 5.56
6.5726
108
Silt LoamYolo 6.7 2.5 25 2.41 0.08 6.13
6.835281
MuckEgbert 7.2 40.8 60 1.57 0.10 6.24
7.25786929
1 Saturated paste.2 Organic matter.3 In 4 M HNO3 extract.
Sheppard et al. (1979) examined the extent to which neptunium was sorbed by colloidal-size soilparticles which are potentially diffusible in soil/water systems. The batch equilibration experimentswere conducted with distilled water and 14 soils from Muscatine, Illinois; Hanford, Washington;Barnwell, South Carolina; Idaho Falls, Idaho; and Paradise and Placerville, California. Centrifugation measurements indicated that some 237Np was retained by the colloidal-size soilparticles. The sorption of 237Np on the soil particles was not complete after four to six months, andthe proportion of radionuclide retained by the colloidal-size fraction decreased with time. Sheppardet al. (1979) found it difficult to correlate the results with the chemical and physical properties of thesoil samples. This was attributed to the lack of precise distribution ratios, competition with cationexchange reactions, and complexation with humic and fulvic acid materials. Based on these results,Sheppard et al. (1979) suggest that colloids of clay and humic acids are potentially importantprocesses for the transport of actinides in soil/water systems.
Dahlman et al. (1976) determined the Kd values for 237Np(V) in suspensions of <2 :m-clay particlesfrom a silt loam soil. At pH 6.5 in a 0.005 mol/l solution of dissolved calcium, themeasured Kd value was 320 ml/g.

5.54
Table 5.20. Properties of soils used in Kd measurements by Routson et al. (1975, 1977).
SoilCaCO3
(mg/g)Silt(%)
Clay(%)
CEC(meq/100 g
)pH
Washington 0.8 10.1 0.5 4.9 7.0
South Carolina <0.2 3.6 37.2 2.5 5.1
Table 5.21. Neptunium Kd values (ml/g) measured for Washington and South Carolina soil samples in Ca(NO3)2 and
NaNO3 solutions by Routson et al. (1975, 1977).
Concentration ofElectrolyte (mol/l)
Kd Values (ml/g)
Washington Soil South Carolina Soil
Ca(NO3)2 Solution
0.002 2.37 0.25
0.02 0.93 Not Determined
0.05 0.78 Not Determined
0.10 0.62 Not Determined
0.20 0.36 0.16
NaNO3 Solution
0.015 3.90 0.66
0.030 3.51 0.57
0.30 3.28 0.51
0.75 3.28 0.45
3.00 3.19 0.43
Routson et al. (1975, 1977) used batch equilibration experiments to measure Kd values for 237Np ontwo soils as a function of the concentrations of dissolved calcium and sodium. The soil sampleswere selected to represent a range of weathering intensities. For arid conditions in the westernUnited States, sandy (coarse-textured), low-exchange capacity soil was selected from a low rainfallarea in eastern Washington. For humid conditions in the southeastern United States, a moderate-exchange capacity soil was selected from South Carolina. Properties of the soils used for thesemeasurements are listed in Table 5.20. The Kd values were measured in 0.002, 0.02, 0.05, 0.10, and
5.55
0.20 mol/l Ca(NO3)2 solutions, and 0.015, 0.030, 0.30, 0.75, and 3.0 mol/l NaNO3 solutions. ThepH values for selected samples of the 237Np solutions in the calcium and sodium systems were 7.4and 4.1 for the Washington soil, and 7.8 and 6.2 for the South Carolina soil. The Kd values (Table5.21) decreased with increasing concentrations of dissolved calcium and sodium.
For the solution concentrations used in these experiments, the Kd values for 237Np on theWashington soil ranged from 2.37 to 0.36 ml/g as a function of dissolved calcium, and 3.90 to3.19 ml/g as a function of dissolved sodium. For the South Carolina soil, the Kd values for 237Npranged from 0.25 to 0.16 ml/g as a function of dissolved calcium, and 0.66 to 0.43 ml/g as afunction of dissolved sodium.
5.6.5.4 Published Compilations Containing Kd Values for Neptunium
Because the references in this section are often cited or used for comparison in other publications,the following summaries are provided for completeness. It is recommended that the reader reviewthe original reference and the references cited therein to understand the procedures and sources ofthe Kd values used for each compilation. The compilations do not distinguish between oxidationstates of contaminants that are redox sensitive (e.g., neptunium) or consider other important factorsthat contribute to variability in sorption, such as pH. Moreover, in cases where very large Kd valuesare listed, there is a risk that the original Kd measurement may have included precipitatedcomponents.
Baes and Sharp (1983) present a simple model developed for order-of-magnitude estimates forleaching constants for solutes in agricultural soils. As part of this model development, they reviewedand determined generic default values for input parameters, such as Kd. A literature review wascompleted to evaluate appropriate distributions for Kd values for various solutes, includingneptunium. Because Baes and Sharp (1983) are cited frequently as a source of Kd values in otherpublished Kd reviews (e.g., Looney et al., 1987; Sheppard and Thibault, 1990), the neptunium Kdvalues listed by Baes and Sharp are reported here for completeness. Based on the distribution thatBaes and Sharp determined for the Kd values for cesium and strontium, they assumed a lognormaldistribution for the Kd values for all other elements in their compilation. Baes and Sharp listed anestimated default Kd of 11 ml/g for neptunium based on 44 Kd values that ranged from 0.16to 929 ml/g for agricultural soils and clays over the pH range 4.5 to 9.0. Their compiled Kd valuesrepresent a diversity of soils, pure clays (other Kd values for pure minerals were excluded), extractingsolutions, measurement techniques, and experimental error.
Looney et al. (1987) tabulated estimates for geochemical parameters needed for environmentalassessments of waste sites at DOE’s Savannah River Plant in South Carolina. Looney et al. list Kdvalues for several metal and radionuclide contaminants based on values that they found in 1-5published sources. For neptunium, Looney et al. list a “recommended” Kd of 10 ml/g, and a rangefrom 0.1 to 1,000 ml/g. Looney et al. note that their recommended values are specific to theSavannah River Plant site, and they must be carefully reviewed and evaluated prior to use inassessments at other sites.

5.56
Table 5.22. Neptunium Kd values (ml/g) listed in Thibault et al. (1990, Tables 4 to 8).
Soil Type
Kd Values (ml/g)
GeometricMean
Number ofObservations
Range
Sand 5 16 0.5 - 390
Silt 25 11 1.3 - 79
Clay 55 4 0.4 - 2,575
Organic 1,200 3 857 - 1,900
Thibault et al. (1990) (also see Sheppard and Thibault, 1990) present a compilation of soil Kd valuesprepared to support radionuclide migration assessments for a Canadian geologic repository for spentnuclear fuel in Precambrian Shield plutonic rock. Thibault et al. collected Kd values from othercompilations, journal articles, and government laboratory reports for important elements, such asneptunium, that would be present in the nuclear fuel waste inventory. The neptunium Kd values inThibault et al. (1990) are included in Table 5.22. Thibault et al. (1990) describe the statistical methodsused for analysis of the compiled Kd values. The range for the Kd values used to calculate the“geometric mean” cover several orders of magnitude. Readers are cautioned against using“geometric mean” values or any other form of averaged Kd values as “default” Kd values, as suchvalues are usually calculated from data compiled from different investigators for different soilsystems. These mean or average values do not represent any particular environmental system andgeochemical conditions. As discussed in Volume I (EPA, 1999b), the variation observed in theliterature for Kd values for a contaminant is due to differences in sorption mechanisms, geochemicalconditions, soil materials, and methods used for the measurements.
McKinley and Scholtis (1993) compare radionuclide Kd sorption databases used by differentinternational organizations for performance assessments of repositories for radioactive wastes. Theneptunium Kd values listed in McKinley and Scholtis (1993, Tables 1, 2, and 4) are listed inTable 5.23. The reader should refer to sources cited in McKinley and Scholtis (1993) for detailsregarding their source, derivation, and measurement. Radionuclide Kd values listed for cementitiousenvironments in McKinley and Scholtis (1993, Table 3) are not included in Table 5.23. Theorganizations listed in the tables include: AECL, GSF, IAEA, KBS, NAGRA, NIREX, NRC,NRPB, PAGIS (CEC), PSE, RIVM, SKI, TVO, and UK DoE (acronyms defined in Section A.1.0 inAppendix A).

5.57
Table 5.23. Neptunium Kd values (ml/g) listed by McKinley and Scholtis (1993, Tables 1, 2, and 4) from sorption databases used
by different international organizations for performance assessments of repositories for radioactive wastes.
Organization
Argillaceous (Clay) Crystalline Rock Soil/Surface Sediment
SorbingMaterial
Kd (ml/g)
SorbingMaterial
Kd (ml/g)
SorbingMaterial
Kd (ml/g)
AECL Bentonite-Sand 30 Granite 80 Soil/Sediment 10
GSF Sediment 30
IAEA Pelagic Clay 5,000
KBS-3 Bentonite 600 Granite 5,000
NAGRABentonite 1,000 Granite 1,000 Soil/Sediment 10
Clay 5,000 Soil/Sediment 1,000
NIREX Clay Mudstone 100
NRC
Clay, Soil Shale 10 Granite 10
Basalt 10
Tuff 10
NRPB Clay 30 Soil/Sediment 30
PAGISBentonite 150 Soil/Sediment 500
Subseabed 2,000
PAGIS SAFIR Clay 200
PSE Sediment 5
RIVM Sandy Clay 10
SKI Bentonite 1,000 Granite 5,000
TVO
Bentonite 1,000 CrystallineRock, Reducing 200 Soil/Sediment 1,000
Baltic SeaSediment 50,000
Ocean Sediment 50,000
Lake Sediment 50,000
UK DoEClay 50 Soil/Sediment 10
Coastal MarineWater 5,000

5.58
5.6.5.5 Kd Studies of Neptunium on Pure Mineral, Oxide, and Crushed Rock Materials
Numerous adsorption studies have been conducted of neptunium on pure minerals, oxide phases,and other geologic-related materials. The Kd values listed in these studies are not necessarilyrelevant to the mobility and sorption of neptunium in soils. However, they are listed in Appendix Gfor completeness. The references cited in Appendix G are listed in the main reference list inChapter 6. The potential value of the references that they cite and the sorption processes that theydiscuss is left to the reader. Surface complexation modeling techniques have been used tounderstand the mechanisms of neptunium adsorption (Kohler et al., 1999; Girvin et al., 1991; Fujita etal., 1995). Kohler et al. (1999) and Girvin et al. (1991) derived the neptunium surface complexationreactions and associated intrinsic constants to model Np(V) adsorption of hematite and amorphousiron oxyhydroxide, respectively. The studies of neptunium sorption on crushed rock wereconducted typically as part of national research programs to investigate the feasibility of geologicaldisposal of high-level radioactive waste (HLW).
5.7 Radium Geochemistry and Kd Values
5.7.1 Overview: Important Aqueous- and Solid-Phase Parameters ControllingRetardation
Radium (Ra) is an alkaline earth element, and can exist in nature only in the +2 oxidation state. Inthe pH range of 3 to 10, the uncomplexed ion Ra2+ is the dominant aqueous species for dissolvedradium in natural waters. In sulfate-containing waters, precipitation and redissolution of calcium(Ca), strontium (Sr), and barium (Ba) sulfates, rather than adsorption/desorption, could control theconcentrations of dissolved radium in the soil environment. Precipitation of radium is readilypossible as the solid-solution solids (Ba,Ra)SO4 and (metal, Ra)CO3 in waters where theconcentrations of dissolved sulfate and carbonate, respectively, are sufficiently high. This reaction,as noted by some investigators, may also be the cause for some very high adsorption values reportedfor radium in the literature. Very limited sorption data, especially Kd values, exist for radium on soilsand sediments. The adsorption behavior of radium will be similar to that of strontium. Relative toother alkaline earth elements, radium is the most strongly sorbed by ion exchange on clay minerals. The adsorption of radium is strongly dependent on ionic strength and concentrations of othercompeting ions in that adsorption of radium decreases with increasing ionic strength. Radium isalso strongly adsorbed to mineral oxides present in soils, especially at near neutral and alkaline pHconditions. The results of some studies also suggest that radium may be strongly adsorbed byorganic material in soils.
5.7.2 General Geochemistry
Radium [Ra, atomic number (Z) = 88] is an alkaline earth element, and can exist in nature only in the+2 oxidation state. Radium and barium are adjacent to each other in the alkaline earth group. Dueto the similarity of their ionic radii (Table 5.24), the chemical behavior of radium is very similar tothat of barium.
Of the reported 34 radium isotopes, all are radioactive (Tuli, 2000). Only four radium isotopes arefound naturally. These include 226Ra [half life (t½) = 1,600 y], 228Ra (t½ = 5.75 y), 224Ra (t½ = 3.66 d),and 223Ra (t½ = 11.435 d). The radium isotopes 226Ra and 223Ra are intermediate radioactive decay

5.59
products of the naturally occurring 238U and 235U decay series, respectively. 228Ra and 224Ra are decayproducts of the naturally occurring 232Th decay series. The isotope 226Ra is generally assumed themost important occurring radium isotopes in nature due to its long half life and the naturalabundance of 238U. However, King et al. (1982) found a relatively high proportion of 228Ra in a studyof groundwater geochemistry of 228Ra, 226Ra, and 222Rn in 150 groundwater samples from a widerange of aquifer lithologies in South Carolina. The isotope 225Ra (t½ = 14.9 d) of the 237Np decaychain has not been detected in nature (Molinari and Snodgrass, 1990). All of the other radiumisotopes have shorter half lives. The chemistry and radiochemistry of radium and the other elementsof the uranium and thorium natural decay series are reviewed by Molinari and Snodgrass (1990). From the standpoint of health risk, 223Ra, 224Ra, and 226Ra are also important in that they decay toproduce radioactive isotopes of the noble gas radon that in turn decay by alpha particle emission [seea discussion of the geochemical and sorption behavior of radon in Section 5.7 of EPA (1999c)].
Table 5.24. Ionic radii (Å) for alkaline earth elements (Molinari and Snodgrass, 1990).
Alkaline EarthElement
Ionic Radii (Å)
Crystal Hydrated
Mg2+ 0.65 4.28
Ca2+ 0.99 4.12
Sr2+ 1.13 4.12
Ba2+ 1.35 4.04
Ra2+ 1.52 3.98
The fate and mobility of radium in surface water, groundwater, and geologic environments havebeen reviewed extensively. For example, see Beneš (1990), Frissel and Köster (1990), Dickson(1990), Onishi et al. (1981), Ames and Rai (1978), and others. Readers should also be aware of thedetailed reviews published in The Environmental Behavior of Radium (IAEA, 1990) and Radon, Radiumand Uranium in Drinking Water (Cothern and Rebers, 1990). Chapters pertinent to this Kd review, forexample, include the following reviews:
• Chemistry and radiochemistry of radium and the other elements of the uranium and thoriumnatural decay series (Molinari and Snodgrass, 1990)
• Relationship of radium and radon in geologic formations (Michel, 1990) • Removal of radium from drinking water (Hanslík and Mansfeld, 1990)• Removal of radium from uranium mining effluents and leaching from sludges (Huck and
Anderson, 1990)• Behavior of radium in soil (Frissel and Köster, 1990)• Behavior of radium in continental surface water (Beneš, 1990)• Behavior of radium in groundwater (Dickson, 1990).
1 The barium end-member composition of this solid solution corresponds to the mineral known as barite (BaSO4).
5.60
5.7.3 Aqueous Speciation
The thermodynamic properties of radium aqueous species and solids are reviewed by Langmuir andRiese (1985). Radium exists in nature only in the +2 oxidation state. In the pH range of 3 to 10, theuncomplexed ion Ra2+ is expected to be the dominant aqueous species for dissolved radium. Thespecies Ra2+ is the only aqueous species for radium in the thermodynamic database for theMINTEQA2 geochemical code (Allison et al., 1991). Dissolved radium shows little tendency toform aqueous complexes, although the aqueous complexes RaOH+, RaCl+, RaCO3
° (aq), andRaSO4
° (aq) are known. The thermodynamic constants for such aqueous complexes however are notwell established (Langmuir and Riese, 1985; Beneš et al., 1982).
Beneš et al. (1982) studied the speciation of radium using centrifugation and free-liquidelectrophoresis. The electrophoresis measurements conducted in 0.01 mol/l chloride solutions inthe pH range 2 to 7 indicated that dissolved radium was present primarily as Ra2+. The results ofmeasurements conducted with solutions containing dissolved sulfate, carbonate, and bicarbonateindicated that significant concentrations of aqueous radium complexes were present.
5.7.4 Dissolution/Precipitation/Coprecipitation
In moderate to high sulfate waters, precipitation and redissolution of calcium, strontium, and bariumsulfates, rather than adsorption/desorption, could control the concentrations of dissolved radium inthe soil environment. Although radium is moderately soluble in natural waters and radium salts areless soluble than barium salts, the solubility of radium is unlikely controlled by pure RaSO4 in naturalwaters. Precipitation of radium is possible as the solid-solution solids (Ba,Ra)SO4
1 and(metal,Ra)CO3 in waters where the concentrations of dissolved sulfate and carbonate, respectively,are sufficiently high.
The (Ba,Ra)SO4 coprecipitation process is well known as a preferred means for the removal ofdissolved 226Ra from effluents from uranium mining and milling operations (Huck and Anderson,1990; Clifford, 1990). The addition of BaCl2 reacts with dissolved sulfate present in the effluent tocause the almost instantaneous precipitation of (Ba,Ra)SO4 solid. The (Ba,Ra)SO4 coprecipitationprocess is so efficient that microcrystals of BaSO4 have been incorporated into specific adsorbentsfor removal of radium from drinking water and other radium-contaminated solutions (Clifford,1990).
The (Ba,Ra)SO4 coprecipitation process has also been shown to be important process in controllingthe solubility of radium in natural waters (Baraniak et al., 1999; Martin and Akber, 1999; Pardue andGuo, 1998; Landa and Gray, 1995; Dickson, 1990; Beneš and Strejc, 1986; Langmuir and Melchior,1985; Beneš et al., 1983; Church, 1979). Pardue and Guo (1998) studied the solubility of 226Ra incontaminated sediments used integrated microcosm, geochemical modeling, and field-samplingtechniques. Their results indicated that the solubility of radium was controlled by thecoprecipitation of radium with barite. This conclusion was confirmed using selective extractions,solution saturation measurements, theoretical solubility calculations, and x-ray diffraction. Landa
1 Diagenetic - “caused by the chemical, physical, and biological changes undergone by a sediment after its initialdeposition, and during and after its consolidation into a coherent solid rock, exclusive of surficial weathering andmetamorphism” (Bates and Jackson, 1980).
5.61
and Gray (1995) used selective extraction studies and leaching studies of components from uraniummill tailings to show that alkaline earth sulfate was an important sorption phase for 226Ra.
Langmuir and Melchior (1985) investigated the geochemical controls for radium in some deep brinesin north Texas. Analyses of the geochemistry of calcium, strontium, barium, and radium sulfates inthese brines indicated that the concentrations of dissolved radium were likely controlled bycoprecipitation of trace radium in sulfate minerals such as celestite (SrSO4) and barite (BaSO4). Langmuir and Melchior (1985) dismissed solid RaSO4 as the solubility control for dissolved radium,because the brine compositions calculated to be 5 to 6 orders of magnitude undersaturated withrespect to RaSO4. Beneš et al. (1983) investigated the particulate forms of radium and barium in asystem consisting of uranium mine waste waters purified by coprecipitation with barium sulfate andof adjacent river waters. Results of selective dissolution analyses identified the following four particulate forms of both elements: “loosely bound,” “acid soluble,” (Ba,Ra)SO4, and “in crystallinedetritus.” Beneš et al. (1983) determined that the main form of radium in the system was(Ba,Ra)SO4. Radium was present mainly as “acid soluble” or “in crystalline detritus” in the riverwater upstream of the sulfate-containing mine water discharge. In marine environments, radium isalso found to be efficiently scavenged and exchanged during the diagenetic1 formation of barite(Church, 1979).
It should be noted that under certain reducing conditions, the (Ba,Ra)SO4 coprecipitate is notthermodynamically stable. Sulfate-reducing bacteria can produce rapid dissolution of (Ba,Ra)SO4sludge under suitable reducing conditions and appropriate carbon sources (Huck and Anderson,1990). For example, Pardue and Guo (1998) observed that 226Ra in contaminated sediment wasremobilized under anaerobic, sulfate-reducing conditions.
5.7.5 Adsorption/Desorption
5.7.5.1 Guidance for Screening Calculations of Adsorption
Compared to most other contaminants, very limited sorption data, especially Kd values, exist forradium on soils and sediments. Moreover, the reader is cautioned that any data that indicates veryhigh adsorption of radium on geological materials should be suspect due to the possibility that(Ba,Ra)SO4 coprecipitation may have occurred during the measurements. Development of Kdlook-up tables for radium is not possible given the minimal number of adsorption studies. However, as an alkaline earth element, the adsorption behavior of radium will be similar andsomewhat greater to that of strontium for which extensive studies and data exist [see Section 5.8 inVolume II (EPA 1999c)]. For screening calculations of radium migration in soils, the Kd look-uptable listed for strontium in Volume II can be used as general guidance for radium. Given theabsence of definitive maximum and minimum Kd values for radium as a function of the keygeochemical parameters, such as pH, EPA suggests that Kd values measured for radium at site-specific conditions are thus essential for site-specific contaminant transport calculations andconceptual models.

5.62
Radium migrates as a cation competing with other alkaline earth cations for sorption sites in soilssystems. Relative to other alkaline earth elements, the relative affinity this group of elements for ionexchange on clay minerals has been described as follows (Sposito, 1989):
Ra2+ > Ba2+ > Sr2+ > Ca2+ > Mg2+
The adsorption of radium has been shown to be strongly dependent on ionic strength andconcentrations of other competing ions in that adsorption of radium decreases with increasing ionicstrength.
The studies reviewed below indicate that radium is readily adsorbed to clays and mineral oxidespresent in soils, especially at near neutral and alkaline pH conditions. For the pH conditions ofmost natural waters, dissolved radium will be present primarily as the uncomplexed Ra2+ cation. Sorption studies discussed below confirm the adsorption behavior expected for Ra2+ as a function ofpH. Radium adsorption on mineral phases is negligible at acidic pH values, and increases withincreasing pH. Because adsorption of cations is coupled with a release of H+ ions, cation adsorptionis greatest at high pH and decreases with decreasing pH. For iron oxides, the increase in adsorptionstarts typically at pH values from 6 to 8 and is at a maximum by pH ~10 or less. As discussed inVolume I (EPA, 1999b), the pH range at which adsorption of cations begins to increase on mineralsurfaces depends on the values of the zero point charge (PZC) (often used as a reference for howthe surface charge of solids varies with pH) for each type of mineral. In general, at pH values lessthan PZC, the mineral surface serves as a strong adsorbent for anions. At pH values greater thanthe PZC, the surface strongly adsorbs dissolved cationic constituents.
Only a few studies have been conducted with respect to the adsorption of radium on organic matter. The results of these studies also suggest that radium may be strongly adsorbed by organic material insoils (Greeman et al., 1999; Nathwani and Phillips, 1979a; 1979b). As noted previously, one of themajor recommendations of this report is that for site-specific calculations, partition coefficientvalues measured at site-specific conditions are absolutely essential.
5.7.5.2 General Adsorption Studies
Sturchio et al. (2001) studied the processes that affect the mobility of radium isotopes in continuousPaleozoic carbonate aquifers in Missouri, Kansas, and Oklahoma. The concentrations of dissolvedradium were correlated to the salinity and concentrations of other alkaline earth elements. Thebehavior of radium in the aquifers was explained by salinity-dependent sorption/desorptionprocesses on surface mineral coatings.
Greeman et al. (1999) measured the abundance, chemical, and mineralogical form of 226Ra, 238U, and232Th in soil samples from 12 sites in the eastern United States. Selective chemical extraction andsize fraction techniques were used to determine the abundance and radiometric equilibriumcondition for 226Ra, 238U, and 232Th in the following soil fractions: exchangeable cation, organicmatter, “free iron oxide,” sand, silt, and clay size. Their results indicated that radium was enriched inthe exchangeable cation and organic (humic) matter fractions in these soils.
Landa and Gray (1995) conducted selective extraction studies and studies of radionuclide sorptionby and leaching from components of uranium mill tailings. Their results indicated that alkaline earth

5.63
sulfate and hydrous ferric oxide solids are important sorption phases for 226Ra.
Willet and Bond (1995) used batch equilibration measurements to investigate the sorption of 226Raon highly weathered and sandy soils from the area near the Ranger Uranium Mine in Australia. Themeasurements were conducted using a background electrolyte solution of 0.0025 M MgSO4, andinitial concentrations of dissolved 226Ra of 100 Bq/l (1.2x10⁻¹¹ mol/l), 150 Bq/l (1.8x10⁻¹¹ mol/l),and 200 Bq/l (2.4x10⁻¹¹ mol/l). The pH values of the soil/electrolyte suspensions ranged between4.6 and 7. The sorption data for 226Ra were fitted to the Freundlich isotherm. Willet and Bond(1995) found no clear relationship between 226Ra sorption and the concentrations of organic matterand clay in the soils. Sorption of 226Ra on all soils increased with increasing soil pH. For some soils,the sorption of 226Ra was nearly complete. Because trace concentrations of dissolved 226Ra wereused for their measurements, Willet and Bond (1995) concluded that precipitation of radium saltswas not likely in their experiments. The results also indicated that the 226Ra was strongly sorbed tothese soils. Less than 1 percent of the sorbed 226Ra was remobilized by resuspension of the soils inthe background electrolyte solution.
Berry et al. (1994) conducted diffusion experiments of the mobility of radium through sandstone. Their results indicated that the sorption of radium was affected by competitive ion effects. Radiumsorption in the high ionic strength groundwater experiment was less than 50 percent of the sorptionmeasured in the lower ionic strength groundwater solution.
Nathwani and Phillips (1979a, 1979b) used batch equilibration experiments to study 226Ra adsorptionby soil with different physical-chemical characteristics. The measured 226Ra adsorption followedFreundlich and Langmuir adsorption isotherms over a large range of 226Ra concentrations. Organicmatter and clay were determined to be the dominant phases contributing to the adsorption of 226Raon these soils. Nathwani and Phillips (1979a) suggested that adsorption affinity of the organicmatter and clays was primarily due to their cation exchange capacity (CEC). Their results alsoindicated that organic matter adsorbed approximately 10 times more 226Ra than did the clays. Theresults of Nathwani and Phillips (1979b) show that the addition of competing alkaline earth cationsto the system can greatly affect radium sorption on the clay minerals.
5.7.5.3 Kd Studies for Radium on Soil Materials
Compared to other contaminants and in particular to 90Sr, which is another alkaline earth isotope ofenvironmental concern, a very limited number of published Kd studies was identified for theadsorption of radium on soils. Meier et al. (1994) completed parametric studies with site-specificwaters and crushed sedimentary rocks from strata that overly the Gorleben salt dome in Germany. In the pH range from approximately 4 to 9, the adsorption and desorption of radium increased withincreasing pH. The Kd values measured for the adsorption of radium on a sandy sediment ingroundwater were 6.7, 12,6, 26.3, and 26.3 ml/g at pH values of 6, 7, 8, and 9, respectively. For thesame system, the desorption Kd values were 10.9, 31, 38, and 29 ml/g at pH values of 6, 7, 8, and 9,respectively. As commonly reported for the sorption of strontium (EPA, 1999c), these adsorptionand desorption Kd values indicate that radium is essentially completely reversibly adsorbed.
Nathwani and Phillips (1979b) measured the adsorption of 226Ra on soils as a function of calciumconcentrations. All experiments were conducted with a constant total concentration of 226Ra of10 pCi/ml (4.5x10⁻⁸ mol/l). The dissolved concentrations of calcium varied from 0 to 0.5 mol/l. Values for Kd for 226Ra estimated from those plotted in Nathwani and Phillips (1979b) are listed inTable 5.25. The characteristics of the soil samples for which Kd values are reported in Nathwani and
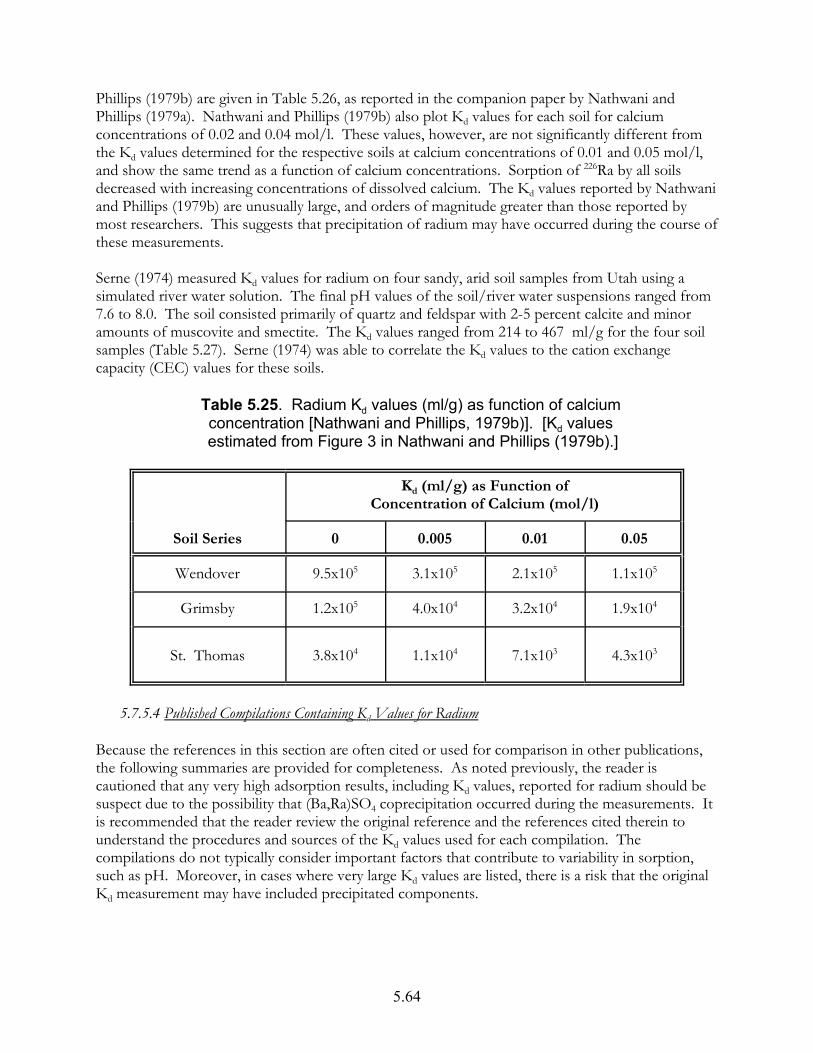
5.64
Phillips (1979b) are given in Table 5.26, as reported in the companion paper by Nathwani andPhillips (1979a). Nathwani and Phillips (1979b) also plot Kd values for each soil for calciumconcentrations of 0.02 and 0.04 mol/l. These values, however, are not significantly different fromthe Kd values determined for the respective soils at calcium concentrations of 0.01 and 0.05 mol/l,and show the same trend as a function of calcium concentrations. Sorption of 226Ra by all soilsdecreased with increasing concentrations of dissolved calcium. The Kd values reported by Nathwaniand Phillips (1979b) are unusually large, and orders of magnitude greater than those reported bymost researchers. This suggests that precipitation of radium may have occurred during the course ofthese measurements.
Serne (1974) measured Kd values for radium on four sandy, arid soil samples from Utah using asimulated river water solution. The final pH values of the soil/river water suspensions ranged from7.6 to 8.0. The soil consisted primarily of quartz and feldspar with 2-5 percent calcite and minoramounts of muscovite and smectite. The Kd values ranged from 214 to 467 ml/g for the four soilsamples (Table 5.27). Serne (1974) was able to correlate the Kd values to the cation exchangecapacity (CEC) values for these soils.
Table 5.25. Radium Kd values (ml/g) as function of calcium concentration [Nathwani and Phillips, 1979b)]. [Kd values estimated from Figure 3 in Nathwani and Phillips (1979b).]
Soil Series
Kd (ml/g) as Function ofConcentration of Calcium (mol/l)
0 0.005 0.01 0.05
Wendover 9.5x10⁵ 3.1x10⁵ 2.1x10⁵ 1.1x10⁵
Grimsby 1.2x10⁵ 4.0x10⁴ 3.2x10⁴ 1.9x10⁴
St. Thomas 3.8x10⁴ 1.1x10⁴ 7.1x10³ 4.3x10³
5.7.5.4 Published Compilations Containing Kd Values for Radium
Because the references in this section are often cited or used for comparison in other publications,the following summaries are provided for completeness. As noted previously, the reader iscautioned that any very high adsorption results, including Kd values, reported for radium should besuspect due to the possibility that (Ba,Ra)SO4 coprecipitation occurred during the measurements. Itis recommended that the reader review the original reference and the references cited therein tounderstand the procedures and sources of the Kd values used for each compilation. Thecompilations do not typically consider important factors that contribute to variability in sorption,such as pH. Moreover, in cases where very large Kd values are listed, there is a risk that the originalKd measurement may have included precipitated components.

5.65
Table 5.26. Properties of soil samples for which Kd values are given in Nathwani and Phillips (1979b). [The soil characteristics were taken
from Nathwani and Phillips (1979a).]
SoilSeries
Texture pHOrganicMatter
%
Sand%
Silt%
Clay%
CEC(meq/100 g)
Wendover Silty Clay 5.4 16.2 6.7 47.9 45.4 34.7
Grimsby Silt Loam 4.3 1.0 43.7 48.9 7.4 10.4
St. Thomas Sand 5.2 3.1 91.1 6.8 1.3 10.9
Table 5.27. Radium Kd values (ml/g) measured by Serne(1974) for sandy, arid soil samples from Utah.
SoilSample
Final pH Kd
(ml/g)
Soil I 7.9-8.0 354 ± 15
Soil II 7.6-7.7 289 ± 7
Soil III 7.8-7.9 467 ± 15
Soil IV 7.6-7.8 214 ± 15
Looney et al. (1987) tabulated estimates for geochemical parameters needed for environmentalassessments of waste sites at DOE’s Savannah River Plant in South Carolina. Looney et al. list Kdvalues for several metal and radionuclide contaminants based on values that they found in 1-5published sources. For radium, Looney et al. list a “recommended” Kd of 100 ml/g, and a rangefrom 10 to 1,000,000 ml/g. Looney et al. note that their recommended values are specific to theSavannah River Plant site, and they must be carefully reviewed and evaluated prior to use inassessments at other sites.
Thibault et al. (1990) (also see Sheppard and Thibault, 1990) present a compilation of soil Kd valuesprepared to support radionuclide migration assessments for a Canadian geologic repository for spentnuclear fuel in Precambrian Shield plutonic rock. Thibault et al. collected Kd values from othercompilations, journal articles, and government laboratory reports for important elements, such asradium, that would be present in the nuclear fuel waste inventory. The radium Kd values listed inThibault et al. (1990) are included in Table 5.28. Thibault et al. (1990) describe the statistical methodsused for analysis of the compiled Kd values. The range for the Kd values used to calculate the“geometric mean” cover several orders of magnitude. Readers are cautioned against using“geometric mean” values or any other form of averaged Kd values as “default” Kd values, as suchvalues are usually calculated from data compiled from different investigators for different soil
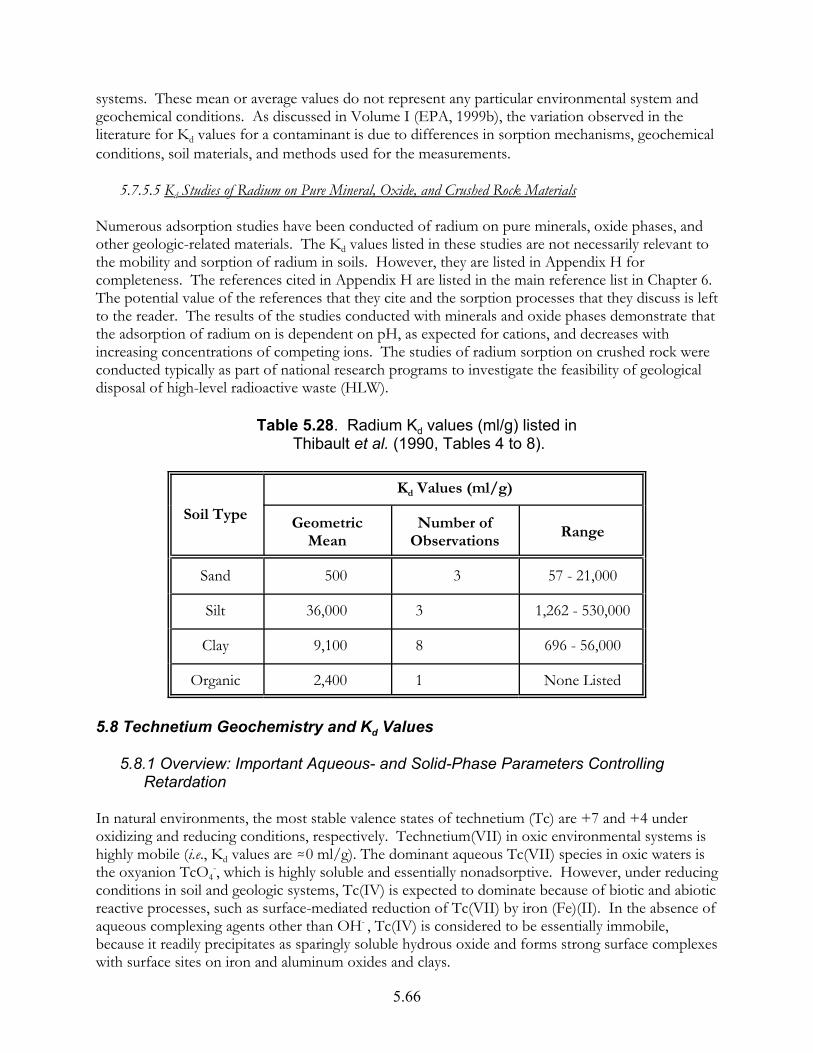
5.66
systems. These mean or average values do not represent any particular environmental system andgeochemical conditions. As discussed in Volume I (EPA, 1999b), the variation observed in theliterature for Kd values for a contaminant is due to differences in sorption mechanisms, geochemicalconditions, soil materials, and methods used for the measurements.
5.7.5.5 Kd Studies of Radium on Pure Mineral, Oxide, and Crushed Rock Materials
Numerous adsorption studies have been conducted of radium on pure minerals, oxide phases, andother geologic-related materials. The Kd values listed in these studies are not necessarily relevant tothe mobility and sorption of radium in soils. However, they are listed in Appendix H forcompleteness. The references cited in Appendix H are listed in the main reference list in Chapter 6. The potential value of the references that they cite and the sorption processes that they discuss is leftto the reader. The results of the studies conducted with minerals and oxide phases demonstrate thatthe adsorption of radium on is dependent on pH, as expected for cations, and decreases withincreasing concentrations of competing ions. The studies of radium sorption on crushed rock wereconducted typically as part of national research programs to investigate the feasibility of geologicaldisposal of high-level radioactive waste (HLW).
Table 5.28. Radium Kd values (ml/g) listed in Thibault et al. (1990, Tables 4 to 8).
Soil Type
Kd Values (ml/g)
GeometricMean
Number ofObservations
Range
Sand 500 3 57 - 21,000
Silt 36,000 3 1,262 - 530,000
Clay 9,100 8 696 - 56,000
Organic 2,400 1 None Listed
5.8 Technetium Geochemistry and Kd Values
5.8.1 Overview: Important Aqueous- and Solid-Phase Parameters Controlling Retardation
In natural environments, the most stable valence states of technetium (Tc) are +7 and +4 underoxidizing and reducing conditions, respectively. Technetium(VII) in oxic environmental systems ishighly mobile (i.e., Kd values are .0 ml/g). The dominant aqueous Tc(VII) species in oxic waters isthe oxyanion TcO4
-, which is highly soluble and essentially nonadsorptive. However, under reducingconditions in soil and geologic systems, Tc(IV) is expected to dominate because of biotic and abioticreactive processes, such as surface-mediated reduction of Tc(VII) by iron (Fe)(II). In the absence ofaqueous complexing agents other than OH- , Tc(IV) is considered to be essentially immobile,because it readily precipitates as sparingly soluble hydrous oxide and forms strong surface complexeswith surface sites on iron and aluminum oxides and clays.

5.67
5.8.2 General Geochemistry
Technetium [Tc, atomic number (Z) = 43] exists in valence states from +7 to -1. In naturalenvironments, the most stable valence states of technetium are +7 and +4 under oxidizing andreducing conditions, respectively. Other valence states are encountered chiefly in complexcompounds. The chemical behavior of technetium in these two oxidation states differs drastically. In the +7 valence state, dissolved technetium exists as pertechnetate anion, TcO4
- , over the completepH range of natural waters. Because the pertechnetate anion is highly soluble and is not stronglysorbed, it is highly mobile in most oxidizing systems. In the +4 valence state, technetium exists asthe tetravalent cation and is relatively immobile in the absence of strongly complexing ligands. Tc(IV) is highly sorbed, and forms the sparingly soluble TcO2@nH2O solid. There are 34 reportedisotopes of technetium (Tuli, 2000). Of the few technetium isotopes having long half lives, 99Tc (t1/2= 2.11 x 10⁵ yr) is a long lived fission product generated during the irradiation of uranium-containing nuclear fuels and is the primary isotope of environmental interest. Most of the othertechnetium isotopes have half lives of hours or less.
The behavior of technetium in environmental systems has been reviewed extensively by others. Reviews include Lieser (1993), Gu and Schulz (1991), Sparks and Long (1987), Meyer et al. (1985a),Beasley and Lorz (1984), Coughtrey et al. (1983), Onishi et al. (1981), Wildung et al. (1979), Ames andRai (1978), and others. Huges and Rossotti (1987) review in detail the solution chemistry oftechnetium.
5.8.3 Aqueous Speciation
Rard et al. (1999) have published an extensive, detailed review of the chemical thermodynamics oftechnetium. Figure 5.9 is an Eh-pH diagram that shows the dominant aqueous species oftechnetium as a function of pH and Eh (redox potential) at 25°C with respect to the thermodynamicstability of water. Technetium is present in +7 and +4 valence states under oxidizing and reducingconditions, respectively.. The predominate Tc(VII) aqueous species is the pertechnetate oxyanionTcO4
- . The TcO4- ion is stable over the complete pH range of natural waters, and its not known to
form any strong aqueous complexes. Although the thermodynamic stability of TcO4- is well
established, thermodynamic data for technetium aqueous species and solids in its various valencestates is extremely limited.
5.8.4 Dissolution/Precipitation/Coprecipitation
Technetium(VII), TcO4- , is highly soluble, and does not form solubility-controlling phases in soil
systems. Technetium(VII) can be reduced to Tc(IV) by biotic and abiotic processes. This reductionusually results in the immobilization of technetium under reducing conditions via the formation ofthe sparingly soluble solid TcO2@nH2O. The solubility of Tc(IV) has been studied experimentally byEriksen et al. (1992), Meyer et al. (1991b), Guppy et al. (1989), and others.
The reduction of Tc(VII) to Tc(IV) by surface-mediated processes has been the subject of extensivestudies [e.g., Wharton et al. (2000); Byegård et al. (1992); Eriksen and Cui (1991); Haines et al. (1987);Bondietti and Francis (1979]. Such reactions have recently been the subject of considerable interestbecause they could have a significant affect on the mobility of technetium in waste streams, vadose
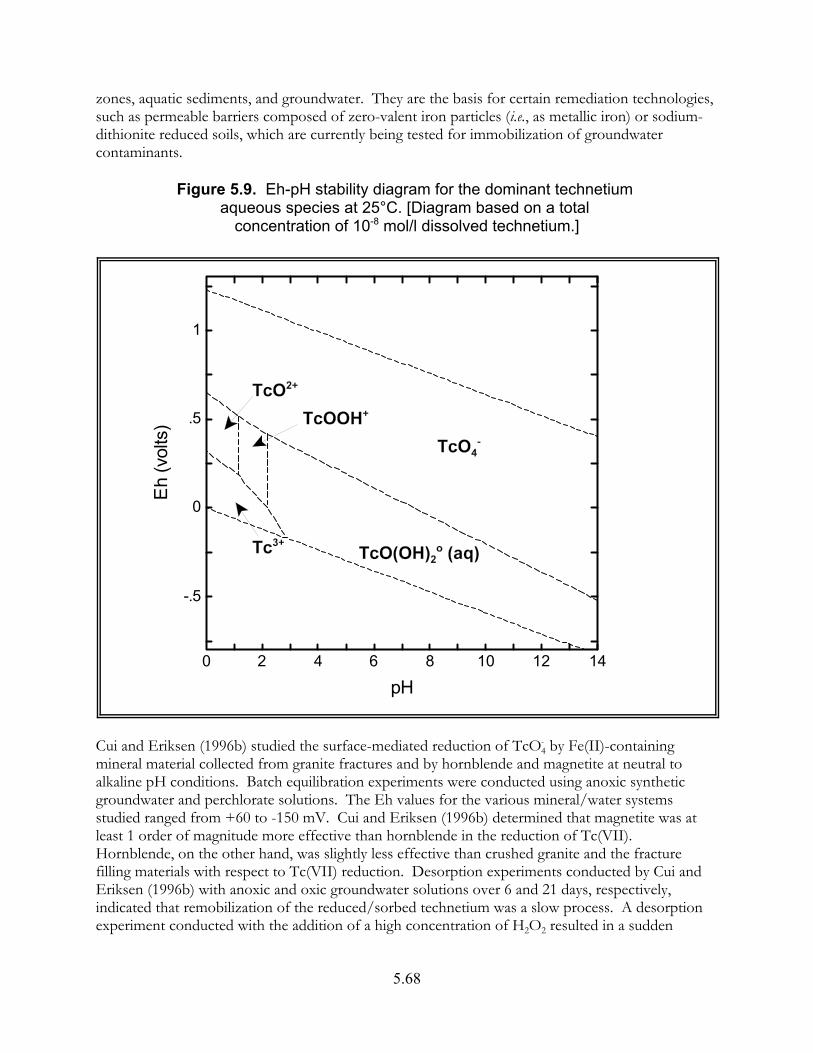
5.68
0 2 4 6 8 10 12 14
-.5
0
.5
1
pH
Eh
(vol
ts)
zones, aquatic sediments, and groundwater. They are the basis for certain remediation technologies,such as permeable barriers composed of zero-valent iron particles (i.e., as metallic iron) or sodium-dithionite reduced soils, which are currently being tested for immobilization of groundwatercontaminants.
Figure 5.9. Eh-pH stability diagram for the dominant technetium aqueous species at 25°C. [Diagram based on a total
concentration of 10-8 mol/l dissolved technetium.]
Cui and Eriksen (1996b) studied the surface-mediated reduction of TcO4- by Fe(II)-containing
mineral material collected from granite fractures and by hornblende and magnetite at neutral toalkaline pH conditions. Batch equilibration experiments were conducted using anoxic syntheticgroundwater and perchlorate solutions. The Eh values for the various mineral/water systemsstudied ranged from +60 to -150 mV. Cui and Eriksen (1996b) determined that magnetite was atleast 1 order of magnitude more effective than hornblende in the reduction of Tc(VII). Hornblende, on the other hand, was slightly less effective than crushed granite and the fracturefilling materials with respect to Tc(VII) reduction. Desorption experiments conducted by Cui andEriksen (1996b) with anoxic and oxic groundwater solutions over 6 and 21 days, respectively,indicated that remobilization of the reduced/sorbed technetium was a slow process. A desorptionexperiment conducted with the addition of a high concentration of H2O2 resulted in a sudden
5.69
increase of remobilized dissolved technetium. Cui and Eriksen suggested that the addition of H2O2consumed the reductive capacity of the solids which permitted the reoxidation and dissolution of thesorbed hydrous Tc(IV) oxide precipitate.
Byegård et al. (1992) studied the sorption of technetium on magnetite in groundwater solutionsunder oxic and anoxic conditions. The solutions used in the laboratory experiments included asynthetic groundwater (pH 8.2) and a natural groundwater solutions (pH 8.8). For someexperiments, 6 ppm dissolved Fe(II) was added to the synthetic groundwater solution. Underanoxic conditions, 95 percent of the initial concentration of dissolved technetium was sorbed within48 hours on the magnetite reacted with the Fe(II)-augmented synthetic groundwater. However, only16 and 15 percent of the technetium was sorbed in the magnetite systems reacted with Fe(II)-freesynthetic and natural groundwater, respectively. Under oxic conditions at 48 hours, the amounts ofsorbed technetium were 9, 4, and 4 percent, respectively, for magnetite reacted withFe(II)-augmented synthetic, Fe(II)-free synthetic, and natural groundwater. Byegård et al. (1992) alsoobserved a significant decrease in the concentration of dissolved technetium in experimentsconducted with Fe(II)-augmented synthetic groundwater under anoxic conditions in the absence ofmagnetite.
Haines et al. (1987) used Fourier transform infrared (FTIR) spectroscopy to study the sorption ofTc(VII) at room temperature on synthetic magnetite and hematite particles that were contacted withdissolved TcO4
- and nitrogen-purged pH 6 water. Their experiments indicated that, under thesegeochemical conditions, sorption of Tc(VII) on magnetite occurred by a surface-mediatedreduction/precipitation mechanism. Based on pHZPC values reported by others for hematite andmagnetite of 8.5 ± 0.5 and 6.5 ± 0.2, respectively, hematite and, to a lesser degree, magnetite, wereexpected to have a positive surface charge and thus capable of anion adsorption in these pH 6solutions. Haines et al. (1987) proposed that the sorption of Tc(VII) at pH values less than pHZPC isinitiated by electrostatic attraction of the TcO4
- anion by the magnetite surface. The sorbed Tc(VII)is then reduced to Tc(IV) by Fe(II) centers on the magnetite surface to simultaneously bothprecipitate sparingly soluble Tc(IV) oxide and oxidize Fe(II) to Fe(III) to form an Fe(III) oxide onthe magnetite surface.
Microbial reduction of Tc(VII) has been suggested as a potential mechanism for removal oftechnetium from contaminated groundwater and waste streams [e.g., Lovley (1993, 1995); Lloyd et al.(1997, 2000b)]. Dissimilatory metal reducing bacteria (Lloyd and Macaskie, 1996; Wildung et al.,2000) and the sulfate reducing bacterium Desulfovibrio desulfuricans [Lloyd et al., 1998, 1999] arecapable of coupling the oxidation of organic carbon or hydrogen to the reduction of Tc(VII). Wildung et al. (2000) examined the influence of electron donor and the presence of dissolvedbicarbonate on the rate and extent of enzymatic reduction of TcO4
- by the subsurface metal-reducing bacterium Shewanella putrefaciens CN32 under anoxic conditions. Using a variety of analyticalmethods and geochemical modeling techniques, these studies indicated that the dominant solid-phase reduction product in both saline (0.85 percent NaCl) and bicarbonate (30mM NaHCO3)systems was amorphous Tc(IV) hydrous oxide. However, the reduced technetium in saline systemswas associated principally with the cell surface, whereas Tc(IV) in bicarbonate systems was presentprimarily in extracellular particulates.
5.70
5.8.5 Adsorption/Desorption
5.8.5.1 Guidance for Screening Calculations of Adsorption
The dominant aqueous Tc(VII) species under oxidizing conditions is the oxyanion TcO4-, which is
highly soluble and essentially nonadsorptive. For soils with low contents of organic material, thereported Kd values range from 0 to approximately 0.5 ml/g, although most values are less than0.1 ml/g (see studies reviewed below). The very low Kd values measured for Tc(VII) and the limitedavailability of Kd values as a function of key geochemical parameters, such as pH, precludederivation of meaningful look-up tables for Tc(VII) Kd values. For screening calculations of off-sitemigration of Tc(VII), a Kd of 0 ml/g si suggested as a conservative minimum value for low organicsoils under oxidizing conditions at pH values greater than 5. As an anion, the adsorption of TcO4
- isexpected to increase with decreasing pH at pH values less than 5. Values of Kd measured by Kaplanet al. (2000a) for a wetland sediment ranged from approximately 0 ml/g at pH 4.6 to 0.29 at pH 3.2. The maximum Kd value that they determined for an upland sediment was 0.11 ml/g at pH 3. Asnoted previously, however, one of the major recommendations of this report is that for site-specificcalculations, partition coefficient values measured at site-specific conditions are absolutely essential.
The sorption of TcO4- has been found to be positively correlated to the organic carbon content of
soils (Wildung et al., 1974; 1984). However, studies of the effect that organic material has on thesorption of Tc(VII) in soils are limited. As an extreme example, Sheppard and Thibault (1988)reported Kd values of greater than 2 ml/g based in situ Kd values derived from analyses of the driedpeat and pore water from the Precambrian Shield in Canada. Measurable adsorption of Tc(VII)observed in experiments conducted with organic material as well as with crushed rock and Fe(II)-containing minerals has been attributed to the reduction of Tc(VII) to Tc(IV). Technetium(IV) isessentially immobile, because it readily precipitates as sparingly soluble hydrous oxides and formsstrong complexes with surface sites on iron and aluminum oxides and clays. Studies by Landa et al.(1977) however suggest that anaerobic conditions may not be a prerequisite to technetium sorptionby soils, and that the living and nonliving organic fraction of soil may have a role in technetiumsorption.
5.8.5.2 General Adsorption Studies
Winkler et al. (1988) studied the sorption of technetium on several sands and single mineral phasesusing batch-equilibration, recirculation column and flow-through column experiments. The studieswere conducted under anoxic conditions using simulated calcium-bicarbonate groundwatercontaining 13.6 meq/l salt. No significant sorption of technetium was observed in the experimentsconducted with the sands (Kd values less than 0.2 ml/g). Little or no sorption was measured inexperiments conducted with pure quartz or smectite. Significant sorption, however, was observed inthe pyrite experiments, and appeared to be a function of time even at low concentrations (i.e., 1wt. percent) of pyrite. In a flow-through column experiment containing a 1:99 mixture (bywt. percent) of pyrite to quartz, rapid and complete sorption of technetium was observed. Thesorbed technetium was localized in the first 50 mm of the 200-mm long columns. The pH and Ehvalues for this flow-through experiment were, respectively, 7 and +400 mV.
Lieser and Bauscher (1987) conducted batch equilibration experiments to study the sorption anddesorption of technetium under oxic and anoxic conditions on five sediments and
5.71
five corresponding groundwater samples from Gorleben, Federal Republic of Germany. Thesediments consisted mainly of quartz and minor concentrations of calcite, dolomite, anhydrite,kaolinite, illite, and montmorillonite. Low sorption of technetium (i.e., Kd values of 0.1-0.3 ml/g)was observed in those experiments conducted under oxic conditions. Technetium sorptiondecreased with increasing salinity, and was found to be reversible. Under anoxic conditions, highsorption values were measured for technetium on these water/sediment systems. Technetiumsorption did not depend on salinity and was not reversible under these anoxic conditions. However,at higher salinity values, steady-state sorption of technetium was attained more quickly. When theEh was increased, Lieser and Bauscher (1987) determined that the sorption behavior changedabruptly from high to low adsorption at Eh of 170±60 mV and pH of 7.0±0.5. In all experiments,analysis of the dissolved technetium indicated the presence of only Tc(VII) and no colloidal sizetechnetium was detected by ultrafiltration.
5.8.5.3 Kd Studies for Technetium on Soil Materials
Kaplan and coworkers have conducted a series of laboratory studies on the adsorption of TcO4- on
soils and mineral phases. Kaplan et al. (2000a) measured Kd values for TcO4- as a function of pH on
two sediments from the Savannah River Site at Aiken, South Carolina. The Kd values rangedfrom 0.29 to -0.13 ml/g. Their measurements also indicate that the Kd values increased withdecreasing pH as would be expected for dissolved anionic contaminants. Kaplan et al. (1998b)suggested that the negative Kd values measured for technetium were due to anion exclusion effects.
Kaplan et al. (1998a) used the batch equilibration technique to measure the Kd values for technetiumunder oxic conditions on 20 sediment samples from the Hanford formation at the Hanford Site insoutheastern Washington. The sediment samples were taken from 1 borehole, and included materialfrom 3 layers of the Hanford formation. Each sediment sample was equilibrated withuncontaminated groundwater from the Hanford Site, which was spiked with 99Tc prior to the Kdmeasurements. The groundwater solution had a low ionic strength and a pH of 8.4 [see Table 1 inKaplan et al. (1998a)]. The mean Kd values of 3 replicates measured for technetium on eachHanford sediment sample are listed in Table 5.29, and ranged from -0.04 to 0.01 ml/g. Themeasurements indicated essentially no sorption of technetium on Hanford sediments under theseconditions.
Kaplan et al. (1998b) studied the effects of ionic strength and high pH on the sorption of technetiumunder oxic conditions on sediments from the Hanford Site in Washington. Batch sorptionexperiments were completed using the <2-mm size fraction of sediment collected fromTrench AE-3 in the 200 Area of the Hanford Site. The sediment was characterized as a silty loamwith cation exchange capacity (CEC) of 6.4 meq/100 g. The carbonate content of the sediment isprimarily calcite. Based on analyses reported by Kaplan et al. (1996) for a sediment from a nearbylocation, the Trench AE-3 sample was expected to contain approximately 0.2-0.5 wt. percentamorphous Fe2O3 (Kaplan et al. (1998b). The <2-mm size fraction contained 41 percent sand,50 percent silt, and 9 percent clay. The clay fraction of the sediment contained primarily smectite(57 percent), illite (19 percent), and vermiculite (14 percent). The groundwater selected for thesorption studies was an uncontaminated groundwater from the Hanford Site with a low ionicstrength and pH of 8.4 [see Table 2 in Kaplan et al. (1998b)]. The effect of ionic strength on thesorption of technetium was investigated by adding 0.05, 0.10, 0.50, and 1.00 M NaClO4 solutions tothe groundwater. To study the effect of high pH on the sorption of technetium, NaOH was added
5.72
to separate samples of groundwater to adjust the pH to 8.1, 9.9, 10.2, 11.0, and 11.9. The sedimentwas equilibrated with these amended groundwater solutions. Based on the experimental conditionsand geochemical modeling calculations, the dissolved technetium was assumed to be TcO4
- . Themean Kd values of three replicates measured for technetium in the ionic strength and pHexperiments are listed in Table 5.29. Kaplan et al. (1998a) noted that negative Kd values had usuallybeen attributed to experiment error associated with measuring the concentration of a nonadsorbingsolute.
However, based on the results of Kaplan and Serne (1998), Kaplan et al. (1998b) suggested that thenegative Kd values measured for technetium were due to anion exclusion effects. The reason for thehigh Kd value (3.94 ml/g) measured for technetium in the 1.00 M NaClO4 solution was not known. Kaplan et al. (1998b) speculated that the higher ionic strength allowed greater interaction of thetechnetium with the mineral surfaces by decreasing the double layer around the sediment particles.The Kd values determined for technetium (i.e., 1.04 to 1.07 ml/g) at pH values greater than 8.8 in theNaOH-amended solutions were greater than expected. The reason for these greater-than-expectedvalues was not known.
Kaplan and Serne (1998) [also see Kaplan et al. (1996)] used the batch technique to measure the Kdvalues for technetium, as TcO4
- , on three sediment samples from the Hanford Site in southeasternWashington. The measurements were conducted with a groundwater sample (pH 8.3) taken from awell located in an uncontaminated area of the Hanford Site. The sediment samples included a loamysand (sample TSB-1), a silty loam (sample Trench AE-3), and a very coarse sand (sampleTrench-94). The Kd values at 266 days of contact time were very low for all sediments, and rangedfrom 0.11 to -0.18 mg/l.
Kaplan et al. (1996) measured the Kd values for TcO4- on sediment samples from the 200 Areas at the
Hanford Site. The sorption measurements were conducted under oxidizing conditions usinguncontaminated groundwater (pH=8.46) from Hanford Site Well S3-25. The sorption values forTcO4
- were determined for three sediment samples, Trench 94, Trench AE-3, and TSB-1, using thebatch equilibration method. As with previous sorption studies of Hanford Site sediments atoxidizing conditions, no significant sorption of TcO4
- was observed. The average Kd valuesmeasured after 30 days of contact for Trench 94 and Trench AE-3 sediments were -0.02 ml/g and-0.05 ml/g, respectively. The effect of contact time (7-398 days) on the sorption of TcO4
- to thesesediments was also studied by Kaplan et al. (1996). The Kd values for all three sediments varied fromslightly negative at short contact times to slightly positive at contact times greater than 300 days. The values ranged from -0.18 to 0.11 ml/g.
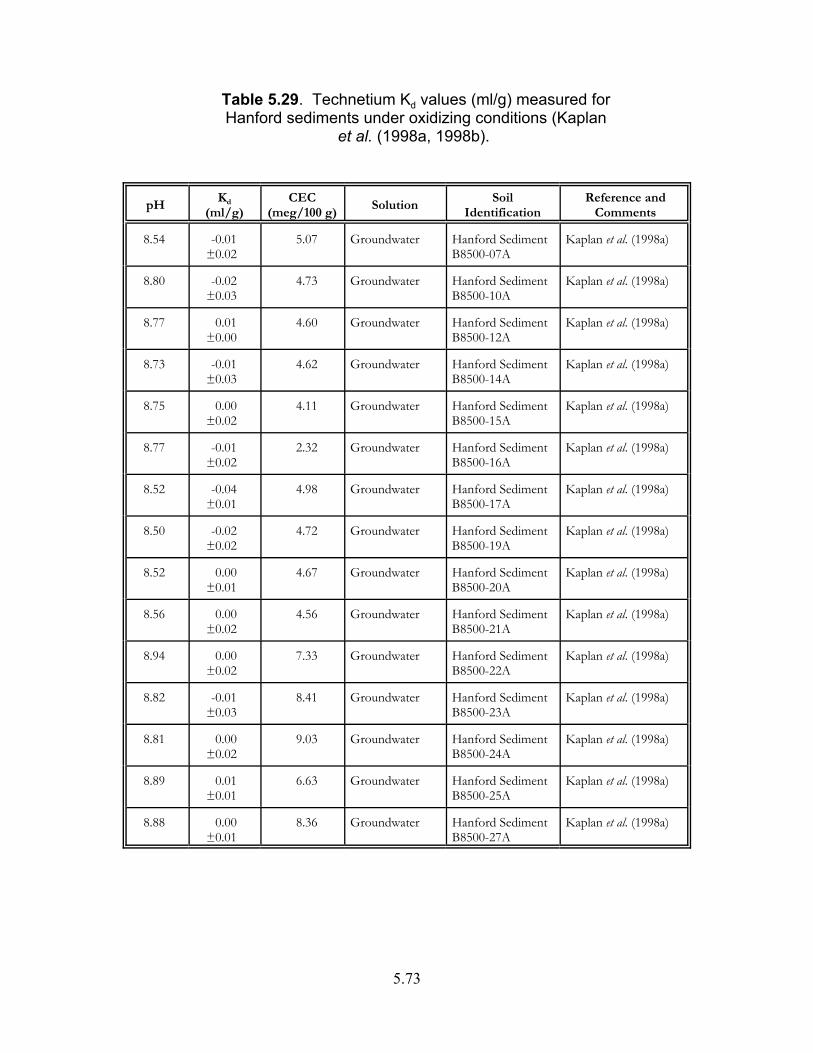
5.73
Table 5.29. Technetium Kd values (ml/g) measured for Hanford sediments under oxidizing conditions (Kaplan
et al. (1998a, 1998b).
pHKd
(ml/g)CEC
(meg/100 g)Solution
SoilIdentification
Reference andComments
8.54 -0.01±0.02
5.07 Groundwater Hanford Sediment B8500-07A
Kaplan et al. (1998a)
8.80 -0.02±0.03
4.73 Groundwater Hanford Sediment B8500-10A
Kaplan et al. (1998a)
8.77 0.01±0.00
4.60 Groundwater Hanford Sediment B8500-12A
Kaplan et al. (1998a)
8.73 -0.01±0.03
4.62 Groundwater Hanford Sediment B8500-14A
Kaplan et al. (1998a)
8.75 0.00±0.02
4.11 Groundwater Hanford Sediment B8500-15A
Kaplan et al. (1998a)
8.77 -0.01±0.02
2.32 Groundwater Hanford Sediment B8500-16A
Kaplan et al. (1998a)
8.52 -0.04±0.01
4.98 Groundwater Hanford Sediment B8500-17A
Kaplan et al. (1998a)
8.50 -0.02±0.02
4.72 Groundwater Hanford Sediment B8500-19A
Kaplan et al. (1998a)
8.52 0.00±0.01
4.67 Groundwater Hanford Sediment B8500-20A
Kaplan et al. (1998a)
8.56 0.00±0.02
4.56 Groundwater Hanford Sediment B8500-21A
Kaplan et al. (1998a)
8.94 0.00±0.02
7.33 Groundwater Hanford Sediment B8500-22A
Kaplan et al. (1998a)
8.82 -0.01±0.03
8.41 Groundwater Hanford Sediment B8500-23A
Kaplan et al. (1998a)
8.81 0.00±0.02
9.03 Groundwater Hanford Sediment B8500-24A
Kaplan et al. (1998a)
8.89 0.01±0.01
6.63 Groundwater Hanford Sediment B8500-25A
Kaplan et al. (1998a)
8.88 0.00±0.01
8.36 Groundwater Hanford Sediment B8500-27A
Kaplan et al. (1998a)
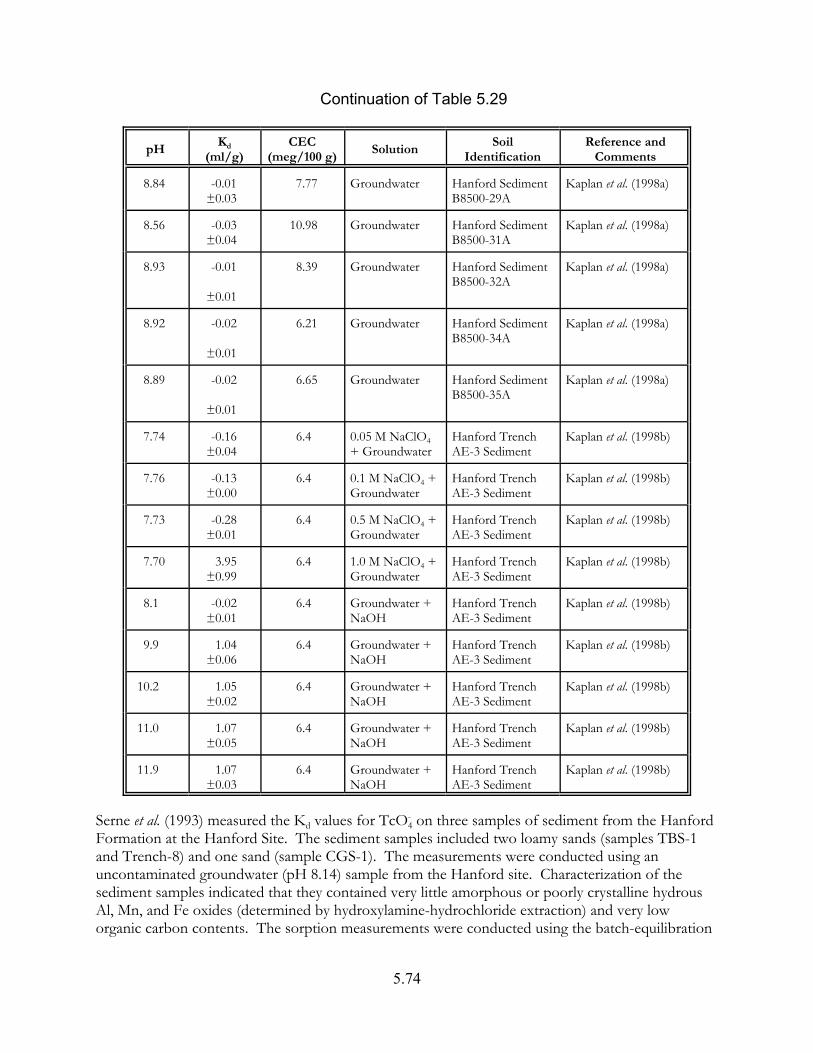
5.74
Continuation of Table 5.29
pHKd
(ml/g)CEC
(meg/100 g)Solution
SoilIdentification
Reference andComments
8.84 -0.01±0.03
7.77 Groundwater Hanford Sediment B8500-29A
Kaplan et al. (1998a)
8.56 -0.03±0.04
10.98 Groundwater Hanford Sediment B8500-31A
Kaplan et al. (1998a)
8.93 -0.01
±0.01
8.39 Groundwater Hanford Sediment B8500-32A
Kaplan et al. (1998a)
8.92 -0.02
±0.01
6.21 Groundwater Hanford Sediment B8500-34A
Kaplan et al. (1998a)
8.89 -0.02
±0.01
6.65 Groundwater Hanford Sediment B8500-35A
Kaplan et al. (1998a)
7.74 -0.16±0.04
6.4 0.05 M NaClO4+ Groundwater
Hanford TrenchAE-3 Sediment
Kaplan et al. (1998b)
7.76 -0.13±0.00
6.4 0.1 M NaClO4 +Groundwater
Hanford TrenchAE-3 Sediment
Kaplan et al. (1998b)
7.73 -0.28±0.01
6.4 0.5 M NaClO4 + Groundwater
Hanford TrenchAE-3 Sediment
Kaplan et al. (1998b)
7.70 3.95±0.99
6.4 1.0 M NaClO4 + Groundwater
Hanford TrenchAE-3 Sediment
Kaplan et al. (1998b)
8.1 -0.02±0.01
6.4 Groundwater +NaOH
Hanford TrenchAE-3 Sediment
Kaplan et al. (1998b)
9.9 1.04±0.06
6.4 Groundwater +NaOH
Hanford TrenchAE-3 Sediment
Kaplan et al. (1998b)
10.2 1.05±0.02
6.4 Groundwater +NaOH
Hanford TrenchAE-3 Sediment
Kaplan et al. (1998b)
11.0 1.07±0.05
6.4 Groundwater +NaOH
Hanford TrenchAE-3 Sediment
Kaplan et al. (1998b)
11.9 1.07±0.03
6.4 Groundwater +NaOH
Hanford TrenchAE-3 Sediment
Kaplan et al. (1998b)
Serne et al. (1993) measured the Kd values for TcO4- on three samples of sediment from the Hanford
Formation at the Hanford Site. The sediment samples included two loamy sands (samples TBS-1and Trench-8) and one sand (sample CGS-1). The measurements were conducted using anuncontaminated groundwater (pH 8.14) sample from the Hanford site. Characterization of thesediment samples indicated that they contained very little amorphous or poorly crystalline hydrousAl, Mn, and Fe oxides (determined by hydroxylamine-hydrochloride extraction) and very loworganic carbon contents. The sorption measurements were conducted using the batch-equilibration

5.75
method under oxidizing conditions. After 35 days of contact, the pH values for the CGS-1, TBS-1,and Trench-8 sediment suspensions were 7.9-8.4., 8.0-8.4, and 8.22, respectively. Under theconditions studied, no significant sorption of Tc was measured. The Kd values for TcO4
- were0.1 ml/g for CGS-1 sediment at 35 days, 0.1 ml/g for TBS-1 sediment at 35 days, and 0.2 ml/g forTrench-8 sediment at 44 days.
Sheppard and Thibault (1988) studied the vertical migration of technetium in two types of mirestypical of the Precambrian Shield in Canada. Sheppard and Thibault (1988) derived in situ Kd valuesfrom analyses of the dried peat and pore water. The Kd values determined for technetium weregreater than 2 ml/g. Technetium was quickly immobilized in the reducing environment of the mire,which was the cause for the observed in situ technetium Kd values.
Table 5.30. Average technetium Kd values (ml/g) (based onthree replicates) for technetium on Hanford sediments after
21.5 days from Gee and Campbell (1980).
SolutionSampleNumber
Silty Sediment Surface Sand
pH Kd (ml/g) pH Kd (ml/g)
1 8.26 -2.77 8.14 0.07
2 8.07 -1.13 8.00 -1.62
3 8.52 -0.04 8.25 -0.31
4 7.78 0.57 7.63 0.06
5 7.90 0.54 7.57 0.52
6 7.75 -0.51 7.44 0.38
Gee and Campbell (1980) conducted batch equilibration and unsaturated flow column studies of thesorption behavior of technetium using two Hanford Site sediments and a series of syntheticgroundwater solutions. The sediments include a sample from the Ringold Formation (deep, oldsediment) and a surface soil sample at the Hanford Site. Except for the degree of crystallinity of theclay minerals, the two sediments were similar with respect to their clay mineralogy. Thecompositions of the synthetic groundwater solutions were developed to simulate the composition ofa solution as it changes in response to its initial contact and saturation of arid sediment and itsprogressive percolation through the arid sediment. Gee and Campbell (1980) found low sorption oftechnetium, and no relationship in the technetium Kd values with respect to soil type, solutioncomposition, pH, and contact time. The technetium Kd values for the two sediment samples rangedfrom -2.34 to 1.27 ml/g at 8.5 days, and -2.77 to 0.57 ml/g at 21.5 days. The average batch Kdvalues determined for the technetium-spiked sediments equilibrated with the six syntheticgroundwater solutions at 21.5 days are listed in Table 5.30. Although there was general agreement

5.76
between the sorption measured by the batch and unsaturated column studies, Gee and Campbellnoted that the Kd values measured for technetium, using the unsaturated column studies were lessvariable and better defined.
Wildung et al. (1974) used the batch equilibration method to measure the Kd values for TcO4- on
22 types of soils collected in Oregon, Washington, and Minnesota. The Kd values for TcO4- ranged
from 0.007 to 2.8 ml/g. Wildung et al. (1974) determined that the sorption of TcO4- was positively
correlated to soil organic carbon, and negatively correlated to pH.
Routson et al. (1975, 1977) used batch equilibration experiments to measure Kd values for 99Tc onsoil as a function of the concentrations of dissolved calcium bicarbonate. The soil sample was amoderate-exchange capacity soil from South Carolina. The soil contained <0.2 mg/g CaCO3,3.6 percent silt, 37.2 percent clay, and had a cation exchange capacity (CEC) of 2.5 meq/100 g andsaturated paste pH equal to 5.1. The measurements indicated that 99Tc did not sorb to the SouthCarolina soil sample. The measured Kd values for 99Tc were +0.019, -0.052, -0.033, and +0.010 ml/gfor 0.002, 0.008, 0.020, and 0.200 M NaHCO3 solutions.
5.8.5.4 Published Compilations Containing Kd Values for Technetium
Because the references in this section are often cited or used for comparison in other publications,the following summaries are provided for completeness. It is recommended that the reader reviewthe original reference and the references cited therein to understand the procedures and sources ofthe Kd values used for each compilation. The compilations do not distinguish between oxidationstates for those contaminants that are redox sensitive or consider other important factors thatcontribute to variability in sorption, such as pH. Moreover, in cases where very large Kd values arelisted, there is a risk that the original Kd measurement may have included precipitated components.
Baes and Sharp (1983) present a simple model developed for order-of-magnitude estimates forleaching constants for solutes in agricultural soils. As part of this development, they reviewed anddetermined generic default values for input parameters, such as Kd. A literature review wascompleted to evaluate appropriate distributions for Kd values for various solutes, includingtechnetium. Because Baes and Sharp (1983) are cited frequently as a source of Kd values in otherpublished Kd reviews (e.g., Looney et al., 1987; Sheppard and Thibault, 1990), the technetium Kdvalues listed by Baes and Sharp are reported here for completeness. Based on the distribution thatBaes and Sharp determined for the Kd values for cesium and strontium, they assumed a lognormaldistribution for the Kd values for all other elements in their compilation. Baes and Sharp listed anestimated default Kd of 0.033 ml/g for technetium based on 24 Kd values that range from 0.0029to 0.28 ml/g for agricultural soils and clays over the pH range 4.5 to 9.0. The 24 Kd values weretaken from Gast et al. (1979) which was not available for our review. Their compiled Kd valuesrepresent a diversity of soils, pure clays (other Kd values for pure minerals were excluded), extractingsolutions, measurement techniques, and experimental error.
Looney et al. (1987) tabulated estimates for geochemical parameters needed for environmentalassessments of waste sites at DOE’s Savannah River Plant in South Carolina. Looney et al. list Kdvalues for several metal and radionuclide contaminants based on values that they found in 1-5published sources. For technetium, Looney et al. list a “recommended” Kd of 0.001 ml/g, and arange from 0.001 to 100 ml/g. Looney et al. note that their recommended values are specific to the

5.77
Savannah River Plant site, and they must be carefully reviewed and evaluated prior to use inassessments at other sites.
Thibault et al. (1990) (also see Sheppard and Thibault, 1990) present a compilation of soil Kd valuesprepared to support radionuclide migration assessments for a Canadian geologic repository for spentnuclear fuel in Precambrian Shield plutonic rock. Thibault et al. collected Kd values from othercompilations, journal articles, and government laboratory reports for important elements, such astechnetium, that would be present in the nuclear fuel waste inventory. The technetium Kd valueslisted in Thibault et al. (1990) are included in Table 5.31. Thibault et al. (1990) describe the statisticalmethods used for analysis of the compiled Kd values. The range for the Kd values used to calculatethe “geometric mean” cover several orders of magnitude. Readers are cautioned against using“geometric mean” values or any other form of averaged Kd values as “default” Kd values, as suchvalues are usually calculated from data compiled from different investigators for different soilsystems. These mean or average values do not represent any particular environmental system andgeochemical conditions. As discussed in Volume I (EPA, 1999b), the variation observed in theliterature for Kd values for a contaminant is due to differences in sorption mechanisms, geochemicalconditions, soil materials, and methods used for the measurements.
Table 5.31. Technetium Kd values (ml/g) listed in Thibault et al. (1990, Tables 4 to 8).
Soil Type
Kd Values (ml/g)
GeometricMean
Number ofObservations
Range
Sand 0.1 19 0.01 - 16
Silt 0.1 10 0.01 - 0.4
Clay 1 4 1.16 - 1.32
Organic 1 24 0.02 - 340
McKinley and Scholtis (1993) compare radionuclide Kd sorption databases used by differentinternational organizations for performance assessments of repositories for radioactive wastes. Thetechnetium Kd values listed in McKinley and Scholtis (1993, Tables 1, 2, and 4) are listed inTable 5.32. The reader should refer to sources cited in McKinley and Scholtis (1993) for detailsregarding their source, derivation, and measurement. Radionuclide Kd values listed for cementitiousenvironments in McKinley and Scholtis (1993, Table 3) are not included in Table 5.32. Theorganizations listed in the tables include: AECL, GSF, IAEA, KBS, NAGRA, NIREX, NRC,NRPB, PAGIS (CEC), PSE, RIVM, SKI, TVO, and UK DoE (acronyms defined in Section A.1.0 inAppendix A).
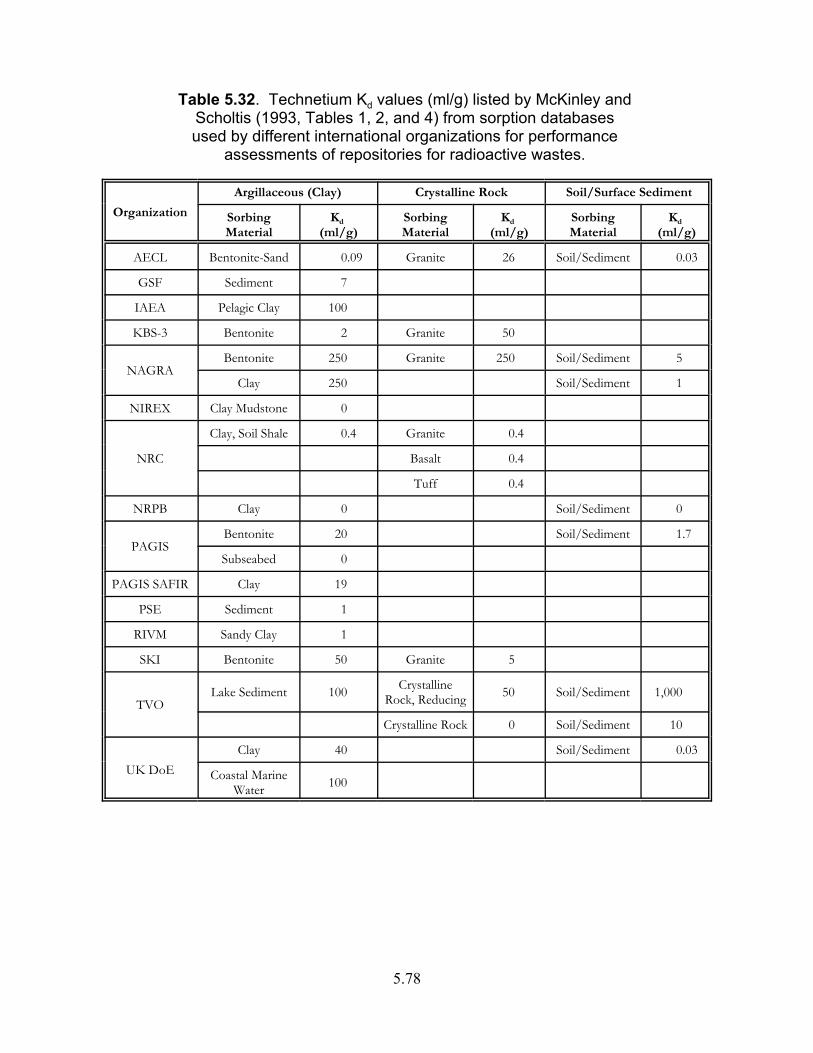
5.78
Table 5.32. Technetium Kd values (ml/g) listed by McKinley and Scholtis (1993, Tables 1, 2, and 4) from sorption databases used by different international organizations for performance
assessments of repositories for radioactive wastes.
Organization
Argillaceous (Clay) Crystalline Rock Soil/Surface Sediment
SorbingMaterial
Kd (ml/g)
SorbingMaterial
Kd (ml/g)
SorbingMaterial
Kd (ml/g)
AECL Bentonite-Sand 0.09 Granite 26 Soil/Sediment 0.03
GSF Sediment 7
IAEA Pelagic Clay 100
KBS-3 Bentonite 2 Granite 50
NAGRABentonite 250 Granite 250 Soil/Sediment 5
Clay 250 Soil/Sediment 1
NIREX Clay Mudstone 0
NRC
Clay, Soil Shale 0.4 Granite 0.4
Basalt 0.4
Tuff 0.4
NRPB Clay 0 Soil/Sediment 0
PAGISBentonite 20 Soil/Sediment 1.7
Subseabed 0
PAGIS SAFIR Clay 19
PSE Sediment 1
RIVM Sandy Clay 1
SKI Bentonite 50 Granite 5
TVOLake Sediment 100 Crystalline
Rock, Reducing 50 Soil/Sediment 1,000
Crystalline Rock 0 Soil/Sediment 10
UK DoEClay 40 Soil/Sediment 0.03
Coastal MarineWater 100
5.79
5.8.5.5 Kd Studies of Technetium on Pure Mineral, Oxide, and Crushed Rock Materials
Numerous adsorption studies have been conducted of technetium on pure minerals, oxide phases,and other geologic-related materials. The Kd values listed in these studies are not necessarilyrelevant to the mobility and sorption of technetium in soils. However, they are listed in Appendix Ifor completeness. The references cited in Appendix I are listed in the main reference list inChapter 6. The potential value of the references that they cite and the sorption processes that theydiscuss is left to the reader. Like those for iodine, many of the studies that used on pure mineral andoxide materials were conducted because of extensive research interest in developing getters(adsorbents) that could be added to waste streams and tailored barriers for removal and/orimmobilization of dissolved iodine. The studies of technetium sorption on crushed rock wereconducted typically as part of national research programs to investigate the feasibility of geologicaldisposal of high-level radioactive waste (HLW).
5.9 Conclusions
One objective of this volume report is to provide a “thumb-nail sketch” of the geochemistry ofamericium, arsenic, curium, iodine, neptunium, radium, and technetium. These contaminantsrepresent six nonexclusive contaminant categories: radionuclides, cations, anions, redox-sensitive,non-retarded (non-attenuated) contaminants, and retarded (attenuated) contaminants (Table 5.33). By categorizing the contaminants in this manner, general geochemical behaviors of one contaminantmay be extrapolated by analogy to other contaminants in the same category. For example, anions,such as NO3
- and Cl-, commonly adsorb to geological materials to a limited extent. This is also thecase observed for the sorption behavior of anionic iodide.
Important solution speciation, coprecipitation/dissolution, and adsorption reactions were discussedfor each contaminant. Where relevant, the distributions of aqueous species for certain contaminantswere calculated using the chemical equilibria code MINTEQA2 (Version 3.11, Allison et al., 1991)for the water composition described in Table 5.1. The purpose of these calculations was to identifythe compositions of the dominant aqueous species that might exist in an oxidizing groundwater forthe contaminants reviewed in Volume III.. A summary of the results of these calculations ispresented in Table 5.34. The aqueous speciation of iodide, iodate, radium, and pertechnetate doesnot change in the pH range of 3 and 10 under oxidizing conditions; they exist as I-, IO3
- , Ra2+, andTcO4
- , respectively. Americium(III), As(V), and Np(V) have two or three different dominant speciesacross this pH range. The aqueous speciation of arsenic, iodine, neptunium, and technetium isespecially complicated, because these contaminants may exist in multiple oxidation states over therange of pH-Eh conditions of natural waters.
One general conclusion that can be made from the calculations in Table 5.34 is that, as the pHincreases, the aqueous complexes tend to become increasingly more negatively charged. Forexample, americium and neptunium are cationic at pH 3. At pH values greater than 7, they existpredominantly as either neutral or anionic species. Negatively charged complexes tend to adsorbless to soils than their respective cationic species. This rule-of-thumb stems from the fact that mostminerals in soils have a net negative charge in the range of pH values of most natural waters. Conversely, the solubility of several of these contaminants decreases dramatically as pH increases. Therefore, the net contaminant concentration in solution does not necessarily increase as thedominant aqueous species becomes more negatively charged.

5.80
Table 5.33. Selected chemical and transport properties of the contaminants.
Element Radio-nuclide1
Primary Species at pH 7and Oxidizing Conditions Redox
Sensitive2
Transport ThroughSoils at pH 7
Cationic Anionic Neutral NotRetarded3
Retarded3
(Attenuated)
Am x x x
As x x x (limited)
Cm x x x
I x x x x (limited)
Np x x x x (limited)
Ra x x x
Tc x x x x1 Contaminants that are primarily a health concern as a result of their radioactivity are identified in thiscolumn. 2 The redox status column identifies contaminants (As, I, and Tc) that have variable oxidationstates within the pH and Eh limits commonly found in the environment.3 Retarded or attenuated (nonconservative) transport means that the contaminant moves slowerthan water through geologic material. Nonretarded or nonattenuated (conservative) transport means thatthe contaminant moves at the same rate as water.
Another objective of this report is to identify the important chemical, physical, and mineralogicalcharacteristics controlling sorption of these contaminants. There are several aqueous- and solid-phase characteristics that can influence contaminant sorption. These characteristics commonlyhave an interactive effect on contaminant sorption, such that the effect of one parameter onsorption varies as the magnitude of other parameters changes. A list of some of the moreimportant chemical, physical, and mineralogical characteristics affecting contaminant sorption arelisted in Table 5.35.

5.81
Table 5.34. Distribution of dominant aqueous species for each contaminant at three pH values for an oxidizing
water described in Table 5.11.
ElementpH 3 pH 7 pH 10
Species % Species % Species %
Am(III) Am3+
AmF2+
AmSO4-
652014
AmCO3+
Am(OH)2+
Am(CO3)2-
Am3+
AmF2+
884322
Am(OH)°3 (aq)Am(CO3)2
-
AmCO3+
56422
As(V) H2AsO-4
H3AsO4° (aq)8614
HAsO42-
H2AsO-4
6634
HAsO42-
AsO43-
973
Cm(III)2 Cm3+ 100 CmCO3+
Cm3+
Cm(OH)2+
434215
Cm(OH)2+
CmCO3+
Cm(OH)2+
Cm(CO3)2-
86842
I(-I) I- 100 I- 100 I- 100
I(V) IO3- 100 IO3
- 100 IO3- 100
Np(V) NpO+2 100 NpO+
2NpO2(CO3)-
NpO2(OH)° (aq)
9711
NpO2(OH)° (aq)NpO2(CO3)-
NpO+2
NpO2(CO3)23-
514144
Ra Ra2+ 100 Ra2+ 100 Ra2+ 100
Tc(VII) TcO4- 100 TcO4
- 100 TcO4- 100
1 Only species comprising 1 percent or more of the total contaminant distribution are presented. Hence,the total of the percent distributions presented in table may not always equal 100 percent.2 Thermodynamic constants for aqueous species and solids containing curium are extremely limited. Byanalogy, the aqueous speciation of curium is expected to be very similar to Am(III). Aqueous speciationcalculated for Cm(III) is based on a limited set of constants.
The effect of pH on both adsorption and (co)precipitation of contaminants is pervasive. The pHinfluences a number of aqueous and solid phase properties that directly affect the sorption to somedegree of each contaminant reviewed in Volumes II and III. These effects are summarized inVolume I (EPA, 1999b), and discussed in greater detail for each contaminant in the individualgeochemistry review sections in Volumes II and III. As discussed above, pH has a significant effecton the aqueous speciation of most contaminants (Table 5.34). The adsorption behavior of eachcontaminant depends on the ionic charge and composition of its important aqueous species presentin the environmental system being studied. Additionally, pH affects the number of adsorption siteson variable-charged minerals (aluminum- and iron-oxide minerals), partitioning of contaminants toorganic matter, CEC, formation of aqueous complexes, oxidation state of contaminants andcomplexing/precipitating ligands, and H+/OH--competition for anionic or cationic adsorption sites.
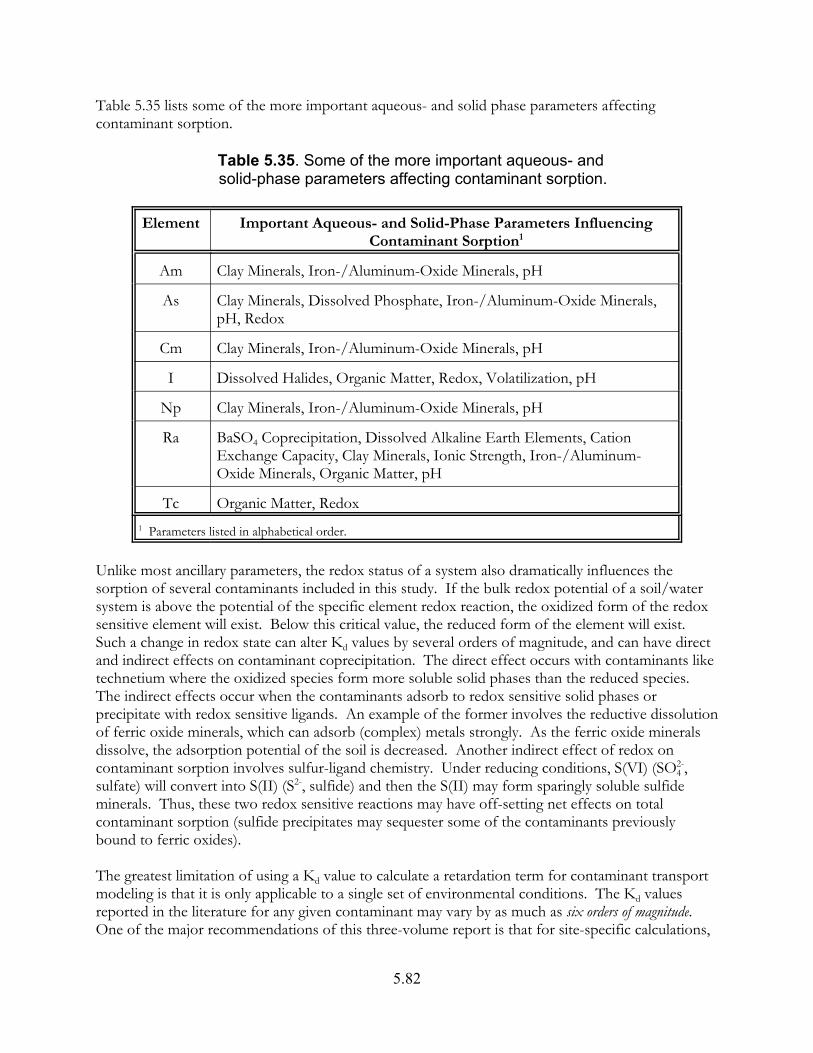
5.82
Table 5.35 lists some of the more important aqueous- and solid phase parameters affectingcontaminant sorption.
Table 5.35. Some of the more important aqueous- and solid-phase parameters affecting contaminant sorption.
Element Important Aqueous- and Solid-Phase Parameters InfluencingContaminant Sorption1
Am Clay Minerals, Iron-/Aluminum-Oxide Minerals, pH
As Clay Minerals, Dissolved Phosphate, Iron-/Aluminum-Oxide Minerals,pH, Redox
Cm Clay Minerals, Iron-/Aluminum-Oxide Minerals, pH
I Dissolved Halides, Organic Matter, Redox, Volatilization, pH
Np Clay Minerals, Iron-/Aluminum-Oxide Minerals, pH
Ra BaSO4 Coprecipitation, Dissolved Alkaline Earth Elements, CationExchange Capacity, Clay Minerals, Ionic Strength, Iron-/Aluminum-Oxide Minerals, Organic Matter, pH
Tc Organic Matter, Redox1 Parameters listed in alphabetical order.
Unlike most ancillary parameters, the redox status of a system also dramatically influences thesorption of several contaminants included in this study. If the bulk redox potential of a soil/watersystem is above the potential of the specific element redox reaction, the oxidized form of the redoxsensitive element will exist. Below this critical value, the reduced form of the element will exist. Such a change in redox state can alter Kd values by several orders of magnitude, and can have directand indirect effects on contaminant coprecipitation. The direct effect occurs with contaminants liketechnetium where the oxidized species form more soluble solid phases than the reduced species. The indirect effects occur when the contaminants adsorb to redox sensitive solid phases orprecipitate with redox sensitive ligands. An example of the former involves the reductive dissolutionof ferric oxide minerals, which can adsorb (complex) metals strongly. As the ferric oxide mineralsdissolve, the adsorption potential of the soil is decreased. Another indirect effect of redox oncontaminant sorption involves sulfur-ligand chemistry. Under reducing conditions, S(VI) (SO4
2-,sulfate) will convert into S(II) (S2-, sulfide) and then the S(II) may form sparingly soluble sulfideminerals. Thus, these two redox sensitive reactions may have off-setting net effects on totalcontaminant sorption (sulfide precipitates may sequester some of the contaminants previouslybound to ferric oxides).
The greatest limitation of using a Kd value to calculate a retardation term for contaminant transportmodeling is that it is only applicable to a single set of environmental conditions. The Kd valuesreported in the literature for any given contaminant may vary by as much as six orders of magnitude. One of the major recommendations of this three-volume report is that for site-specific calculations,
5.83
Kd values measured at site-specific conditions are absolutely essential. To select appropriate Kdvalue(s) for contaminant transport modeling, it is incumbent upon technical staff to understand (1)the strengths, weaknesses, and underlying assumptions of the different Kd methods (see EPA,1999b); and (2) the important geochemical processes and knowledge of the important ancillaryparameters affecting the sorption chemistry of each contaminant of interest. This volume, which isan extension of Volume II (EPA, 1999c), provides “thumb-nail sketches” of the important aqueousspeciation, (co)precipitation/dissolution, and adsorption processes affecting the sorption ofamericium, arsenic, curium, iodine, neptunium, radium, and technetium under oxidizing conditions.
6.1
6.0 References
Aas, W., E. Steinle, Th. Fanghänel, and J. I. Kim. 1999. “Thermodynamics of Cm(III) inConcentrated Solutions. Fluoride Complexation in 0-5 m NaCl at 25"C.” Radiochimica Acta,84:85-88.
Ahmann, D., L. R. Krumholz, H. F. Hemond, D. R. Lovley, and F. M. M. Morel. 1997. “MicrobialMobilization of Arsenic from Sediments of the Aberjona Watershed.” Environmental Science andTechnology, 31:2923-2930.
Al Mahamid, I., C. F. Novak, K. A. Becraft, S. A. Carpenter, and N. Hakem. 1998. “Solubility ofNp(V) in K-Cl-CO3 and Na-K-Cl-CO3 Solutions to High Concentrations: Measurements andThermodynamic Model Predictions.” Radiochimica Acta, 81:93-101.
Alberts, J. J., J. E. Pinder, III, E. Wurtz, and S. Lesner. 1986. “The Effect of pH, Solid Phase,Particle Concentration and Equilibration Time on the Partition Coefficient of Curium onNatural Sediments.” In Application of Distribution Coefficients to Radiological Assessment Models, eds. T. H. Sibley and C. Myttenaere, pp. 72-80, Elsevier Applied Science Publishers, New York, NewYork.
Allard, B. 1984. “Mechanisms for the Interaction of Americium(III) and Neptunium(V) withGeologic Media.” In Scientific Basis for Nuclear Waste Management VII, G. L. McVay (ed.),pp. 899-906, Materials Research Society Symposium Proceedings, Volume 26, North-Holland,New York, New York.
Allard, B., H. Kigatsi, and B. Torstenfelt. 1979a. “Technetium Reduction and Sorption in GraniticBedrock.” Radiochemical and Radioanalytical Letters, 37:223-230
Allard, B., B. Torstenfelt, K. Andersson, and J. Rydberg. 1980. “Possible Retention of Iodine in theGround.” In Scientific Basis for Nuclear Waste Management. Volume 2, C. J. M. Northrup, Jr. (ed.),pp. 673-680, Materials Research Society Symposium Proceedings, Volume 2, Plenum Press, NewYork, New York.
Allard, B., J. Rydberg, H. Kipatsi, and B. Torstenfelt. 1979b. “Disposal of Radioactive Waste inGranitic Bedrock.” In Radioactive Waste in Geologic Storage, ed . S. Fried, pp. 47-73, ACSSymposium Series 100, American Chemical Society, Washington, D.C.
Allison, J. D., D. S. Brown, and K. J. Novo-Gradac. 1991. MINTEQA2/PRODEFA2, AGeochemical Assessment Model for Environmental Systems: Version 3.0 User's Manual. EPA/600/3-91/021, U.S. Environmental Protection Agency, Athens, Georgia.
Amaya, T., W. Kobayashi, and K. Suzuki. 1995. “Absorption Study of the Tc(IV) on Rocks andMinerals Under Simulated Geological Conditions.” In Scientific Basis for Nuclear Waste ManagementXVIII, T. Murakami and R. C. Ewing (eds.), pp. 1005-1012, Materials Research SocietySymposium Proceedings, Volume 353, Materials Research Society, Pittsburgh, Pennsylvania.

6.2
Ames, L. L., and J. E. McGarrah. 1980. Basalt-Radionuclide Distribution Coefficient Determinations.FY-1979. Annual Report. PNL-3146, Pacific Northwest Laboratory, Richland, Washington.
Ames, L. L., and D. Rai. 1978. Radionuclide Interactions with Soil and Rock media. Volume 1: ProcessesInfluencing Radionuclide Mobility and Retention, Element Chemistry and Geochemistry, and Conclusions andEvaluations. EPA 520/6-78-007-a, U.S. Environmental Protection Agency, Las Vegas, Nevada.
Ames, L. L., J. E. McGarrah, and B. A. Walker. 1981. Basalt-Radionuclide Reactions: FY-1981. AnnualReport. PNL-3992 (also RHO-BW-CR-127), Pacific Northwest Laboratory, Richland,Washington.
Ames, L. L., J. E. McGarrah, and B. A. Walker. 1983a. “Sorption of Uranium and Radium byBiotite, Muscovite, and Phlogopite.” Clays and Clay Minerals, 31:343-351.
Ames, L. L., J. E. McGarrah, and B. A. Walker. 1983b. “Sorption of Trace Constituents fromAqueous Solutions onto Secondary Minerals. II. Radium.” Clays and Clay Minerals, 31:335-342.
Ames, L. L., J. E. McGarrah, B. A. Walker, and P. F. Salter. 1983c. “Uranium and Radium Sorptionon Amorphous Ferric Oxyhydroxide.” Chemical Geology, 40:135-148.
Anderson, M. A., J. F. Ferguson, and J. Gavis. 1976. “Arsenate Adsorption on AmorphousAluminum Hydroxide.” Journal of Colloid Interface Science, 54:391-399.
Andersson, K., B. Torstenfelt, and B. Allard. 1982. “Sorption Behavior of Long-LivedRadionculides in Igneous Rock.” In Environmental Migration of Long-Lived Radionuclides,pp. 111-131, Proceedings Series IAEA-SM-257, International Atomic Energy Agency, Vienna,Austria.
Artinger, R., C. M. Marquardt, J. I. Kim, A. Seibert, N. Trautmann, and J. V. Kratz. 2000. “HumicColloid-Borne Np Migration: Influence of the Oxidation State.” Radiochimica Acta, 88:609-612.
Baes, C. F., Jr., and R. E. Mesmer. 1976. The Hydrolysis of Cations. John Wiley and Sons, New York,New York.
Baes, C. F., III, and R. D. Sharp. 1983. “A Proposal for Estimation of Soil Leaching and LeachingConstants for Use in Assessment Models.” Journal of Environmental Quality, 12:17-28.
Ballantyne, J. M., and J. N. Moore. 1988. “Arsenic Geochemistry in Geothermal Systems.” Geochimica et Cosmochimica, 52:475-483.
Balsley, S. D., P. V. Brady, J. L. Krumhansl, and H. L. Anderson. 1996. “Iodide Retention by MetalSulfide Surfaces: Cinnabar and Chalcocite.” Environmental Science and Technology, 30:3025-3027.
Balsley, S. D., P. V. Brady, J. L. Krumhansl, and H. L. Anderson. 1997. 129I- and 99TcO4- Scavengers for
Low Level Radioactive Waste Backfills. SAND95-2978, Sandia National Laboratories, Albuquerque,New Mexico.

6.3
Banfield, J. F., and K. H. Nealson (eds.). 1997. Reviews in Mineralogy. Volume 35. Geomicrobiology:Interactions Between Microbes and Minerals. Mineralogical Society of America, Washington, D.C.
Baraniak, L., M. Thieme, G. Bernhard, and H. Nitsche. 1999. “Sorption Behavior of Radium onSandy and Clayey Sediments of the Upper Saxon Elbe River Valley.” Journal of Radioanalytical andNuclear Chemistry, 241:511-517.
Barney, G. S. 1982. FY 1981 Annual Report. Radionuclide Sorption on Basalt Interbed Materials. RHO-BW-ST-35 P, Rockwell International, Richland, Washington.
Barney, G. S., L. L. Ames, J. E. McGarrah, and B. A. Walker. 1983. Radionuclide Sorption Kinetics AndColumn Sorption Studies With Columbia River Basalts. SD-BWI-TI-168, Rockwell HanfordOperations, Richland, Washington.
Baston, G. M. N., J. A. Berry, M. Brownsword, T. G. Heath, D. J. Ilett, C. J. Tweed, and M. Yui. 1997. “The Effect of Temperature on the Sorption of Technetium, Uranium, Neptunium andCurium on Bentonite, Tuff and Granodiorite.” In Scientific Basis for Nuclear Waste ManagementXX, W. J. Gray and I. R. Triay (eds.), pp. 805-812, Materials Research Society SymposiumProceedings, Volume 465, Materials Research Society, Pittsburgh, Pennsylvania.
Bates, R. L., and J. A. Jackson (eds.). 1980. Glossary of Geology. American Geological Institute,
Second Edition, Falls Church, Virginia. Beall, G. W., B. H. Ketelle, R. G., and G. D. O’Kelley. 1978. “Sorption Behavior of Trivalent and
Rare Earths on Clays Minerals.” In Radioactive Waste in Geologic Storage, ed . S. Fried, pp. 201-213,ACS Symposium Series 100, American Chemical Society, Washington, D.C.
Beall, G. W., B. Allard, T. Krajewski, and G. D. O’Kelley. 1980. “Chemical Reactions in theBedrock-Groundwater System of Importance for the Sorption of Actinides.” In Scientific Basis forNuclear Waste Management. Volume 2, C. J. M. Northrup, Jr. (ed.), pp. 625-631, Materials ResearchSociety Symposium Proceedings, Volume 2, Plenum Press, New York, New York.
Beasley, T. M., and H. V. Lorz. 1984. “A Review of the Biological and Geochemical Behavior ofTechnetium in the Marine Environment.” In Technetium in the Environment, G. Desment andC. Myttenaere, pp. 197-2xx, Elsevier, New York, New York.
Behrens, H. 1982. “New Insights into the Chemical Behavior of Radioiodine in AquaticEnvironments.” In Environmental Migration of Long-Lived Radionuclides, pp. 27-40, InternationalAtomic Energy Agency, Vienna, Austria.
Belzile, N., and A. Tessier. 1990. “Interactions Between Arsenic and Iron Oxyhydroxides inLuacustrine Sediments.” Geochimica et Cosmochimica, 54:103-109.
Beneš, P. 1982. “Physico-Chemical Forms and Migration in Continental Waters of Radium fromUranium Mining and Milling.” In Environmental Migration of Long-Lived Radionuclides, pp. 3-23,Proceedings Series IAEA-SM-257, International Atomic Energy Agency, Vienna, Austria.
6.4
Beneš, P. 1990. “Radium in (Continental) Surface Water.” In The Environmental Behavior of Radium,Volume 1, pp. 373-418, International Atomic Energy Agency, Vienna, Austria.
Beneš, P., and P. Strejc. 1986. “Interaction of Radium with Freshwater Sediments and TheirMineral Components. IV. Waste Water and Riverbed Sediments.” Journal of Radioanalytical andNuclear Chemistry - Articles, 99:407-422.
Beneš, P., Z. Borovec, and P. Strejc. 1985. “Interaction of Radium with Freshwater Sediments andTheir Mineral Components. II. Kaolinite and Montmorillonite.” Journal of Radioanalytical andNuclear Chemistry, 89:339-351.
Beneš, P., Z. Borovec, and P. Strejc. 1986. “Interaction of Radium with Freshwater Sediments andTheir Mineral Components. III. Muscovite and Feldspar.” Journal of Radioanalytical and NuclearChemistry - Articles, 98:91-103.
Beneš, P., E. T. Gjessing, and E. Steinnes. 1976. “Interactions Between Humus and Trace
Elements in Fresh Water.” Water Research, 10:711-716.
Beneš, P., M. Obdrzálek, and M. „ejchanová. 1982. “The Physicochemical Forms of Traces ofRadium in Aqueous Solutions Containing Chlorides, Sulfates and Carbonates.” Radiochemical andRadioanalytical Letters, 50:227-242.
Beneš, P., P. Strejc, and Z. Lukouec. 1984. “Interaction of Radium with Freshwater Sediments andTheir Mineral Components. I. Ferric Hydroxide and Quartz.” Journal of Radioanalytical andNuclear Chemistry, 82:275-285.
Beneš, P., F. Šebesta, J. Sedlá…ek, M. Obdrzálek, and R. Šandrik. 1983. “Particulate Forms ofRadium and Barium in Uranium Mine Waste Waters and Receiving River Waters.” WaterResearch, 17:619-624.
Benjamin, M. M., and N. S. Bloom. 1981. “Effects of Strong Binding of Anionic Adsorbates onAdsorption of Trace Metals on Amorphous Iron Oxyhydroxide.” In Adsorption From AqueousSolutions, P. H. Tenari (ed.), pp. 41-60, Plenum Press, New York, New York.
Berry, J. A., K. A. Bond, M. M. Cowper, A. Green, and C. M. Linklater. 1994. “Factors Influencingthe Diffusion of Uranium, Plutonium and Radium Through Sherwood Sandstone fromSellafield, Cumbria.” Radiochimica Acta, 66:447-452.
Bird, G. A., and W. Schwartz. 1996. “Distribution Coefficients, Kd’s, for Iodide in Canadian ShieldLake Sediments Under Oxic and Anoxic Conditions.” Journal of Environmental Radioactivity,35:261-279.
Bock, W. -D., H. Brühl, T. Trapp, and A. Winkler. 1989. “Sorption Properties of Natural SuflidesWith Respect to Technetium.” In Scientific Basis for Nuclear Waste Management XII, W. Lutze andR. C. Ewing (eds.), pp. 973-977, Materials Research Society Symposium Proceedings,Volume 127, Materials Research Society, Pittsburgh, Pennsylvania.
6.5
Bondietti. E. A., and C. W. Francis. 1979. “Geologic Migration Potentials of Technetium-99 andNeptunium-237.” Science, 203:1337-1340.
Bors, J., H. Erten, and R. Marterns. 1991. “Sorption Studies of Radioiodine on Soils with SpecialReferences to Soil Microbial Biomass.” Radiochimica Acta, 52/53:317-325.
Bors, J., R. Martens, and W. Kühn. 1988. “Studies on the Role of Natural and AnthropogenicOrganic Substances in the Mobility of Radioiodine in Soils.” Radiochimica Acta, 44/45:201-206.
Bradbury, M. H., and I. G. Stephen. 1985. “Diffusion and Permeability Based SorptionMeasurements in Intact Rock Samples.” In Scientific Basis for Nuclear Waste Management IX,L. O. Werme (ed.), pp. 80-90, Materials Research Society Symposium Proceedings, Volume 50,Materials Research Society, Pittsburgh, Pennsylvania.
Brady, P. V., H. W. Pagenguth, and J. W. Kelly. 1999. “Metal Sorption to Dolomite Surfaces.” Applied Geochemistry, 14:569-579.
Braman, R. S. 1983. “Environmental Reaction and Analysis Methods.” In Biological andEnvironmental Effects of Arsenic, B. A. Fowler (ed.), pp. 141-154. Elsevier, New York, New York.
Brown, G. E., Jr., V. E. Henrich, W. H. Casey, D. L. Clark, C. Eggleston, A. Felmy,D. W. Goodman, M. Grätzel, G. Maciel, M. I. McCarthy, K. H. Nealson, D. A. Sverjensky,M. F. Toney, and J. M. Zachara. 1999. “Metal Oxide Surfaces and Their Interactions withAqueous Solutions and Microbial Organisms.” Chemical Reviews, 99:77-174.
Burton, P. J., J. D. Eakins, and A. E. Lally. 1986. “The Significance of Distribution Coefficients inthe Remobilization of Actinides from Intertidal Sediments of the Ravenglass Estuary.” InApplication of Distribution Coefficients to Radiological Assessment Models, eds. T. H. Sibley andC. Myttenaere, pp. 288-298, Elsevier Applied Science Publishers, New York, New York.
Byegård, J., Y. Albinsson, G. Skarnemark, and M. Skålberg. 1992. “Field and Laboratory Studies ofthe Reduction and Sorption of Technetium(VII).” Radiochimica Acta, 58/59:239-244.
Carrillo, A., and J. I. Drever. 1998. “Adsorption of Arsenic by Natural Aquifer Material in the SanAntonio-El-Triunfo Mining Area, Baja California, Mexico.” Environmental Geology, 35:251-257.
Carroll, J., F. Boisson, J. -L. Teyssie, S. E. King, M. Krosshavn, M. L. Carroll, S. W. Fowler,P. P. Povinec, and M. S. Baxter. 1999. “Distribution Coefficients (Kd’s) for Use in RiskAssessment Models of the Kara Sea.” Applied Radiation and Isotopes, 51:121-129.
Choppin, G. R. 1989. “Soluble Rare Earth and Actinide Species in Seawater.” Marine Chemistry,28:1926.
Choppin, G. R. 1992. “The Role of Natural Organics in Radionuclide Migration in Natural AquiferSystems.” Radiochimica Acta, 58/59:113-120.

6.6
Church, T. M. 1979. “Marine Barite.” In Marine Minerals, R. G. Burns, (ed.), Chapter 7,pp. 175-209, Mineralogical Society of America Short Course Notes, Volume 6, MineralogicalSociety of America, Washington, D.C.
Clark, S. B., A. L. Bryce, A. D. Lueking, J. Gariboldi, and S. M. Serkiz. 1998. “Factors AffectingTrivalent f-Element Adsorption to an Acidic Sandy Soil.” In Adsorption of Metals by Geomedia. Variables, Mechanisms, and Model Applications, E. A. Jenne (ed.), pp. 149-164, Academic Press, SanDiego, California.
Clifford, D. A. 1990. “Removal of Radium from Drinking Water.” In Radon, Radium and Uraniumin Drinking Water, C. R. Cothern and P. A. Rebers (eds.), Chapter 16, pp. 225-247, LewisPublishers, Chelsea, Michigan.
Combes, J-M., C. J. Chisholm-Brause, G. E. Brown, Jr., G. A. Parks, S. D. Conradson, P. G. Eller, I.R. Triay, D. E. Hobart, and A. Meijer. 1992. “EXAFS Spectroscopic Study of Neptunium(V)Sorption at the "-FeOOH/Water Interface.” Environmental Science and Technology, 26:376-382.
Cornett, J., L. Chant, and B. Risto. 1992. “Arsenic Transport Between Water and Sediments.” Hydrobiologia, 235/236:533-544.
Cothern, C. R., and P. A. Rebers (eds.). 1990. Radon, Radium and Uranium in Drinking Water. LewisPublishers, Chelsea, Michigan.
Coughtrey, P. J., D. Jackson, and M. C. Thorne. 1983. Radionuclide Distribution and Transport inTerrestrial and Aquatic Ecosystems. A Critical Review of Data. A. A. Balkema, Rotterdam,Netherlands.
Coughtrey, P. J., D. Jackson, C. H. Jones, P. Kane, and M. C. Thorne. 1984. Radionuclide Distributionand Transport in Terrestrial and Aquatic Ecosystems. A Critical Review of Data. A. A. Balkema, Boston,Massachusetts.
Couture, R. A., and M G. Seitz. 1983. “Sorption of Anions of Iodine by Iron Oxides andKaolinite.” Nuclear and Chemical Waste Management, 4:301-306.
Crecelius, E. A., N. S. Bloom, C. E. Cowan, and E. A. Jenne. 1986. Speciation of Selenium and Arsenicin Natural Waters and Sediments. Volume 2: Arsenic Speciation. EA-4641, Volume 2, Electric PowerResearch Institute, Palo Alto, California.
Cui, D., and T. E. Eriksen. 1996. “Reduction of Pertechnetate in Solution by HeterogeneousElectron Transfer from Fe(II)-Containing Geological Material.” Environmental Science andTechnology, 30:2263-2269.
Cullen, W. R., and K. J. Reimer. 1989. “Arsenic Speciation in the Environment.” Chemical Reviews,89:713-764.
6.7
Cummings, D. E., F. Caccavo, Jr., S. Fendorf, and R. F. Rosenzweig. 1999. “Arsenic Mobilizationby the Dissimilatory Fe(III)-Reducing Bacterium Shewanella alga BrY.” Environmental Science andTechnology, 33:723-729.
Dahlman, R. C., E. A. Bondietti, and L. D. Eyman. 1976. “Biological Pathways and ChemicalBehavior of Plutonium and Other Actinides in the Environment.” In Actinides in the Environment,A. M. Friedman (ed.), pp. 47-80, ACS Symposium Series No. 35, American Chemical Society,Washington, D.C.
Davis, J. A. 1978. Adsorption of Trace Metals and Complexing Ligands at the Oxide/Water Interface. Ph.D.Thesis, Stanford University, California.
Davis, J. 2000. “Stability of Metal-Arsenic Solids in Drinking Water Systems.” Practice Periodical ofHazardous, Toxic, and Radioactive Waste Management, 4:31-35.
Davis, J. A., C. C. Fuller, B. A. Rea, and R. G. Claypool-Frey. 1989. “Sorption and Coprecipitationof Arsenate by Ferrihydrite.” In Water-Rock Interaction. WRI-6 (Proceedings of the 6th InternationalSymposium on Water-Rock Interaction, Malvern, 3-8 August 1989), D. L. Miles (ed.), pp. 187-189, A. A.Balkema, Rotterdam, Holland.
Del Nero, M., B. Madé, G. Bontems, and A. Clément. 1997. “Adsorption of Neptunium(V) onHydrargillite.” Radiochimica Acta, 76:219-228.
Degueldre, C., H. J. Ulrich, and H. Silby. 1994. “Sorption of Am-241 onto Montmorillonite, Illiteand Hematite Colloids.” Radiochimica Acta, 65:173-179.
Dickson, B. L. 1990. “Radium in Groundwater.” In The Environmental Behavior of Radium, Volume 1,pp. 335-372, International Atomic Energy Agency, Vienna, Austria.
Doner, H. E., and W. C. Lynn. 1977. “Carbonate, Halide, Sulfate, and Sulfide Minerals.” InMinerals in Soil Environments, J. B. Dixon and S. B. Weed (eds.), pp. 75-98, Soil Society ofAmerica, Madison, Wisconsin.
Dzombak, D. A., and F. M. M. Morel. 1990. Surface Complexation Modelling, John Wiley and Sons,New York, New York.
Eary, L. E., and D. Rai. 1989. “Kinetics of Chromate Reduction by Ferrous Ions Derived fromHematite and Biotite at 25ºC.” American Journal of Science, 289:180-213.
Efurd, D., W. Runde, J. C. Banar, D. R. Janecky, J. P. Kaszuba, P. D. Palmer, F. R. Roensch, andC. D. Tait. 1998. “Neptunium and Plutonium Solubilities in a Yucca Mountain Groundwater.” Applied Geochemistry, 32:3893-3900.
EPA (U.S. Environmental Protection Agency). 1999a. MINTEQA2/PRODEFA2, A GeochemicalAssessment Model for Environmental Systems: User Manual Supplement for Version 4.0. Prepared for theU.S. Environmental Protection Agency, Athens, Georgia by HydroGeologic, Inc., Herndon,Virginia and Allison Geoscience Consultants, Inc., Flowery Branch, Georgia.

6.8
EPA (U.S. Environmental Protection Agency). 1999b. Understanding Variation in Partition Coefficient,Kd, Values: Volume I. The Kd Model, Methods of Measurement, and Application of Chemical Reaction Codes. EPA 402-R-99-004A, prepared for the U.S. Environmental Protection Agency, Washington,D.C. by Pacific Northwest National Laboratory, Richland, Washington.
EPA (U.S. Environmental Protection Agency). 1999c. Understanding Variation in Partition Coefficient,Kd, Values: Volume II. Review of Geochemistry and Available Kd Values for Cadmium, Cesium, Chromium,Lead, Plutonium, Radon, Strontium, Thorium, Tritium (3H), and Uranium. EPA 402-R-99-004B,prepared for the U.S. Environmental Protection Agency, Washington, D.C. by the PacificNorthwest National Laboratory, Richland, Washington.
Erdal, B. R., W. R. Daniels, D. C. Hoffman, F. O. Lawrence, and K. Wolfsberg. 1979. “Sorptionand Migration of Radionuclides in Geologic Media.” In Scientific Basis for Nuclear WasteManagement, Volume 1, G. J. McCarthy (ed.), pp. 423-426, Plenum Press, New York, New York.
Erickson, K. L. 1980. “Radionuclide Sorption Studies on Abyssal Red Clays.” In Scientific Basis forNuclear Waste Management, Volume 2, C. J. M. Northrup, Jr. (ed.), pp. 641-646, Plenum Press, NewYork, New York.
Eriksen, T. E., P. Ndalamba, J. Bruno, and M. Caceci. 1992. “The Solubility of TcO2AnH2O inNeutral to Alkaline Solutions under Constant pCO2 .” Radiochimica Acta, 58/59:67-70.
Eriksen, T. E., and D. Cui. 1991. On the Interaction of Granite with Tc(IV) and Tc(VII) in AqueousSolution. SKB Technical report 91-47, Svensk Kärnbränslehantering AB (Swedish Nuclear Fueland Waste Management Company), Stockholm, Sweden.
Fanghänel, Th., V. Neck, and J. I. Kim. 1995. “Thermodynamics of Neptunium(V) inConcentrated Salt Solutions: I. Ion Interaction (Pitzer) parameters for Np(V) Hydrolysis Speciesand Carbonate Complexes.” Radiochimica Acta, 69:169-176.
Fanghänel, Th., H. T. Weger, Th. Könnecke, V. Neck, P. Paviet-Hartmann, E. Steinle, and J. I. Kim. 1998. “Thermodynamics of Cm(III) in Concentrated Electrolyte Solutions. CarbonateComplexation at Constant Ionic Strength (1 m NaCl).” Radiochimica Acta, 82:47-53.
Felmy, A. R., D. Rai, and R. W. Fulton. 1990. “The Solubility of AmOHCO3(c) and the AqueousThermodynamics if the System Na+-Am3+-HCO3
--CO32–OH–-H2O.” Radiochimica Acta,
50:193-204.
Fendorf, S., M. J. Eick, P. Grossl, and D. L. Sparks. 1997. “Arsenate and Chromate RetentionMechanisms on Goethite. 1. Surface Structure.” Environmental Science and Technology, 31:315-320.
Frissel, M. J., and H. W. Köster. 1990. “Radium in Soil.” In The Environmental Behavior of Radium,Volume 1, pp. 323-334, International Atomic Energy Agency, Vienna, Austria.
Frost, R. R., and R. A. Griffin. 1977. “Effect of pH on Adsorption of Arsenic and Selenium fromLandfill leachate by Clay Minerals.” Soil Science Society of America Journal, 41:53-57.

6.9
Fruchter, J. S., D. Rai, and J. M. Zachara. 1990. “Identification of Solubility-Controlling SolidPhases in a Large Fly Ash Field Lysimeter.” Environmental Science and Technology, 24:1173-1179.
Fujita, T., M. Tsukamoto, T. Ohe, S. Nakayam, and Y. Skamoto. 1995. “Modeling ofNeptunium(V) Sorption Behavior onto Iron-Containing Minerals.” .In Scientific Basis for NuclearWaste Management XVII, T. Murakami and R. C. Ewing (eds.), pp. 965-972, Materials ResearchSociety Symposium Proceedings, Volume 353, Materials Research Society, Pittsburgh,Pennsylvania.
Fukui, M., Y. Fujikawa, and N. Sata. 1996. “Factors Affecting Interaction of Radioiodide andIodate Species with Soil.” Journal of Environmental Radioactivity, 31:199-216.
Fuller, C. C., J. A. Davis, and G. A. Waychunas. 1993. “Surface Chemistry of Ferrihydrite: Part 2. Kinetics of Arsenate Adsorption and Coprecipitation.” Geochimica et Cosmochimica, 57:2271-2282.
Gascoyne, M. 1982. “Geochemistry of the Actinides and Their Daughters.” In Uranium SeriesDisequilibrium: Applications to Environmental Problems, M. Ivanovich and R. S. Harmon (eds.),pp. 33-55, Clarendon Press, Oxford, England.
Gast, R. G., E. R. Landa, L. J. Thorvig, D. F. Grigal, and J. C. Balogy. 1979. The Behavior ofTechnetium-99 in Soils and Plants. C00-2447-6, Department pf Soil Science, University ofMinnesota, St. Paul, Minnesota.
Gee, G. W., and A. C. Campbell. 1980. Monitoring and Physical Characterization of Unsaturated ZoneTransport - Laboratory Analysis. PNL-3304, Pacific Northwest Laboratory, Richland, Washington.
Girvin, D. C., L. L. Ames, A. P. Schwab, and J. E. McGarrah. 1991. “Neptunium Adsorption onSynthetic Amorphous Iron Oxyhydroxide.” Journal of Colloid and Interface Science, 141:67-78.
Greeman, D. J., A. W. Rose, J. W. Washington, R. R. Dobos, and E. J. Ciolkosz. 1999. “Geochemistry of Radium in Soils of the Eastern United States.” Applied Geochemistry,14:365-385.
Grenthe, I., J. Fuger, R. J. M. Konings, R. J. Lemire, A. B. Muller, C. Nguyen-Trung, H. Wanner. 1992. Chemical Thermodynamics 1: Chemical Thermodynamics of Uranium. North-Holland, ElsevierScience Publishing Company, Inc., New York, New York.
Gu, B., and K. E. Dowlen. 1996. An Investigation of Groundwater Organics, Soil Minerals, and ActivatedCarbon on the Complexation, Adsorption, and Separation of Technetium-99. ORNL/TM-13154, OakRidge National Laboratory, Oak Ridge, Tennessee.
Gu, B., and R. K. Schulz. 1991. Anion Retention in Soil: Possible Application to Reduce Migration of BuriedTechnetium and Iodine. NUREG/CR-5464, prepared by the University of California at Berkeley,California for the U. S. Nuclear Regulatory Commission, Washington, D.C.
Guppy, R. M., A. Atkinson, and T. M. Valentine. 1989. Studies of the Solubility of Technetium under aRange of Redox Conditions. AERE-R13467, Harwell Laboratory, Oxfordshire, England.
6.10
Gupta, S. K., and K. Y. Chen. 1978. “Arsenic Removal of Adsorption.” Journal - Water PollutionControl Federation, 50:493-506.
Haines, R. I., D. G. Owen, and T. T. Vandergraaf,. 1987. “Technetium-Iron Oxide ReactionsUnder Anaerobic Conditions: A Fourier Transform Infrared, FTIR Study.” Nuclear Journal ofCanada, 1:32-37.
Hakanen, M., and A. Lindberg. 1991. “Sorption of Neptunium under Oxidizing and ReducingGroundwater Conditions.” Radiochimica Acta, 52/53:147-151.
Hakem, N., B. Fourest, R. Guillaumont, and N. Marmier. 1996. “Sorption of Iodine and Cesiumon Some Mineral Oxide Colloids.” Radiochimica Acta, 74:225-230.
Halter, W. E., and H. R. Pfeider. 2001. “Arsenic(V) Adsorption onto "-Al2O3 Between 25 and70"C.” Applied Geochemistry, 16:793-802.
Hanslík, E. and A. Mansfeld. 1990. “Removal of Radium from Drinking Water.” In TheEnvironmental Behavior of Radium, Volume 2, pp. 229-268, International Atomic Energy Agency,Vienna, Austria.
Haq, Z., G. M. Bancroft, W. S. Fyfe, G. Bird, and V. J. Lopata. 1980. “Sorption of Iodide onCopper.” Environmental Science and Technology, 14:1106-1110.
Hart, K. P., T. E. Payne, B. J. Robinson, and P. Van Iseghem. 1994. “Neptunium Uptake on BoomClay - Time Dependence and Association of Np with Fine Particles.” Radiochimica Acta,66/67:19-22.
Hem, J. D. 1985. Study and Interpretation of the Chemical Characteristics of Natural Water. U.S. GeologicalSurvey Water Supply Paper 2254, U.S. Geological Survey, Alexandria, Virginia.
Ho, P.C., 1992. “Sorption of Cesium, Strontium, and Technetioum onto Organic-Extracted Shales.” Radiochimica acta, 56:159-166.
Hsia, T. H., S. L. Lo, C. F. Lin, and D. Y. Lee. 1994. “Characterization of Arsenate Adsorption onHydrous Iron-Oxide Using Chemical and Physical Methods.” Colloids and SurfacesA-Physicochemical and Engineering Aspects, 85:1-7.
Huang, P. M. 1975. “Retention of Arsenic by Hydroxy-Aluminum on Surfaces of MicaceousMineral Colloids.” Soil Science Society of America Proceedings, 39:271-274.
Huck, P. M., and W. B. Anderson. 1990. “Removal of 226Ra from Uranium Mining Effluents andleaching From Sludges.” In The Environmental Behavior of Radium, Volume 2, pp. 135-162,International Atomic Energy Agency, Vienna, Austria.
Hughes, M. A., and F. J. C. Rossotti. 1987. A Review of Some Aspects of the Solution Chemistry ofTechnetium. AERE-R 12820, University of Oxford, Oxford, England.
6.11
Huie, Z., Z. Jishu, and Z. Lanying. 1988. “Sorption of Radionuclides Technetium and Iodine onMinerals.” Radiochimica Acta, 44/45:143-145.
Hummel, W., M. A. Glaus, and L. R. Van Loon. 1999. “Complexation of Radionuclides withHumic Substances: The Metal Concentration Effect.” Radiochimica Acta, 84:111-114.
IAEA (International Atomic Energy Agency). 1990. The Environmental Behavior of Radium, Volumes 1and 2. International Atomic Energy Agency, Vienna, Austria.
Ikeda, Y., M. Sazarashi, M. Tsuji, R. Seki, and H. Yoshikawa. 1994. “Adsorption of I- Ions onCinnabar for 129I Waste Management.” Radiochimica Acta, 65:195-198.
Ilton E. S., and D. R. Veblen. 1994. “Chromium Sorption by Phlogopite and Biotite in AcidicSolutions at 25ºC: Insights from X-ray Photoelectron Spectroscopy and ElectronSpectroscopy.” Geochimica et Cosmochimica Acta, 58:2777-2788, 1994.
Itagaki, H., S. Tanaka, and M. Yamawaki. 1991. “Neptunium Chemical Behavior in UndergroundEnvironments Using Ultrafiltration and Centrifugation.” Radiochimica Acta, 52/53:91-94.
Jain, A., K. P. Raven, and R. H. Loeppert. 1999. “Arsenite and Arsenate Adsorption onFerrihydrite: Surface Charge Reduction and Net OH- Release Stoichiometry.” EnvironmentalScience and Technology, 33:1179-1184.
Jacobs, L. W., J. K. Syers, and D. R. Keeney. 1970. “Arsenic Sorption by Soils.” Soil Science Society ofAmerica Proceedings, 34:750-754.
Johnson, K. S. 1994. “Iodine.” In Industrial Minerals and Rocks, D. C. Carr (ed.), pp. 583-588,Society for Mining, Metallurgy, and Exploration, Inc., Littleton, Colorado.
Jones, C. A., H. W. Langner, K. Anderson, T. R. McDermott, and W. P. Inskeep. 2000. “Rates ofMicrobially Mediated Arsenate Reduction and Solubilization.” Soil Science Society of AmericaJournal, 64:600-608.
Kaplan, D. I., and R. J. Serne. 1998. “Pertechnetate Exclusion from Sediments.” Radiochimica Acta,81:117-124.
Kaplan, D. I., and R. J. Serne. 2000. Geochemical Data Package for the Hanford Immobilized Low-ActivityTank Waste Performance Assessment (ILAW PA). PNNL-13037, Rev. 1, Pacific NorthwestNational Laboratory, Richland, Washington.
Kaplan, D. I., K. E. Parker, and I. V. Kutynakov. 1998a. Radionuclide Distribution Coefficients forSediments Collected form Borehole 299-E17-21: Final Report for Subtask-1a. PNNL-11966, PacificNorthwest National Laboratory, Richland, Washington.
Kaplan, D. I., K. E. Parker, and R. D. Orr. 1998b. Effects of High-pH and High-Ionic-StrengthGroundwater on Iodide, Pertechnetate, and Selenate Sorption to Hanford Sediments: Final Report forSubtask 3a. PNNL-11964, Pacific Northwest National Laboratory, Richland, Washington.

6.12
Kaplan, D. I., P. M. Bertsch, D. C. Adriano, and K. A. Orlandini. 1994. “Actinide Association withGroundwater Colloids in a Coastal Plain Aquifer.” Radiochimica Acta, 66/67:181-187.
Kaplan, D., S. Mattigod, K. Parker, and G. Iversen. 2000a. Experimental Work in Support of the129I-Disposal Special Analysis. WSRC-TR-2000-00283, Rev. 0, Westinghouse Savannah RiverCompany, Aiken, South Carolina.
Kaplan, D. I., R. J. Serne, K. E. Parker, and I. V. Kutnyakov. 1999. “Radioiodide Sorption toSediment Minerals.” In Scientific Basis for Nuclear Waste Management XXII, D. J. Wronkiewicz andJ. H. Lee (eds.), pp. 1059-1065, Materials Research Society Symposium Proceedings,Volume 556, Materials Research Society, Warrendale, Pennsylvania.
Kaplan, D. I., R. J. Serne, K. E. Parker, and I. V. Kutnyakov. 2000b. “Iodide Sorption toSubsurface Sediments and Illitic Minerals.” Environmental Science & Technology, 34:399-405.
Kaplan, D. I., I. V. Kutnyakov, A. P. Gamerdinger, R. J. Serne, and K. E. Parker. 2000c. “Gravel-Corrected Kd Values.” Ground Water, 38:851-857.
Kaplan, D. I., R. J. Serne, A. T. Owen, J. Conca, T. W. Wietsma, and T. L. Gervais. 1996. Radionuclide Adsorption Distribution Coefficients Measured in Hanford Sediments for the Low Level WastePerformance Assessment Project. PNNL-11485, Pacific Northwest Laboratory, Richland,Washington.
Kaszuba, J. P., and W. H. Runde. 1999. “The Aqueous Geochemistry of Neptunium: DynamicControl of Soluble Concentrations with Applications to Nuclear Waste Disposal.” EnvironmentalScience and Technology, 33:4427-4433.
Keeney-Kennicutt, W. L., and J. W. Morse. 1984. “The Interaction of NpO2+ with Common
Mineral Surfaces in Dilute Aqueous-Solutions and Seawater.” Marine Chemistry, 15:133-150.
Kim, J. I., and T. Sekine. 1991. “Complexation of Neptunium(V) with Humic Acid.” RadiochimicaActa, 55:187-192.
Kim, J. L., D. S. Rhee, H. Wimmer, G. Buckau, and R. Klenze. 1993. “Complexation of TrivalentActinide Ions (Am3+, Cm3+) with Humic Acid: A Comparison of Different ExperimentalMethods.” Radiochimica Acta, 62:35-43.
Kim, M-J., J. Nriagu, and S. Haack. 2000. “Carbonate Ions and Arsenic Dissolution byGroundwater.” Environmental Science and Technology, 34:3094-3100.
King, P. T., J. Michel, and W. S. Moore. 1982. “Ground Water Geochemistry of 228Ra, 226Ra, and222Rn.” Geochimica et Cosmochimica Acta, 46:1173-1181.
Koch, J. T., D. B. Rachar, and B. D. Kay. 1989. “Microbial Participation in Iodide Removal FromSolution by Organic Soils.” Canadian Journal of Soil Science, 69:127-135.
6.13
Kohler, M., B. D. Honeyman, and J. O. Leckie. 1999. “Neptunium(V) Sorption on Hematite("-Fe2O3) in Aqueous Suspension: The Effect of CO2.” Radiochimica Acta, 85:33-48.
Könnecke, Th., Th. Fanghänel, and J. I. Kim. 1997. “Thermodynamics of Trivalent Actinides inConcentrated Electrolyte Solutions: Modeling the Chloride Complexation of Cm(III).” Radiochimica Acta, 76:131-135.
Korte, N. E., and Q. Fernando. 1991. “A Review of Arsenic(III) in Groundwater.” Critical Reviewsin Environmental Control, 21:1-39.
Koulouris, G. 1995. “Dynamic Studies on Sorption Characteristics of 226Ra on ManganeseDioxide.” Journal of Radioanalytical and Nuclear Chemistry, Articles, 193:269-279.
Kozai, N., T. Ohnuki, J. Matsumoto, T. Banha, and Y. Ito. 1996. “A Study of Specific Sorption ofNeptunium(V) on Smectite in Low pH Solution.” Radiochimica Acta, 75:149-158.
Kung, K. S., and I. R. Triay. 1994. “Effect of Natural Organics on Cs and Np Sorption.” Radiochimica Acta, 66/67:421-426.
Lackovic, J. A., N. P. Nikolaidis, and G. M. Dobbs. 2000. “Inorganic Arsenic Removal by Zero-Valent Iron.” Environmental Engineering Science, 17:29-39.
Ladeira, A. C. Q., V. S. T. Ciminelli, H. A. Duarte, M. C. M. Alves, and A. Y. Ramos. 2001. “Mechanism of Anion Retention from EXAFS and Density Functional Calculations: Arensic(V)Adsorbed on Gibbsite.” Geochimica et Cosmochimica Acta, 65:1211-1217.
Landa, E. R., and J. R. Gray. 1995. “U.S. Geological Survey Research on the Environmental Fateof Uranium Mining and Milling Wastes.” Environmental Geology, 26:19-31.
Landa, E. R., L. Thorvig, and R. G. Gast. 1977. “Effect of Selective Dissolution, Electrolytes,Aeration, and Sterilization on Technetium-99 Sorption by Soils.” Journal of Environmental Quality,6:181-187.
Langmuir, D. 1997. Aqueous Environmental Geochemistry. Prentice Hall, Upper Saddle River, NewJersey.
Langmuir, D., and D. Melchior. 1985. “The Geochemistry of Ca, Sr, Ba, and Ra Sulfates in SomeDeep Brines From the Palo Dura Basin, Texas.” Geochimica et Cosmochimica Acta, 49:2423-2432.
Langmuir, D., and A. C. Riese. 1985. “The Thermodynamic Properties of Radium.” Geochimica etCosmochimica Acta, 49:1593-1601.
Langner, H. W., and W. P. Inskeep. 2000. “Microbial Reduction of Arsenate in the Presence ofFerrihydrite.” Environmental Science and Technology, 34:3131-3136.
6.14
Leckie, J. O., M. M. Benjamin, K. Hayes, G. Kaufman, and S. Altman. 1980. Adsorption/Coprecipitation of Trace Elements from Water With Iron Oxyhydroxides. EPRI-RP-910,Electric Power Research Institute, Palo Alto, California.
Lemire, R. J. 1984. An Assessment of the Thermodynamic Behavior of Neptunium in Water and ModelGroundwater from 25 to 150/C. AECL-7817, Atomic Energy of Canada Limited (AECL), Pinawa,Manitoba, Canada.
Lemire, R. J., G. D. Boyer, and A. B. Campbell. 1993. “The Solubilities of Sodium and PotassiumDioxoneptunium(V) Carbonate Hydrates at 30"C, 50"C, and 75"C.” Radiochimica Acta, 61:57-63.
Lemire, R. J., Fuger, J., H. Nitsche, P. Potter, M. H. Rand, J. Rydbrg, K. Spahiu, J. C. Sullivan, W. J.Ullman, P. Vitorge, and H. Wanner. 2001. Chemical Thermodynamics 4: Chemical Thermodynamics ofNeptunium and Plutonium. North-Holland, Elsevier Science Publishing Company, Inc., New York,New York.
Lieser, K. H. 1993. “Technetium in the Nuclear Fuel Cycle, in Medicine and in the Environment.” Radiochimica Acta, 63:5-8.
Lieser, K. H., and Ch. Bauscher. 1987. “Technetium in the Hydrosphere and in the Geosphere, I.Chemistry of Technetium and Iron in Natural Waters and Influence of Redox Potential on theSorption of Technetium.” Radiochimica Acta, 42:205-213.
Lieser, K. H., and Ch. Bauscher. 1988. “Technetium in the Hydrosphere and in the Geosphere.” II. Influence of pH, of Complexing Agents and of Some Minerals on the Sorption ofTechnetium.” Radiochimica Acta, 44/45:125-128.
Lieser, K. H., and U. Mühlenweg. 1988. “Neptunium in the Hydrosphere and in the Geosphere. I. Chemistry of Neptunium in the Hydrosphere and Sorption of Neptunium from Groundwateron Sediments under Aerobic and Anaerobic Conditions.” Radiochimica Acta, 44/45:129-133.
Lieser, K. H., and Th. Steinkopff. 1989. “Chemistry of Radioactive Iodine in the Hydrosphere andin the Geosphere.” Radiochimica Acta, 46:49-55.
Lin, Z., and R. W. Puls. 2000. “Adsorption, Desorption and Oxidation of Arsenic Affected by ClayMinerals and Aging Process.” Environmental Geology, 39:753-759.
Livesey, N. T., P. M. Huang. 1981. “Adsorption of Arsenate by Soils and Its Relation to SelectedChemical Properties and Anions.” Soil Science, 131:88-94.
Lloyd, J. R., and L. E. Macaskie. 1996. “A Novel PhoshorImager-Based Technique for Monitoringthe Microbial Reduction of Technetium.” Applied and Environmental Microbiology, 62(2):578-582.
Lloyd, J. R., J. A. Cole, and L. E. Macaskie. 1997. “Reduction and Removal of HeptavalentTechnetium from Solution by Escherichia coli.” Journal of Bacteriology, 179(6):2014-2021.
6.15
Lloyd, J. R., P. Yong, and L. E. Macaskie. 2000a. “Biological Reduction and Removal of Np(V) byTwo Microorganisms.” Environmental Science and Technology, 34:1297-1301.
Lloyd, J. R., V. A. Sole, C. V. G. Van Praagh, and D. R. Lovley. 2000b. “Direct and Fe(II)-Mediated Reduction of Technetium by Fe(III)-Reducing Bacteria.” Applied and EnvironmentalMicrobiology, 66:3743-3749.
Lloyd, J. R., H. F. Nolting, V. A. Solé, K. Bosecker, and L. E. Macaskie. 1998. “TechnetiumReduction and Precipitation by Sulfate-Reducing Bacteria.” Geomicrobiology Journal, 15:45-58.
Lloyd, J. R., J. Ridley, T. Khizniak, N. N. Lyalikova, and L. E. Macaskie. 1999. “Reduction ofTechnetium by Desulfovibrio desulfuricans: Biocatalyst Characterization and Use in a FlowthroughBioreactor. Applied and Environmental Microbiology, 65, 2691-2696.
Looney, B. B., M. W. Grant, and C. M. King. 1987. Estimating of Geochemical Parameters for AssessingSubsurface Transport at the Savannah River Plant. DPST-85-904, Environmental InformationDocument, E. I. du pont de Nemours and Company, Savannah River Laboratory, Aiken, SouthCarolina.
Lovley, D. R. 1993. “Dissimilatory Metal Reduction.” Annual Review of Microbiology, 47:263-290.
Lovley, D. R. 1995. “Bioremediation of organic and metal contaminants with dissimilatory metalreduction.” Journal of Industrial Microbiology, 14:85-93.
Lowson, R. T., and J. V. Evans. 1984. “Adsorption and Desorption of Low Concentrations HeavyMetal Ions on Oxides and Clays.” In Environmental Migration of Radium and Other ContaminantsPresent in Liquid and Solid Wastes from the Mining and Milling of Uranium, J. V. Evans (manager),pg. 7(1)-7(11), Progress Report of the CRP, IAEA Research Contract No.2890/CF, AustralianAtomic Energy Commission Research Establishment, Lucas Heights Research Laboratories,Sutherland, New South Wales, Australia.
Lumsdon, D. G., J. C. L. Meeussen, E. Paterson, L. M. Garden, and P. Anderson. 2001. “Use ofSoil Phase Characterisation and Chemical Modelling for Assessing the Behavior of Arsenic inContaminated Soils.” Applied Geochemistry, 16:571-581.
Maiti, T. C., M. R. Smith, and J. C. Laul. 1989. “Sorption of Uranium, Thorium, and Radium onMatrices Under Oxic Environments.” Radioactive Waste Management and the Nuclear Fuel Cycle,11:269-278.
Manning, B. A., and S. Goldberg. 1997a. “Adsorption and Stability of Arsenic(III) at the ClayMineral-Water Interface.” Environmental Science & Technology, 31:2005-2011.
Manning, B. A., and S. Goldberg. 1997b. “Arsenic(III) and Arsenic(V) Adsorption on ThreeCalifornia Soils.” Soil Science, 162:886-895.

6.16
Manning, B. A., S. E. Fendorf, and S. Goldberg. 1998. “Surface Structures and Stability ofArsenic(III) on Goethite: Spectroscopic Evidence for Inner-Sphere Complexes.” EnvironmentalScience and Technology, 32:2383-2388.
Mariner, P. E., F. J. Holzmer, R. E. Jackson, H. W. Meinardus, and F. G. Wolf. 1996. “Effects ofHigh pH on Arsenic Mobility in a Shallow Sandy Aquifer and on Aquifer Permeability along theAdjacent Shoreline, Commencement Bay Superfund Site, Tacoma, Washington.” EnvironmentalScience and Technology, 30:1645-1651.
Marquardt, C., and J. I. Kim. 1996. “Complexation of Np(V) with Humic Acids at Very Low MetalConcentrations.” Radiochimica Acta, 73:119-125.
Marquardt, C., and J. I. Kim. 1998. “Complexation of Np(V) with Humic Acid: Intercomparison ofResults from Different Laboratories.” Radiochimica Acta, 80:129-137.
Martin, P., and R. A. Akber. 1999. “Radium Isotopes as Indicators of Adsorption-DesorptionInteractions and Barite Formation in Groundwater.” Journal of Environmental Radioactivity,46:271-286.
McKinley, G., and A. Scholtis. 1993. “A Comparison of Radionuclide Sorption Databases Used inRecent Performance Assessments.” Journal of Contaminant Hydrology, 13:347-363.
Means, J. L., D. A. Crerar, M. P. Borcsik, and J. O. Duguid. 1978. “Adsorption of Co and SelectedActinides by Mn and Fe Oxides in Soils and Sediments.” Geochimica et Cosmochimica Acta,42:1763-1773.
Meier, H., E. Zimmerhacki, G. Zeitler, and P. Menge. 1994. “Parameter Studies of RadionuclideSorption in Site-Specific Sediment/Groundwater Systems.” Radiochimica Acta, 66/67:277-284.
Meybeck, M. 1982. “Carbon, Nitrogen, and Phosphorous Transport by World Rivers.” AmericanJournal of Science, 282:401-450.
Meyer, R. E., W. D. Arnold, F. I. Case, and G. D. O'Kelley. 1991b. “Solubilities of Tc(IV) Oxides.” Radiochimica Acta 55:11-18.
Meyer, R. E., W. D. Arnold, and F. I. Case. 1984. Valence Effects on the Adsorption of Nuclides on Rocksand Minerals. NUREG/CR-3389 (ORNL-5978), prepared for the U.S. Nuclear RegulatoryCommission by Oak Ridge National Laboratory, Oak Ridge, Tennessee.
Meyer, R. E., W. D. Arnold, and F. I. Case. 1985a. Valence Effects on the Adsorption of Nuclides on Rocksand Minerals II. NUREG/CR-4114, prepared for the U.S. Nuclear Regulatory Commission byOak Ridge National Laboratory, Oak Ridge, Tennessee.
Meyer, R. E., W. D. Arnold, and F. I. Case. 1985b. Valence Effects on the Solubility and Sorption. The
Solubility of the Tc(IV) Oxides. ORNL-6199, Oak Ridge National Laboratory, Oak Ridge,Tennessee.

6.17
Meyer, R. E., W. D. Arnold, F. Case, S. Y. Shiao, D. A. Palmer. 1983. Valence Effects on Adsorption. A Preliminary Assessment of the Effects of Valence State Control on Sorption Measurements. NUREG/CR-2863 (ORNL-5905), prepared for the U.S. Nuclear Regulatory Commission byOak Ridge National Laboratory, Oak Ridge, Tennessee.
Meyer, R. E., W. D. Arnold, A. D. Kelmers, J. H. Kessler, R. J. Clark, J. S. Johnson, Jr.,G. C. Young, F. I. Case, and C. G. Westmorleand. 1985b. “Technetium and NeptuniumReactions in Basalt/Groundwater Systems.” In Scientific Basis for Nuclear Waste Management VIII,C. M. Jantzen, J. A. Stone, and R. C. Ewing (eds.), pp. 332-342, Materials Research SocietySymposium Proceedings, Volume 44, Materials Research Society, Pittsburgh, Pennsylvania.
Michel, J. 1990. “Relationship of Radium and Radon with Geological Formations.” In Radon,Radium and Uranium in Drinking Water, C. R. Cothern and P. A. Rebers (eds.), Chapter 7,pp. 83-95, Lewis Publishers, Chelsea, Michigan.
Mok, W-M., and C. M. Wai. 1990. “Distribution and Mobilization of Arsenic and AntimonySpecies in the Coeur D’Alene River, Idaho.” Environmental Science and Technology, 24:102-108.
Molinari, J., and W. J. Snodgrass. 1990. “The Chemistry and Radiochemistry of Radium and theOther Elements of the Uranium and Thorium Natural Decay Series.” In The EnvironmentalBehavior of Radium, Volume 1, pp. 11-56, International Atomic Energy Agency, Vienna, Austria.
Moulin, V., P. Robouch, P. Vitorge, and B. Allard. 1988. “Environmental Behavior ofAmericium(III) in Natural Waters.” Radiochimica Acta, 44/45:33-37.
Moulin, V., J. Tits, and G. Ouzounian. 1992. “Actinide Speciation in the Presence of HumicSubstances in Natural Water Conditions.” Radiochimica Acta, 58/59:179-190.
Muramatsu, Y., S. Uchida, P. Sriyotha, and K. Sriyotha. 1990. “Some Considerations on theSorption and Desorption Phenomena of Iodide and Iodate on Soil.” Water, Air, and SoilPollution, 49:125-138.
Music, S., and M. Ristic. 1988. “Adsorption of Trace-Elements or Radionuclides on Hydrous Iron-Oxides. Journal of Radioanalytical and Nuclear Chemistry-Articles, 120:289-304.
Myneni, S. C. B., S. J. Traina, T. J. Logan, and G. A. Waychunas. 1997. “Oxyanion Behavior inAlkaline Environments: Sorption and desorption of Arsenate in Ettringite.” Environmental Scienceand Technology, 31:1761-1768.
Nagasaki, S., and S. Tanaka. 2000. “Sorption Equilibrium and Kinetics of NpO2+ on Dispersed
Particles of Na-Montmorillonite.” Radiochimica Acta, 88:705-709.
Nagasaki, S., S. Tanaka, and A. Suzuki. 1994. “Colloid Formation and Sorption of Americium inthe Water/Bentonite System.” Radiochimica Acta, 66/67:207-212.
Nagasaki, S., S. Tanaka, M. Todoriki, and A. Suzuki. 1998. “Sorption Equilibrium and Kinetics ofNpO2
+ Uptake onto Illite.” Radiochimica Acta, 82, 263-267.
6.18
Nakayama, S., and D. M. Nelson. 1988. “Comparison of Distribution Coefficients for Americiumand Curium - Effects of pH and Naturally-Occurring Colloids.” Journal of EnvironmentalRadioactivity, 8:173-181.
Nakayama, S., and Y. Sakamoto. 1991. “Sorption of Neptunium on Naturally-Occurring Iron-Containing Minerals.” Radiochimica Acta, 52/53:153-157.
Nakayama, S., T. Yamaguchi, and K. Sekine. 1996. “Solubility of Neptunium(IV) Hydrous Oxidein Aqueous Solutions.” Radiochimica Acta, 74:15-19.
Nakayama, S., H. Arimoto, N. Yamada, H. Moriyama, and K. Higashi. 1988. “ColumnExperiments on Migration Behavior of Neptunium(V).” Radiochimica Acta, 44/45:179-182.
Nakata, K., S. Nagasaki, S. Tanaka, Y. Sakamoto, T. Tanaka, and H. Ogawa. 2000. “Sorption andDesorption Kinetics of Np(V) on Magnetite and Hematite.” Radiochimica Acta, 88:453-457.
Nathwani, J. S., and C. R. Phillips. 1979a. “Adsorption of 226Ra by Soils (I).” Chemosphere, 5:285-291.
Nathwani, J. S., and C. R. Phillips. 1979b. “Adsorption of 226Ra by Soils in the Presence of Ca2+
Ions.” Specific Adsorption (II). Chemosphere, 5:293-299.
Neck, V., Th. Fanghänel, and J. I. Kim. 1997. “Mixed Hydroxo-Carbonate Complexes ofNeptunium(V).” Radiochimica Acta, 77:167-175.
Neck, V., W. Runde, J. I. Kim, and B. Kandellakopulos. 1994. “Solid-Liquid Equilibrium Reactionsof Neptunium(V) in Carbonate Solution at Different Ionic Strength.” Radiochimica Acta,65:29-37.
Nickson, R. T., J. M. McArthur, P. Ravenscroft, W. G. Burgess, and K. M. Ahmed. 2000. “Mechanism of Arsenic Release to Groundwater, Bangladesh and West Bengal.” AppliedGeochemistry, 15:403-413.
Nishita, H., A. Wallace, E. M. Romney, and R. K. Schulz. 1981. “Effect of Soil Type on theExtractability of Np-237, Pu-239, Am-241, and CM-244 as a Function of pH.” Soil Science,132:25-34.
Novak, C. F., and K. E. Roberts. 1995. “Thermodynamic Modeling of Neptunium(V) Solubility inConcentrated Na-CO3-HCO3-Cl-ClO4-H-OH-H2O Systems.” In Scientific Basis for Nuclear WasteManagement XVIII, T. Murakami and R. C. Ewing (eds.), pp. 1119-1128, Materials ResearchSociety Symposium Proceedings, Volume 353, Materials Research Society, Pittsburgh,Pennsylvania.

6.19
Onishi, Y., R. J. Serne, E. M. Arnold, and C. E. Cowan, and F. L. Thompson. 1981. Critical Review:Radionuclide Transport, Sediment Transport, and Water Quality Mathematical Modeling; and RadionuclideAdsorption/Desorption Mechanisms. NUREG/CR-1322 (PNL-2901). prepared for the U.S. NuclearRegulatory Commission, Washington, D.C. by Pacific Northwest Laboratory, Richland,Washington.
O’Reilly, S. E., D. G. Strawn, and D. L. Sparks. 2001. “Residence Time Effects on ArsenateAdsorption/desorption Mechanisms on Goethite.” Soil Science Society of America Journal, 65:67-77.
Palmer, D. A., and R. E. Meyer. 1981. “Adsorption of Technetium on Selected InorganicIon-Exchange Materials and on a Range of Naturally Occurring Minerals Under OxicConditions.” Journal of Inorganic and Nuclear Chemistry, 43:2979-2984.
Panak, P., R. Klenze, and J. I. Kim. 1996. “A Study of Ternary Complexes of Cm(III) with HumicAcid and Hydroxide or Carbonate in Neutral pH Range by Time-Resolved Laser FluorescenceSpectroscopy.” Radiochimica Acta, 74:141-146.
Pardue, J. H., and T. Z. Guo. 1998. “Biochemistry of 226Ra in Contaminated Bottom Sediments andOilfield Waste Pits. Journal of Environmental Radioactivity, 39:239-253.
Paviet, P. Th. Fanghänel, R. Klenze, and J. I. Kim. 1996. “Thermodynamics of Curium(III) inConcentration Electrolyte Solutions: Formation of Sulfate Complexes in NaCl/Na2SO4Solutions.” Radiochimica Acta, 74:99-103.
Penrose, W. R., W. L. Polzer, E. H. Essington, D. M. Nelson, and K. A. Orlandini. 1990. “Mobilityof Plutonium and Americium through a Shallow Aquifer in a Semiarid Region.” EnvironmentalScience and Technology, 24:228-234.
Pierce, M., and C. B. Moore. 1980. “Adsorption of Arsenite on Amorphous Iron Hydroxide fromDilute Aqueous Solution.” Environmental Science and Technology, 14:214-216.
Pierce, M. L., and C. B. Moore. 1982. “Adsorption of Arsenite and Arsenate on Amorphous IronHydroxide.” Water Research, 16:1247-1253.
Postma, D. 1990. “Kinetics of Nitrate Reduction by Detrital Fe(II)-Silicates.” Geochimica etCosmochimica Acta, 54:903-908.
Pratopo, M. I., T. Yamaguchi, H. Moriyama, and K. Higashi. 1991. “Adsorption of Np(IV) onQuartz in Carbonate Solutions.” Radiochimica Acta, 55:209-213.
Puls, R. W., L. L. Ames, and J. E. McGarrah. 1987. Sorption and Desorption of Uranium, Selenium, andRadium in a Basalt Geochemical Environment. WHC-SA-0003-FP, Westinghouse Hanford Company,Richland, Washington.
Rädlinger, G. and K. G. Heumann. 2000. “Transformation of Iodide in Natural and WastewaterSystems by Fixation on Humic Substances.” Environmental Science and Technology, 34:3932-3936.

6.20
Rai, D., and J. L. Ryan. 1985. “Neptunium(IV) Hydrous Oxide Solubility Under Reducing andCarbonate Conditions.” Inorganic Chemistry, 24:247-251.
Rai, D., J. L. Swanson, and J. L. Ryan. 1987. “Solubility of NpO2AxH2O(am) in the Presence ofCu(I)/Cu(II) Redox Buffer.” Radiochimica Acta, 42:35-41.
Rai, D., C. C. Ainsworth, L. E. Eary, S. V. Mattigod, and D. R. Jackson. 1987. Inorganic and OrganicConstituents in Fossil Fuel Combustion Residues. Volume 1: A Critical Review. EA-5176, Volume 1,Electric Power Research Institute, Palo Alto, California.
Rai, D., N. J. Hess, A. R. Felmy, D. A. Moore, and M. Yui. 1999. “A Thermodynamic Model forthe Solubility of NpO2(am) in the Aqueous K+-HCO3
--CO32–-OH–-H2O System.” Radiochimica
Acta, 84:159-169.
Rai, D., J. M. Zachara, A. P. Schwab, R. L. Schmidt, D. C. Girvin, and J. E. Rogers. 1984. ChemicalAttenuation Rates, Coefficients, and Constants in Leachate Migration. Volume 1: A Critical Review. EA-3356, Electric Power Research Institute, Palo Alto, California.
Rançon, D. 1988. “Comparative Study of Radioactive Iodine Behavior in Soils Under VariousExperimental and Natural Conditions.” Radiochimica Acta, 44/45:187-193.
Randall, S. R., D. M. Sherman, and K. V. Ragnarsdottir. 2001. “Sorption of As(V) on Green Rust(Fe4(II)Fe2(III)(OH)12SO4@3H2O) and Lepidocrocite ((-FeOOH): Surface Complexes fromEXAFS Spectroscopy.” Geochimica et Cosmochimica Acta, 65:1015-1023.
Rao, L., and G. R. Choppin. 1995. “Thermodynamic Rançon, D. 1988. “Comparative Study ofRadioactive Iodine Behavior in Soils Under Various Experimental and Natural Conditions.” Radiochimica Acta, 44/45:187-193. Study of the Complexation of Neptunium(V) with HumicAcids.” Radiochimica Acta, 69:87-95.
Rard, J. A., M. H. Rand, G. Anderegg, and H. Wanner (M. C. A. Sandino and E. Östhols, eds.). 1999. Chemical Thermodynamics 3: Chemical Thermodynamics of Technetium. North-Holland, ElsevierScience Publishing Company, Inc., New York, New York.
Raven, K. P., A. Jain, and R. H. Loeppert. 1998. “Arsenite and Arsenate Adsorption onFerrihydrite: Kinetics, Equilibrium, and Adsorption Envelopes.” Environmental Science andTechnology, 32:344-349.
Relyea, J. F., and W. J. Martin. 1982. Adsorption of Np-237 and Ra-228 on Kaolinite. PNL-4426,Pacific Northwest Laboratory, Richland, Washington.
Reynolds, J. G., D. V. Naylor, and S. E. Fendorf. 1999. “Arsenic Sorption in Phosphate-AmendedSoils During Flooding and Subsequent Aeration.” Soil Science Society of America Journal,63:1149-1156.
Riese, A. C. 1982. Adsorption of Radium and Thorium onto Quartz and Kaolinite: A Comparison ofSolution/Surface Equilibria Models. Ph.D. Thesis, Colorado School of Mines, Golden, Colorado.
6.21
Rochette, E. A., G. C. Li, and S. E. Fendorf. 1998. “Stability of Arsenate Minerals in Soil UnderBiotically Generated Reducing Conditions.” Soil Science Society of America Journal, 62:1530-1537.
Roberts, K. E., H. B. Silber, P. C. Torretto, T. Prussin, K. Becraft, D. E. Hobart, and C. F. Novak. 1996. “The Experimental Determination of the Solubility Product for NpO2OH in NaClSolutions.” Radiochimica Acta, 74:27-30.
Routson, R. C., G. Jansen, and A. V. Robinson. 1977. “Am-241, 237Np, and 99Tc Sorption on TwoUnited States Subsoils from Differing Weathering Intensity Areas.” Health Physics, 33:311-317.
Routson, R. C., G. Jansen, and A. V. Robinson. 1975. Sorption of 99Tc, 237Np and Am-241 on TwoSubsoils From Differing Weathering Intensity Areas. BNWL-1889, Pacific Northwest Laboratories,Richland, Washington.
Runde W., M. P. Neu, and D. L. Clark. 1996. “Neptunium(V) Hydrolysis and CarbonateComplexation: Experimental and Predicted Neptunyl Solubility in Concentrated NaCl Using thePitzer Approach.” Geochimica et Cosmochimica Acta, 60:2065-2073.
Sadiq, M. 1997. “Arsenic Chemistry in Soils: An Overview of Thermodynamic Predictions andField Observations.” Water, Air, and Soil Pollution, 93:117-136.
Sadiq, M., and W. L. Lindsay. 1981. Arsenic Supplement to Technical Bulletin 134: Selection of StandardFree Energies of Formation for Use in Soil Chemistry. Technical Bulletin 134 (Supplement), ColoradoState University Experiment Station, Fort Collins, Colorado.
Sakamoto, Y., S. Nagao, H. Ogawa, and R. R. Rao. 2000. “The Migration Behavior of Np(V) inSandy Soil and Granite Media in the Presence of Humic Substances.” Radiochimica Acta,88:651-656.
Salter, P. F., L. L. Ames, and J. E. McGarrah. 1981a. Sorption Behavior of Selected Radionuclides onColumbia River Basalts. RHO-BWI-LD-48, Rockwell International Corporation, Richland,Washington.
Salter, P. F., L. L. Ames, and J. E. McGarrah. 1981b. Sorption Behavior of Selected Radionuclides onSecondary Minerals Associated with Columbia River Basalts. RHO-BWI-LD-43, Rockwell InternationalCorporation, Richland, Washington.
Samadfam, M., T. Jintoku, S. Sato, H. Ohashi, T. Mitsugashira, M. Hara, and Y. Suzuki. 2000. “Effects of Humic Acid on the Sorption of Am(III) and Cm(III) on Kaolinite.” RadiochimicaActa, 88:717-721.
Sanchez, A. L., W. R. Schell, and T. H. Sibley. 1982. “Distribution Coefficients for Plutonium andAmericium on Particulates in Aquatic Environments.” In Environmental Migration of Long-LivedRadionuclides, pp. 189-203, Proceedings Series IAEA-SM-257, International Atomic EnergyAgency, Vienna, Austria.
Sanders, J. G. 1980. “Arsenic Cycling in Marine Systems.” Marine Environmental Research, 3:257-266.

6.22
Sazarashi, M., Y. Ikeda, R. Seki, and H. Yoshikawa. 1994. “Adsorption of I- Ion on Minerals for 129IWaste Management.” Journal of Nuclear Science and Technology, 31:620-622.
Sazarashi, M., Y. Ikeda, R. Seki, H. Yoshikawa, and Y. Takashima. 1995. “Adsorption Behavior ofI- Ions on Minerals for Geologic Disposal of 129I.” In Scientific Basis for Nuclear Waste ManagementXVIII, T. Murakami and R. C. Ewing (eds.), pp. 1037-1043, Materials Research SocietySymposium Proceedings, Volume 353, Materials Research Society, Pittsburgh, Pennsylvania.
Schreiber, M. E., J. A. Simo, and P. G. Freiberg. 2000. “Stratigraphic and Geochemical Controls onNaturally Occurring Arsenic in Groundwater, Eastern Wisconsin, USA.” Hydrogeology Journal,8:161-176.
Serne, R. J. 1974. Waste Isolation Safety Assessment Program Task 4. Contractor Information MeetingProceedings. PNL-SA-6957, Pacific Northwest Laboratory, Richland, Washington.
Serne, R. J., J. L. Conca, V. L. LeGore, K. J. Cantrell, C. W. Lindenmeier, J. A. Campbell,J. E. Amonette, and M. I. Wood. 1993. Solid Waste Leach Characteristics and Contaminant-SedimentInteractions. Volume 1: Batch Leach and Adsorption Tests and Sediment Characterization. PNL-8889,Volume 1, Pacific Northwest Laboratory, Richland, Washington.
Sheppard, J. C., M. J. Campbell, J. A. Kittrick, and T. L. Hardt. 1979. “Retention of Neptunium,Americium, and Curium by Diffusible Soil Particles.” Environmental Science and Technology,13:680-684.
Sheppard, M. I., and J. L. Hawkins. 1995. “Iodine and Microbial Interactions in an Organic Soil.” Journal of Environmental Radioactivity, 29:91-109.
Sheppard, M. I., and D. H. Thibault. 1988. “Migration of Technetium, Iodine, Neptunium, andUranium in the Peat of Two Minerotrophic Mires.” Journal of Environmental Quality, 17:644-653.
Sheppard, M. I., and D. H. Thibault. 1990. “Default Soil Solid/Liquid Partition Coefficients, Kds,for Four Major Soil Types: A Compendium.” Health Physics, 59(4):471-482.
Sheppard, M. I., and D. H. Thibault. 1992. “Chemical Behavior of Iodine in Organic and MineralSoils.” Applied Geochemistry, 7:265-272.
Sheppard, M. I., D. H. Thibault, J. McMurry, and P. A. Smith. 1995. “Factors Affecting the SoilSorption of Iodine.” Water, Air, and Soil Pollution, 83:51-67.
Sheppard, S. C., M. I. Sheppard, and W.G. Evenden. 1990. “A Novel Method Used to ExamineVariation in Tc Sorption Among 34 Soils, Aerated and Anoxic.” Journal of EnvironmentalRadioactivity, 11:215-233.
Shin, H. S., B. H. Lee, J. G. Choi, and H. Moon. 1995. “Complexation of Soil Humic Acid withTrivalent Curium and Europium Ions: A Comparative Study.” Radiochimica Acta, 69:185-189.
6.23
Sibley, T. H., E. A. Wurtz, and J. J. Alberts. 1986. “Partition-Coefficients for Cm-244 on Fresh-Water and Estuarine Sediments.” Journal of Environmental Radioactivity, 3:203-217.
Silva, R. J. 1984. “The Behavior of Americium in Aqueous Carbonate Systems.” In Scientific Basisfor Nuclear Waste Management VII, G. L. McVay (ed.), pp. 875-881, Materials Research SocietySymposium Proceedings, Volume 26, North-Holland, New York, New York.
Silva, R. J., and H. Nitsche. 1995. “Actinide Environmental Chemistry.” Radiochimica Acta,70/71:377-396.
Silva, R. J., L. V. Benson, and J. A. Apps. 1979. “Studies of Actinide Sorption on Selected GeologicMaterials.” In Radioactive Waste in Geologic Storage, ed . S. Fried, pp. 215-240, ACS SymposiumSeries 100, American Chemical Society, Washington, D.C.
Silva, R. J., G. Bidoglio, M. H. Rand, P. B. Robouch, H. Wanner, and I. Puigdomenech. 1995. Chemical Thermodynamics 2: Chemical Thermodynamics of Americium. North-Holland, Elsevier SciencePublishing Company, Inc., New York, New York.
Skogerboe, R. K., and S. A. Wilson. 1981. “Reduction of Ionic Species by Fulvic Acid.” AnalyticalChemistry, 53:228-232.
Sparks, S. T., and S. E. Long. 1987. The Chemical Speciation of Technetium in the Environment: ALiterature Study. DOE/RW 88.098 (UKAEA/DOE Radiological Protection ResearchProgramme Letter AERE-R 12743), Harwell Laboratory, Oxfordshire, England.
Sposito, G. 1989. The Chemistry of Soils. Oxford University Press, New York, New York.
Strickert, R., A. M. Friedman, and S. Fried. 1980. “The Sorption of Technetium and IodineRadioisotopes by Various Minerals.” Nuclear Technology, 49:253.
Sturchio, N. C., J. L. Banner, C. M. Binz, L. B. Heraty, and M. Musgrove. 2001. “RadiumGeochemistry of Ground Waters in Paleozoic Carbonate Aquifers, Midcontinent, USA.” Applied Geochemistry, 16:109-122.
Su, C., and R. W. Puls. 2001. “Arsenate and Arsenite Removal by Zerovalent Iron: Kinetics,Redox Transformation, and Implications for In Situ Groundwater Remediation.” EnvironmentalScience and Technology, 1487-1492.
Sun, X., and H. E. Doner. 1998. “Adsorption and Oxidation of Arsenite on Goethite.” Soil Science,63:278-287.
Susak, N. J., A. Friedman, S. Fried, and J. C. Sullivan. 1983. “The Reduction of Neptunium(VI) byBasalt and Olivine.” Nuclear Technology, 63:266-270.
Tachi, Y., T. Shibutani, H. Sato, and M. Yui. 2001. “Experimental and Modeling Studies onSorption and Diffusion of Radium in Bentonite.” Journal of Contaminant Hydrology, 47:171-186.

6.24
Takahashi, Y., Y. Minai, S. Ambe, Y. Makide, and F. Ambe. 1999. “Comparison of AdsorptionBehavior of Multiple Inorganic Ions on Kaolinite and Silica in the Presence of Humic AcidUsing the Multitracer Technique.” Geochimica et Cosmochimica, 63:815-836.
Tanaka, S., M. Yamawaki, S. Nagasaki, and H. Moriyama. 1992. “Geochemical Behavior ofNeptunium.” Journal of Nuclear Science and Technology, 29:706-718.
Tempel, R. N., L. A. Shevenell, P. Lechler, and J. Price. 2000. “Geochemical Modeling Approachto Predicting Arsenic Concentrations in a Mine Pit Lake.” Applied Geochemistry, 15:475-492.
Thibault, D. H., M. I. Sheppard, and P. A. Smith. 1990. A Critical Compilation and Review of DefaultSoil Solid/Liquid Partition Coefficients, Kd, for Use in Environmental Assessments. AECL-10125,Whiteshell Nuclear Research Establishment, Atomic Energy of Canada Limited, Pinawa,Canada.
Thompson, R. C. 1982. “Neptunium - The Neglected Actinide: A Review of the Biological andEnvironmental Literature.” Radiation Research, 90:1-32.
Ticknor, K. V. 1993. “Actinide Sorption by Fracture-Infilling Minerals.” Radiochimica Acta,60:33-42.
Ticknor, K. V., and Y. -H. Cho. 1990. “Interaction of Iodide and Iodate with Granitic Fracture-Filling Minerals.” Journal of Radioanalytical and Nuclear Chemistry, 140:75-90.
Ticknor, K. V., P. Vilks, and T. T. Vandergraaf. 1996. “The Effect of Fulvic Acid on the Sorptionof Actinides and Fission Products on Granite and Selected Minerals.” Applied Geochemistry,11:555-565.
Tochiyama, O., S. Endo, and Y. Inoue. 1995. “Sorption of Neptunium(V) on Various Iron Oxidesand Hydrous Iron Oxides.” Radiochimica Acta, 68:105-111.
Torstenfelt, B., R. S. Rundberg, and A. J. Mitchell. 1988. “Actinide Sorption on Granites andMinerals as a Function of pH and Colloids/Pseudocolloids.” Radiochimica Acta, 44/45:111-117.
Triay, I. R., A. Meijer, M. R. Cisneros, G. G. Miller, A. J. Mitchell, M. A. Ott, D. E. Hobart,P. D. Palmer, R. E. Perrin, and R. D. Aguilar. 1991. “Sorption of Americium in Tuff and PureMinerals Using Synthetic and natural Groundwater.” Radiochimica Acta, 52/53:141-145.
Tuli, J. K. 2000. Nuclear Wallet Card. Sixth Edition, National Nuclear Data Center, BrookhavenNational Laboratory, Upton, New York. (http://www.nndc.bnl.gov/wallet/)
USDA (U.S. Department of Agriculture). 1938. Soils and Men. U.S. Department of Agriculture,Washington, D.C.
6.25
Vandergraaf, T. T., K. V. Ticknor, and I. M. George. 1984. “Reactions between Technetium inSolution and Iron-Containing Minerals Under Oxic and Anoxic Conditions.” In GeochemicalBehavior of Disposed Radioactive Waste, G. S. Barney, J. D. Navratil, and W. W. Schulz (eds.), pp. 25-43. ACS Symposium Series 246, American Chemical Society, Washington, D.C.
Vitorge, P. 1992. “Am(OH)3(s), AmOHCO3(s), Am2(CO3)3(s) Stabilities in EnvironmentalConditions.” Radiochimica Acta, 58/59:105-107.
Voigt, D. E., and S. L. Brantley. 1996. “Chemical Fixation of Arsenic in Contaminated Soils.” Applied Geochemistry, 11:633-643.
Vovk, I. F. 1988. “Radiolysis as a Factor Influencing Migration Behavior of Iodine in theGeosphere.” Radiochimica Acta, 44/45:195-199.
Walton, F. B., J. Paquette, J. P. M. Ross, and W. E. Lawrence. 1986. “Tc(IV) and Tc(VII)Interactions with Iron Oxyhydroxides.” Nuclear and Chemical Waste Management, 6:121-126.
Wagman, D. D., W. H. Evans, V. B. Parker, R. H. Shumm, I. Halow, S. M. Bailey, K. L. Churney,and R. L. Nuttall. 1982. “The NBS Tables of Chemical Thermodynamic Properties. SelectedValues for Inorganic and C1 and C2 Organic Substances in SI Units.” Journal of Physical andChemical Reference Data 11(Supplement No. 2):1-392
Wauchope, R. D. 1975. “Fixation of Arsenical Herbicides, Phosphate, and Arsenate in AlluvialSoils.” Journal of Environmental Quality, 4:355-358.
Wauchope, R. D., and L. L. McDowell. 1984. “Adsorption of Phosphate, Arsenate,Methanearsonate, and Cacodylate by Lake and Steam Sediments: Comparison with Soils.” Journal of Environmental Quality, 13:499-504.
Waychunas, G. A., B. A. Rea, C. C. Fuller, and J. A. Davis. 1993. “Surface Chemistry ofFerrihydrite: Part 1. EXAFS Studies of the Geometry of Coprecipitate and AdsorbedAresnate.” Geochimica et Cosmochimica, 57:2251-2269.
Wharton, M. J., B. Atkins, J. M. Charnock, F. R. Livens, R. A. D. Pattrick, and D. Colison. 2000. “An X-ray Absorption Spectroscopy Study of the Coprecipitation of Tc and Re withMackinawite (FeS).” Applied Geochemistry, 15:347-354.
White, A. F. 1990. “Heterogeneous Electrochemical Reactions Associated with Oxidation ofFerrous Oxide and Silicate Surfaces.” In Reviews in Mineralogy, Volume 23, Mineral-Water InterfaceGeochemistry, eds. M. F. Hochella, Jr., and A. F. White, pp. 467-509, Mineralogical Society ofAmerica, Washington, D. C.
White, A. F., and M. L. Peterson. 1996. “Reduction of Aqueous Transition Metal Species on theSurfaces of Fe(II)-Containing Oxides.” Geochimica et Cosmochimica Acta, 60:3799-814.

6.26
White, A. F., and A. Yee. 1985. “Aqueous Oxidation-Reduction Kinetics Associated with CoupledElectron-Cation Transfer from Iron Containing Silicates at 25/C.” Geochimica et CosmochimicaActa, 49:1263-1275.
White, A. F., M. L. Peterson, and M. F. Hochella, Jr. 1994. “Electrochemistry and DissolutionKinetics of Magnetite and Ilmenite.” Geochimica et Cosmochimica Acta, 58:1859-1875.
Whitehead, D. C. 1973. “Studies on Iodine in British Soils.” Journal of Soil Science, 24:260-270.
Whitehead, D. C. 1974. “The Influence of Organic Matter, Chalk, and Sesquioxides on theSolubility of Iodide, Element Iodine, and Iodate Incubated With Soil.” Journal of Soil Science,25:461-470.
Whitehead, D. C. 1978. “Iodine in Soil Profiles in Relation to Iron and Aluminum Oxides andOrganic Matter.” Journal of Soil Science, 29:88-94.
Whitehead, D. C. 1984. “The Distribution and Transformation of Iodine in the Environment.” Environment International, 10:321-339.
WHO (World Health Organization). 1999. Arsenic in Drinking Water. WHO Fact Sheet No. 210(February 1991). Available at: http:/www.who.int/inf-fs/en/fact210.html
Wildung, R. E., K. M. McFadden, and T. R. Garland. 1979. “Technetium Sources and Behavior inthe Environment.” Journal of Environmental Quality, 8:156-161.
Wildung, R. E., T. R. Garland, K. M. McFadden, and C. E. Cowan. 1984. “Technetium Sorption inSurface Soils.” In Technetium in the Environment, G. Desmet and C. Myttenaere (ed.), pp. 115-129,Elsevier Applied Science Publishers, London, England.
Wildung, R. E., Y. A. Gorby, K. M. Krupka , N. J. Hess, S. W. Li, A. E. Plymale, J. P. McKinley,and J. K. Fredrickson. 2000. “Effect of Electron Donor and Solution Chemistry on theProducts of the Dissimilatory Reduction of Technetium by Shewanella putrefaciens.” Applied andEnvironmental Microbiology, 66:2452-2460.
Wildung, R. E., R. C. Routson, R. J. Serne, and T. R. Garland. 1974. “Pertechnetate, Iodide andMethyl Iodide Retention by Surface Soils.” In Pacific Northwest Laboratory Annual Report for 1974 tothe USAEC Division of Biomedical and Environmental Research. Part 2. Ecological Sciences,B. E. Vaughan (Manager), pp. 37-40, BNWL-1950 PT2, Pacific Northwest Laboratories,Richland, Washington.
Wilkie, J. A., and J. G. Hering. 1996. “Adsorption of Arsenic onto Hydrous Ferric Oxide: Effectsof Adsorbate/Adsorbent Ratios and Co-Occurring Solutes.” Colloids and Surfaces. A: Physicochemical and Engineering Aspects, 107:97-110.
Willett, I. R., and W. J. Bond. 1995. “Sorption of Manganese, Uranium, and Radium by HighlyWeathered Soils.” Journal of Environmental Quality, 834-845.
6.27
Wimmer, H., J. I. Kim, and R. Klenze. 1992. “A Direct Speciation of Cm(III) in Natural AquaticSystems by Time-Resolved Laser-Induced Fluorescence Spectroscopy (TRLFS).” RadiochimicaActa, 58/59:165-171.
Winkler, A., H. Brühl, Ch. Trapp, and W. D. Bock. 1988. “Mobility of Technetium in VariousRock and Defined Combinations of Natural Minerals.” Radiochimica Acta, 44/45:183-186.
Woolson, E. A. 1983. “Emissions, Cycling and Effects of Arsenic in soil Ecosystems.” In Biologicaland Environmental Effects of Arsenic, B. A. Fowler, pp. 51-139. Elsevier, New York, New York.
Yariv, S., and H. Cross. 1979. Geochemistry of Colloid Systems. Springer-Verlag, New York, New York.
Yoshida, S., Y. Muramatsu, and S. Uchida. 1998. “Soil-Solution Distribution Coefficients, Kds, of I-
and IO3- for 68 Japanese Soils.” Radiochimica Acta, 82:293-297.
Yu, Z., J. A. Warner, R. A. Dahlgren, and W. H. Casey. 1996. “Reactivity of Iodide in VolcanicSoils and Noncrystalline Soil Constituents.” Geochimica et Cosmochimica, 60:4945-4956.
Zeh, P., J. I. Kim, C. M. Marquardt, and R. Artinger. 1999. “The Reduction of Np(V) inGroundwater Rich in Humic Substances.” Radiochimica Acta, 87:23-28.
Zhang, P-C., J. L. Krumhansl, and P. V. Brady. 2000. “Boehmite Sorbs Perrhenate andPertechnetate.” Radiochimica Acta, 88:369-373.
Zhuang, H. E., J. S. Zheng, D. Y. Xia, and Z. G. Zhu. 1995. “Retardation of Technetium andIodine by Antimony- and Mercury-Containing Minerals.” Radiochimica Acta, 68:245-249.
Zobrist, J., P. R. Dowdle, J. A. Davis, and R. S. Oremland. 2000. “Mobilization of Arsenite byDissimilatory Reduction of Adsorbed Arsenate.” Environmental Science and Technology,34:4747-4753.
APPENDIX A
Acronyms, Abbreviations, Symbols, and Notation
A.2
Appendix A
Acronyms, Abbreviations, Symbols, and Notation
A.1 Acronyms and Abbreviations
AA Atomic absorptionAEC Anion exchange capacity AECL Atomic Energy of Canada LimitedASCII American Standard Code for Information InterchangeASTM American Society for Testing and MaterialsCCM Constant capacitance (adsorption) modelCDTA Trans-1,2-diaminocyclohexane tetra-acetic acidCEAM Center for Exposure Assessment Modeling (at EPA’s Environmental
Research Laboratory in Athens, Georgia)CEC Commission of European CommunitiesCEC Cation exchange capacityDDLM Diffuse double layer (adsorption) modelDIRM Dissimilatory iron-reducing bacteriaDLM Diffuse (double) layer (adsorption) modelDOE U.S. Department of EnergyDTPA Diethylenetriaminepentacetic acid EDTA Ethylenediaminetriacetic acidEDS Energy dispersive spectroscopyEDX Energy dispersive x-ray analysisEPA U.S. Environmental Protection AgencyEXAFS X-ray absorption fine structure spectroscopyGSF Gesellschaft für Strahlen- und Umweltforschung m.b.H., GermanyGTLM Generalized two-layer surface complexation modelHEDTA N-(2-hydroxyethyl) ethylenedinitrilotriacetic acidHFO Hydrous ferric oxideHLW High-level radioactive wasteIAEA International Atomic Energy Agency, Vienna, AustriaICP Inductively coupled plasmaICP/MS Inductively coupled plasma/mass spectroscopyIEP (or iep) Isoelectric pointIR InfraredKBS Swedish Nuclear Safety BoardLANL Los Alamos National LaboratoryLLNL Lawrence Livermore National LaboratoryLLW Low-level radioactive wasteMCL Maximum Contaminant LevelMEPAS Multimedia Environmental Pollutant Assessment SystemMS-DOS® Microsoft® disk operating system (Microsoft and MS-DOS are register
trademarks of Microsoft Corporation.)

NAGRA Nationale Genossenschaft für die Lagerung radioaktiver AbfälleSwiss (National Cooperation for Storage of Radioactive Waste), Switzerland
NEA OECD Nuclear Energy Agency, France NBS U.S. National Bureau of StandardsNIREX United Kingdom Nirex Ltd.NIST U.S. National Institute of Standards and TechnologyNPL Superfund National Priorities ListNRC U.S. Nuclear Regulatory CommissionNRPB National Radiological Protection Board, United KingdomNWWA National Water Well AssociationOECD Organisation for Economic Co-operation and Development, FrancePAGIS Performance Assessment of Geological Isolation Systems, Commission of
the European Communities (CEC), BelgiumPAGIS SAFIR PAGIS Safety Assessment and Feasibility Interim ReportPC Personal computers (operating under the MS-DOS® and Microsoft®
Windows operating systems, Microsoft® Windows is a trademark of Microsoft Corporation.)
PNL Pacific Northwest Laboratory. In 1995, DOE formally changed the name of the Pacific Northwest Laboratory to the Pacific Northwest National Laboratory.
PNNL Pacific Northwest National Laboratory PSE Projekt Sicherheitsstudien Entsorgung, GermanyREE Rare earth element RIVM Rijksinstituut voor Volksgezondheid en Milieuhygience (National Institute of
Public Health and Environment Protection), NetherlandsSCM Surface complexation modelSDMP NRC’s Site Decommissioning Management PlanSEM Scanning electron microscopySKI Statens Kärnkraftinspektion (Swedish Nuclear Power Inspectorate)TDS Total dissolved solidsTLM Triple-layer adsorption modelTOC Total organic carbonTVO Teollisuuden Voima Oy (Industrial Power Company), FinlandUK United Kingdom (UK)UK DoE United Kingdom Department of the EnvironmentUNSCEAR United Nations Scientific Committee on the Effects of Atomic RadiationUSDA U.S. Department of AgricultureWHO World Health OrganizationXANES X-ray absorption near-edge structure spectroscopy

A.2 List of Symbols for the Elements and Corresponding Names
Symbol Element Symbol Element Symbol Element
Ac ActiniumAg SilverAl AluminumAm AmericiumAr ArgonAs ArsenicAt AstatineAu GoldB BoronBa BariumBe BerylliumBi BismuthBk BerkeliumBr BromineC CarbonCa CalciumCd CadmiumCe CeriumCf CaliforniumCl ChlorineCm CuriumCo CobaltCr ChromiumCs CesiumCu CopperDy DysprosiumEr ErbiumEs EinsteiniumEu EuropiumF FluorineFe IronFm FermiumFr FranciumGa Gallium Gd Gadolinium
Ge GermaniumH HydrogenHe HeliumHf HafniumHg MercuryHo HolmiumI IodineIn IndiumIr IridiumK PotassiumKr KryptonLa LanthanumLi LithiumLu LutetiumLr LawrenciumMd MendeleviumMg MagnesiumMn ManganeseMo MolybdenumN NitrogenNa SodiumNb NiobiumNd NeodymiumNe NeonNi NickelNo NobeliumNp NeptuniumO OxygenOs OsmiumP PhosphorusPa ProtactiniumPb LeadPd PalladiumPm PromethiumPo Polonium
Pr PraseodymiumPt PlatinumPu PlutoniumRa RadiumRb RubidiumRe RheniumRh RhodiumRn RadonRu RutheniumS SulfurSb AntimonySc ScandiumSe SeleniumSi SiliconSm SamariumSn TinSr StrontiumTa TantalumTb TerbiumTc TechnetiumTe TelluriumTh ThoriumTi TitaniumTl ThalliumTm ThuliumU UraniumV VanadiumW TungstenXe XenonY YttriumYb YtterbiumZn ZincZr Zirconium
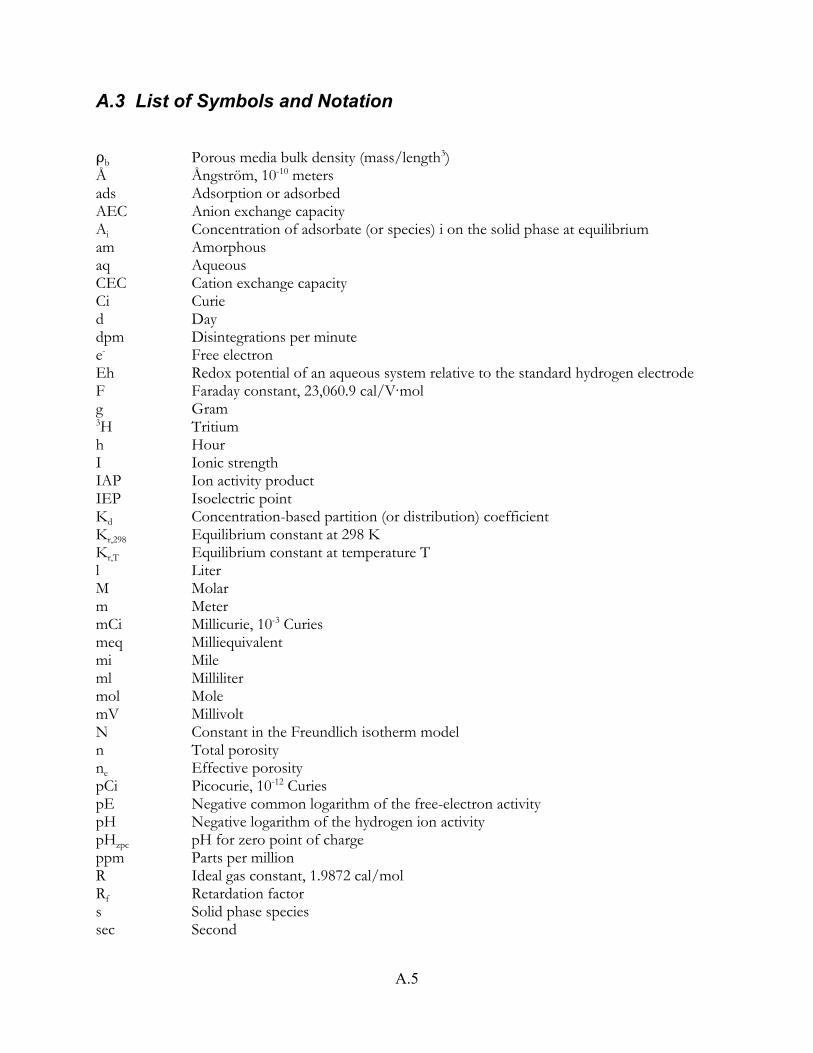
A.5
A.3 List of Symbols and Notation
Db Porous media bulk density (mass/length3)Å Ångström, 10-10 metersads Adsorption or adsorbedAEC Anion exchange capacityAi Concentration of adsorbate (or species) i on the solid phase at equilibriumam Amorphousaq AqueousCEC Cation exchange capacityCi Curied Daydpm Disintegrations per minutee- Free electronEh Redox potential of an aqueous system relative to the standard hydrogen electrodeF Faraday constant, 23,060.9 cal/VAmolg Gram3H Tritiumh HourI Ionic strengthIAP Ion activity productIEP Isoelectric pointKd Concentration-based partition (or distribution) coefficientKr,298 Equilibrium constant at 298 K Kr,T Equilibrium constant at temperature Tl LiterM Molarm MetermCi Millicurie, 10-3 Curiesmeq Milliequivalentmi Mileml Millilitermol MolemV MillivoltN Constant in the Freundlich isotherm modeln Total porosityne Effective porositypCi Picocurie, 10-12 CuriespE Negative common logarithm of the free-electron activitypH Negative logarithm of the hydrogen ion activitypHzpc pH for zero point of chargeppm Parts per millionR Ideal gas constant, 1.9872 cal/mol Rf Retardation factors Solid phase speciessec Second

A.6
SI Saturation index, as defined by log (IAP/Kr,T)T Absolute temperature, usually in Kelvin unless otherwise specifiedt Timet½ Half lifeTDS Total dissolved solidsTU Tritium unit which is equivalent to 1 atom of 3H (tritium) per 1018 atoms
of 1H (protium)vc Velocity of contaminant through a control volumevp Velocity of the water through a control volumey YearZ Valence statez Charge of ion{ } Activity[ ] Concentration

APPENDIX B
Definitions
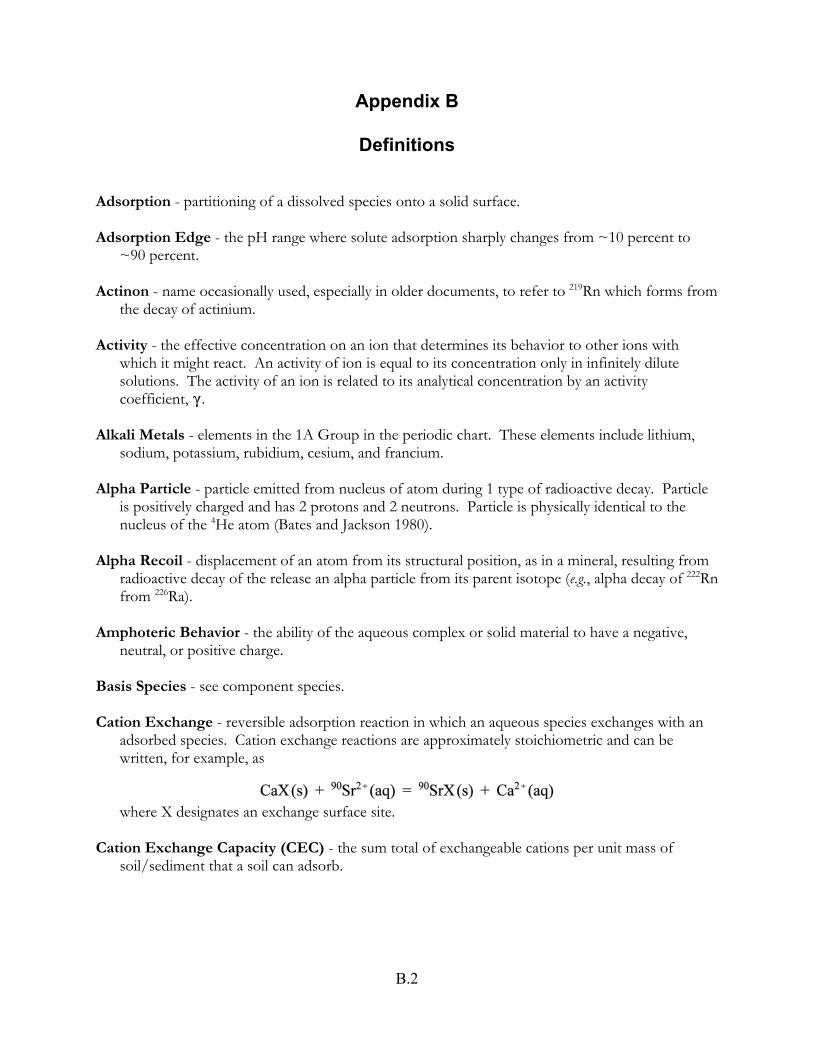
B.2
Appendix B
Definitions
Adsorption - partitioning of a dissolved species onto a solid surface.
Adsorption Edge - the pH range where solute adsorption sharply changes from ~10 percent to~90 percent.
Actinon - name occasionally used, especially in older documents, to refer to 219Rn which forms fromthe decay of actinium.
Activity - the effective concentration on an ion that determines its behavior to other ions withwhich it might react. An activity of ion is equal to its concentration only in infinitely dilutesolutions. The activity of an ion is related to its analytical concentration by an activitycoefficient, (.
Alkali Metals - elements in the 1A Group in the periodic chart. These elements include lithium,sodium, potassium, rubidium, cesium, and francium.
Alpha Particle - particle emitted from nucleus of atom during 1 type of radioactive decay. Particleis positively charged and has 2 protons and 2 neutrons. Particle is physically identical to thenucleus of the 4He atom (Bates and Jackson 1980).
Alpha Recoil - displacement of an atom from its structural position, as in a mineral, resulting fromradioactive decay of the release an alpha particle from its parent isotope (e.g., alpha decay of 222Rnfrom 226Ra).
Amphoteric Behavior - the ability of the aqueous complex or solid material to have a negative,neutral, or positive charge.
Basis Species - see component species.
Cation Exchange - reversible adsorption reaction in which an aqueous species exchanges with anadsorbed species. Cation exchange reactions are approximately stoichiometric and can bewritten, for example, as
where X designates an exchange surface site.
Cation Exchange Capacity (CEC) - the sum total of exchangeable cations per unit mass ofsoil/sediment that a soil can adsorb.
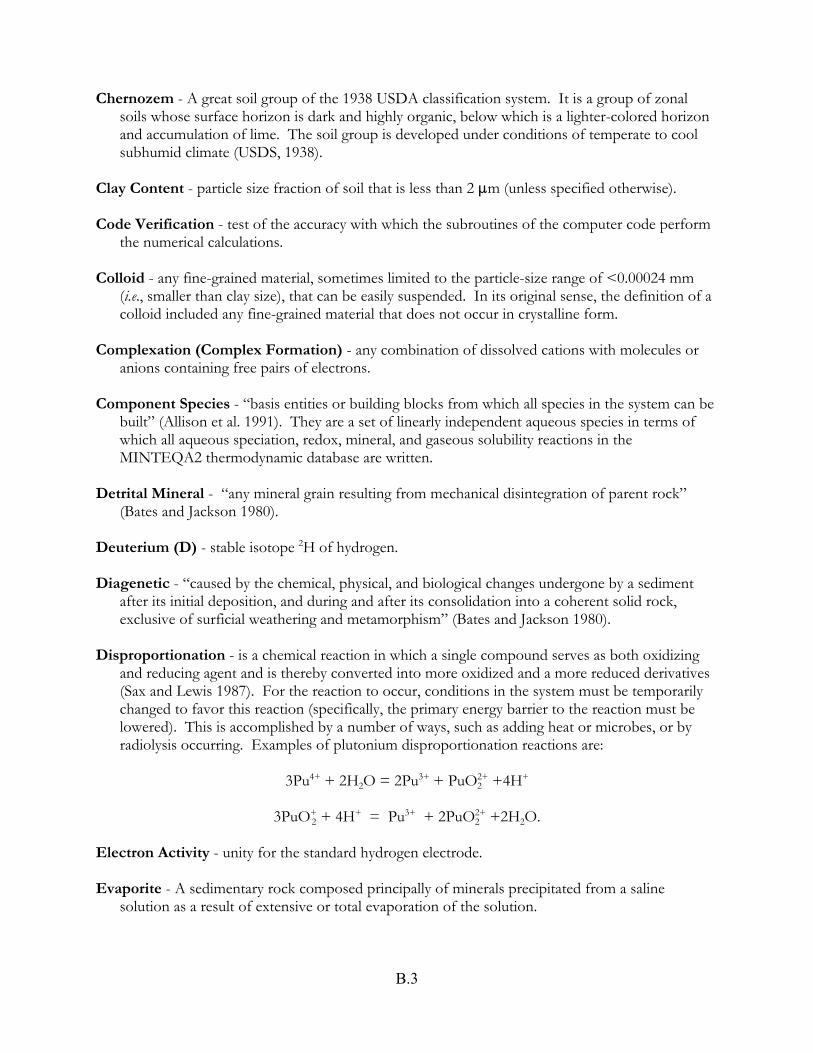
B.3
Chernozem - A great soil group of the 1938 USDA classification system. It is a group of zonalsoils whose surface horizon is dark and highly organic, below which is a lighter-colored horizonand accumulation of lime. The soil group is developed under conditions of temperate to coolsubhumid climate (USDS, 1938).
Clay Content - particle size fraction of soil that is less than 2 :m (unless specified otherwise).
Code Verification - test of the accuracy with which the subroutines of the computer code performthe numerical calculations.
Colloid - any fine-grained material, sometimes limited to the particle-size range of <0.00024 mm(i.e., smaller than clay size), that can be easily suspended. In its original sense, the definition of acolloid included any fine-grained material that does not occur in crystalline form.
Complexation (Complex Formation) - any combination of dissolved cations with molecules oranions containing free pairs of electrons.
Component Species - “basis entities or building blocks from which all species in the system can bebuilt” (Allison et al. 1991). They are a set of linearly independent aqueous species in terms ofwhich all aqueous speciation, redox, mineral, and gaseous solubility reactions in theMINTEQA2 thermodynamic database are written.
Detrital Mineral - “any mineral grain resulting from mechanical disintegration of parent rock”
(Bates and Jackson 1980).
Deuterium (D) - stable isotope 2H of hydrogen.
Diagenetic - “caused by the chemical, physical, and biological changes undergone by a sedimentafter its initial deposition, and during and after its consolidation into a coherent solid rock,exclusive of surficial weathering and metamorphism” (Bates and Jackson 1980).
Disproportionation - is a chemical reaction in which a single compound serves as both oxidizingand reducing agent and is thereby converted into more oxidized and a more reduced derivatives(Sax and Lewis 1987). For the reaction to occur, conditions in the system must be temporarilychanged to favor this reaction (specifically, the primary energy barrier to the reaction must belowered). This is accomplished by a number of ways, such as adding heat or microbes, or byradiolysis occurring. Examples of plutonium disproportionation reactions are:
3Pu4+ + 2H2O = 2Pu3+ + PuO2
2+ +4H+
3PuO2
+ + 4H+ = Pu3+ + 2PuO22+ +2H2O.
Electron Activity - unity for the standard hydrogen electrode.
Evaporite - A sedimentary rock composed principally of minerals precipitated from a salinesolution as a result of extensive or total evaporation of the solution.

B.4
Far Field - the portion of a contaminant plume that is far from the point source and whosechemical composition is not significantly different from that of the uncontaminated portion ofthe aquifer.
Fulvic Acids - breakdown products of cellulose from vascular plants (also see humic acids). Fulvicacids are the alkaline-soluble portion which remains in solution at low pH and is of lowermolecular weight (Gascoyne 1982).
Humic Acids - breakdown products of cellulose from vascular plants (also see fulvic acids). Humicacids are defined as the alkaline-soluble portion of the organic material (humus) whichprecipitates from solution at low pH and are generally of high molecular weight (Gascoyne1982).
Hydrolysis - a chemical reaction in which a substance reacts with water to form two or more newsubstances. For example, the first hydrolysis reaction of U4+ can be written as
U4+ + H2O = UOH3+ + H+.
Hydrolytic Species - an aqueous species formed from a hydrolysis reaction.
Ionic Potential - ratio (z/r) of the formal charge (z) to the ionic radius (r) of an ion.
Isoelectric Point (iep) - pH at which a mineral’s surface has a net surface charge of zero. Moreprecisely, it is the pH at which the particle is electrokinetically uncharged.
Lignite - a coal that is intermediate in coalification between peat and subbituminous coal.
Marl - an earthy substance containing 35 to 65 percent clay and 65 to 5 percent carbonate formedunder marine or freshwater conditions
Mass Transfer - transfer of mass between 2 or more phases that includes an aqueous solution, suchas the mass change resulting from the precipitation of a mineral or adsorption of a metal on amineral surface.
Mass Transport - time-dependent movement of 1 or more solutes during fluid flow.
Methylation - a chemical process for introducing a methyl group (CH3–) into a species
Mire - a small piece of marshy, swampy, or boggy ground.
MModel Validation - integrated test of the accuracy with which a geochemical model and itsthermodynamic database simulate actual chemical processes.
Monomeric Species - an aqueous species containing only one center cation (as compared to apolymeric species).

B.5
Near Field - the portion of a contaminant plume that is near the point source and whose chemicalcomposition is significantly different from that of the uncontaminated portion of the aquifer.
Peat - an unconsolidated deposit of semicarbonized plant remains in a water saturated environment.
pHzpc - As the pH increases, mineral surfaces become increasingly more negatively charged. ThepH where the surface is uncharged (i.e., zero net charge) is referred to as the pH of zero-point-of-charge, pHzpc.
Polynuclear Species - an aqueous species containing more than one central cation moiety, e.g.,(UO2)2CO3(OH)3
- and Pb4(OH)44+.
Podzol - A great soil group of the 1938 USDA classification system. It is a group of zonal soilshaving an organic mat and a very thin organic-mineral layer overlying gray, leached A2 horizonand a dark brown, illuvial B horizon enriched in iron oxide, alumina, and organic matter. Itdevelops under coniferous or mixed forests or under heath, in a cool to temperate moist climate(USDA, 1938).
Protium (H) - stable isotope 1H of hydrogen.
Retrograde Solubility - solubility that decreases with increasing temperature, such as those ofcalcite (CaCO3) and radon. The solubility of most compounds (e.g., salt, NaCl) increases withincreasing temperature.
Species - actual form in which a dissolved molecule or ion is present in solution.
Specific Adsorption - surface complexation via a strong bond to a mineral surface. For example,several transition metals and actinides are specifically adsorbed to aluminum- and iron-oxideminerals.
Sol - a homogeneous suspension or dispersion of colloidal matter in a fluid.
Solid Solution - a solid material in which a minor element is substituted for a major element in amineral structure.
Thoron - name occasionally used, especially in older documents, to refer to 220Rn which forms fromthe decay of thorium.
Tritium (T) - radioactive isotope 3H of hydrogen.
Tritium Units - units sometimes used to report tritium concentrations. A tritium unit (TU) isequivalent to 1 atom of 3H (tritium) per 1018 atoms of 1H (protium). In natural water thatproduces 7.2 x 10⁻³ disintegrations per minute per milliliter (dpm/ml) of tritium, 1 TU isapproximately equal to 3.2 picocuries/milliliter (pCi/ml).
zpc (zero-point-of-charge) - see pHzpc.

APPENDIX C
Americium Adsorption Studies
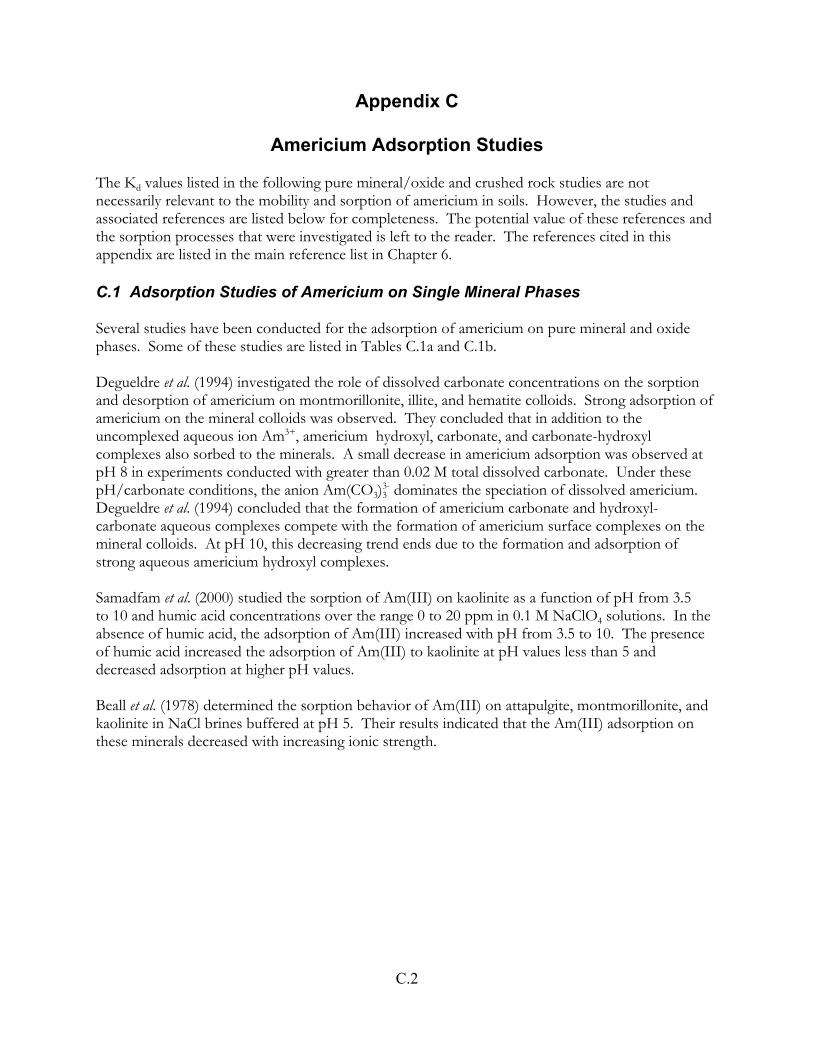
C.2
Appendix C
Americium Adsorption Studies
The Kd values listed in the following pure mineral/oxide and crushed rock studies are notnecessarily relevant to the mobility and sorption of americium in soils. However, the studies andassociated references are listed below for completeness. The potential value of these references andthe sorption processes that were investigated is left to the reader. The references cited in thisappendix are listed in the main reference list in Chapter 6.
C.1 Adsorption Studies of Americium on Single Mineral Phases
Several studies have been conducted for the adsorption of americium on pure mineral and oxidephases. Some of these studies are listed in Tables C.1a and C.1b.
Degueldre et al. (1994) investigated the role of dissolved carbonate concentrations on the sorptionand desorption of americium on montmorillonite, illite, and hematite colloids. Strong adsorption ofamericium on the mineral colloids was observed. They concluded that in addition to theuncomplexed aqueous ion Am3+, americium hydroxyl, carbonate, and carbonate-hydroxylcomplexes also sorbed to the minerals. A small decrease in americium adsorption was observed atpH 8 in experiments conducted with greater than 0.02 M total dissolved carbonate. Under thesepH/carbonate conditions, the anion Am(CO3)3
3- dominates the speciation of dissolved americium. Degueldre et al. (1994) concluded that the formation of americium carbonate and hydroxyl-carbonate aqueous complexes compete with the formation of americium surface complexes on themineral colloids. At pH 10, this decreasing trend ends due to the formation and adsorption ofstrong aqueous americium hydroxyl complexes.
Samadfam et al. (2000) studied the sorption of Am(III) on kaolinite as a function of pH from 3.5to 10 and humic acid concentrations over the range 0 to 20 ppm in 0.1 M NaClO4 solutions. In theabsence of humic acid, the adsorption of Am(III) increased with pH from 3.5 to 10. The presenceof humic acid increased the adsorption of Am(III) to kaolinite at pH values less than 5 anddecreased adsorption at higher pH values.
Beall et al. (1978) determined the sorption behavior of Am(III) on attapulgite, montmorillonite, andkaolinite in NaCl brines buffered at pH 5. Their results indicated that the Am(III) adsorption onthese minerals decreased with increasing ionic strength.
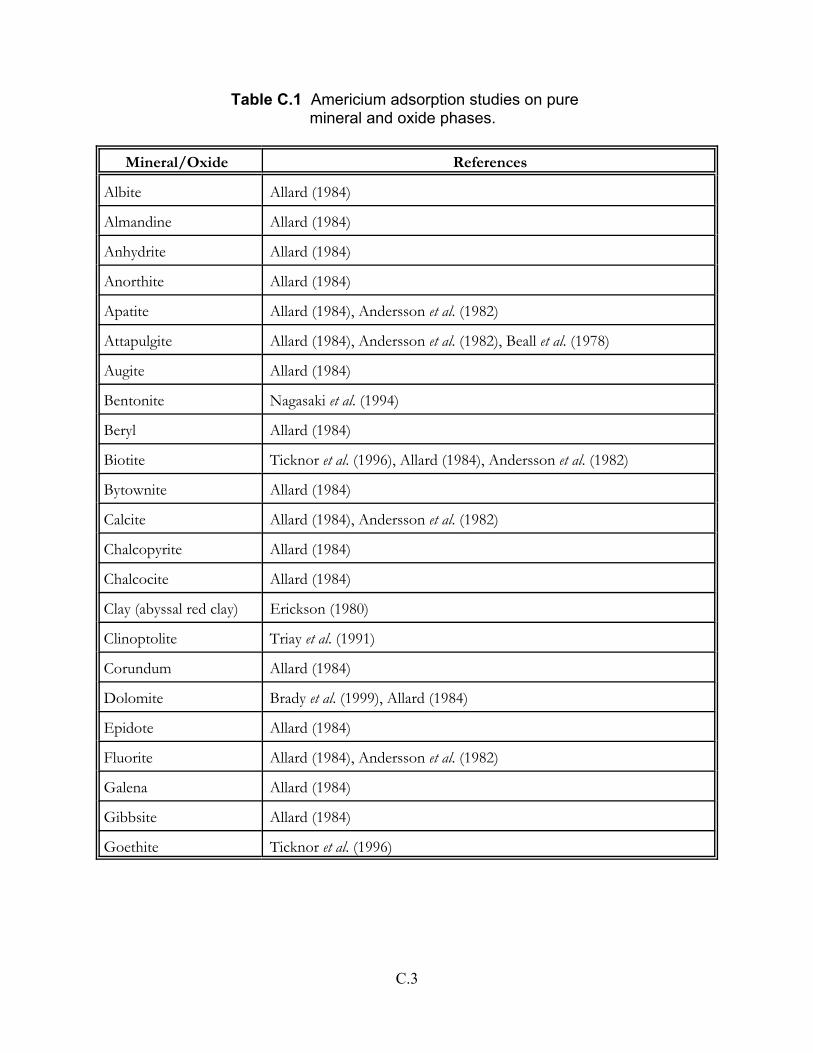
C.3
Table C.1 Americium adsorption studies on pure mineral and oxide phases.
Mineral/Oxide References
Albite Allard (1984)
Almandine Allard (1984)
Anhydrite Allard (1984)
Anorthite Allard (1984)
Apatite Allard (1984), Andersson et al. (1982)
Attapulgite Allard (1984), Andersson et al. (1982), Beall et al. (1978)
Augite Allard (1984)
Bentonite Nagasaki et al. (1994)
Beryl Allard (1984)
Biotite Ticknor et al. (1996), Allard (1984), Andersson et al. (1982)
Bytownite Allard (1984)
Calcite Allard (1984), Andersson et al. (1982)
Chalcopyrite Allard (1984)
Chalcocite Allard (1984)
Clay (abyssal red clay) Erickson (1980)
Clinoptolite Triay et al. (1991)
Corundum Allard (1984)
Dolomite Brady et al. (1999), Allard (1984)
Epidote Allard (1984)
Fluorite Allard (1984), Andersson et al. (1982)
Galena Allard (1984)
Gibbsite Allard (1984)
Goethite Ticknor et al. (1996)

C.4
Continuation of Table C.1
Mineral/Oxide References
Halloysite Allard (1984)
Hematite Degueldre et al. (1994), Allard (1984)
Hornblende Allard (1984)
Illite Degueldre et al. (1994)
Kaolinite Samadfam et al. (2000), Allard (1984), Beall et al. (1978)
Limonite Allard (1984)
Magnetite Allard (1984), Andersson et al. (1982)
Microcline Allard (1984)
Molybdenite Allard (1984)
Monazite Allard (1984)
Montmorillonite Ticknor et al. (1996), Degueldre et al. (1994), Allard (1984), Anderssonet al. (1982), Beall et al. (1978)
Muscovite Allard (1984)
Olivine Allard (1984), Andersson et al. (1982)
Pyrite Allard (1984)
Quartz Ticknor et al. (1996), Allard (1984), Andersson et al. (1982)
Romanechite Triay et al. (1991)
Serpentine Allard (1984)
Sphene Allard (1984)
Zircon Allard (1984)
Degueldre et al. (1994) investigated the role of dissolved carbonate concentrations on the sorptionand desorption of americium on montmorillonite, illite, and hematite colloids. Strong adsorption ofamericium on the mineral colloids was observed. Degueldre et al. (1994) concluded that in additionto the uncomplexed aqueous ion Am3+, americium hydroxyl, carbonate, and carbonate-hydroxylcomplexes also sorbed to the minerals. A small decrease in americium adsorption was observed atpH 8 in experiments conducted with greater than 0.02 M total dissolved carbonate. Under thesepH/carbonate conditions, the anion Am(CO3)3
3- dominates the speciation of dissolved americium. Degueldre et al. (1994) concluded that the formation of americium carbonate and hydroxyl-carbonate aqueous complexes compete with the formation of americium surface complexes on the
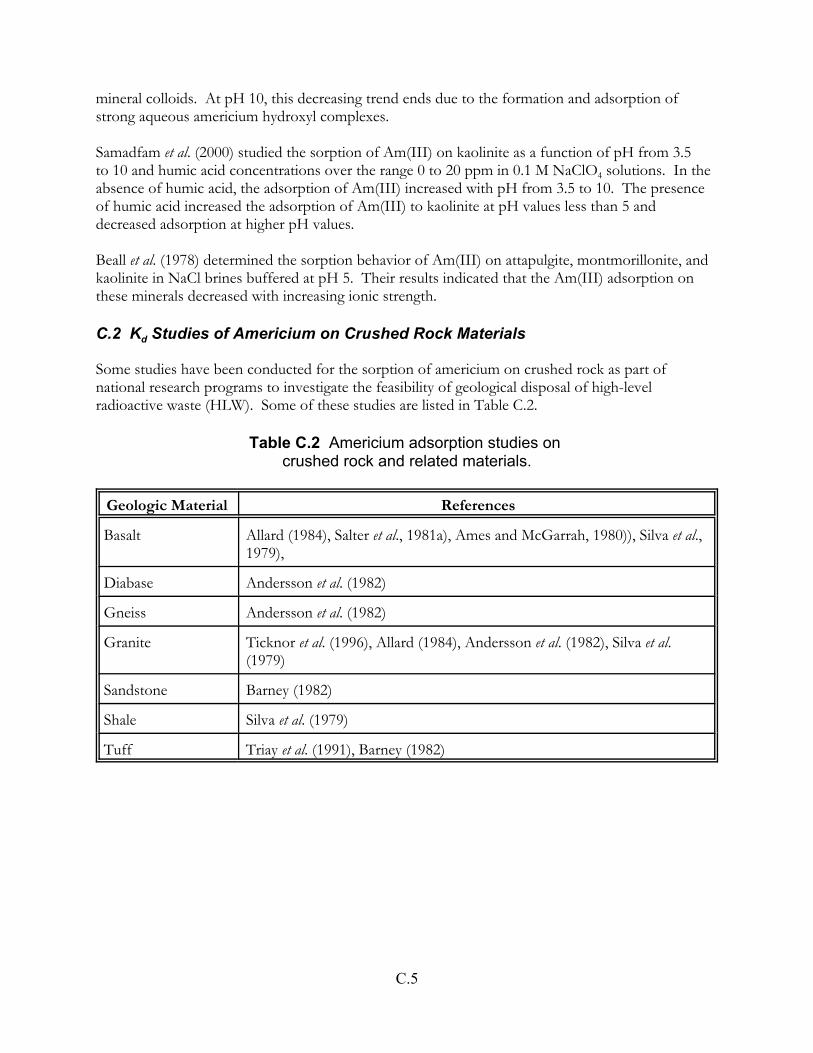
C.5
mineral colloids. At pH 10, this decreasing trend ends due to the formation and adsorption ofstrong aqueous americium hydroxyl complexes.
Samadfam et al. (2000) studied the sorption of Am(III) on kaolinite as a function of pH from 3.5to 10 and humic acid concentrations over the range 0 to 20 ppm in 0.1 M NaClO4 solutions. In theabsence of humic acid, the adsorption of Am(III) increased with pH from 3.5 to 10. The presenceof humic acid increased the adsorption of Am(III) to kaolinite at pH values less than 5 anddecreased adsorption at higher pH values.
Beall et al. (1978) determined the sorption behavior of Am(III) on attapulgite, montmorillonite, andkaolinite in NaCl brines buffered at pH 5. Their results indicated that the Am(III) adsorption onthese minerals decreased with increasing ionic strength.
C.2 Kd Studies of Americium on Crushed Rock Materials
Some studies have been conducted for the sorption of americium on crushed rock as part ofnational research programs to investigate the feasibility of geological disposal of high-levelradioactive waste (HLW). Some of these studies are listed in Table C.2.
Table C.2 Americium adsorption studies on crushed rock and related materials.
Geologic Material References
Basalt Allard (1984), Salter et al., 1981a), Ames and McGarrah, 1980)), Silva et al.,1979),
Diabase Andersson et al. (1982)
Gneiss Andersson et al. (1982)
Granite Ticknor et al. (1996), Allard (1984), Andersson et al. (1982), Silva et al.(1979)
Sandstone Barney (1982)
Shale Silva et al. (1979)
Tuff Triay et al. (1991), Barney (1982)
APPENDIX D
Arsenic Adsorption Studies

D.2
Appendix D
Arsenic Adsorption Studies
The Kd values listed in the following pure mineral/oxide and crushed rock studies are notnecessarily relevant to the mobility and sorption of arsenic in soils. However, the studies andassociated references are listed below for completeness. The potential value of these references andthe sorption processes that were investigated is left to the reader. The references cited in thisappendix are listed in the main reference list in Chapter 6.
Several studies have been conducted on the adsorption to arsenic on pure mineral and oxide phases. Some of these studies are listed in Table D.1a and D1.b.
Table D.1 Arsenic adsorption studies on pure mineral and oxide phases.
Mineral/Oxide References
Alumina (activated) Gupta and Chen (1978)
Aluminum hydroxide(amorphous)
Manning and Goldberg [1997a, As(III)], Davis (1978), Anderson et al.(1976)
Bauxite (activated) Gupta and Chen (1978)
Biotite (Hydroxy Al-coated)
Huang (1975)
Corundum Halter and Pfeider [2001, As(V)]
Ettringite Myneni et al. [1997, As(V)]
Ferrihydrite Jain et al. [1999, As(V) and As(III)], Raven et al. [1998, As(V) andAs(III)], Fuller et al. [1993, As(III)], Waychunas et al. [1992, As(V)],Davis et al. [1989, As(V)]
Gibbsite Ladeira et al. (2001)
Goethite O’Reilly et al. [2001, As(V)], Manning et al. [1998, As(III)], Sun andDoner [1998, As(III)], Fendorf et al. [1997, As(V)]
Hydrous iron oxide Wilkie and Hering [1996, As(V) and As(III)], Hsi et al. (1994)
Illite Manning and Goldberg [1997a, As(III)]
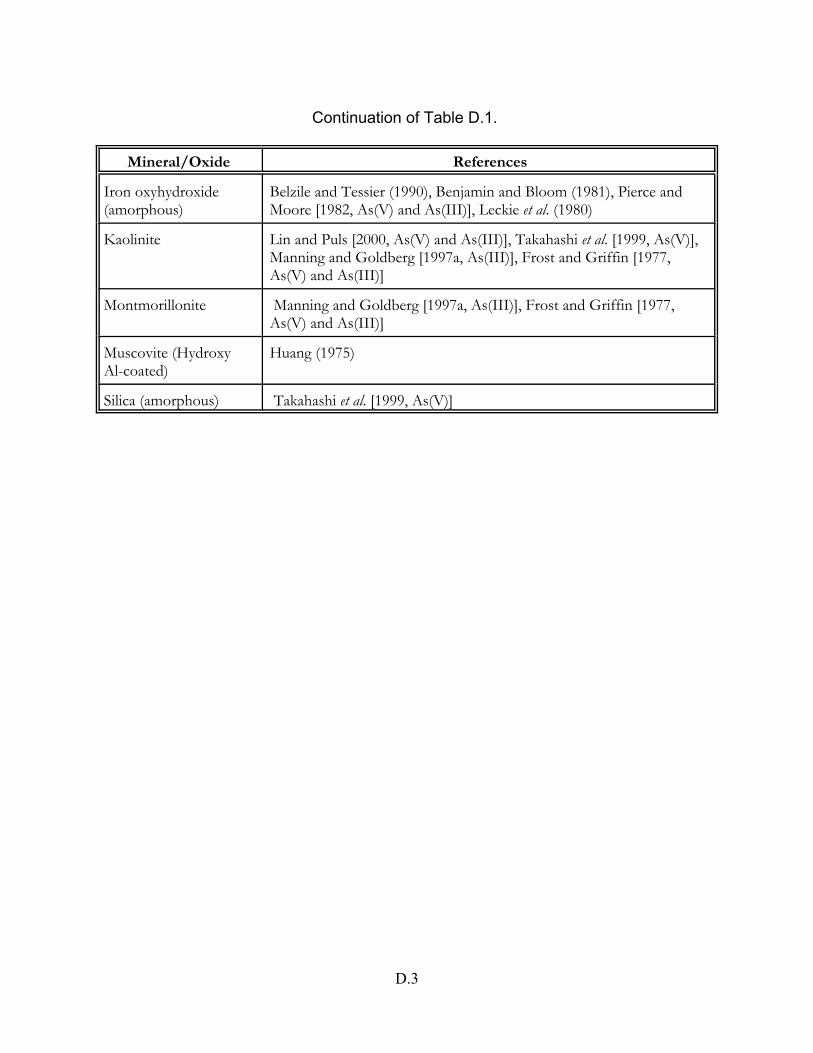
D.3
Continuation of Table D.1.
Mineral/Oxide References
Iron oxyhydroxide(amorphous)
Belzile and Tessier (1990), Benjamin and Bloom (1981), Pierce andMoore [1982, As(V) and As(III)], Leckie et al. (1980)
Kaolinite Lin and Puls [2000, As(V) and As(III)], Takahashi et al. [1999, As(V)],Manning and Goldberg [1997a, As(III)], Frost and Griffin [1977,As(V) and As(III)]
Montmorillonite Manning and Goldberg [1997a, As(III)], Frost and Griffin [1977,As(V) and As(III)]
Muscovite (HydroxyAl-coated)
Huang (1975)
Silica (amorphous) Takahashi et al. [1999, As(V)]

APPENDIX E
Curium Adsorption Studies
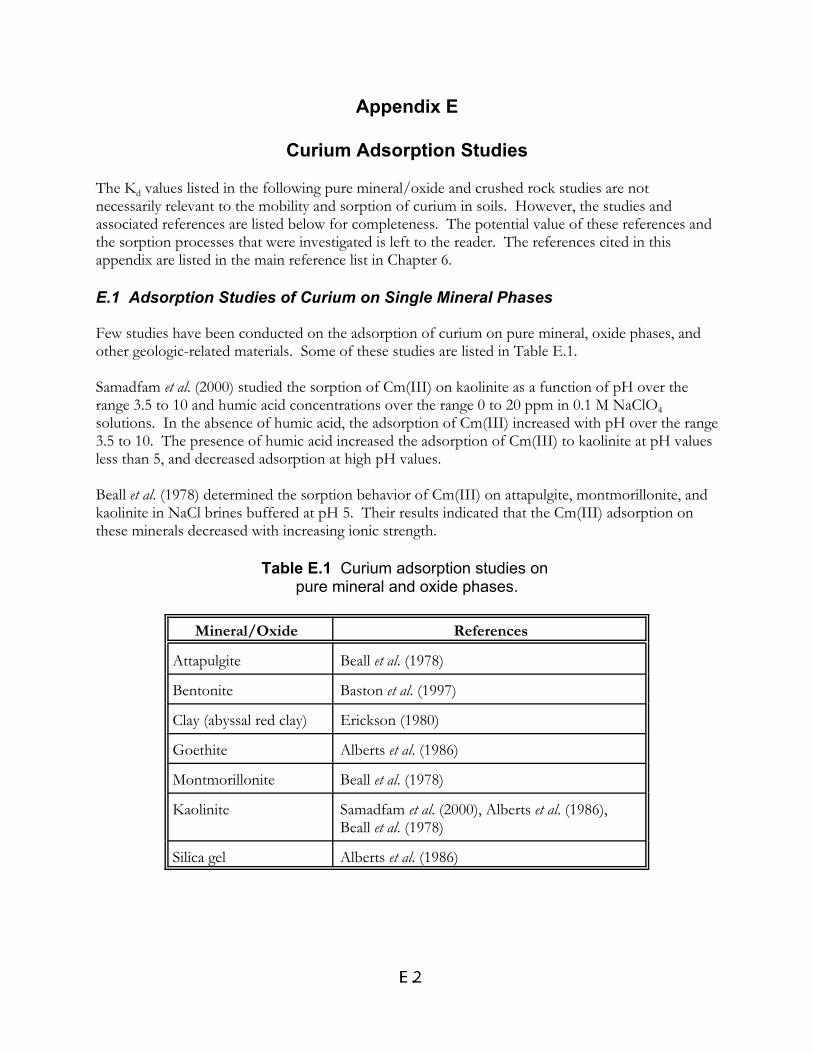
Appendix E
Curium Adsorption Studies
The Kd values listed in the following pure mineral/oxide and crushed rock studies are notnecessarily relevant to the mobility and sorption of curium in soils. However, the studies andassociated references are listed below for completeness. The potential value of these references andthe sorption processes that were investigated is left to the reader. The references cited in thisappendix are listed in the main reference list in Chapter 6.
E.1 Adsorption Studies of Curium on Single Mineral Phases
Few studies have been conducted on the adsorption of curium on pure mineral, oxide phases, andother geologic-related materials. Some of these studies are listed in Table E.1.
Samadfam et al. (2000) studied the sorption of Cm(III) on kaolinite as a function of pH over therange 3.5 to 10 and humic acid concentrations over the range 0 to 20 ppm in 0.1 M NaClO4solutions. In the absence of humic acid, the adsorption of Cm(III) increased with pH over the range3.5 to 10. The presence of humic acid increased the adsorption of Cm(III) to kaolinite at pH valuesless than 5, and decreased adsorption at high pH values.
Beall et al. (1978) determined the sorption behavior of Cm(III) on attapulgite, montmorillonite, andkaolinite in NaCl brines buffered at pH 5. Their results indicated that the Cm(III) adsorption onthese minerals decreased with increasing ionic strength.
Table E.1 Curium adsorption studies on pure mineral and oxide phases.
Mineral/Oxide References
Attapulgite Beall et al. (1978)
Bentonite Baston et al. (1997)
Clay (abyssal red clay) Erickson (1980)
Goethite Alberts et al. (1986)
Montmorillonite Beall et al. (1978)
Kaolinite Samadfam et al. (2000), Alberts et al. (1986),Beall et al. (1978)
Silica gel Alberts et al. (1986)

E.3
E.2 Kd Studies of Curium on Crushed Rock Materials
Few studies have been conducted for the sorption of curium on crushed rocks. Studies identifiedwere conducted as part of national research programs to investigate the feasibility of geologicaldisposal of high-level radioactive waste (HLW). Some of these studies are listed in Table E.2.
Table E.2 Curium adsorption studies on crushed rock and related materials.
Geologic Material References
Basalt Silva et al. (1979)
Granite Silva et al. (1979)
Granodiorite Baston et al. (1997)
Shale Silva et al. (1979)
Tuff Baston et al. (1997)

APPENDIX F
Iodine Adsorption Studies
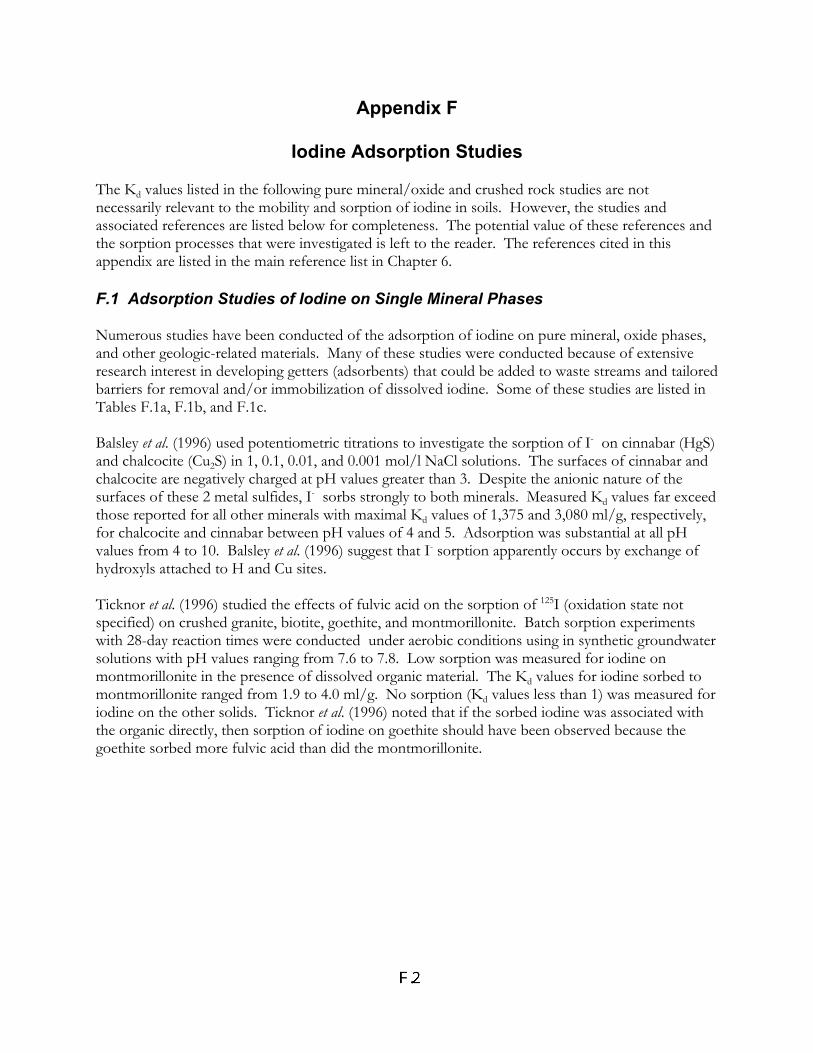
Appendix F
Iodine Adsorption Studies
The Kd values listed in the following pure mineral/oxide and crushed rock studies are notnecessarily relevant to the mobility and sorption of iodine in soils. However, the studies andassociated references are listed below for completeness. The potential value of these references andthe sorption processes that were investigated is left to the reader. The references cited in thisappendix are listed in the main reference list in Chapter 6.
F.1 Adsorption Studies of Iodine on Single Mineral Phases Numerous studies have been conducted of the adsorption of iodine on pure mineral, oxide phases,and other geologic-related materials. Many of these studies were conducted because of extensiveresearch interest in developing getters (adsorbents) that could be added to waste streams and tailoredbarriers for removal and/or immobilization of dissolved iodine. Some of these studies are listed inTables F.1a, F.1b, and F.1c.
Balsley et al. (1996) used potentiometric titrations to investigate the sorption of I- on cinnabar (HgS)and chalcocite (Cu2S) in 1, 0.1, 0.01, and 0.001 mol/l NaCl solutions. The surfaces of cinnabar andchalcocite are negatively charged at pH values greater than 3. Despite the anionic nature of thesurfaces of these 2 metal sulfides, I- sorbs strongly to both minerals. Measured Kd values far exceedthose reported for all other minerals with maximal Kd values of 1,375 and 3,080 ml/g, respectively,for chalcocite and cinnabar between pH values of 4 and 5. Adsorption was substantial at all pHvalues from 4 to 10. Balsley et al. (1996) suggest that I- sorption apparently occurs by exchange ofhydroxyls attached to H and Cu sites.
Ticknor et al. (1996) studied the effects of fulvic acid on the sorption of 125I (oxidation state notspecified) on crushed granite, biotite, goethite, and montmorillonite. Batch sorption experimentswith 28-day reaction times were conducted under aerobic conditions using in synthetic groundwatersolutions with pH values ranging from 7.6 to 7.8. Low sorption was measured for iodine onmontmorillonite in the presence of dissolved organic material. The Kd values for iodine sorbed tomontmorillonite ranged from 1.9 to 4.0 ml/g. No sorption (Kd values less than 1) was measured foriodine on the other solids. Ticknor et al. (1996) noted that if the sorbed iodine was associated withthe organic directly, then sorption of iodine on goethite should have been observed because thegoethite sorbed more fulvic acid than did the montmorillonite.

F.3
Table F.1 Iodine adsorption studies on pure minerals and oxide phases.
Mineral/Oxide References
AgCl Andersson et al. (1982), Allard et al. (1980)
Al(OH)3 Andersson et al. (1982), Allard et al. (1980)
Al2O3 Hakem et al. (1996, colloidal-size), Muramatsu et al. (1990), Ticknor andCho (1990, I- and IO3
- )
Allophane Sazarashi et al. (1994,1995)
Anhydrite Strickert et al. (1980)
Apatite Strickert et al. (1980)
Argentite Kaplan et al. (2000a)
Attapulgite Sazarashi et al. (1994,1995), Rançon (1988), Allard et al. (1980)
Bauxite Rançon (1988)
Bentonite Muramatsu et al. (1990), Rançon (1988)
Biotite Ticknor et al. (1996)
Bornite Strickert et al. (1980)
Bournonite Strickert et al. (1980)
Calcite Kaplan et al. (2000b), Kaplan et al. (1999), Ticknor and Cho (1990, I-
and IO3- )
Cerusite Rançon (1988)
Chalcopyrite Sazarashi et al. (1995,1994), Rançon (1988), Andersson et al. (1982),Strickert et al. (1980), Allard et al. (1980)
Chalcocite Kaplan et al. (2000a), Balsley et al. (1996,1997)
Chalcopyrite Kaplan et al. (2000a), Huie et al. (1988)
Chlorite Kaplan et al. (2000b), Kaplan et al. (1999), Ticknor and Cho (1990, I-
and IO3- )
Chysocolla Rançon (1988), Strickert et al. (1980)
Cinnabar Kaplan et al. (2000a), Balsley et al. (1996, 1997), Sazarashi et al.(1994,1995), Ikeda et al. (1994), Andersson et al. (1982), Allard et al.(1980)

F.4
Continuation of Table F.1.
Mineral/Oxide References
Clinoptilolite Rançon (1988)
Coals (sub-bituminous) Balsley et al. (1997)
Covellite Balsley et al. (1997)
Cu (metal) Haq et al. (1980)
Cu2O Haq et al. (1980)
CuO Haq et al. (1980)
Dolomite Strickert et al. (1980)
Enargite Strickert et al. (1980)
Epidote Ticknor and Cho (1990, I- and IO3- )
Fe2O3 Muramatsu et al. (1990)
Ferric hydroxide Andersson et al. (1982), Allard et al. (1980)
Galena Kaplan et al. (2000a), Huie et al. (1988), Rançon (1988), Strickert et al.(1980), Allard et al. (1980)
Goethite Kaplan et al. (2000b), Kaplan et al. (1999), Ticknor et al. (1996), Ticknorand Cho (1990, I- and IO3
- ), Rançon (1988)
Gypsum Ticknor and Cho (1990, I- and IO3- )
Halloysite Allard et al. (1980)
Hematite Ticknor and Cho (1990, I- and IO3- ), Huie et al. (1988, rare-earth
hematite), Rançon (1988)
Illite Kaplan et al. (2000b), Kaplan et al. (1999), Rançon (1988)
Imogolite-bearing soil Balsley et al. (1997)
Kaolinite Muramatsu et al. (1990), Ticknor and Cho (1990, I- and IO3- ), Rançon
(1988)
Laterite Rançon (1988)

F.5
Continuation of Table F.1.
Mineral/Oxide References
Lignite Balsley et al. (1997)
Limonite Rançon (1988), Allard et al. (1980)
Molybdenite Huie et al. (1988)
Montmorillonite Kaplan et al. (2000b), Kaplan et al. (1999), Ticknor et al. (1996), Sazarashiet al. (1994,1995), Allard et al. (1980)
Muscovite Ticknor and Cho (1990, I- and IO3- )
Olivine Andersson et al. (1982), Allard et al. (1980)
PbOH Andersson et al. (1982). Allard et al. (1980)
Pyrite Huie et al. (1988), Strickert et al. (1980)
Quartz Kaplan et al. (2000b), Kaplan et al. (1999), Ticknor et al. (1996),Muramatsu et al. (1990), Ticknor and Cho (1990, I- and IO3
- ), Rançon(1988), Allard et al. (1980)
Sepiolite Rançon (1988)
Serpentine Andersson et al. (1982), Allard et al. (1980)
Siderite Rançon (1988)
SiO2 (colloidal size) Hakem et al. (1996)
Stibnite Kaplan et al. (2000a), Huie et al. (1988)
Tennantite Strickert et al. (1980)
Tetrahedrite Strickert et al. (1980)
Tiemannite Zhuang et al. (1995)
TiO2 (colloidal size) Hakem et al. (1996)
Vermiculite Kaplan et al. (2000b), Kaplan et al. (1999), Rançon (1988)
Witherite Strickert et al. (1980)
Zinc hydrotalcite Balsley et al. (1997)
Zeolite Rançon (1988)

F.6
Ticknor and Cho (1990) studied the extent of sorption of I- and IO3- on bentonite and minerals
found in fractures in granite. The batch equilibration experiments were conducted using syntheticgroundwater (pH 7.7) and samples of crushed calcite, chlorite, epidote, goethite, gypsum, hematite,kaolinite, muscovite, and quartz. Ticknor and Cho found no measurable sorption of I- or IO3
- onbentonite. No detectable sorption was measured for I- on any of the minerals selected for study. Sorption of IO3
- was observed with chlorite and hematite over the range of conditions used for theirstudy, and with kaolinite, epidote, goethite, and quartz at some of the experimental conditions. There was no detectable sorption of IO3
- on calcite, gypsum, and muscovite. Inorganic I- was notsorbed by any of the minerals under any of the conditions used in their study.
Couture and Seitz (1983) measured the sorption of I-, IO3- , and IO4
- (periodate) on hematite andkaolinite, and the sorption of IO3
- by pelagic red clay in buffer solutions and sea water. Iodate wasstrongly sorbed by hematite at pH values up to 9. Hematite is more effective than kaolinite as asorbent for IO3
- , and IO3- is more strongly sorbed than I- by kaolinite and hematite. Periodate (IO4
- )was more strongly sorbed by hematite than IO3
- , and I- appears to be less strongly sorbed. At pH 4,pure kaolinite (free of hematite and goethite) sorbs IO3
- only slightly and I- not all. Couture and Seitz(1983) determined that the sorption of IO3
- was reversible upon change in pH. Because IO3- and IO4
-
were sorbed to a greater extent than I- by a number of minerals, especially iron oxides, the apparentsorption of I- may be due to the sorption of oxidized iodine species. Based on their measurements,Couture and Seitz (1983) suggest that results from published iodine sorption experiments should bequestioned unless the oxidation state of the iodine absorbate and the mineralogical purity of theadsorbents were established.
F.2 Kd Studies of Iodine on Crushed Rock Materials
Numerous studies have been conducted of the sorption of iodine on crushed rock as part ofnational research programs to investigate the feasibility of geological disposal of high-levelradioactive waste (HLW). Some of these studies are listed in Table F.2.
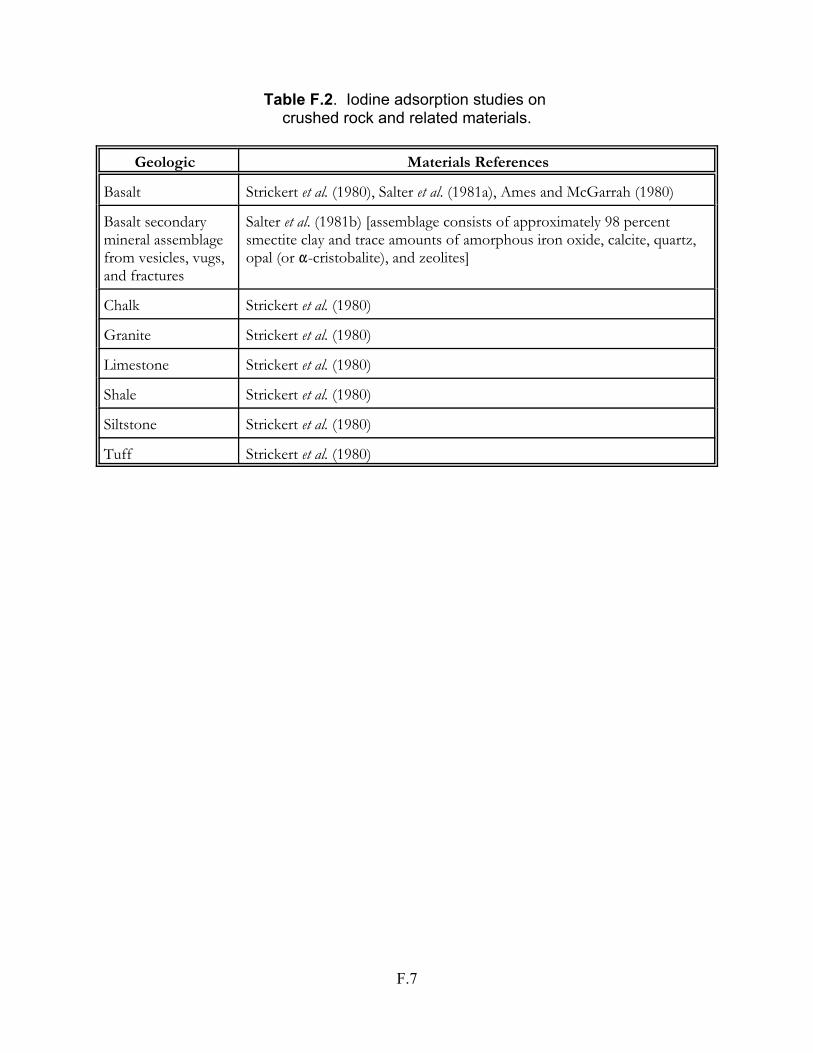
F.7
Table F.2. Iodine adsorption studies on crushed rock and related materials.
Geologic Materials References
Basalt Strickert et al. (1980), Salter et al. (1981a), Ames and McGarrah (1980)
Basalt secondarymineral assemblagefrom vesicles, vugs,and fractures
Salter et al. (1981b) [assemblage consists of approximately 98 percentsmectite clay and trace amounts of amorphous iron oxide, calcite, quartz,opal (or "-cristobalite), and zeolites]
Chalk Strickert et al. (1980)
Granite Strickert et al. (1980)
Limestone Strickert et al. (1980)
Shale Strickert et al. (1980)
Siltstone Strickert et al. (1980)
Tuff Strickert et al. (1980)

APPENDIX G
Neptunium Adsorption Studies

Appendix G
Neptunium Adsorption Studies
The Kd values listed in the following pure mineral/oxide and crushed rock studies are notnecessarily relevant to the mobility and sorption of neptunium in soils. However, the studies andassociated references are listed below for completeness. The potential value of these references andthe sorption processes that were investigated is left to the reader. The references cited in thisappendix are listed in the main reference list in Chapter 6.
G.1 Adsorption Studies of Neptunium on Single Mineral Phases
Several studies have been conducted for the adsorption of Np(V) on pure mineral and oxide phases. Some of these studies are listed in Tables G.1a and G.1b.
Table G.1 Neptunium adsorption studies on pure mineral and oxide phases.
Mineral/Oxide References(s)
Albite Torstenfelt et al. (1988), Beall et al. (1980)
Anorthite Torstenfelt et al. (1988)
Apatite Andersson et al. (1982)
Aragonite Keeney-Kennicutt et al. (1984)
Attapulgite Andersson et al. (1982)
Bentonite Torstenfelt et al. (1988)
Biotite Nakayama and Sakamoto (1991), Andersson et al. (1982), Beall et al. (1980)
Böhmite Kung and Triay (1994), Nakayama and Sakamoto (1991)
Bytownite Beall et al. (1980)
Calcite Ticknor (1993). Keeney-Kennicutt et al. (1984), Andersson et al. (1982)
Chlorite Ticknor (1993)
Clay Hart et al. (1994), Keeney-Kennicutt et al. (1984)
Corundum Nakayama and Sakamoto (1991)
Dolomite Brady et al. (1999)
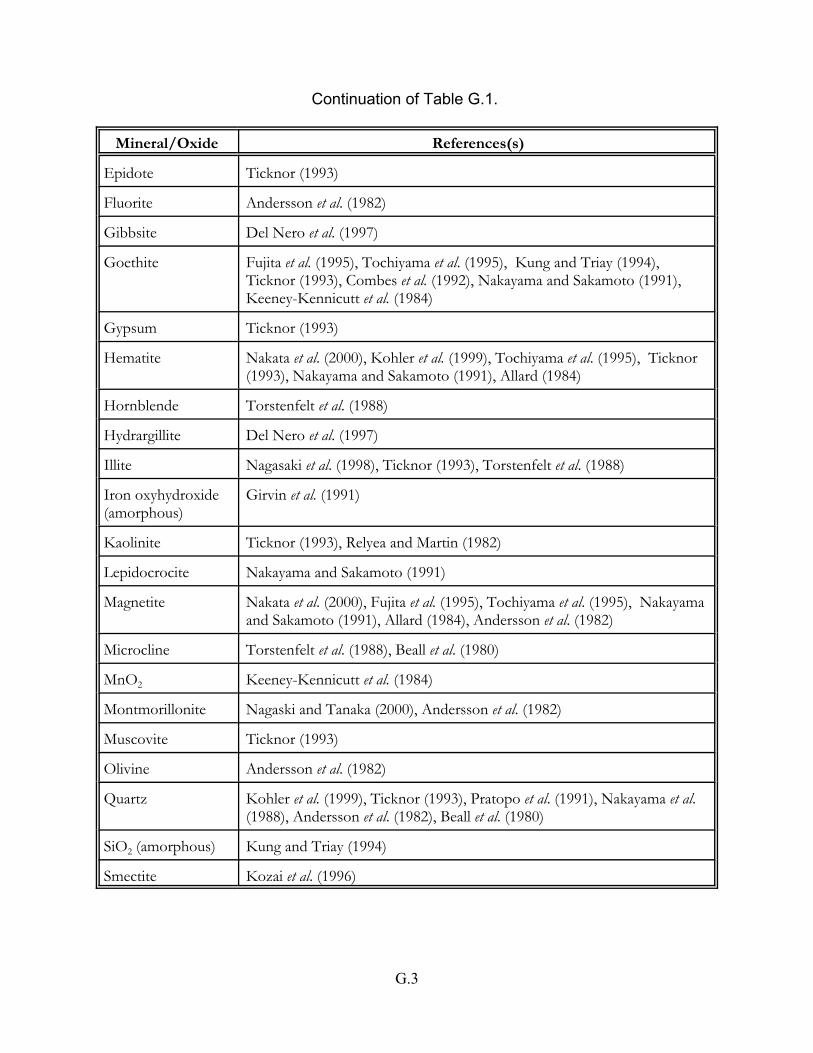
G.3
Continuation of Table G.1.
Mineral/Oxide References(s)
Epidote Ticknor (1993)
Fluorite Andersson et al. (1982)
Gibbsite Del Nero et al. (1997)
Goethite Fujita et al. (1995), Tochiyama et al. (1995), Kung and Triay (1994),Ticknor (1993), Combes et al. (1992), Nakayama and Sakamoto (1991), Keeney-Kennicutt et al. (1984)
Gypsum Ticknor (1993)
Hematite Nakata et al. (2000), Kohler et al. (1999), Tochiyama et al. (1995), Ticknor(1993), Nakayama and Sakamoto (1991), Allard (1984)
Hornblende Torstenfelt et al. (1988)
Hydrargillite Del Nero et al. (1997)
Illite Nagasaki et al. (1998), Ticknor (1993), Torstenfelt et al. (1988)
Iron oxyhydroxide(amorphous)
Girvin et al. (1991)
Kaolinite Ticknor (1993), Relyea and Martin (1982)
Lepidocrocite Nakayama and Sakamoto (1991)
Magnetite Nakata et al. (2000), Fujita et al. (1995), Tochiyama et al. (1995), Nakayamaand Sakamoto (1991), Allard (1984), Andersson et al. (1982)
Microcline Torstenfelt et al. (1988), Beall et al. (1980)
MnO2 Keeney-Kennicutt et al. (1984)
Montmorillonite Nagaski and Tanaka (2000), Andersson et al. (1982)
Muscovite Ticknor (1993)
Olivine Andersson et al. (1982)
Quartz Kohler et al. (1999), Ticknor (1993), Pratopo et al. (1991), Nakayama et al.(1988), Andersson et al. (1982), Beall et al. (1980)
SiO2 (amorphous) Kung and Triay (1994)
Smectite Kozai et al. (1996)

1 Tuff is a general term for a rock formed of consolidated clastic (principally broken fragments) material thatoriginated from volcanic explosion or aerial expulsion from a volcanic vent (Bates and Jackson 1980).
G.4
Kung and Triay (1994) used the batch sorption technique to investigate the effect of naturallyoccurring organic materials on the sorption of Np(V) on synthetic goethite, böhmite [also known asboehmite, AlO(OH)], amorphous silica oxides, and crushed tuff1 material. The presence of themodel amino acid and fulvic acids did not affect the sorption of neptunium on tuff material or oniron or aluminum oxides. The interaction between organic material and mineral surfaces in thenatural environment is important to mineral surface geochemistry. Sorption of organic materialonto mineral surfaces will affect not only the solubility and charge of organics in solution but alsomineral surface properties. These changes may affect the reactivity of the mineral to other metalions. Sorption of neptunium on iron oxides was 10 times greater than that on aluminum oxides. Sorption of neptunium on crushed tuff material was much lower than that on the oxide surfaces. Presence of model organic materials did not influence the sorption of neptunium on tuff or on ironor aluminum oxides, suggesting that the dissolved model organics did not readily complexneptunium or change the surface properties of the adsorbents.
Table G.2 Measured Np(V) Kd values (ml/l) for fracture-coating minerals as a function of total dissolved solids (TDS) and normal
versus low oxygen conditions (Ticknor, 1993).
MineralNormal Oxygen Conditions Low Oxygen Conditions
1,850 TDS 2,830 TDS 12,580 TDS 1,850 TDS 2,830 TDS 12,580 TDS
Calcite $49 1 $48 6.5 $66 $64 15
Chlorite $57 $38 12 $58 13 9.5
Epidote 2.2 1.1 0.6 13 9.1 3.6
Goethite $55 $39 16 $62 $47 20
Gypsum 1.2 1.4 0.6 5.1 5.1 3.0
Hematite $69 $68 $68 $84 $80 $72
Illite $57 $39 7.8 $79 $76 25
Kaolinite 2.6 1.4 2.0 4.1 2.1 2.6
Muscovite 1.6 0.5 0.9 6.3 5.3 3.0
Quartz 0 0 0 1.3 0.8 3.71 Kd values listed in italics are based on minimum analytical detection limit values for concentrations of dissolvedneptunium.
Ticknor (1993) completed batch equilibration experiments to study the sorption of 237Np inthree synthetic groundwater solutions on minerals present as fracture coatings in granitic rock. Theminerals included calcite, chlorite, epidote, goethite, gypsum, hematite, illite, kaolinite, muscovite,

1 As the pH increases, mineral surfaces become increasingly more negatively charged. The pH where the surface isuncharged (i.e., zero net charge) is referred to as the pH of zero-point-of-charge, pHzpc.
G.5
and quartz. Under the experimental conditions, Np(V) was the most probable oxidation state. ThepH of each solution was adjusted to 7.5 using NaOH. The three saline solutions differed in theircontent of total dissolved solids (TDS). At the end of the contact period (27 to 30 days), themeasured pH under normal oxygen conditions was 8.0 to 8.5 for all mineral/solution combinationexcept for the kaolinite experiments which had a final pH between 6.5 to 7.0. The pH of themineral/solution experiments conducted under low oxygen conditions was 9.5. Ticknor (1993)suggested the competition for sorption sites by increases in TDS may account for the decrease ofneptunium sorption on some mineral surfaces (Table G.2).
Combes et al. (1992) studied the sorption of dissolved Np(V) on goethite (crystalline "-FeOOH)using synchrotron-based, extended X-ray absorption fine structure (EXAFS) and X-ray absorptionnear-edge structure (XANES) spectroscopies. The sorption experiments consisted of reacting high-surface area goethite with a pH 7.2, 0.08 M NaNO3 solution containing 1.3x10⁻⁵ M Np(V). Theirresults indicate that Np(V) sorbs on goethite as a mononuclear, inner-sphere complex. The surfacecomplex may also contain hydroxide or carbonate ligands. There was no indication that the Np(V)sorption on goethite occurred as an ordered neptunium oxide or hydroxide or as a coprecipitate withiron oxide/hydroxide solid.
Nakayama and Sakamoto (1991) studied the sorption of neptunium on several minerals in 0.1 MNaNO3 solution at pH values between 4 and 11. The minerals included samples of naturallyoccurring hematite, magnetite, goethite, lepidocrocite, biotite, böhmite, and corundum. Thesorption of neptunium on goethite differed as a function of pH relative to that for hematite,magnetite, and biotite. The experiments indicated strong sorption of neptunium on goethite at pHvalues greater than 6, while sorption on hematite, magnetite, and biotite increased at pH valuesabove 9. The pH dependence of neptunium sorption on lepidocrocite and boehmite was similar tothat of goethite, and neptunium sorption on corundum was similar to that for hematite. Nakayamaand Sakamoto (1991) attributed the difference in neptunium sorption between the various mineralsto the pHzpc,1 surface charge density, and the pH dependency of the different neptunium aqueousspecies.
Although others have reported the enhanced adsorption of neptunium by Fe(II)-containing mineralsby surface-mediated heterogeneous reduction and sorption reactions, Nakayama and Sakamoto(1991) observed no significant difference in the retardation by the Fe(II)-containing biotite andmagnetite versus that for Fe(III)-containing hematite.
Torstenfelt et al. (1988) used batch experiments to measure neptunium Kd values for several mineralsin groundwater as a function of pH. Natural groundwater containing a total concentrations of10-7 M 237Np was equilibrated under aerobic conditions with crushed samples of granite fromthree sites and six minerals which included hornblende, three feldspar minerals (albite, anorthite,microcline), and two clays ( illite and bentonite). The groundwater contained 143 mg/l HCO3
- , andits pH was adjusted to values between approximately 2 and 11 using NaOH or HCl solutions. Torstenfelt et al. (1988) observed greater sorption of Np(V) at higher pH than at lower pH values.
1 The coarse scale used for Kd axes by Torstenfelt et al. (1988) precluded interpolation of accurate values for theexperimentally-determined Kd values for each solid type.
G.6
The results plotted1 by Torstenfelt et al. (1988) typically indicated that the Kd values for Np(V) werenear 0 ml/g measured at pH values near 2 for all solids, generally ranged from 50 to 100 ml/g forthe granite and clay samples at pH values near 7 to 8, and varied between 200 and 300 ml/g formost of the mineral specimens at high pH values. At pH values from approximately 2 to 4, the Kdvalues measured for the feldspar minerals were typically in the region of 10 to 30 ml/g.
For the experiments conducted with hornblende, the Kd values ranged from 200 to 250 ml/g atpH 8.1 and 290 to 350 ml/g at pH 11.2. Because hornblende contains Fe(II), Torstenfelt et al.(1988) speculated that these high Kd values might be affected by surface-mediated heterogeneousreduction and sorption reactions on this Fe(II)-containing silicate mineral. For example,autoradiography conducted by Beall et al. (1980) indicate that the sorption of Np-237(V) on a freshsurface of granite in aerated groundwater shows a strong correlation to the Fe(II)-containingminerals (pyrite and biotite) in the granite. Studies by Susak et al. (1983) and Meyer et al. (1984)indicate that Fe(II)-containing geologic materials are able to reduce the concentrations of dissolvedneptunium and increase the concentrations of dissolved and sorbed Np(IV). Susak et al. (1983)investigated the reduction of Np(VI) in the presence of olivine [(Fe(II),Mg)2SiO3]. Susak et al.proposed the following sequence of reactions for the reduction and subsequent retardation ofneptunium:
NpO22+ + 4 H+ 6 NpVI(adsorbed) + 2 H2O
NpVI (adsorbed) + [Fe(II)2SiO3] 6 NpV (adsorbed) + [Fe(II,III)2SiO3]
NpV (adsorbed) + 2 H2O 6 NpO2+ + 4 H+.
Nakayama et al. (1988) used high performance liquid chromatography to study the migration ofNp(V) in columns packed with quartz. The distribution coefficient derived for Np(V) from thesecolumn experiments decreased with increasing ionic strength and increased with increasing pH.
Keeney-Kennicutt et al. (1984) studied the sorption of Np(V) on several minerals in dilute aqueoussolutions and seawater. When normalized to the amount of adsorption per unit solid surface area,their results indicated that Np(V) sorbs on the following minerals with decreasing affinity in thesequence
aragonite $ calcite > goethite >> MnO2 . clays
Their measured dissolved/adsorbed ratios were constant over the range of 10-13 to 10-7 M Np(V). Contrary to speculation at that time, their results indicated that Np(V) did not behave as a simplemonovalent ion with a low affinity for surfaces.
Relyea and Martin (1982) studied the adsorption of Np-237 on kaolinite over a range ofconcentrations, pH, electrolyte strengths, and time. The adsorption of 237Np was determined to bestrongly affected by pH. Adsorption of Np-237 on kaolinite was weak at pH values less than pH 5,but increased rapidly from pH 5 to 7.5. At pH values greater than 7.5, the adsorption of Np-237was approximately 100 percent.

G.7
G.2 Kd Studies of Neptunium on Crushed Rock Materials
Numerous studies have been conducted for the sorption of neptunium on crushed rock as part ofnational research programs to investigate the feasibility of geological disposal of high-levelradioactive waste (HLW). Some of these studies are listed in Table G.2.
Table G.3 Neptunium adsorption studies on crushed rock and related materials.
Geologic Material References
Basalt Meyer et al., (1984, 1983, 1985a, 1985b), Susak et al. (1983), Barneyet al. (1983), Salter et al. (1981a), Ames et al. (1981), Ames andMcGarrah (1980)
Basalt secondary mineralassemblage from vesicles,vugs, and fractures
Salter et al. (1981b)
Diabase Andersson et al. (1982)
Gneiss Andersson et al. (1982)
Granite Torstenfelt et al. (1988), Andersson et al. (1982), Beall et al. (1980),Allard (1979)
Sandstone Barney (1982)
Tuff Baston et al. (1997), Kung and Triay (1994), Barney (1982)

APPENDIX H
Radium Adsorption Studies
H.2
Appendix H
Radium Adsorption Studies
The Kd values listed in the following pure mineral/oxide and crushed rock studies are notnecessarily relevant to the mobility and sorption of radium in soils. However, the studies andassociated references are listed below for completeness. The potential value of these references andthe sorption processes that were investigated is left to the reader. The references cited in thisappendix are listed in the main reference list in Chapter 6.
H.1 Adsorption Studies of Radium on Single Mineral Phases
Several studies have been conducted for the adsorption of radium on pure mineral and oxide phases. These studies and the references they cite may be useful to the reader. Some of these studies arelisted in Table H.1.
The results of these studies demonstrate that the adsorption of radium on minerals and oxide phasesis dependent on pH, as expected for cations, and decreases with increasing concentrations ofcompeting ions. For example, Tachi et al. (2001) used batch sorption experiments to study thesorption of radium on bentonite and purified smectite as a function of pH, ionic strength, andliquid-to-solid ratio. The measured Kd values ranged from 102 to more than 104 ml/g, and weredependent on ionic strength and pH. Tachi et al. (2001) found that most of the sorbed radium wasdesorbed by a 1 mol/l KCl solution. Modeling results indicated that radium sorption on thesmectite was dominated by ion exchange at layer sites of smectite and may increase at the higher pHvalues from surface complexation at edge sites. Radium sorption on bentonite was explained asbeing due to ion exchange with smectite, and its pH dependency resulted from changes in calciumconcentrations caused from dissolution and precipitation of calcite.
Koulouris (1995) used batch and column techniques to investigate the sorption of Ra-226 on MnO2. Radium sorption was studied as a function of initial Ra-226 concentrations, pH, chemical species,and contact time. Koulouris (1995) observed no dependency in Ra-226 sorption on MnO2 as afunction of pH at values greater than 3.6. Radium sorption was essentially constant atapproximately 50 to 60 percent over the pH range 3.6 to 12.0, and decreased from 50 at pH 3.6to 18 percent at pH 2.7. Koulouris (1995) attributed the decrease in Ra-226 sorption to a low pHzpcfor the MnO2 material used in the experiments. Essentially no dependency was observed in Ra-226sorption on MnO2 as a function of initial Ra-226 concentrations and chemical species.
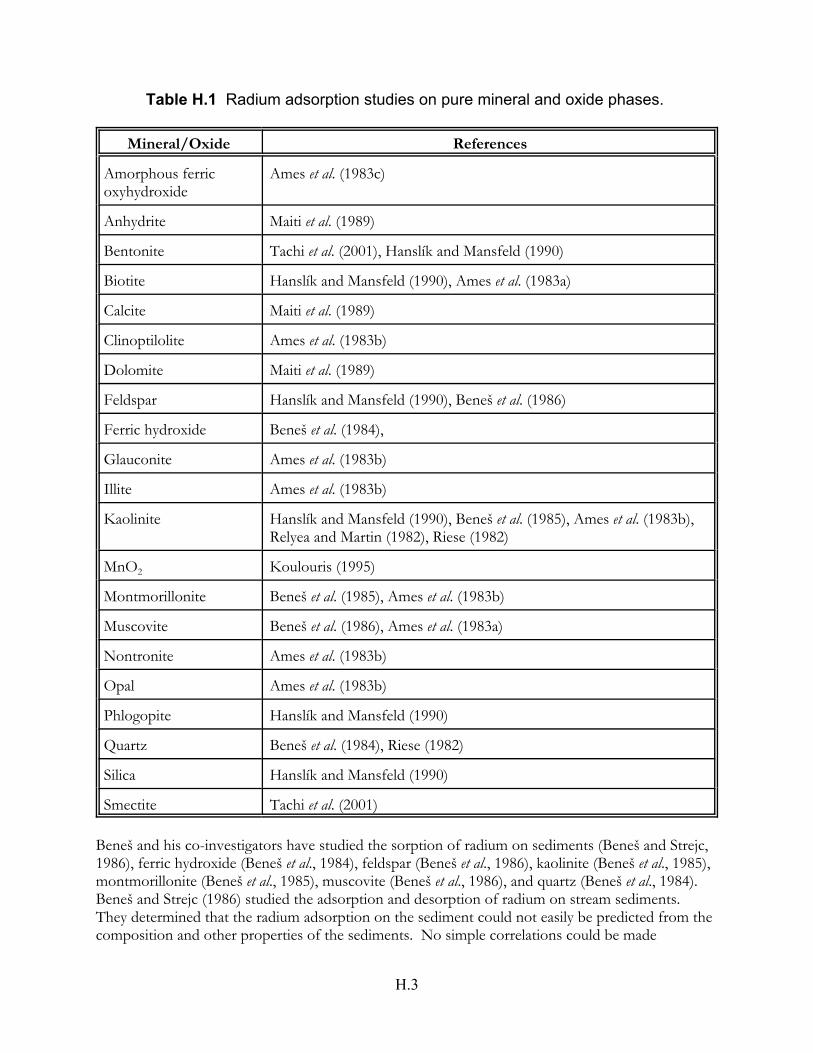
H.3
Table H.1 Radium adsorption studies on pure mineral and oxide phases.
Mineral/Oxide References
Amorphous ferricoxyhydroxide
Ames et al. (1983c)
Anhydrite Maiti et al. (1989)
Bentonite Tachi et al. (2001), Hanslík and Mansfeld (1990)
Biotite Hanslík and Mansfeld (1990), Ames et al. (1983a)
Calcite Maiti et al. (1989)
Clinoptilolite Ames et al. (1983b)
Dolomite Maiti et al. (1989)
Feldspar Hanslík and Mansfeld (1990), Beneš et al. (1986)
Ferric hydroxide Beneš et al. (1984),
Glauconite Ames et al. (1983b)
Illite Ames et al. (1983b)
Kaolinite Hanslík and Mansfeld (1990), Beneš et al. (1985), Ames et al. (1983b),Relyea and Martin (1982), Riese (1982)
MnO2 Koulouris (1995)
Montmorillonite Beneš et al. (1985), Ames et al. (1983b)
Muscovite Beneš et al. (1986), Ames et al. (1983a)
Nontronite Ames et al. (1983b)
Opal Ames et al. (1983b)
Phlogopite Hanslík and Mansfeld (1990)
Quartz Beneš et al. (1984), Riese (1982)
Silica Hanslík and Mansfeld (1990)
Smectite Tachi et al. (2001)
Beneš and his co-investigators have studied the sorption of radium on sediments (Beneš and Strejc,1986), ferric hydroxide (Beneš et al., 1984), feldspar (Beneš et al., 1986), kaolinite (Beneš et al., 1985),montmorillonite (Beneš et al., 1985), muscovite (Beneš et al., 1986), and quartz (Beneš et al., 1984). Beneš and Strejc (1986) studied the adsorption and desorption of radium on stream sediments. They determined that the radium adsorption on the sediment could not easily be predicted from thecomposition and other properties of the sediments. No simple correlations could be made

H.4
regarding the extent of radium sorption and the specific surface area, organic matter, mineral oxidecoatings, or other sediment components. As previously noted, Beneš and Strejc (1986) observedhowever that in the presence of dissolved sulfate, a strong dependency existed between the uptakeof radium by the sediment and the barite content of the sediments. Beneš and his co-investigatorsalso indicated that the adsorption of radium was also strongly dependent on pH (Beneš et al., 1984). For example, the maximum adsorption of radium on ferric hydroxide occurred at pH values of 7and greater, and radium adsorption decreased to almost negligible values at pH values less than 6. The pH dependency of radium adsorption on kaolinite was less than that determined for ferrichydroxide and quartz, and radium sorbed to a significant extent on kaolinite at pH values less than 6.
Riese (1982) studied the adsorption of radium on quartz and kaolinite. His measurements indicatedthat radium was 50 percent adsorbed on quartz at pH 6 and 50 percent adsorbed on kaolinite atpH 5. The adsorption of radium on quartz and kaolinite was also found to decrease with increasingconcentrations of dissolved calcium. Results from Riese (1982), as shown on p. 386 of Langmuir(1997), for the adsorption of radium on kaolinite at 25"C in 0.01 M NaNO3 solution containing10-4 M calcium indicate that significant adsorption of radium occurs on kaolinite over the pHrange 3 to 9. The adsorption of radium increases with increasing pH, especially at pH values greaterthan 6.
Lowson and Evans (1984) measured the adsorption of radium in a 0.1 M NaNO3 solution onalumina, kaolinite, montmorillonite, and illite. The adsorption of radium on alumina and kaolinitewas low at pH values less than 7, but increased rapidly at pH values greater than 8. Montmorilloniteand illite were found to be stronger adsorbents for radium than alumina and kaolinite. Montmorillonite and illite exhibited significant adsorption (about 20 percent) for radium at pH 3,and the adsorption of radium on these two minerals increased approximately at a linear rate withincreasing pH at higher pH values.
H.2 Kd Studies of Radium on Crushed Rock Materials
Numerous studies have been conducted for the sorption of radium on crushed rock as part ofnational research programs to investigate the feasibility of geological disposal of high-levelradioactive waste (HLW). Some of these studies are listed in Table H.2. Because elevatedtemperatures will exist in the near vicinity of the waste canisters and repository in general, many ofthese studies were conducted over a range temperatures above ambient to determine the extent ofradionuclide adsorption as a function of temperature and with respect to changes in groundwaterchemistry (e.g., pH and Eh) and mineralogy that will occur with increasing temperature.
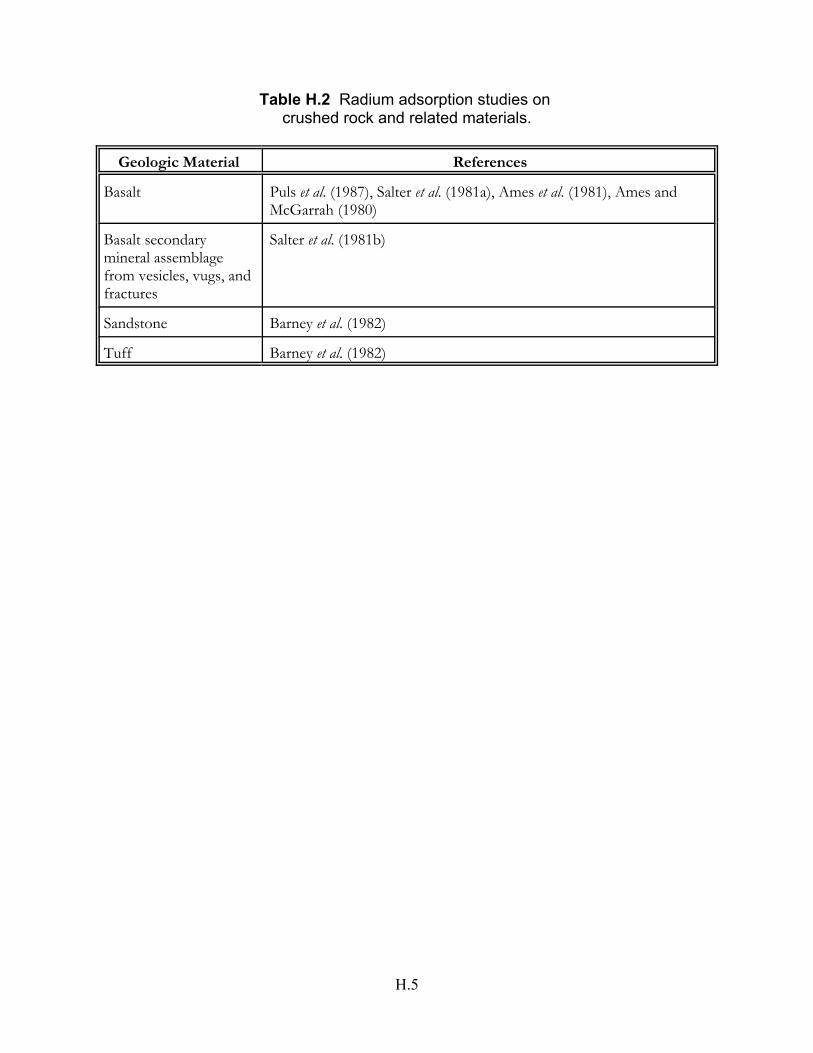
H.5
Table H.2 Radium adsorption studies on crushed rock and related materials.
Geologic Material References
Basalt Puls et al. (1987), Salter et al. (1981a), Ames et al. (1981), Ames andMcGarrah (1980)
Basalt secondarymineral assemblagefrom vesicles, vugs, andfractures
Salter et al. (1981b)
Sandstone Barney et al. (1982)
Tuff Barney et al. (1982)
APPENDIX I
Technetium Adsorption Studies

I.2
Appendix I
Technetium Adsorption Studies
The Kd values listed in the following pure mineral/oxide and crushed rock studies are notnecessarily relevant to the mobility and sorption of technetium in soils. However, the studies andassociated references are listed below for completeness. The potential value of these references andthe sorption processes that were investigated is left to the reader. The references cited in thisappendix are listed in the main reference list in Chapter 6.
I.1 Adsorption Studies of Technetium on Single Mineral Phases
Numerous technetium adsorption studies have been conducted of technetium on pure mineral,oxide phases, and other geologic-related materials. Like those for iodine, many of these studies wereconducted because of extensive research interest in developing getters (adsorbents) that could beadded to waste streams and tailored barriers for removal and/or immobilization of dissolved iodine[e.g., see Zhang et al. (2000), Balsley et al. (1997), Gu and Dowlen (1997), and others]. High sorptionof technetium is typically observed for minerals, such as sulfide minerals (e.g., chalcopyrite, pyrite),that have the capacity to reduce Tc(VII) to Tc(IV). For example, Strickert et al. (1980) measured Kdvalues in the range 100 to 2,000 ml/g for sorption of technetium on sulfide minerals such asbournonite, chalcopyrite, pyrite, tennantite, and tetrahedrite. Technetium Kd values were howeverless than 1 ml/g for non-sulfide materials, such as anhydrite, basalt, granite, and tuff. Sorptionstudies for technetium on single mineral phases and the references they cite may be useful to thereader. Some of these studies are listed in Tables I.1a and I.1b.
I.2 Kd Studies of Technetium on Crushed Rock Materials
Numerous studies have been conducted for the sorption of technetium on crushed rock as part ofnational research programs to investigate the feasibility of geological disposal of high-levelradioactive waste (HLW). Some of these studies are listed in Table I.2.
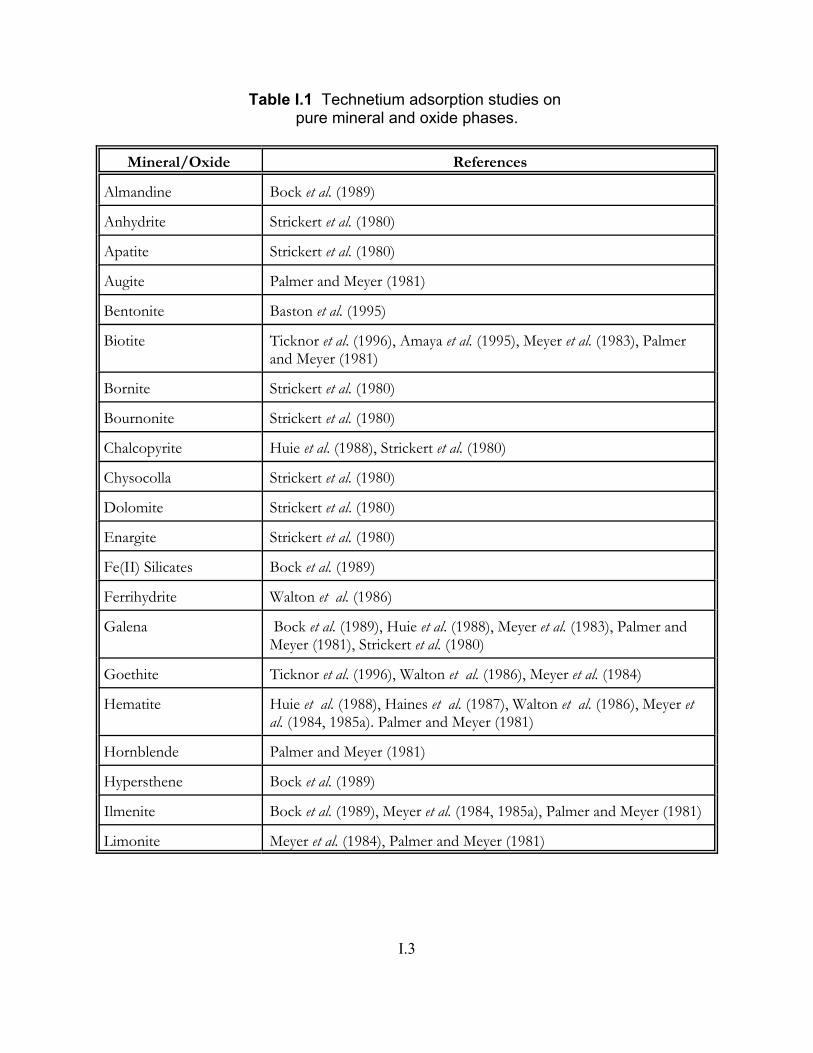
I.3
Table I.1 Technetium adsorption studies on pure mineral and oxide phases.
Mineral/Oxide References
Almandine Bock et al. (1989)
Anhydrite Strickert et al. (1980)
Apatite Strickert et al. (1980)
Augite Palmer and Meyer (1981)
Bentonite Baston et al. (1995)
Biotite Ticknor et al. (1996), Amaya et al. (1995), Meyer et al. (1983), Palmerand Meyer (1981)
Bornite Strickert et al. (1980)
Bournonite Strickert et al. (1980)
Chalcopyrite Huie et al. (1988), Strickert et al. (1980)
Chysocolla Strickert et al. (1980)
Dolomite Strickert et al. (1980)
Enargite Strickert et al. (1980)
Fe(II) Silicates Bock et al. (1989)
Ferrihydrite Walton et al. (1986)
Galena Bock et al. (1989), Huie et al. (1988), Meyer et al. (1983), Palmer andMeyer (1981), Strickert et al. (1980)
Goethite Ticknor et al. (1996), Walton et al. (1986), Meyer et al. (1984)
Hematite Huie et al. (1988), Haines et al. (1987), Walton et al. (1986), Meyer etal. (1984, 1985a). Palmer and Meyer (1981)
Hornblende Palmer and Meyer (1981)
Hypersthene Bock et al. (1989)
Ilmenite Bock et al. (1989), Meyer et al. (1984, 1985a), Palmer and Meyer (1981)
Limonite Meyer et al. (1984), Palmer and Meyer (1981)

I.4
Continuation of Table I.1.
Mineral/Oxide References
Löllingite (Loellingite) Bock et al. (1989)
Magnetite Byegård et al. (1992), Bock et al. (1989), Lieser and Bauscher (1988), Haines et al. (1987), Meyer et al. (1984), Palmer and Meyer (1981)
Microcline Meyer et al. (1984, 1985a)
Molybdenite Huie et al. (1988)
Montmorillonite Ticknor et al. (1996)
Mordenite Meyer et al. (1985a)
Olivine Bock et al. (1989), Palmer and Meyer (1981)
Plagioclase Amaya et al. (1995)
Potassium Feldspar Amaya et al. (1995)
Pyrite Bock et al. (1989), Lieser and Bauscher (1988), Huie et al. (1988), Meyer et al. (1983), Palmer and Meyer (1981), Strickert et al. (1980)
Pyrrhotite Bock et al. (1989), Lieser and Bauscher (1988)
Quartz Ticknor et al. (1996), Amaya et al. (1995), Winkler et al. (1988)
Smectite Winkler et al. (1988)
Stibnite Zhuang et al. (1995), Bock et al. (1989), Huie et al. (1988)
Tennantite Strickert et al. (1980)
Tetrahedrite Strickert et al. (1980)
Tiemannite Zhuang et al. (1995)
Witherite Strickert et al. (1980)

I.5
Table I.2 Technetium adsorption studies on crushed rock and related materials.
Geologic Material References
Alluvium Erdal et al. (1979)
Argillite Erdal et al. (1979)
Basalt Wood et al. (1987), Meyer et al. (1984, 1985), Barney et al. (1983),Palmer and Meyer (1981), Salter et al. (1981a), Ames et al. (1981),Strickert et al. (1980), Ames and McGarrah (1980)
Basalt secondarymineral assemblagefrom vesicles, vugs, andfractures
Salter et al. (1981b)
Chalk Strickert et al. (1980)
Gabbro Vandergraaf et al. (1984)
Granite Ticknor et al. (1996), Amaya et al. (1995), Eriksen and Cui (1991),Vandergraaf et al. (1984), Strickert et al. (1980), Allard et al. (1979a,1979b)
Granodiorite Baston et al. (1995)
Limestone Strickert et al. (1980)
Sandstone Bradbury and Stephen (1985), Barney (1982)
Shale Ho (1992), Strickert et al. (1980)
Siltstone Strickert et al. (1980)
Tuff Amaya et al. (1995), Baston et al. (1995), Barney (1982), Strickert et al.(1980), Erdal et al. (1979)