understanding workplace screening and surveillance programs chris martin, md, msc, frcpc...
TRANSCRIPT

Understanding Workplace Screening and Surveillance Programs
Chris Martin, MD, MSc, [email protected]
Professor and DirectorInstitute of Occupational and Environmental Health
West Virginia University School of Medicine
Outline
I. Assessing test performanceII. Applications of testsIII. Assessing test performance (more)IV. Levels of preventionV. ScreeningVI. Surveillance

I. Test Performance
Many tests yield continuous results, we must dichotomize into + and –
Compare test against the truth from a “gold standard” using 2 x 2 table
Gold standard is The best test we have Impractical

2 x 2 or Contingency Table
Test Result Diseased Non-diseased Total
Positive a b a + b
Negative c d c + d
Total a + c b + d a + b + c + d
Gold Standard Result

2 x 2 or Contingency Table
Test Result Diseased Non-diseased Total
Positive a b a + b
Negative c d c + d
Total a + c b + d a + b + c + d
Gold Standard Result
Prevalence or pre-test likelihood of disease = a + c / a + b + c + d

2 x 2 or Contingency Table
Test Result Diseased Non-diseased Total
Positive a b a + b
Negative c d c + d
Total a + c b + d a + b + c + d
Gold Standard Result
Sensitivity = a / a + c

2 x 2 or Contingency Table
Test Result Diseased Non-diseased Total
Positive a b a + b
Negative c d c + d
Total a + c b + d a + b + c + d
Gold Standard Result
Specificity = d / b + d
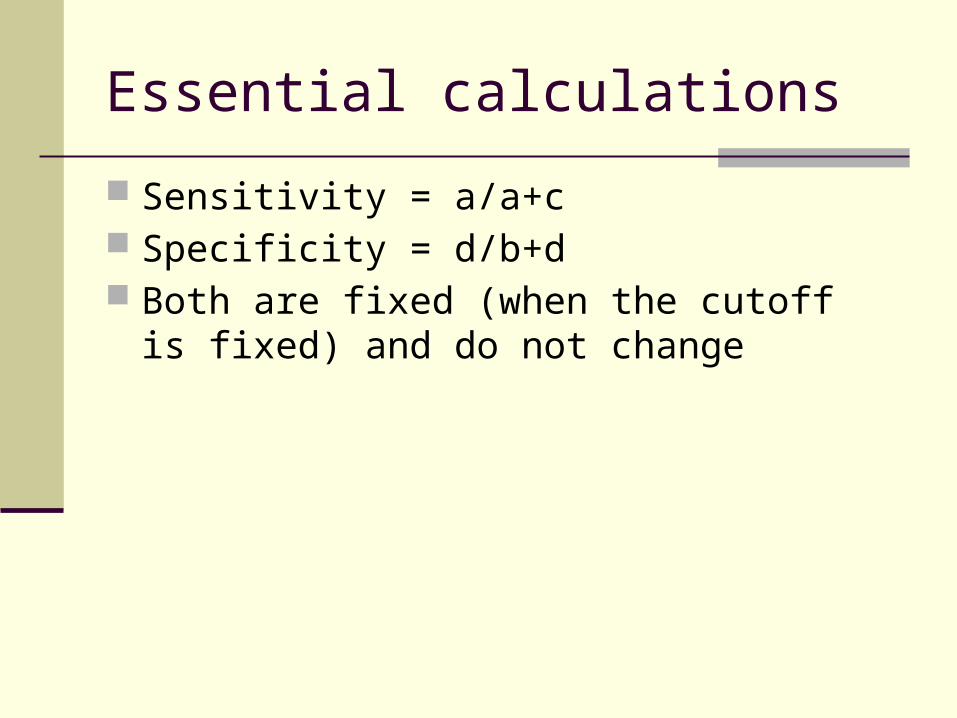
Essential calculations
Sensitivity = a/a+c Specificity = d/b+d Both are fixed (when the cutoff is fixed)
and do not change

The trade-off…
If increase sensitivity, must decrease specificity, and vice versa
Consider an extreme example:

Martin the Master Clinician
Martin says: Dead Alive Total
Dead a b a + b
Alive c d c + d
Total a + c b + d a + b + c + d
True Vital Status

Figure 7-3 Overlap in values of randomly taken tests in a population where most of the people are healthy (curve on the left), but some of the people are diseased (curve on the right). A person with a level of calcium below point A would be unlikely to have hyperparathyroidism. A person with a level of calcium above point B would be likely
to have an abnormality of calcium metabolism, possibly hyperparathyroidism. A person with a level of calcium between point A and point B may or may not have an abnormality of calcium metabolism. (Note: The normal range of calcium depends on the method used in a specific laboratory. In some laboratories, the range is 8.5 to
10.5 mg/dL. In others, as in this illustration, it is 9 to 11 mg/dL.)
Downloaded from: StudentConsult (on 26 September 2009 02:00 PM)
© 2005 Elsevier
A further problem:

Where do we place the cutoff?
We need to pick a number to split people into ‘normal’ and ‘abnormal’

Cutoff value
HealthyDisease
False negatives False positives
Test - Test +

An inexpensive screening test for a disease is available through analysis of venous blood. The distributions of blood concentrations for persons with and without the disease are depicted in the graph. The disease is irreversible and fatal if not discovered and treated early. Which of the following letters represents the most appropriate cutoff point between normal and abnormal?
1. A2. B3. C4. D5. E
Sample USMLE Question
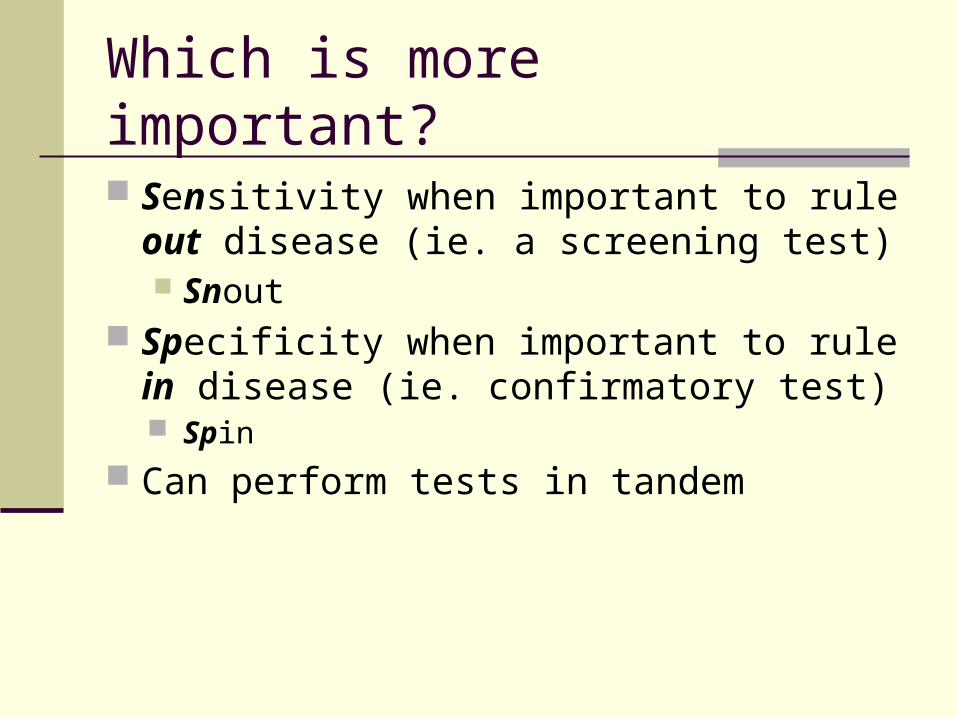
Which is more important?
Sensitivity when important to rule out disease (ie. a screening test) Snout
Specificity when important to rule in disease (ie. confirmatory test) Spin
Can perform tests in tandem

II. Applications of Tests
Screening Surveillance Diagnosis

ScreeningSurveillance

ScreeningSurveillance
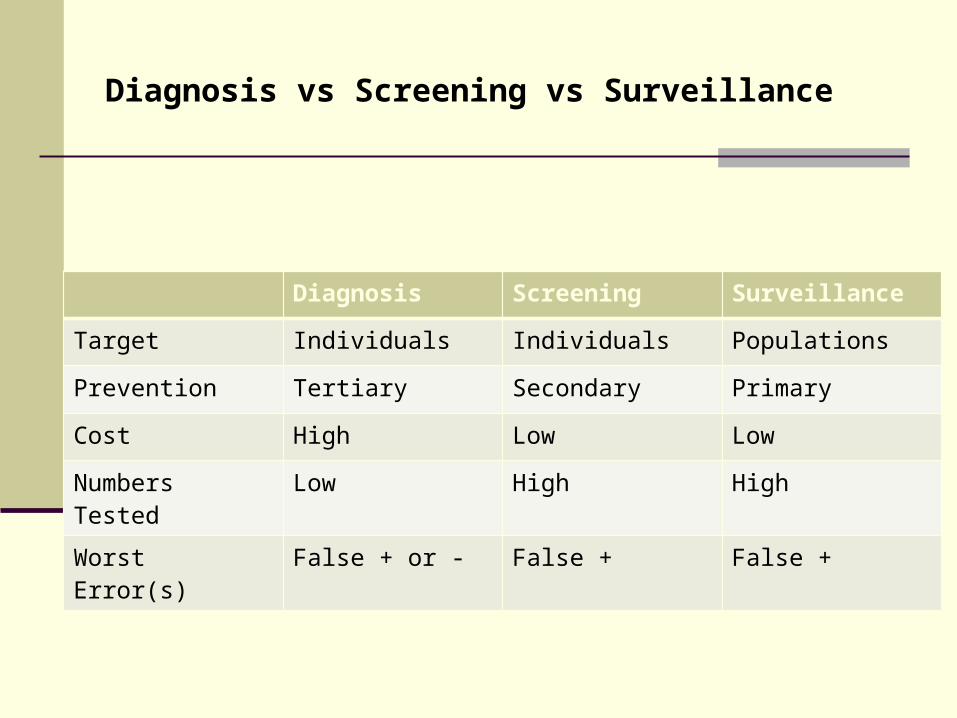
Diagnosis vs Screening vs Surveillance
Diagnosis Screening Surveillance
Target Individuals Individuals Populations
Prevention Tertiary Secondary Primary
Cost High Low Low
Numbers Tested Low High High
Worst Error(s) False + or - False + False +

Screening and Diagnosis
III. Assessment of Tests
Also helpful to think about the proportion of all test results that are correct

2 x 2 or Contingency Table
Test Result
Diseased Non-diseased
Total
Positive a b a + b
Negative c d c + d
Gold Standard Result
+ Predictive value = a / a + b

2 x 2 or Contingency Table
Test Result
Diseased Non-diseased
Total
Positive a b a + b
Negative c d c + d
Gold Standard Result
- Predictive value = d / c + d
Essential calculations
Positive predictive value = a/a+b Negative predictive value = d/c+d These reflect how well the test performs
and they vary depending on how you apply the test

Martin the Master Clinician
Martin says: Dead Alive Total
Dead a b a + b
Alive c d c + d
Total a + c b + d a + b + c + d
True Vital Status
….examines the COHN conference attendees

Martin the Master Clinician
Martin says: Dead Alive Total
Dead a b a + b
Alive c d c + d
Total a + c b + d a + b + c + d
True Vital Status
….examines cadavers in the morgue
Note: How I examined patients did not change!
Example
Consider use of CK to diagnose MI Same test is performed in two
different groups:1. CCU admissions2. General Hospital admissions

CCU
CK MI + MI - Total
< 80 215 16 231
> 80 15 114 129
Total 230 130 360
Prevalence is 230/360 = 64%
Sens. = 215/230 = 93% +PV = 215/231 = 93%Spec. = 114/130 = 88% - PV = 114/129 = 88%

General Hospital
CK MI + MI - Total
< 80
> 80
Total 2300
Let’s make prevalence is 10% while keeping sensitivity (93%) and specificity (88%) the same.
(Note: Because of rounding, calculations may be off by 1-2 patients.)

General Hospital
CK MI + MI - Total
< 80
> 80
Total 230 2070 2300
We will pick a total of 2300 total patients.
Let’s make prevalence is 10% while keeping sensitivity (93%) and specificity (88%) the same.
a + c / total = 10%, so
And 2300 – 230 = 2070

General Hospital
CK MI + MI - Total
< 80 214
> 80 16
Total 230 2070 2300
Sensitivity (a/a + c) = 93%, a = 0.93 x 230 = 214
c = 230 – 214 = 16

General Hospital
CK MI + MI - Total
< 80 214 248
> 80 16 1822
Total 230 2070 2300
Specificity (d/b + d) = 88%, d = 0.88 x 2070 = 1822
b = 2070 – 1822 = 248

General Hospital
CK MI + MI - Total
< 80 214 248 462
> 80 16 1822 1838
Total 230 2070 2300
Positive predictive value now 214/462 = 46%
(In CCU, it was 93%)

General Hospital
CK MI + MI - Total
< 80 214 248 462
> 80 16 1822 1838
Total 230 2070 2300
Negative predictive value now 1822/1838 = 99%
(In CCU, it was 88%)

*Key Point*
The predictive value of a test depends on the prevalence or pre-test likelihood of disease
This is of tremendous clinical significance!

Tests with very high false positive results
Carpal Tunnel Syndrome in nerve conduction studies About 20% in asymptomatic general
population MRI of any joint or spine!
Herniated discs seen in 30% of asymptomatic people in 40’s
Rotator cuff tear > 50% in asymptomatic people over 80 years
Never order a test unless you know what you will do a positive result!

IV. Levels of Prevention
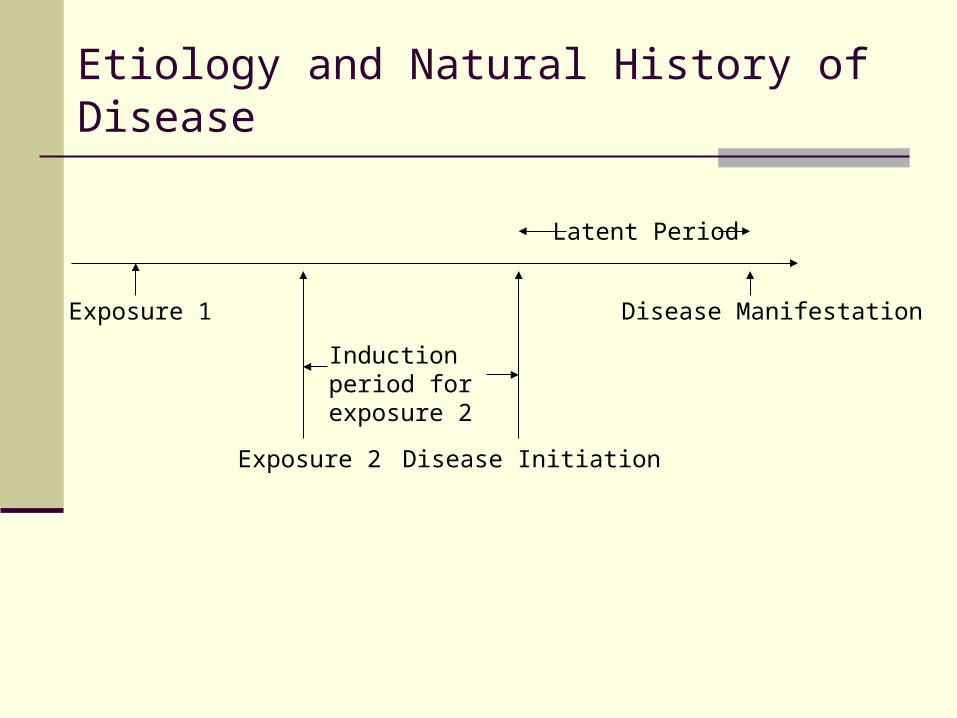
Exposure 1
Exposure 2 Disease Initiation
Disease Manifestation
Latent Period
Induction period for exposure 2
Etiology and Natural History of Disease

Exposure 1
Exposure 2 Disease Initiation
Disease Manifestation
Latent Period
Induction period for exposure 2
Primary Prevention
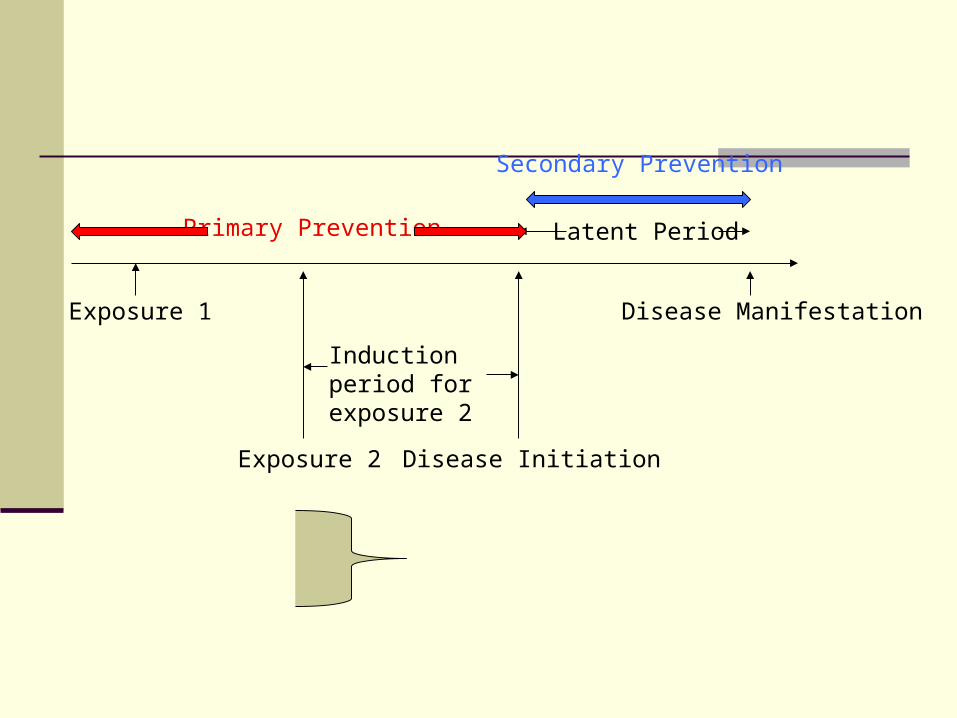
Exposure 1
Exposure 2 Disease Initiation
Disease Manifestation
Latent Period
Induction period for exposure 2
Primary Prevention
Secondary Prevention

Exposure 1
Exposure 2 Disease Initiation
Disease Manifestation
Latent Period
Induction period for exposure 2
Primary Prevention
Secondary Prevention
Tertiary Prevention

V. Screening
Attempt to identify disease earlier (before symptoms develop)
Screening Case finding

Requirements of Disease
1. Outcome must be serious and justify use of resources
Example: congenital hypothyroidism 2. Effective therapy3. Prevalence must be sufficiently high
Most recommendations are based on this consideration (Example: Colonoscopy at 50)
4. Must understand natural history of disease.
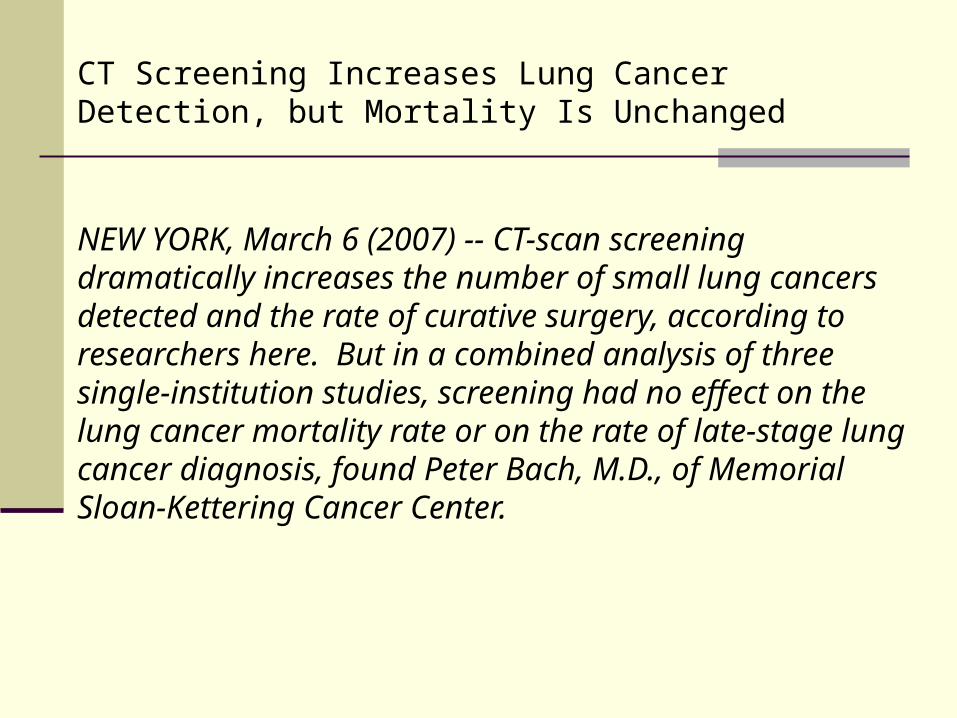
CT Screening Increases Lung Cancer Detection, but Mortality Is Unchanged
NEW YORK, March 6 (2007) -- CT-scan screening dramatically increases the number of small lung cancers detected and the rate of curative surgery, according to researchers here. But in a combined analysis of three single-institution studies, screening had no effect on the lung cancer mortality rate or on the rate of late-stage lung cancer diagnosis, found Peter Bach, M.D., of Memorial Sloan-Kettering Cancer Center.

Test Errors in Screening
Disease Symptoms DeathBegins
Caution – bias ahead
Three forms of bias can occur when evaluating screening tests:
1. Volunteer bias2. Lead time bias3. Length bias
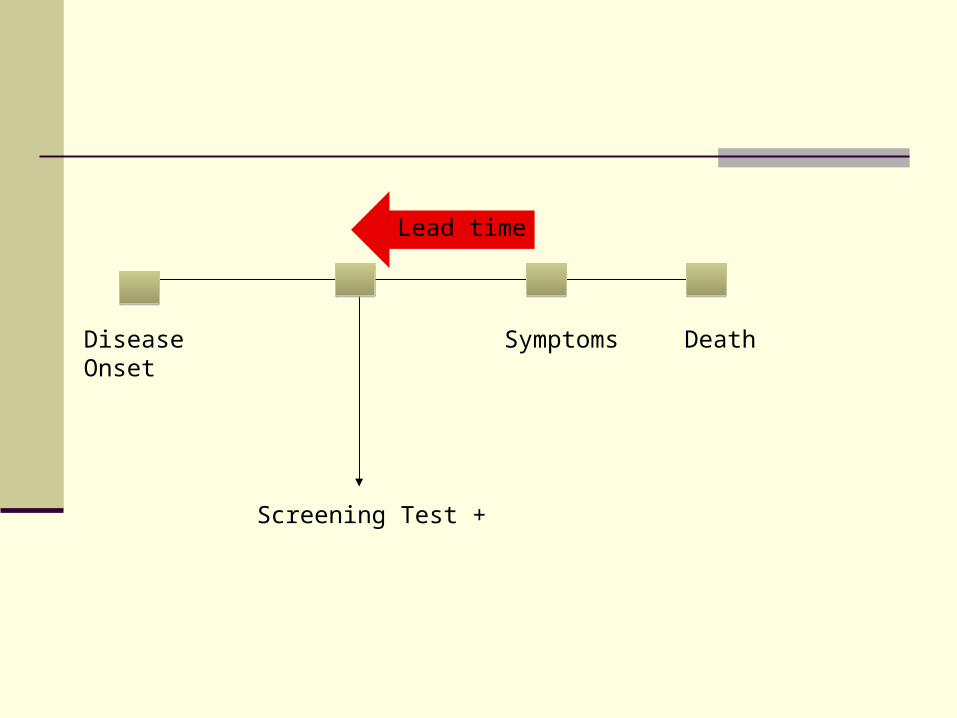
Disease Onset
Screening Test +
Symptoms Death
Lead time

Consider two cases of lung cancer
Mr. A:
April, 1995 Nov 1, 1999 May 30, 2000Disease Starts Symptoms DeathAge 55 Age 59 Age 60
Mr. A survived for 7 months after being diagnosed with lung cancer

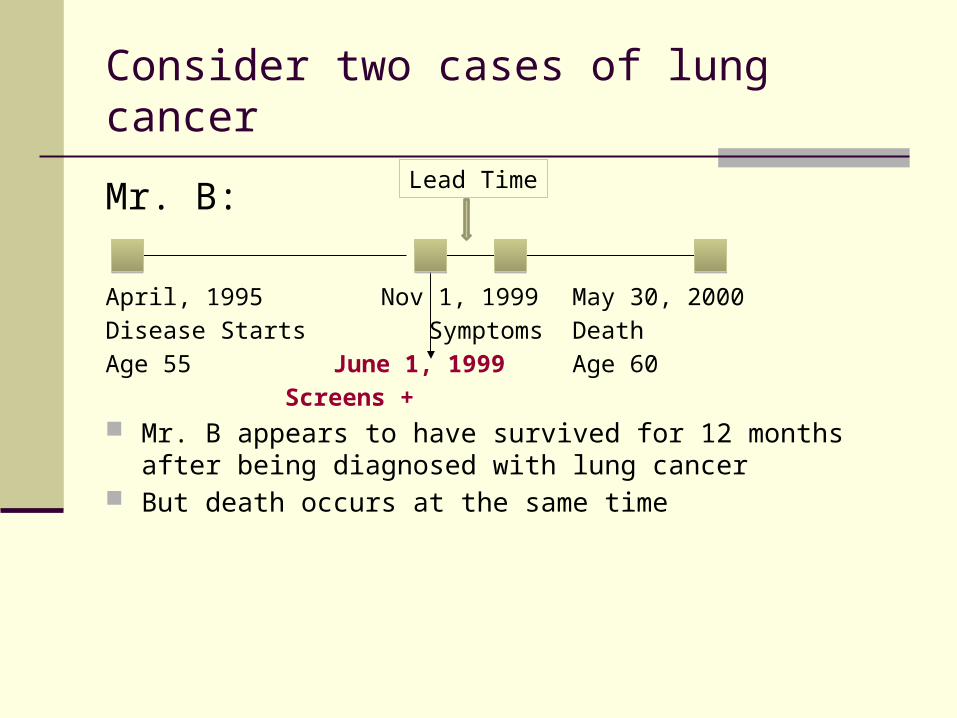
Consider two cases of lung cancer
Mr. B:
April, 1995 Nov 1, 1999 May 30, 2000Disease Starts Symptoms DeathAge 55 June 1, 1999 Age 60
Screens + Mr. B appears to have survived for 12 months after
being diagnosed with lung cancer But death occurs at the same time
Consider two cases of lung cancer
Mr. B:
April, 1995 Nov 1, 1999 May 30, 2000Disease Starts Symptoms DeathAge 55 June 1, 1999 Age 60
Screens + Mr. B appears to have survived for 12 months after
being diagnosed with lung cancer But death occurs at the same time
Lead Time

Length bias
Not all diseases follow the same natural history:

Length Bias
Cases with longer pre-clinical phase will be over-represented in group screening positive
These may also have a more favorable prognosis
Difficult to quantify and control
Overdiagnosis
In theory, screening may identify some cases you would not otherwise know about.
Such cases would die of other causes. Because of all these factors, screening
tests will always identify more cases and identify them earlier, but this is not necessarily helpful.

Requirements of Test
1. Quick, easy, cheap2. Safe and acceptable3. Sensitivity, specificity established

Health Care System Requirements
1. Follow-up available for positive results2. Treatment available3. How to handle findings
Multiphasic Screening
Screening for multiple diseases in the same individual at one visit
Pro: More efficient Con: Increased risk of false positive

VI. Surveillance
The early warning system
When the occupational health infrastructure is working well, appears like a waste of resources
The Paradox of Public Health

Surveillance
prompt identification of shared exposures in order to prevent additional cases.
Four essential components:1. case reporting2. data analysis3. communication of results4. application of findings

Surveillance
Systematic ongoing collection, collation, and analysis of data and the timely dissemination of information to those who need to know so that action can be taken
WHO Definition

Surveillance
Information for Action
Short Definition

“Life Cycle” of Disease Prevention and Control
Surveillance
Epidemiologic Investigation
AppliedResearch
Prevention Measures

Public Health Surveillance Loop
Public
Health Care Providers
Health Agencies
ANALYSIS
REPORTSSUMMARIES
INTERPRETATIONS
RECOMMENDATIONS

Important Attributes of Surveillance Systems
Simplicity Flexibility Data Quality Timeliness Acceptability Sensitivity Positive Predictive Value Stability Representativeness
Updated Guidelines for Evaluating Public Health Surveillance Systems (MMWR) http://www.cdc.gov/mmwr/PDF/rr/.pdf July 27, 2001 Vol 50, No RR-13, pps 1-51
Occupational health surveillance
Must be coordinated with multiple other components in workplace human resources
Identify workers Track workers Take appropriate action
Environmental Health and Safety Identify hazards Remediate hazards
Occupational health surveillance
Diseases focus may be those for which screening not appropriate
Biological monitoring usually not helpful Who proposes them? Source of overexposure? What is substrate medium? Mean less than people think
Summary
At the heart of screening and surveillance is a test
Carefully consider all aspects before implementing
Primary prevention should always be the mainstay