understanding your data set statistics are used to describe data sets gives us a metric in place of...
TRANSCRIPT

Understanding Your Data Set
• Statistics are used to describe data sets
• Gives us a metric in place of a graph
• What are some types of statistics used to describe data sets?– Average, range, variance, standard
deviation, coefficient of variation, standard error

Length
Number Pond Lake
1 34 38
2 78 82
3 48 58
4 24 76
5 64 60
6 58 70
7 34 99
8 66 40
9 22 68
10 44 91
Average= 47.2 68.2
Table 1. Total length (cm) and average length of spotted gar collected from a local farm pond and from a local lake.

• Are the two samples equal?– What about 47.2 and
47.3?
• If we sampled all of the gar in each water body, would the average be different?– How different?
• Would the lake fish average still be larger?
Length
Number Pond Lake
1 34 38
2 78 82
3 48 58
4 24 76
5 64 60
6 58 70
7 34 99
8 66 40
9 22 68
10 44 91
Average= 47.2 68.2

0 20 40 60 80 100
Lake
Pond
Overlap
Range
• Simply the distance between the smallest and largest value
Length (cm)
Figure 1. Range of spotted gar length collected from a pond and a lake. The dashed line represents the overlap in range.

0 20 40 60 80 100
Lake
Pond
Overlap
Length (cm)
• Does the difference in average length (47.2 vs. 68.2) seem to be much as large as before?

Variance
• An index of variability used to describe the dispersion among the measures of a population sample.
• Need the distance between each sample point and the sample mean.

0
20
40
60
80
100
0 2 4 6 8 10
Number
Len
gth
Distance from point to the sample mean
Figure 2. Mean length (cm) of each spotted gar collected from the pond. The horizontal solid line represents the sample mean length.
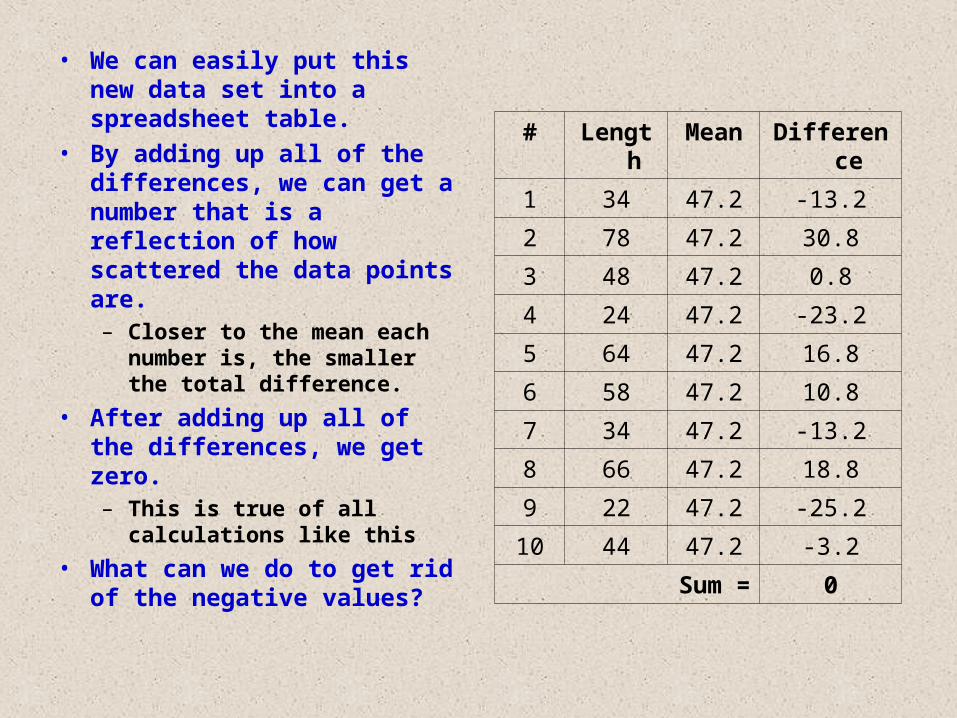
• We can easily put this new data set into a spreadsheet table.
• By adding up all of the differences, we can get a number that is a reflection of how scattered the data points are.– Closer to the mean each
number is, the smaller the total difference.
• After adding up all of the differences, we get zero.– This is true of all
calculations like this
• What can we do to get rid of the negative values?
# Length Mean Difference
1 34 47.2 -13.2
2 78 47.2 30.8
3 48 47.2 0.8
4 24 47.2 -23.2
5 64 47.2 16.8
6 58 47.2 10.8
7 34 47.2 -13.2
8 66 47.2 18.8
9 22 47.2 -25.2
10 44 47.2 -3.2
Sum = 0

Sum of Squares# Length Mean Difference Difference2
1 34 47.2 -13.2 174.24
2 78 47.2 30.8 948.64
3 48 47.2 0.8 0.64
4 24 47.2 -23.2 538.24
5 64 47.2 16.8 282.24
6 58 47.2 10.8 116.64
7 34 47.2 -13.2 174.24
8 66 47.2 18.8 353.44
9 22 47.2 -25.2 635.04
10 44 47.2 -3.2 10.24
Sum = 0 3233.6
Now 3233.6 is a number we can use! This value is called the SUM OF SQUARES.

Back to Variance• Sum of Squares (SOS) will continue to
increase as we increase our sample size.– A sample of 10 replicates that are highly variable
would have a higher SOS than a sample of 100 replicates that are not highly variable.
• To account for sample size, we need to divide SOS by the number of samples minus one (n-1).– We’ll get to the reason (n-1) instead of n later

Calculate Variance (σ2)
σ2 = S2 = (Xi – Xm)2 / (n – 1)
SOS Degrees of Freedom
Variance for Pond = S2 = 3233.6 / 9 = 359.29
0
20
40
60
80
100
0 2 4 6 8 10
Number
Len
gth
Distance from point to the sample mean

More on Variance
• Variance tends to increase as the sample mean increases– For our sample, the largest difference
between any point and the mean was 30.8 cm. Imagine measuring a plot of cypress trees. How large of a difference would you expect (if measured in cm)?
• The variance for the lake sample = 400.18.

Standard Deviation
• Calculated as the square root of the variance.– Variance is not a linear distance (we had to
square it). Think about the difference in shape of a meter stick versus a square meter.
• By taking the square root of the variance, we return our index of variability to something that can be placed on a number line.

Calculate SD
• For our gar sample, the Variance was 359.29. The square root of 359.29 = 18.95.– Reported with the mean as: 47.2 ± 18.95 (mean ± SD).
• Standard Deviation is often abbreviated as σ (sigma) or as SD.
• SD is a unit of measurement that describes the scatter of our data set.– Also increases with the mean
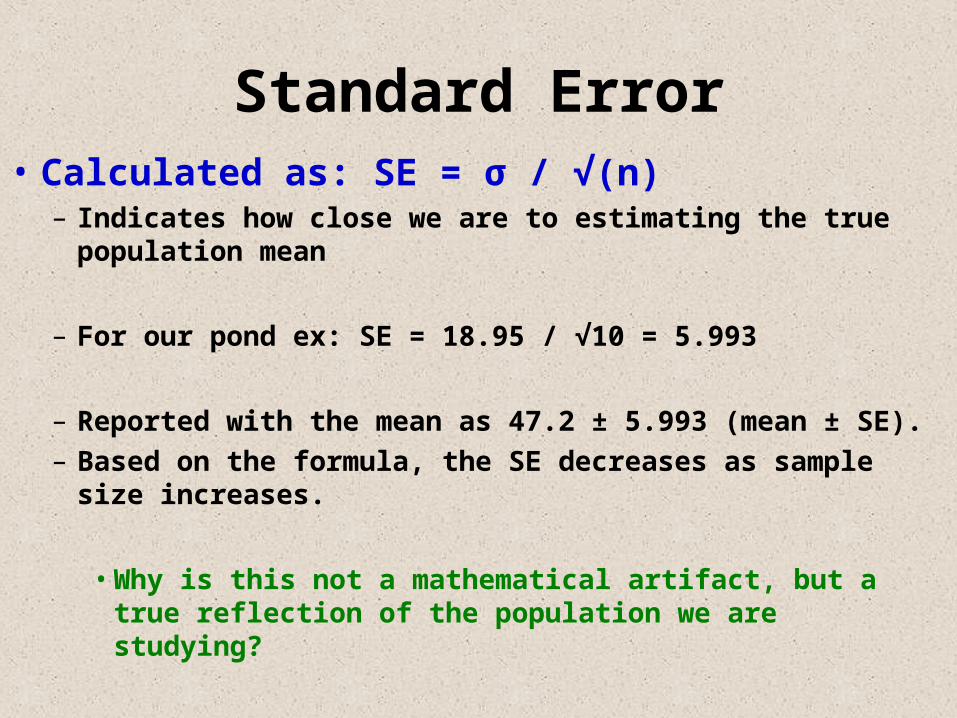
Standard Error• Calculated as: SE = σ / √(n)
– Indicates how close we are to estimating the true population mean
– For our pond ex: SE = 18.95 / √10 = 5.993
– Reported with the mean as 47.2 ± 5.993 (mean ± SE). – Based on the formula, the SE decreases as sample
size increases.
• Why is this not a mathematical artifact, but a true reflection of the population we are studying?

Sample Size
• The number of individuals within a population you measure/observe.– Usually impossible to measure the entire
population
• As sample size increases, we get closer to the true population mean.– Remember, when we take a sample we
assume it is representative of the population.

Effect of Increasing Sample Size
• I measured the length of 100 gar
• Calculated SD and SE for the first 10, then included the next additional 10, and so on until all 100 individuals were included.

Raw Data
0
20
40
60
80
100
120
0 20 40 60 80 100 120Sample Size

SD
40
50
60
70
80
90
0 20 40 60 80 100Sample Size
SD = Square root of the variance(Var = (Xi – Xm) / (n – 1))

SE
40
50
60
70
80
90
0 20 40 60 80 100Sample Size
SE = SD / √(n)

SD
12
14
16
18
20
22
24
0 20 40 60 80 100
SE
0
2
4
6
8
10
0 20 40 60 80 100
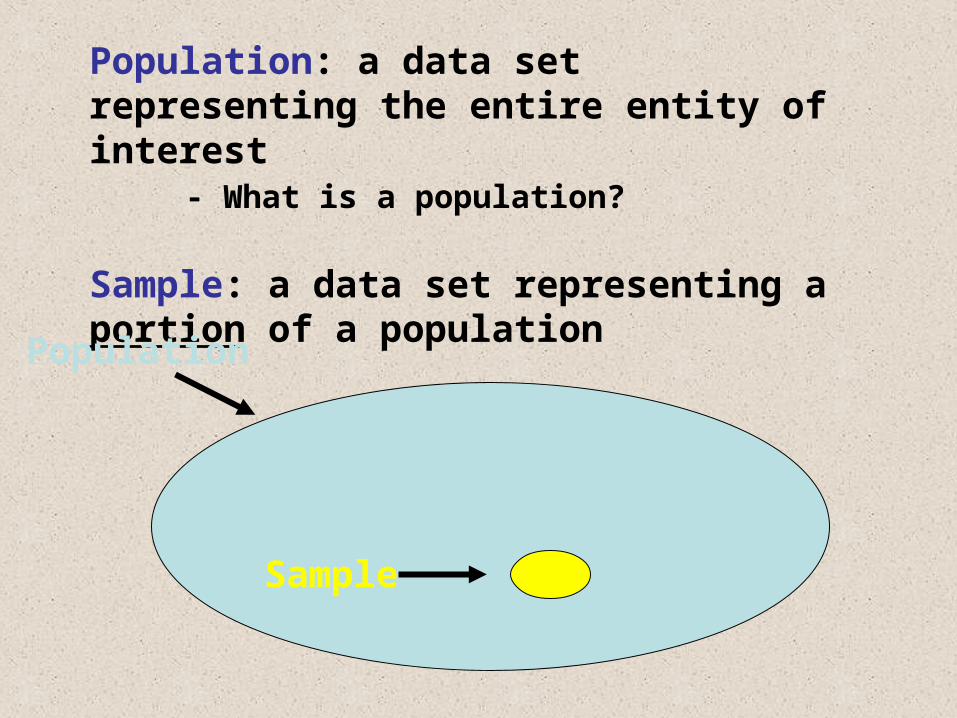
Population: a data set representing the entire entity of interest
- What is a population?
Sample: a data set representing a portion of a population
Population
Sample

Population mean – the true mean for that population
-a single number
Sample mean – the estimated population mean
-a range of values (estimate ± 95% confidenceinterval)
Population
Sample

As our sample size increases, we sample more and more of the population. Eventually, we will have sampled the entire population and our sample distribution will be the population distribution
Increasing sample size

Individual Weight Mean (Weight - Mean)2
1 26 28.17 4.70892 32 28.17 14.66893 25 28.17 10.04894 26 28.17 4.70895 30 28.17 3.34896 30 28.17 3.3489
N=6 169 SOS= 40.8334N-1=5
Variance = (x-x)2
N-1
i=xNNMean = x = Standard Deviation
=
(x-x)2
N-1
Go to Excel
Mean = 169/6 = 28.17
Range = 25 – 32
SOS = 40.83
Variance = 40.83 / 5 = 8.16
Std. Dev. = 40.83/5 = 2.86
Std. Err. = 2.86 / √6 = 1.17
Standard Error = SD
√N

MEAN ± CONFIDENCE INTERVAL
When a population is sampled, a mean value is determined and serves as the point-estimate for that population.
However, we cannot expect our estimate to be the exact mean value for the population.
Instead of relying on a single point-estimate, we estimate a range of values, centered around the point-estimate, that probably includes the true population mean.
That range of values is called the confidence interval.

Confidence Interval
Confidence Interval: consists of two numbers (high and low) computed from a sample that identifies the range for an interval estimate of a parameter.
There is a 5% chance (95% confidence interval) that our interval does not include the true population mean.
y ± (t/0.05)[() / (n)]
28.17 ± 2.29
25.88 30.45

•Hypothesis Testing
–Null versus Alternative Hypothesis
•Briefly:
–Null Hypothesis: Two means are not different
–Alternative Hypothesis: Two means are not similar
•A test statistic based on a predetermined probability (usually 0.05) is used to reject or accept the null hypothesis
< 0.05 then there is a significant difference
> 0.05 then there is NO significant difference

Are Two Populations The Same?
• Boudreaux: ‘My pond is better than your lake, cher’!
• Alphonse: ‘Mais non! I’ve got much bigger fish in my lake’!
• How can the truth be determined?

Two Sample t-test
• Simple comparison of a specific attribute between two populations
• If the attributes between the two populations are equal, then the difference between the two should be zero
• This is the underlying principle of a t-test
• If P-value > 0.05 the means are not significantly different; If P < 0.05 the means are significantly different

Analysis of Variance Can compare two or more means
• Compares means to determine if the population distributions are not similar
• Uses means and confidence intervals much like a t-test
• Test statistic used is called an F statistic (F-test), which is used to get the P value
• If P-value > 0.05 the means are not significantly different; If P< 0.05 the means are significantly different
• Post-hoc test separates the non-similar ones

Analysis of Variance
• Compares means to determine if the population distributions are not similar
• Uses means and confidence intervals much like a t-test
• Test statistic used is called an F statistic (F-test)

Normal Distribution
• Most characteristics follow a normal distribution– For example: height, length, speed, etc.
• One of the assumptions of the ANOVA test is that the sample data is ‘normally distributed.’

Sample Distribution Approaches Normal Distribution With Sample Size
0
2
4
6
8
10
Fre
qu
ency
Population Sample

Sample Distribution Approaches Normal Distribution With Sample Size
0
2
4
6
8
10
Fre
qu
ency
Population Sample

Sample Distribution Approaches Normal Distribution With Sample Size
0
2
4
6
8
10
Fre
qu
ency
Population Sample

Individual Weight Mean (Weight - Mean)2
1 26 28.17 4.70892 32 28.17 14.66893 25 28.17 10.04894 26 28.17 4.70895 30 28.17 3.34896 30 28.17 3.3489
N=6 169 SOS= 40.8334N-1=5
Variance = (x-x)2
N-1
i=xNNMean = x = Standard Deviation =
(x-x)2
N-1
Mean = 169/6 = 28.17
Range = 25 – 32
SOS = 40.83
Variance = 40.83 / 5 = 8.16
Std. Dev. = 40.83/5 = 2.86
Std. Err. = 2.86 / √6 = 1.17
Standard Error = SD
√N

0
20
40
60
80
100
120
0 1 2 3
Pond Lake
Calculate a SOS based on an overall mean (total SOS)
ANOVA – Analysis of Variance

Trtmnt Replicate Length Overall Mean SOSTotal
Pond 1 34 57.7 561.69
Pond 2 78 57.7 412.09
Pond 3 48 57.7 94.09
Pond 4 24 57.7 1135.69
Pond 5 64 57.7 39.69
Pond 6 58 57.7 0.09
Pond 7 34 57.7 561.69
Pond 8 66 57.7 68.89
Pond 9 22 57.7 1274.49
Pond 10 44 57.7 187.69
Lake 1 38 57.7 388.09
Lake 2 82 57.7 590.49
Lake 3 58 57.7 0.09
Lake 4 76 57.7 334.89
Lake 5 60 57.7 5.29
Lake 6 70 57.7 151.29
Lake 7 99 57.7 1705.69
Lake 8 40 57.7 313.29
Lake 9 68 57.7 106.09
Lake 10 91 57.7 1108.89
9040.2
This provides a measure of the overall variance (Total SOS).
0
20
40
60
80
100
120
0 1 2 3
Pond Lake

0
20
40
60
80
100
120
0 1 2 3
Pond Lake
Calculate a SOS based for each treatment (Treatment or Error SOS).

Trtmnt Replicate Length Trtmnt Mean SOSError
Pond 1 34 47.2 174.24
Pond 2 78 47.2 948.64
Pond 3 48 47.2 0.64
Pond 4 24 47.2 538.24
Pond 5 64 47.2 282.24
Pond 6 58 47.2 116.64
Pond 7 34 47.2 174.24
Pond 8 66 47.2 353.44
Pond 9 22 47.2 635.04
Pond 10 44 47.2 10.24
Lake 1 38 68.2 912.04
Lake 2 82 68.2 190.44
Lake 3 58 68.2 104.04
Lake 4 76 68.2 60.84
Lake 5 60 68.2 67.24
Lake 6 70 68.2 3.24
Lake 7 99 68.2 948.64
Lake 8 40 68.2 795.24
Lake 9 68 68.2 0.04
Lake 10 91 68.2 519.84
6835.2
This provides a measure of the reduction of variance by measuring each treatment separately (Treatment or Error SOS).
What happens to Error SOS when the variability w/in each treatment decreases?
0
20
40
60
80
100
120
0 1 2 3
Pond Lake

0
20
40
60
80
100
120
0 1 2 3
Predicted_Pond Predicted_Lake Overall_Avg
Calculate a SOS for each predicted value vs. the overall mean (Model SOS)

Trtmnt Replicate Length Trtmnt Mean Overall Mean SOSModel
Pond 1 34 47.2 57.7 110.25
Pond 2 78 47.2 57.7 110.25
Pond 3 48 47.2 57.7 110.25
Pond 4 24 47.2 57.7 110.25
Pond 5 64 47.2 57.7 110.25
Pond 6 58 47.2 57.7 110.25
Pond 7 34 47.2 57.7 110.25
Pond 8 66 47.2 57.7 110.25
Pond 9 22 47.2 57.7 110.25
Pond 10 44 47.2 57.7 110.25
Lake 1 38 68.2 57.7 110.25
Lake 2 82 68.2 57.7 110.25
Lake 3 58 68.2 57.7 110.25
Lake 4 76 68.2 57.7 110.25
Lake 5 60 68.2 57.7 110.25
Lake 6 70 68.2 57.7 110.25
Lake 7 99 68.2 57.7 110.25
Lake 8 40 68.2 57.7 110.25
Lake 9 68 68.2 57.7 110.25
Lake 10 91 68.2 57.7 110.25
2205
This provides a measure of the distance between the mean values (Model SOS).
What happens to Model SOS when the two means are close together?
What if the means are equal?

Detecting a Difference Between Treatments
• Model SOS gives us an index on how far apart the two means are from each other.– Bigger Model SOS = farther apart
• Error SOS gives us an index of how scattered the data is for each treatment.– More variability = larger Error SOS = more
possible overlap between treatments

Magic of the F-test• The ratio of Model SOS to Error SOS (Model SOS divided
by Error SOS) gives us an overall index (the F statistic) used to indicate the relative ‘distance’ and ‘overlap’ between two means.– A large Model SOS and small Error SOS = a large F statistic. Why
does this indicate a significant difference?
– A small Model SOS and a large Error SOS = a small F statistic. Why does this indicate no significant difference??
• Based on sample size and alpha level (P-value), each F statistic has an associated P-value.– P < 0.05 (Large F statistic) there is a significant difference between
the means– P ≥ 0.05 (Small F statistic) there is NO significant difference

0
5
10
15
20
25
30
35
1 2 3
A
B
A
Showing Results

Regression• For the purposes of this class:
– Does Y depend on X?– Does a change in X cause a change in Y?– Can Y be predicted from X?
• Y= mX + b
100
120
140
160
180
30 40 50 60 70 80
Independent Value
Dep
end
ent
Val
ue
Predicted values
Overall Mean
Actual values

When analyzing a regression-type data set, the first step is to plot the data:
X Y
35 114
45 120
55 150
65 140
75 166
55 138
The next step is to determine the line that ‘best fits’ these points. It appears this line would be sloped upward and linear (straight).
100
120
140
160
180
30 40 50 60 70 80
Independent Value (X)
Dep
end
ent
Val
ue
(Y)
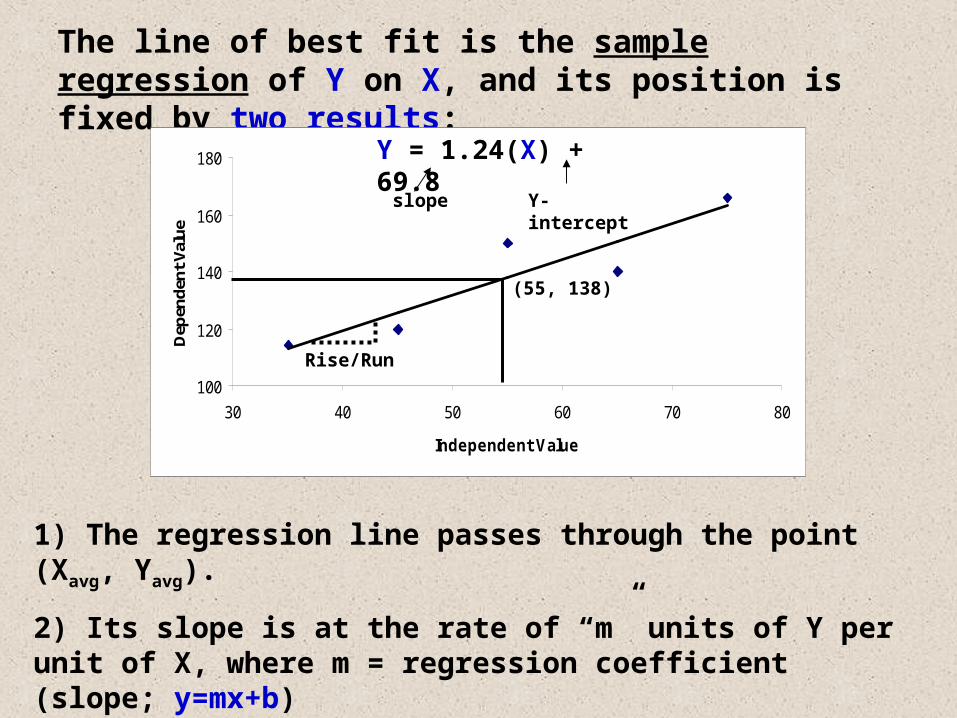
1) The regression line passes through the point (Xavg, Yavg).
2) Its slope is at the rate of “m” units of Y per unit of X, where m = regression coefficient (slope; y=mx+b)
The line of best fit is the sample regression of Y on X, and its position is fixed by two results:
100
120
140
160
180
30 40 50 60 70 80
Independent Value
Dep
end
ent
Val
ue
(55, 138)
Y = 1.24(X) + 69.8
slope Y-intercept
Rise/Run

Testing the Regression Line for Significance
• An F-test is used based on Model, Error, and Total SOS.– Very similar to ANOVA
• Basically, we are testing if the regression line has a significantly different slope than a line formed by using just Y_avg.– If there is no difference, then that means that Y
does not change as X changes (stays around the average value)
• To begin, we must first find the regression line that has the smallest Error SOS.

100
120
140
160
180
30 40 50 60 70 80
Independent Value
Dep
end
ent
Val
ue
Error SOSThe regression line should pass through the overall average with a slope that has the smallest Error SOS (Error SOS = the distance between each point and predicted line: gives an index of the variability of the data points around the predicted line).
overall average is the pivot point
55
138

For each X, we can predict Y:Y = 1.24(X) + 69.8
X Y_Actual Y_Pred
SOSErro
r
35 114 113.2 0.64
45 120 125.6 31.36
55 150 138 144
65 140 150.4 108.16
75 166 162.8 10.24
294.4
Error SOS is calculated as the sum of (YActual – YPredicted)2
This gives us an index of how scattered the actual observations are around the predicted line. The more scattered the points, the larger the Error SOS will be. This is like analysis of variance, except we are using the predicted line instead of the mean value.
100
120
140
160
180
30 40 50 60 70 80
Independent Value

Total SOS• Calculated as the sum of (Y – Yavg)2
• Gives us an index of how scattered our data set is around the overall Y average.
100
120
140
160
180
30 40 50 60 70 80
Independent Value
Dep
end
ent
Val
ue
Overall Y average
Regression line not shown

X Y_ActualY
Average SOSTotal
35 114 138 576
45 120 138 324
55 150 138 144
65 140 138 4
75 166 138 784
1832
Total SOS gives us an index of how scattered the data points are around the overall average. This is calculated the same way for a single treatment in ANOVA.
What happens to Total SOS when all of the points are close to the overall average? What happens when the points form a non-horizontal linear trend?

Model SOS• Calculated as the Sum of (YPredicted – Yavg)2
• Gives us an index of how far all of the predicted values are from the overall average.
100
120
140
160
180
30 40 50 60 70 80
Independent Value
Dep
end
ent
Val
ue Distance between
predicted Y and overall mean

Model SOS• Gives us an index of how far away the predicted
values are from the overall average value
• What happens to Model SOS when all of the predicted values are close to the average value?
X Y_Pred
Y Avera
ge SOSModel
35 113.2 138 615.04
45 125.6 138 153.76
55 138 138 0
65 150.4 138 153.76
75 162.8 138 615.04
1537.6

All Together Now!!X Y_Actual Y_Pred SOSError Y_Avg SOSTotal SOSModel
35 114 113.2 0.64 138 576 615.04
45 120 125.6 31.36 138 324 153.76
55 150 138 144 138 144 0
65 140 150.4 108.16 138 4 153.76
75 166 162.8 10.24 138 784 615.04
294.4 1832 1537.6
SOSError = (Y_Actual – Y_Pred)2
SOSTotal = (Y_Actual –Y_ Avg) 2
SOSModel = (Y_Pred – Y_Avg) 2

Using SOS to Assess Regression Line
• Model SOS gives us an index on how ‘different’ the predicted values are from the average values.– Bigger Model SOS = more different– Tells us how different a sloped line is from a line
made up only of Y_avg.– Remember, the regression line will pass through the
overall average point.
• Error SOS gives us an index of how different the predicted values are from the actual values– More variability = larger Error SOS = large distance
between predicted and actual values

Magic of the F-test• The ratio of Model SOS to Error SOS (Model SOS divided
by Error SOS) gives us an overall index (the F statistic) used to indicate the relative ‘difference’ between the regression line and a line with slope of zero (all values = Y_avg.– A large Model SOS and small Error SOS = a large F statistic. Why
does this indicate a significant difference?– A small Model SOS and a large Error SOS = a small F statistic. Why
does this indicate no significant difference??
• Based on sample size and alpha level (P-value), each F statistic has an associated P-value.– P < 0.05 (Large F statistic) there is a significant difference between
the regression line a the Y_avg line.– P ≥ 0.05 (Small F statistic) there is NO significant difference between
the regression line a the Y_avg line.

100
120
140
160
180
30 40 50 60 70 80
Independent Value
Dep
end
ent
Val
ue
Mean Model SOS Mean Error SOS
100
120
140
160
180
30 40 50 60 70 80Independent Value
Dep
end
ent
Val
ue
Basically, this is an index that tells us how different the regression line is from Y_avg, and the scatter of the data around the predicted values.
= F

Correlation (r):Another measure of the mutual linear relationship between two variables.• ‘r’ is a pure number without units or dimensions• ‘r’ is always between –1 and 1• Positive values indicate that y increases when x does and
negative values indicate that y decreases when x increases.– What does r = 0 mean?
• ‘r’ is a measure of intensity of association observed between x and y.– ‘r’ does not predict – only describes associations
between variables

100
120
140
160
180
30 40 50 60 70 80
Inpendent Variable
Dep
end
ent
Var
iab
le
100
120
140
160
180
30 40 50 60 70 80
Independent Variable
Dep
end
ent
Var
iab
le
100
120
140
160
180
30 40 50 60 70 80
Independent Variable
Dep
end
ent
Var
iab
le
r > 0
r < 0
r = 0r is also called Pearson’s correlation coefficient.

R-square• If we square r, we get rid of the negative
value if it is negative) and we get an index of how close the data points are to the regression line.
• Allows us to decide how much confidence we have in making a prediction based on our model.
• Is calculated as Model SOS / Total SOS

r2 = Model SOS / Total SOS
100
120
140
160
180
30 40 50 60 70 80
Independent Value
Dep
ende
nt V
alue
= Model SOS
= Total SOS

100
120
140
160
180
30 40 50 60 70 80
Independent Value
Dep
ende
nt V
alue
= Model SOS
= Total SOS
R2 = 0.0144
0
0.2
0.4
0.6
0.8
1
1.2
0 10 20 30 40 50
r2 = Model SOS / Total SOS
numerator/denominator
Small numerator Big denominator
R2 = 0.8393

R-square and Prediction Confidence
R2 = 0.0144
0
0.2
0.4
0.6
0.8
1
1.2
0 10 20 30 40 50 60
R2 = 0.5537
0
0.2
0.4
0.6
0.8
1
1.2
0 10 20 30 40 50 60
R2 = 0.7605
0
0.2
0.4
0.6
0.8
1
1.2
0 10 20 30 40 50 60
R2 = 0.9683
0
0.2
0.4
0.6
0.8
1
1.2
0 10 20 30 40 50 60

Finally……..
• If we have a significant relationship (based on the p-value), we can use the r-square value to judge how sure we are in making a prediction.